Embed Size (px)
Citation preview

By: Rithik Kapoor

Data handling is the way in which Data can be represented graphically to give a clear idea of what it represents. It is easier to interpret and organize data using pictorial representation.
Data handling includes bar graph, pictograph and tally marks.

It is the way of representing data visually. Bars are of uniform width and can be drawn horizontally or vertically with equal spacing between them. The length of each bar represents the given number frequency.

1.Y-axis
2.X-axis
4.scale
3.bars
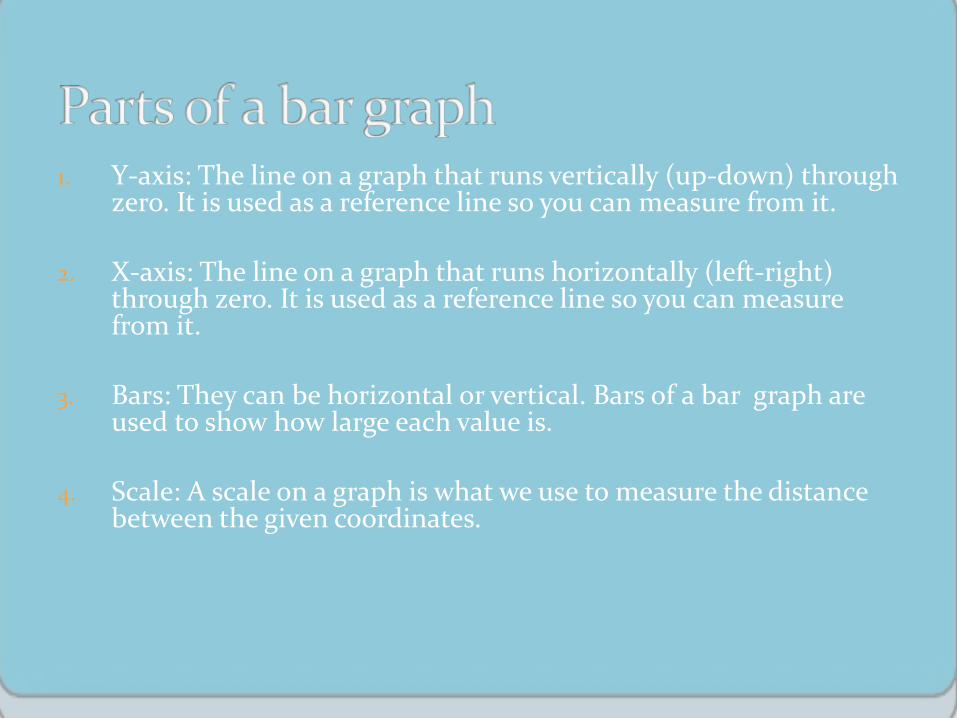
1. Y-axis: The line on a graph that runs vertically (up-down) through zero. It is used as a reference line so you can measure from it.
2. X-axis: The line on a graph that runs horizontally (left-right) through zero. It is used as a reference line so you can measure from it.
3. Bars: They can be horizontal or vertical. Bars of a bar graph are used to show how large each value is.
4. Scale: A scale on a graph is what we use to measure the distance between the given coordinates.

Sweets Sold on a Monday
0
2
4
6
8
10
12
14
16
Toffee
Crisp
Snickers Mars Twix Bounty Kitkat
Sweets
Nu
mb
er
What is the most popular sweet bought on Mondays?
Mars
It is easy to answerthis question from a
graph.
There is only oneset of data on this
graph.
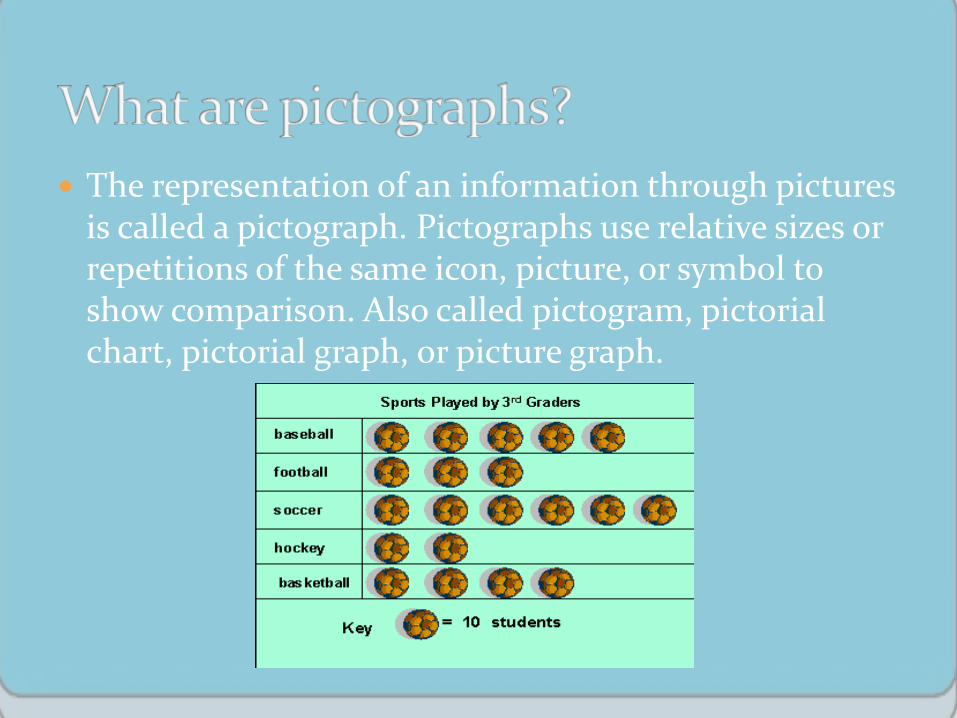
The representation of an information through pictures is called a pictograph. Pictographs use relative sizes or repetitions of the same icon, picture, or symbol to show comparison. Also called pictogram, pictorial chart, pictorial graph, or picture graph.

Badgers
Tigers
Peacocks
Elephants
Pigs
Spiders
Represents two booksExample of pictographs

A method of counting frequencies, according to some classification, in a set of data. For ease of counting, every fifth observation is represented by a diagonal line crossing the previous four to make a five-barred gate. Tally charts are often used with grouped observations

Reading Group Number of books Read Frequency
Badgers
Tigers
Peacocks
Elephants
Pigs
Spiders
Solved questions-
16
14
23
4
2
13

Key:1 picture = 10 people
How many children walk to school? 65(6 x 10) + 5 =

Ekta is asked to collect data for size of shoes of students in her Class VI. Her finding are recorded in the manner shown below :
Ekta prepared a table using tally marks.
(i) the size of shoes worn by the maximum number of students.
(ii) the size of shoes worn by the minimum number of students.
6
6
8
8

Read the adjoining bar graph showing the number of students in a particular class of a school.
a) What is the scale of this graph?
b) How many new students are added every year?
c) Is the number of students in the year 2003 twice that in the year 2000?
1 unit length=10 students
1 unit length = 10 students
10
10 students
30
60
yes