Embed Size (px)
Citation preview

1
Content Analytics
Prepared by: KRC Research
January 25, 2016
2
Meet Today’s
Presenters
Bradley Honan CEO
(212) 537-8743
Kristin Hooper Vice President
(202) 585-2918
2

3
What
We
Do
WE HELP ACHIEVE STRATEGIC OUTCOMES INCLUDING…
Measuring success
Driving headlines
Enhancing messaging strategies
Developing new business
Understanding key audiences
Optimizing brand or processes
AND APPLYING ANALYTICAL
TOOLS SUCH AS…
Audience segmentation
Benchmarking and tracking
Advanced statistical analysis
Social media analytics
Strategy sessions
Messaging summits
USING INSIGHT COLLECTION
METHODS LIKE…
Phone or online surveys
In-depth interviews
Focus groups
Intercept interviews
Ethnographies
Online boards and communities
AMONG A VAST ARRAY OF
AUDIENCES…
Policy influencers
Millennial moms
Medical professionals
Conference attendees
Church leaders
…and countless others
3

5
TODAY’S AGENDA
This is what we want to
share with you today.
Current State of Play
Our Philosophy
Case Studies
Q&A
5 5

6
Current
Realities
6

7
The Engagement Era
AND IT’S FUELING SALES &
PRODUCT CHOICES
Social and Digital content can be vital
fuel, a force field that creates a certain
gravitational pull, drawing
customers, prospects, and
stakeholders in to join and engage
with your brand, product or service in
new and interesting ways.
But what content is the right content and why?
Content marketing is mission-
critical because people are actively
searching for insights and
information in all different formats.
And if a financial-services provider
or any services company can
provide the most compelling
content, they can build a
relationship before they even try
to sell anything.
– Chris Moloney, Former CMO,
Wells Fargo
“
” 7

8
Listening and monitoring tools
capacity to uncover insights are
limited to counting & aggregating: • Likes
• Mentions
• Retweets
• Shares
• Automated sentiment
This is typically used to spit out your top 3
performing posts
Dashboards Help Quantify, But
“Listening” & “Monitoring” Are
Not Enough
8
Actual Client Analysis

9
Automated Dashboards – Two Sides Of The Coin
What they do well . . .
Answer the WHAT
Where they fall short . . .
Not answering the WHY
Why is certain content working well
and why does other not “work”
9

10
CMOs see a Big Analytical Gap
10

11
An Analytical
Gap Exists
One of the major challenges is
monetizing the millions of visitors
we have every month to our digital
properties. We need a better
understanding of them to get
them engaged as loyal
customers.
-Peter Doucette, VP, Sales &
Marketing, The Boston Globe
“
” 11
12
An Analytical
Gap Exists
Measurement is one of the
elements many marketers miss.
They throw one big idea out there
and hope it’s going to work. That is
why effective planning is so
important–better planning to deliver
ROI by effective targeting and
eliminating the waste in marketing
spends.
Katherine Nguyen, Head Of
Marketing, AU/NZ, Acer
“
” 12

13
No GPS = No Strategic North Star
What is missing from far too
many social media campaigns
is a deep strategic approach
and roadmap for how to
develop content that drives the
most effective engagement.
13

14
So, Let’s Dive Into
What We’ve Built
14

15
Social
SANDBOX 15

16
Social SANDBOX is a fully customizable,
secure, mock interactive environment
where consumers can engage with
content while being placed in an actual
environment (e.g. Facebook, Twitter,
Website, Mobile etc…).
Engagement metrics amongst key
audience segments
Identify consumers attitudes and trends
Insight into what “content types” perform
best
Data driven content & message
optimization
Open-end verbatim from respondents
“get the why”
• Target audiences for message delivery
• Determine content, messaging, and
brand fit
Respondents are recruited into the social
SANDBOX to engage with the content
that they find most compelling. During
this process we are able to interject and
ask questions to why they took action
with a certain piece of content. The
combination of the analytics we collect
along with the primary findings accurately
tell us what content, message, and media
type will perform the best in a live
environment.
INNOVATION: Social Sandbox
WHAT IS IT? DATA EXTRACTION HOW WE DEPLOY
Learn How To Play In Your… Social Sandbox 16

17
This Tool Means We Dig
Deeper Into The Conversation
To Get To The “Why”
17
18
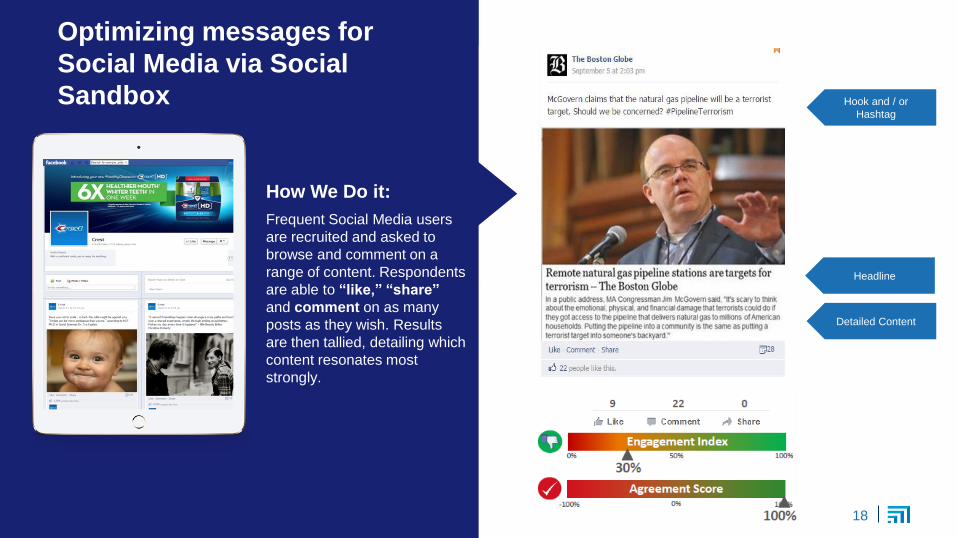
Optimizing messages for
Social Media via Social
Sandbox
How We Do it:
Frequent Social Media users
are recruited and asked to
browse and comment on a
range of content. Respondents
are able to “like,” “share”
and comment on as many
posts as they wish. Results
are then tallied, detailing which
content resonates most
strongly.
Hook and / or
Hashtag
Headline
Detailed Content
18

19
Social
Decoding
19

20
QUANTIFY
Code
Content
EXPLORE ANALYZE OPTIMIZE
Create Codebook
Create Model Optimize Outreach
Social Content Evaluation Modeling
Identify core goals
with key stakeholders
and advisors and
conduct a strategic
examination of
existing social media
content for
trends/patterns
Synthesize
Manually code all
relevant content from
each channel on each
variable from the
custom codebook
Refine
communication
strategy and
executions based on
findings and
recommendations
Create a custom
social media
codebook to capture
variables to evaluate
content on
Develop a statistical
model for each
channel to
understand the
relationship between
each variable and
outcome measure(s)

21
The Census Philosophy
The U.S. Constitution empowers the
Congress to carry out the US Census
(Article I, Section 2).
The plan was to count every person
living in the newly created United
States of America, and to use that
count to determine representation in
the Congress. 21

22
The Pitfalls of the “Census Philosophy”
MAKE CODING ERRORS
Even with algorithms learning over time,
social monitoring platforms consistently
make coding errors.
DON’T UNDERSTAND LANGUAGE
NUANCES
Sentiment coding is pretty limited and the
analysis superficial:
“This pizza is hot” (temperature)
“This pizza is hot” (spicy)
“Pizza is hot again” (trendy)
22
We love ‘em, but computers . . .

23 23
Statistical Sampling 101

24
Case Study: Telecom Company
Optimizing Digital News Center Content
A major telecom company wanted to assess and improve the type of
content on their News Center to increase page views and reposition
themselves as a technology thought leader rather than just a telecom
company.
Our Approach:
Instead of conducting a head-to-head post comparison based on # of
page views, KRC developed a predictive model to understand what
specific components of posts most drive engagement to provide the
company with prescriptive, actionable guidance on how to continually
optimize their communications strategy moving forward.
To accomplish this, KRC:
1. Conducted a high-level audit of the News Center Content.
2. Created a coding framework based on a significant number of
variables including but not limited to topic, intended audience,
post timing and tone.
3. Coded over 235 pieces of unique content and designed a
predictive model based on these inputs.
4. Analyzed the results and developed a strategic roadmap for
News Center communications moving forward. 24
HIGHER PAGE VIEWS
LOWER PAGE VIEWS
Current Events
Smartphones
Title or Summary
Tweeted
Key Insight: Why does certain content perform better?

25
Social Media Audit
KRC Research conducted a comprehensive audit of a trade group’s communication to the industry
they represent, via both traditional and social channels.
Posts that include a certain
variable in the content lead to a
29% increase in engagement
rate compared to those that do
not include this variable.
Engagement rate drops by
22% for posts that include a
certain variable compared to
those that do not have this
variable.
Content posted on their Twitter, LinkedIn
Page and LinkedIn Group from April
2014 - March 2015 was individually
coded for over 20 custom variables.
“Lifts” and “Drops” indicate coding
variables that had the strongest positive
or negative correlations to engagement
rate.
“Lifts” and “Drops” indicate coding
variables that had the strongest positive
or negative correlations to engagement
rate.
+29%
-22%

26
National Pork Board: The State of American #foodporn
From this . . . to this . . . to this . . .
26
27
Thank you! Now time for Q & A
Bradley Honan CEO
(212) 537-8743
Kristin Hooper Vice President
(202) 585-2918
KRC Research
733 10th Street NW
Washington, DC 20001
(202) 585-2918
www.krcresearch.com
@krcresearch | #krcfindings
27