Embed Size (px)
Citation preview


BEACONECONOMICS


5
10
15
20
25
Perc
enta
ge, S
AQ1-82 Q3-86 Q1-91 Q3-95 Q1-00 Q3-04 Q1-09
Source: Property & Portfolio Research
Los Angeles (MD), Q1-82 to Q4-09
Office Vacancy Rates
10
15
20
25
30
Gro
ss D
olla
r pe
r Sq
uare
Foo
t per
Yea
r
Q1-90 Q2-93 Q3-96 Q4-99 Q1-03 Q2-06 Q3-09
Los Angeles (MD) Inland Empire (MSA)
Orange County (MD) San Diego (MSA)
*These data are seasonally adjusted and smoothed
Source: Property & Portfolio Research
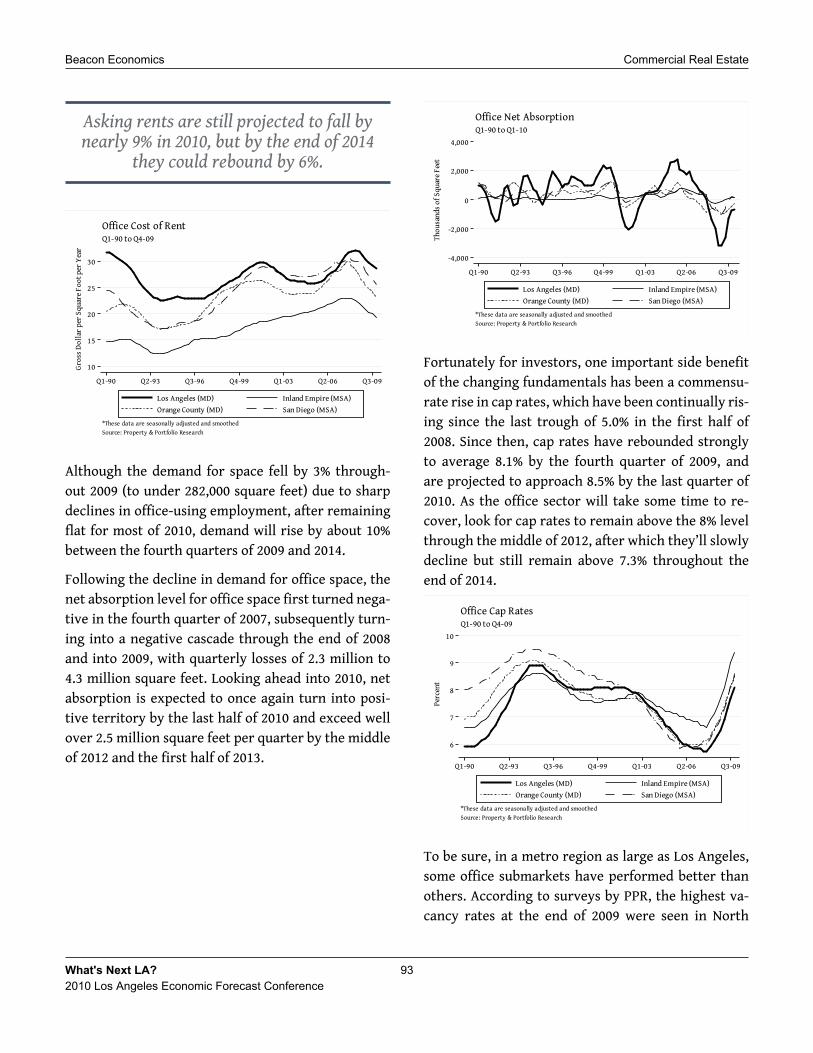
Q1-90 to Q4-09
Office Cost of Rent
-4,000
-2,000
0
2,000
4,000
Thou
sand
s of
Squ
are
Feet
Q1-90 Q2-93 Q3-96 Q4-99 Q1-03 Q2-06 Q3-09
Los Angeles (MD) Inland Empire (MSA)
Orange County (MD) San Diego (MSA)
*These data are seasonally adjusted and smoothed
Source: Property & Portfolio Research
Q1-90 to Q1-10
Office Net Absorption
6
7
8
9
10
Perc
ent
Q1-90 Q2-93 Q3-96 Q4-99 Q1-03 Q2-06 Q3-09
Los Angeles (MD) Inland Empire (MSA)
Orange County (MD) San Diego (MSA)
*These data are seasonally adjusted and smoothed
Source: Property & Portfolio Research
Q1-90 to Q4-09
Office Cap Rates

17.7 27.13 !1.4 59, 335 0 !23815.0 20.98 !3.1 29, 488 0 !3018.3 23.06 !1.5 18, 461 0 !3719.5 26.17 !1.8 41, 377 100 !25019.1 23.79 !0.1 57, 437 0 !8617.4 29.13 !1.5 40, 495 0 !12219.7 25.78 !2.1 15, 194 0 10616.4 39.13 !4.1 80, 226 325 !12817.7 28.54 !2.1 342, 013 425 !784
0
5
10
15
20
25
Perc
ent
Q1-90 Q2-93 Q3-96 Q4-99 Q1-03 Q2-06 Q3-09
Los Angeles (MD) Inland Empire (MSA)
Orange County (MD) San Diego (MSA)
*These data are seasonally adjusted and smoothed
Source: Property & Portfolio Research
Q1-90 to Q4-09
Retail Vacancy Rate

10
15
20
25
30
Gro
ss D
olla
r pe
r Sq
uare
Foo
t per
Yea
r
Q1-90 Q2-93 Q3-96 Q4-99 Q1-03 Q2-06 Q3-09
Los Angeles (MD) Inland Empire (MSA)
Orange County (MD) San Diego (MSA)
*These data are seasonally adjusted and smoothed
Source: Property & Portfolio Research
Q1-90 to Q4-09
Retail Cost of Rent
-4,000
-2,000
0
2,000
4,000
Thou
sand
s of
Squ
are
Feet
Q1-90 Q2-93 Q3-96 Q4-99 Q1-03 Q2-06 Q3-09
Los Angeles (MD) Inland Empire (MSA)
Orange County (MD) San Diego (MSA)
*These data are seasonally adjusted and smoothed
Source: Property & Portfolio Research
Q1-90 to Q4-09
Retail Net Absorption
5
6
7
8
9
Perc
ent
Q1-90 Q2-93 Q3-96 Q4-99 Q1-03 Q2-06 Q3-09
Los Angeles (MD) Inland Empire (MSA)
Orange County (MD) San Diego (MSA)
*These data are seasonally adjusted and smoothed
Source: Property & Portfolio Research
Q1-90 to Q4-09
Retail Cap Rates

0
5
10
15
20
Perc
ent
Q1-90 Q2-93 Q3-96 Q4-99 Q1-03 Q2-06 Q3-09
Los Angeles (MD) Inland Empire (MSA)
Orange County (MD) San Diego (MSA)
*These data are seasonally adjusted and smoothed
Source: Property & Portfolio Research
Q1-90 to Q4-09
Industrial Vacancy Rate
4
5
6
7
8
Trip
le N
et D
olla
r pe
r Sq
uare
Foo
t per
Yea
r
Q1-90 Q2-93 Q3-96 Q4-99 Q1-03 Q2-06 Q3-09
Los Angeles (MD) Inland Empire (MSA)
Orange County (MD) San Diego (MSA)
*These data are seasonally adjusted and smoothed
Source: Property & Portfolio Research
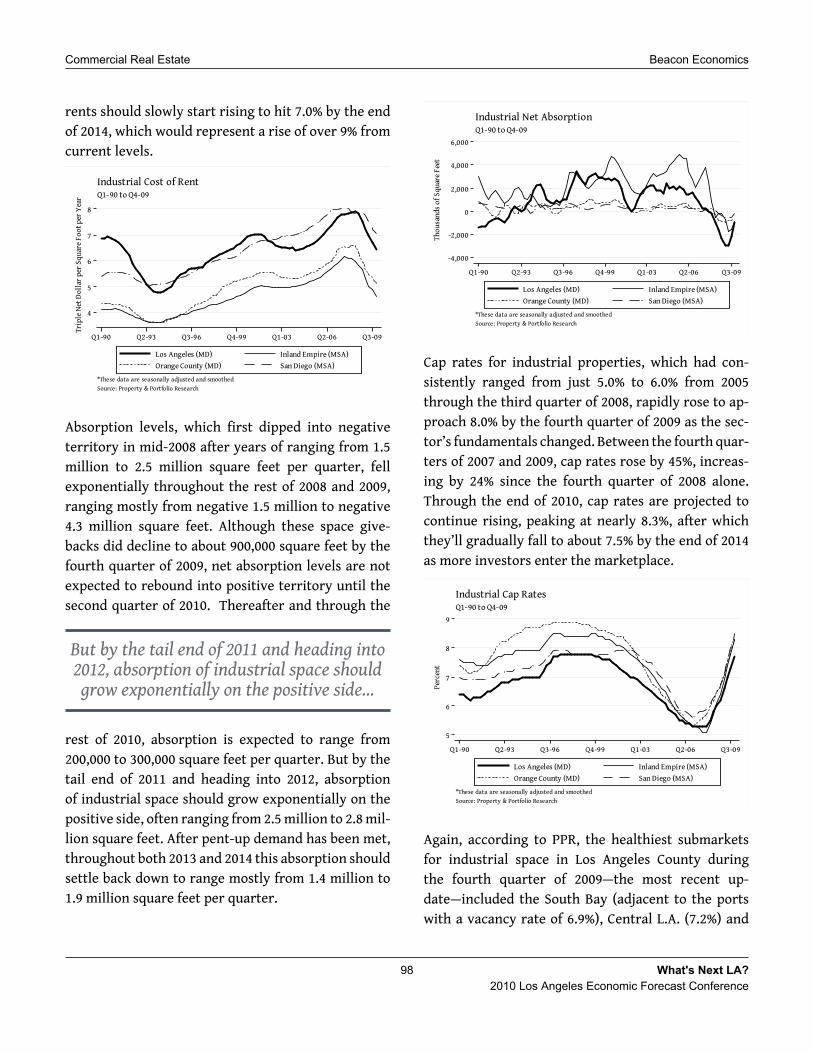
Q1-90 to Q4-09
Industrial Cost of Rent
-4,000
-2,000
0
2,000
4,000
6,000
Thou
sand
s of
Squ
are
Feet
Q1-90 Q2-93 Q3-96 Q4-99 Q1-03 Q2-06 Q3-09
Los Angeles (MD) Inland Empire (MSA)
Orange County (MD) San Diego (MSA)
*These data are seasonally adjusted and smoothed
Source: Property & Portfolio Research
Q1-90 to Q4-09
Industrial Net Absorption
5
6
7
8
9
Perc
ent
Q1-90 Q2-93 Q3-96 Q4-99 Q1-03 Q2-06 Q3-09
Los Angeles (MD) Inland Empire (MSA)
Orange County (MD) San Diego (MSA)
*These data are seasonally adjusted and smoothed
Source: Property & Portfolio Research
Q1-90 to Q4-09
Industrial Cap Rates

1, 955.8 2, 177.4 1, 687.7
105.2 105.0 30.2
210.9 228.3 61.1
127.1 116.7 46.0
647.3 493.8 171.3
775.8 687.0 445.7
19.4 8.1 5.0
502.0 476.4 197.6
4, 660.3 4, 552.4 2, 680.1
100
200
300
400
500
Mil
lion
s of
Dol
lars
(SA
)
Jan-95 Jan-97 Jan-99 Jan-01 Jan-03 Jan-05 Jan-07 Jan-09Source: Construction Industry Research Board
Los Angeles County, Jan-95 to Mar-10
Value of Total Non-Residential Permits