Embed Size (px)
Citation preview
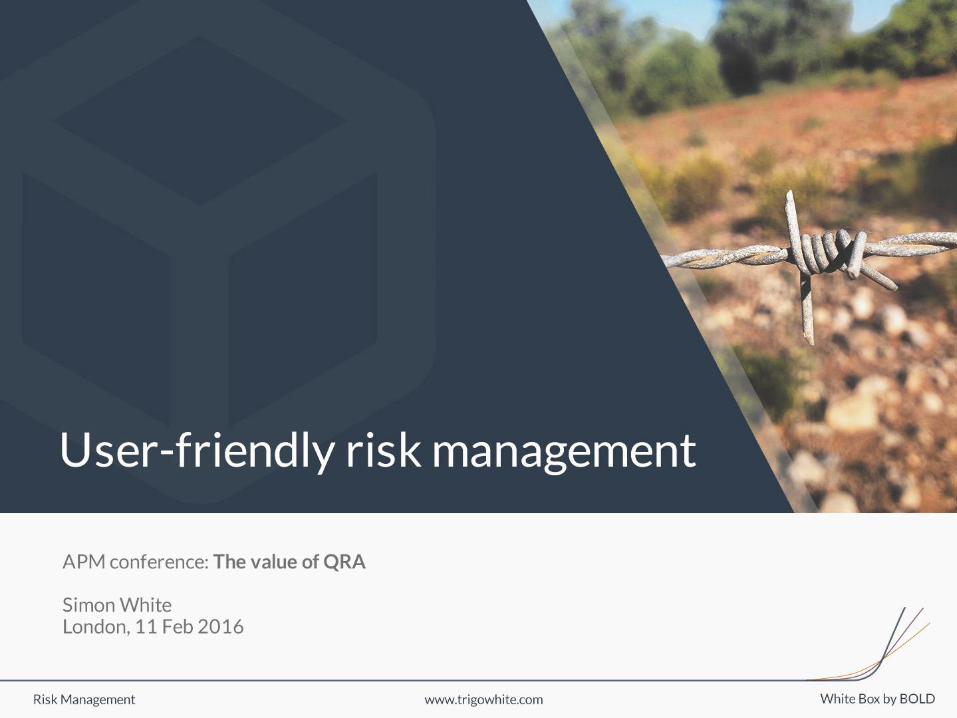
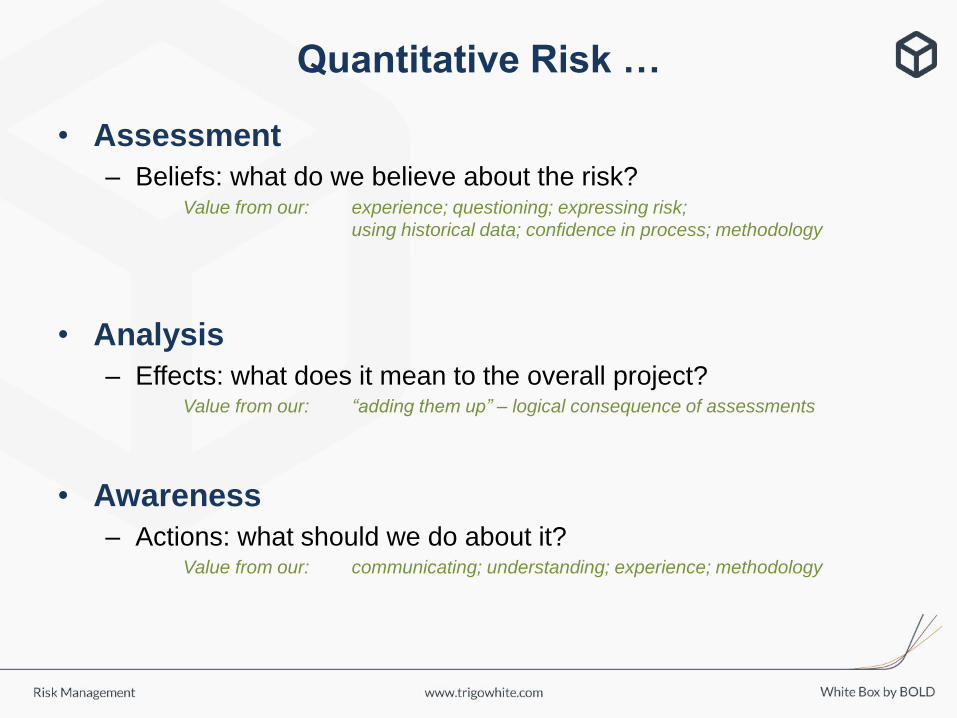
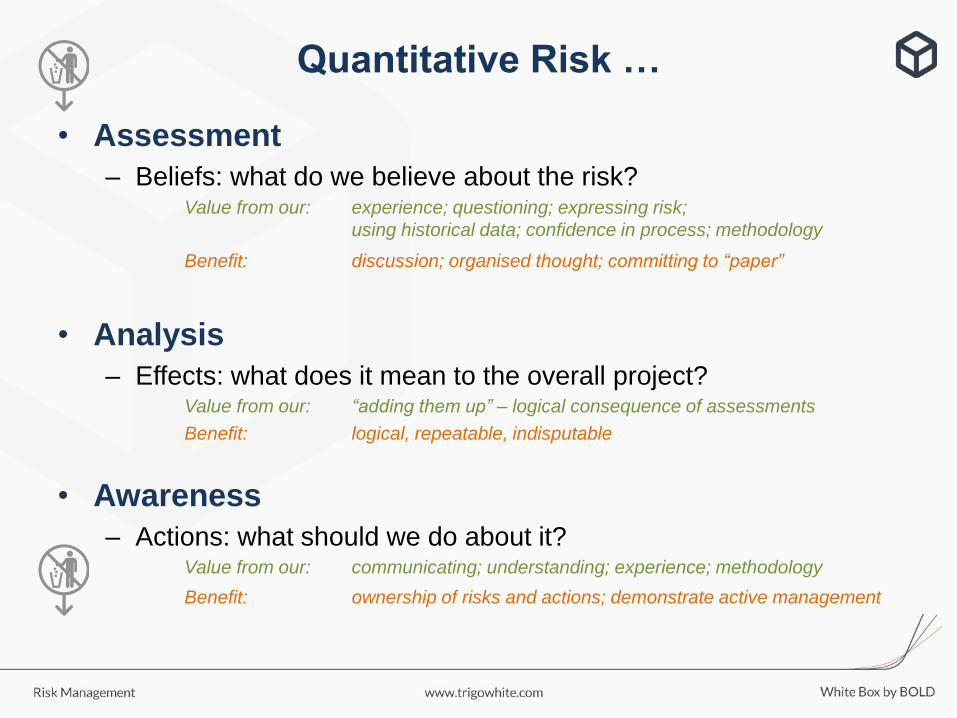
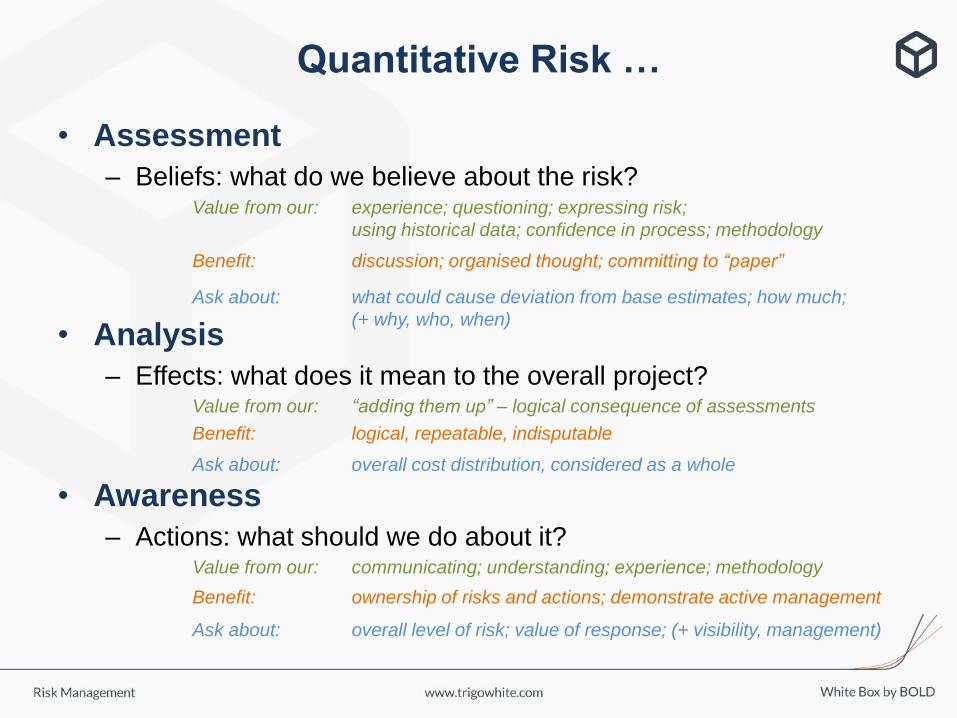
Quantitative Risk …
• Assessment
– Beliefs: what do we believe about the risk?
• Analysis
– Effects: what does it mean to the overall project?
• Awareness
– Actions: what should we do about it?
experience; questioning; expressing risk;
using historical data; confidence in process; methodology
Value from our:
“adding them up” – logical consequence of assessments Value from our:
communicating; understanding; experience; methodology Value from our:
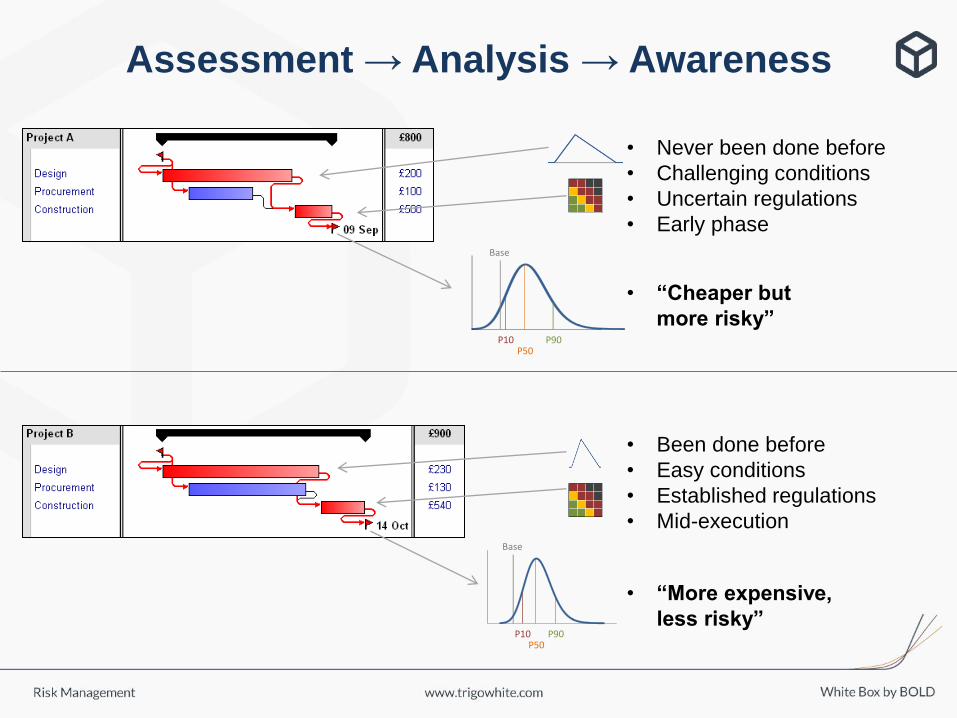
Assessment → Analysis → Awareness
• Never been done before
• Challenging conditions
• Uncertain regulations
• Early phase
• Been done before
• Easy conditions
• Established regulations
• Mid-execution
P10P50
P90
Base
P10P50
P90
Base
• “Cheaper but
more risky”
• “More expensive,
less risky”
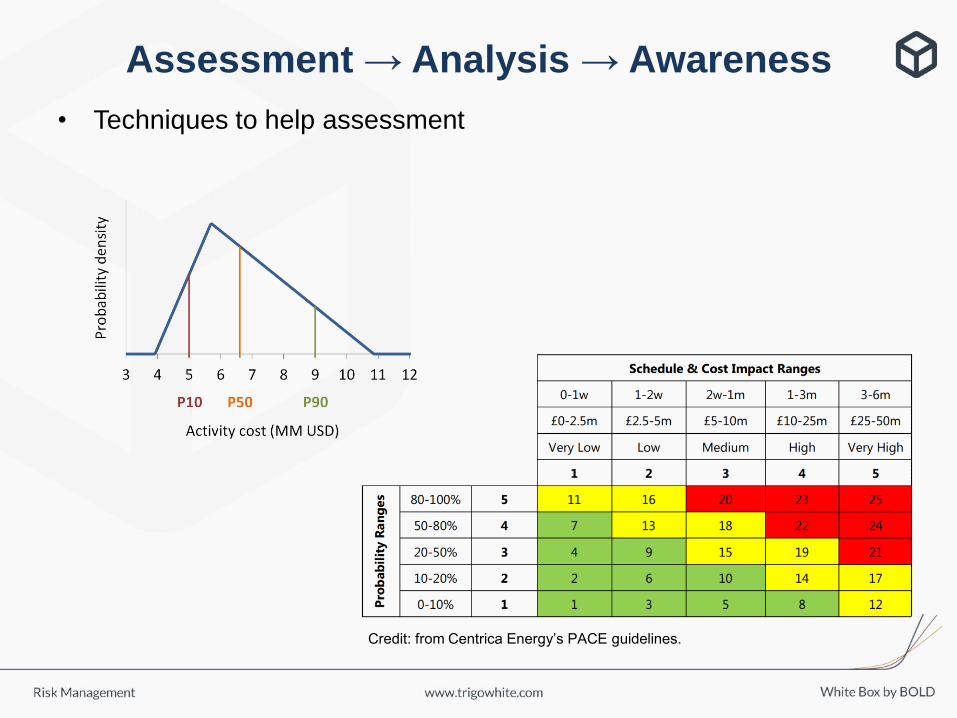
Assessment → Analysis → Awareness
• Techniques to help assessment
Credit: from Centrica Energy’s PACE guidelines.
Quantitative Risk …
• Assessment
– Beliefs: what do we believe about the risk?
• Analysis
– Effects: what does it mean to the overall project?
• Awareness
– Actions: what should we do about it?
“adding them up” – logical consequence of assessments
experience; questioning; expressing risk;
using historical data; confidence in process; methodology
communicating; understanding; experience; methodology
Value from our:
discussion; organised thought; committing to “paper” Benefit:
Value from our:
Value from our:
ownership of risks and actions; demonstrate active management Benefit:
Benefit: logical, repeatable, indisputable

Quantitative Risk …
• Given the risk as we have expressed it:
– How valuable is response x?
– How much overall contingency is likely needed?
– Where is it likely needed?
– And when?
– What’s our biggest risk at P50?
– At P90?
– What contractual incentivisations are appropriate?

Where is it likely needed?

WE DON’T KNOW
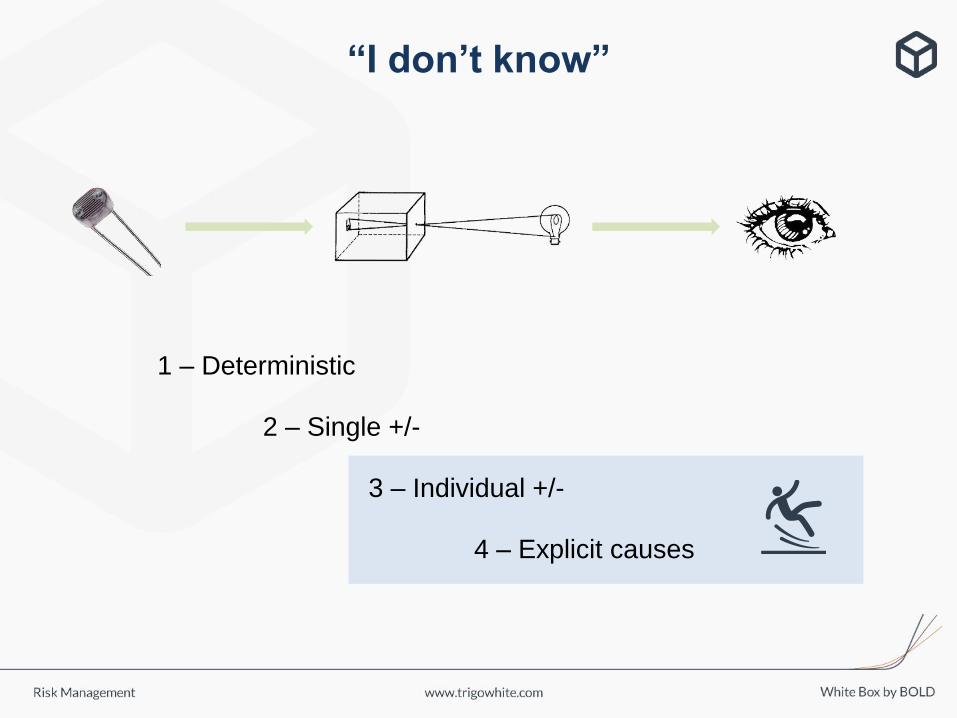
“I don’t know”
1 – Deterministic
2 – Single +/-
3 – Individual +/-
4 – Explicit causes
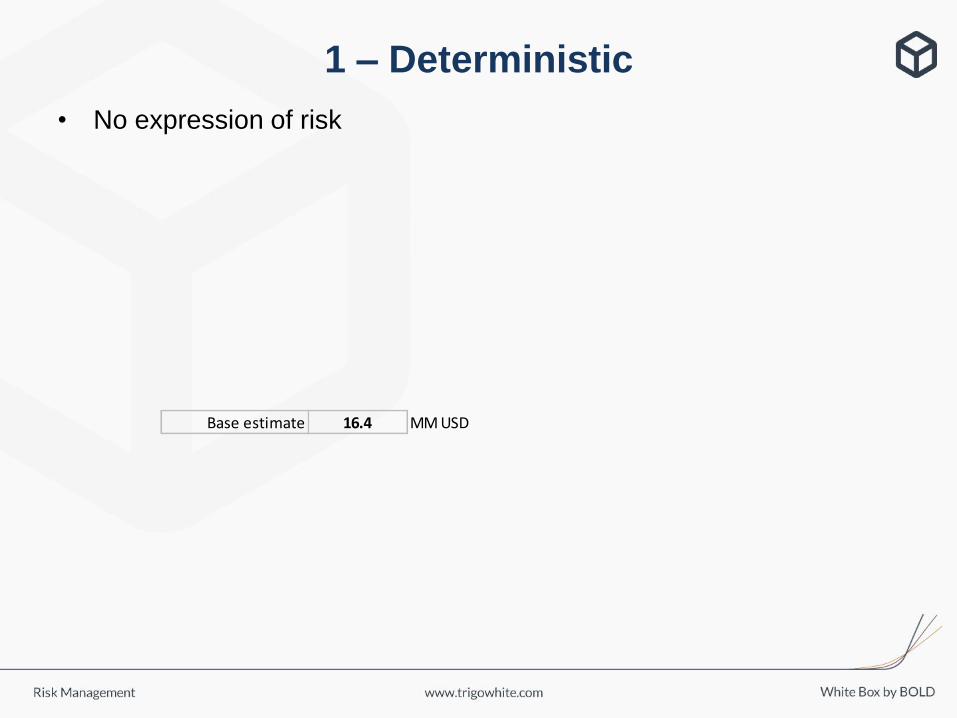
Base estimate 16.4 MM USD
1 – Deterministic
• No expression of risk
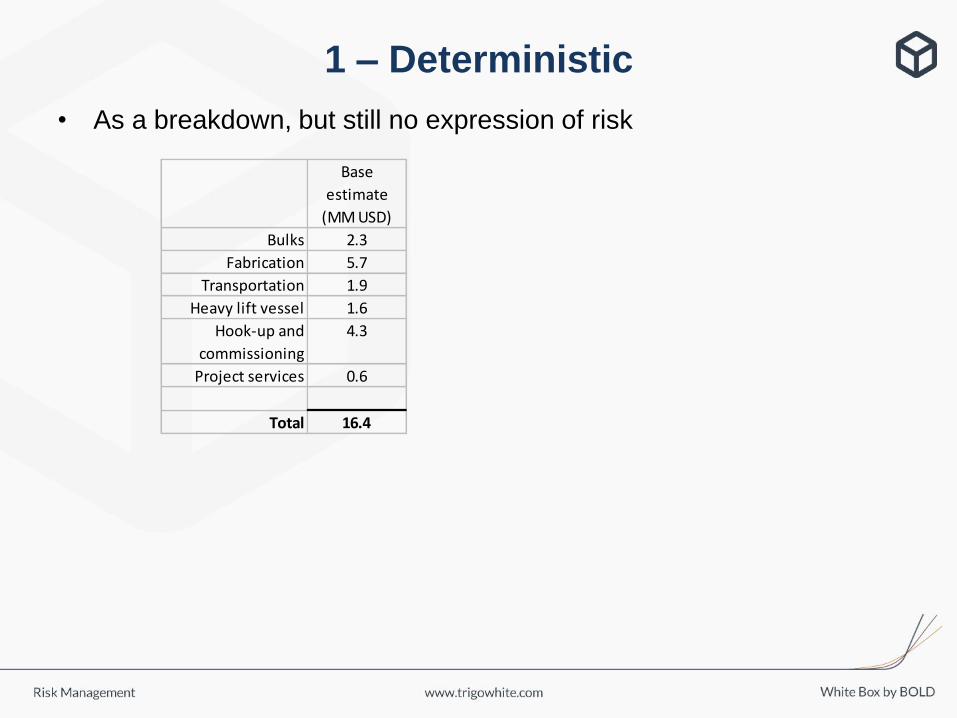
1 – Deterministic
• As a breakdown, but still no expression of risk
Base
estimate
(MM USD)
Bulks 2.3
Fabrication 5.7
Transportation 1.9
Heavy lift vessel 1.6
Hook-up and
commissioning
4.3
Project services 0.6
Total 16.4

1 – Deterministic
• Logic is important (cost and schedule)
P10 Base P90
Base estimate 12 16.4 25 MM USD
P10 P50 P90
Base
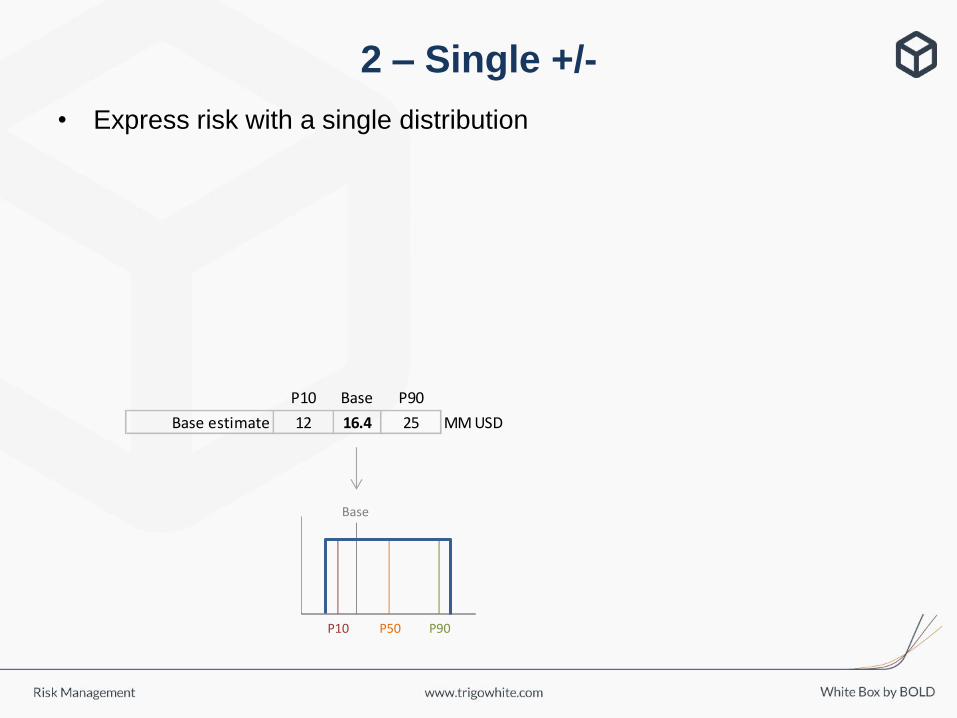
2 – Single +/-
• Express risk with a single distribution
P10 Base P90
Base estimate 12 16.4 25 MM USD
P10 P50 P90
Base
P10 Base
(MM USD)
P90
Bulks 2.3
Fabrication 5.7
Transportation 1.9
Heavy lift vessel 1.6
Hook-up and
commissioning
4.3
Project services 0.6
Total 12 16.4 25
P10 P50 P90
Base
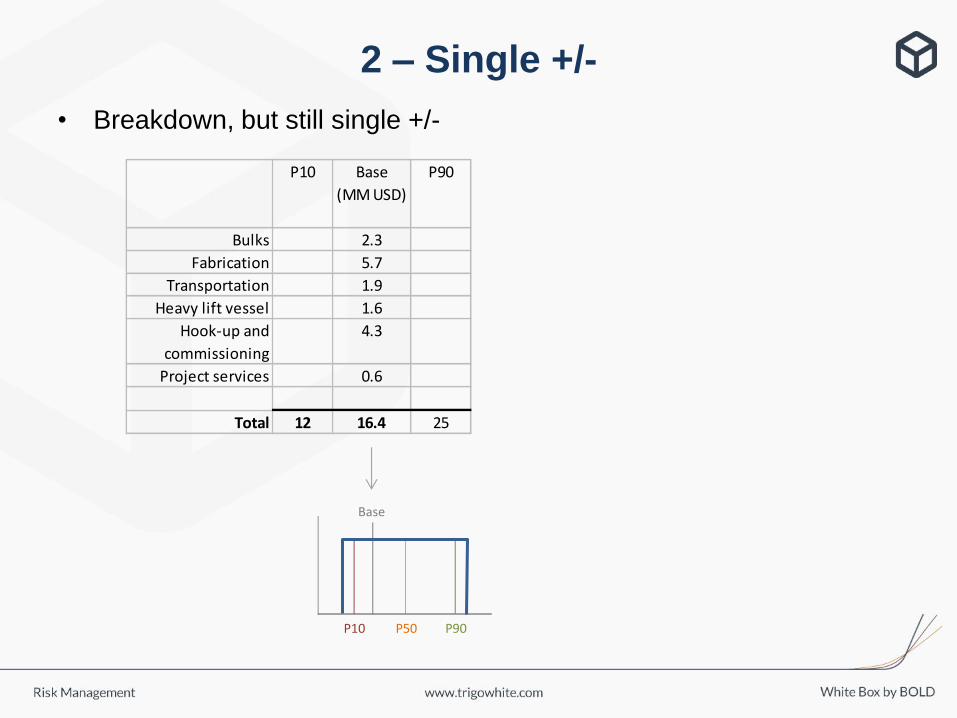
2 – Single +/-
• Breakdown, but still single +/-
P10 Base
(MM USD)
P90
Bulks 2.3
Fabrication 5.7
Transportation 1.9
Heavy lift vessel 1.6
Hook-up and
commissioning
4.3
Project services 0.6
Total 12 16.4 25
P10 P50 P90
Base
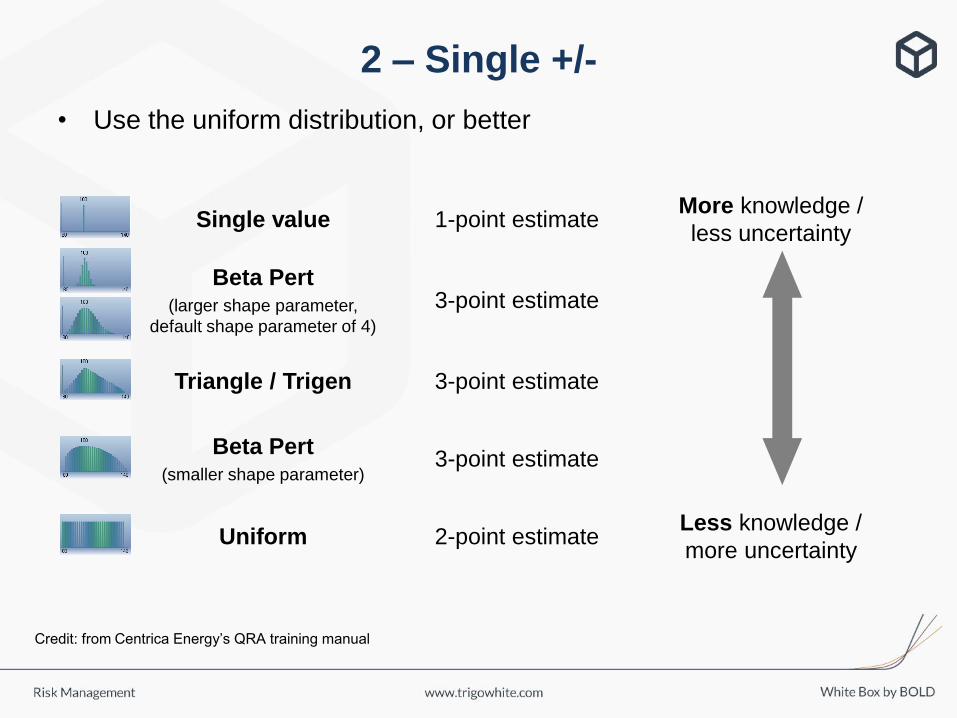
2 – Single +/-
• Use the uniform distribution, or better
Single value 1-point estimateMore knowledge /
less uncertainty
Beta Pert(larger shape parameter,
default shape parameter of 4)
3-point estimate
Triangle / Trigen 3-point estimate
Beta Pert(smaller shape parameter)
3-point estimate
Uniform 2-point estimateLess knowledge /
more uncertainty
Credit: from Centrica Energy’s QRA training manual
P10 Base
(MM USD)
P90
Bulks 1.7 2.3 3.5
Fabrication 4.2 5.7 8.7
Transportation 1.4 1.9 2.9
Heavy lift vessel 1.2 1.6 2.4
Hook-up and
commissioning
3.1 4.3 6.6
Project services 0.4 0.6 0.9
Total 12 16.4 25
- % + %
Base
P10 P50 P90
Base
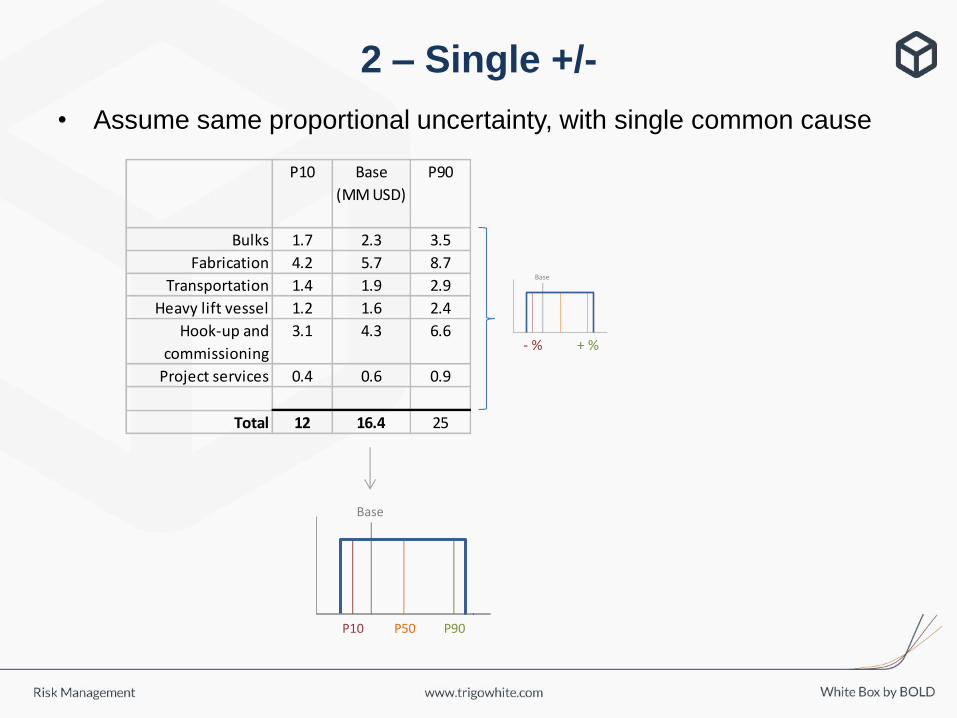
2 – Single +/-
• Assume same proportional uncertainty, with single common cause
P10 Base
(MM USD)
P90
Bulks 1.7 2.3 3.5
Fabrication 4.2 5.7 8.7
Transportation 1.4 1.9 2.9
Heavy lift vessel 1.2 1.6 2.4
Hook-up and
commissioning
3.1 4.3 6.6
Project services 0.4 0.6 0.9
Total 12 16.4 25
- % + %
Base
P10 P50 P90
Base
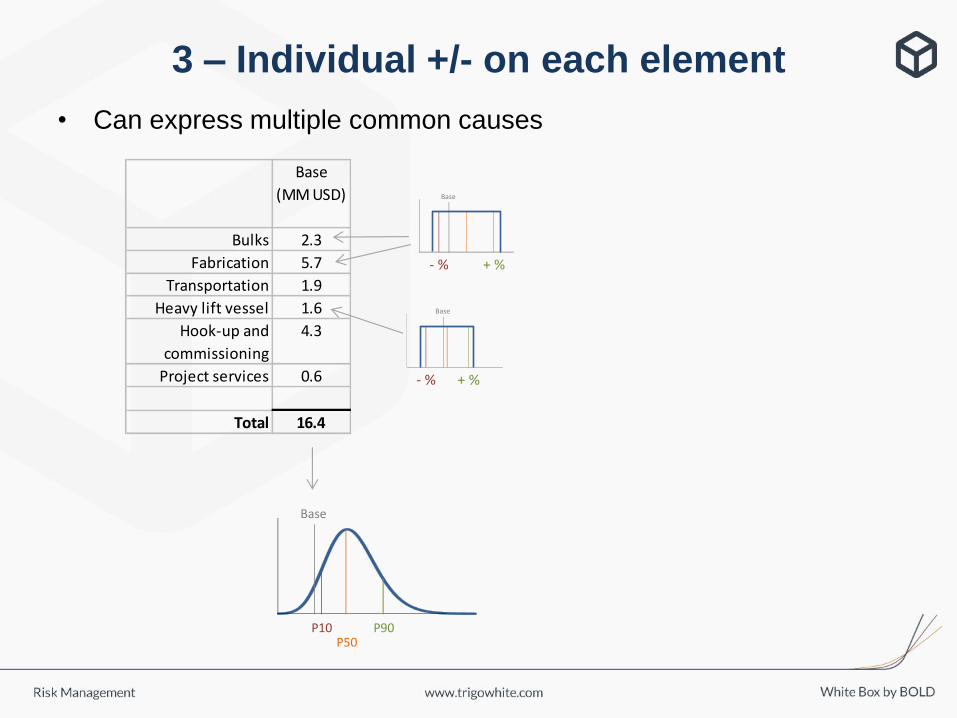
3 – Individual +/- on each element
• Can express multiple common causes
Base
(MM USD)
Bulks 2.3
Fabrication 5.7
Transportation 1.9
Heavy lift vessel 1.6
Hook-up and
commissioning
4.3
Project services 0.6
Total 16.4
- % + %
Base
- % + %
Base
P10P50
P90
Base
Base
(MM USD)
Bulks 2.3
Fabrication 5.7
Transportation 1.9
Heavy lift vessel 1.6
Hook-up and
commissioning
4.3
Project services 0.6
Total 16.4
- % + %
Base
- % + %
Base
P10P50
P90
Base
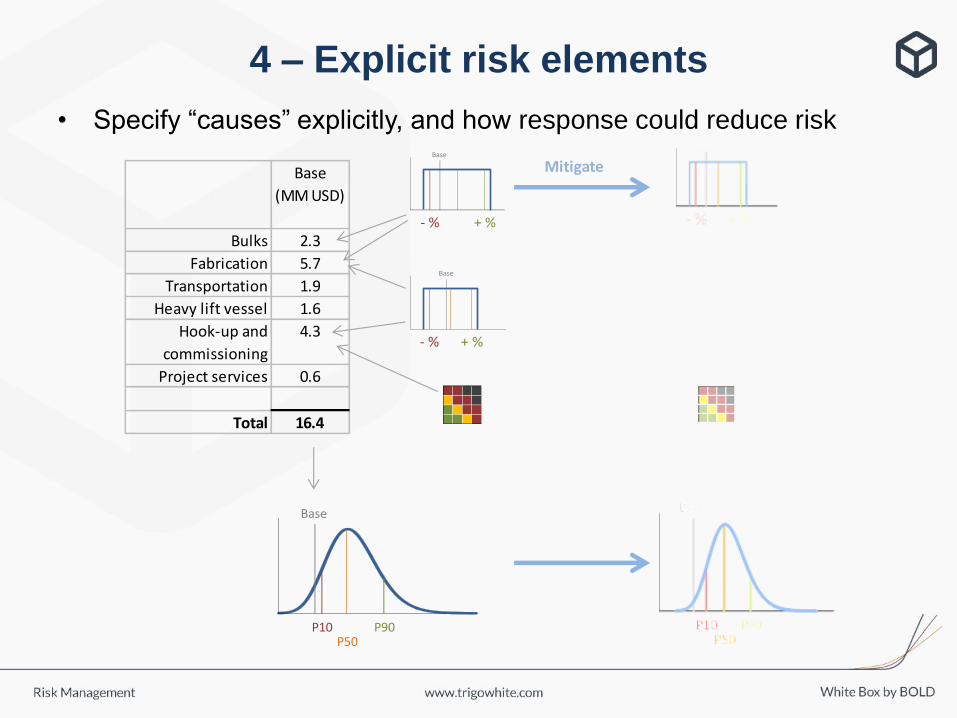
4 – Explicit risk elements
• Specify “causes” explicitly, and how response could reduce risk
Base
(MM USD)
Bulks 2.3
Fabrication 5.7
Transportation 1.9
Heavy lift vessel 1.6
Hook-up and
commissioning
4.3
Project services 0.6
Total 16.4
- % + %
Base
- % + %
Base
P10P50
P90
Base
MitigateBase
(MM USD)
Bulks 2.3
Fabrication 5.7
Transportation 1.9
Heavy lift vessel 1.6
Hook-up and
commissioning
4.3
Project services 0.6
Total 16.4
- % + %
Base
- % + %
Base
P10P50
P90
Base
Mitigate
Quantitative Risk …
• Assessment
– Beliefs: what do we believe about the risk?
• Analysis
– Effects: what does it mean to the overall project?
• Awareness
– Actions: what should we do about it?
overall cost distribution, considered as a whole
“adding them up” – logical consequence of assessments
experience; questioning; expressing risk;
using historical data; confidence in process; methodology
what could cause deviation from base estimates; how much;
(+ why, who, when)
discussion; organised thought; committing to “paper”
communicating; understanding; experience; methodology
overall level of risk; value of response; (+ visibility, management)
ownership of risks and actions; demonstrate active management
Value from our:
Ask about:
Benefit:
Ask about:
Value from our:
Ask about:
Value from our:
Benefit:
Benefit:
logical, repeatable, indisputable
“I don’t know”
• As long as we are clear about the assumptions we are making,
the QRA is useful
• QRA is challenged by challenging its assumptions
• Level of detail not so important
– The right level is where the team are thinking about the risk.

INDEPENDENCE I
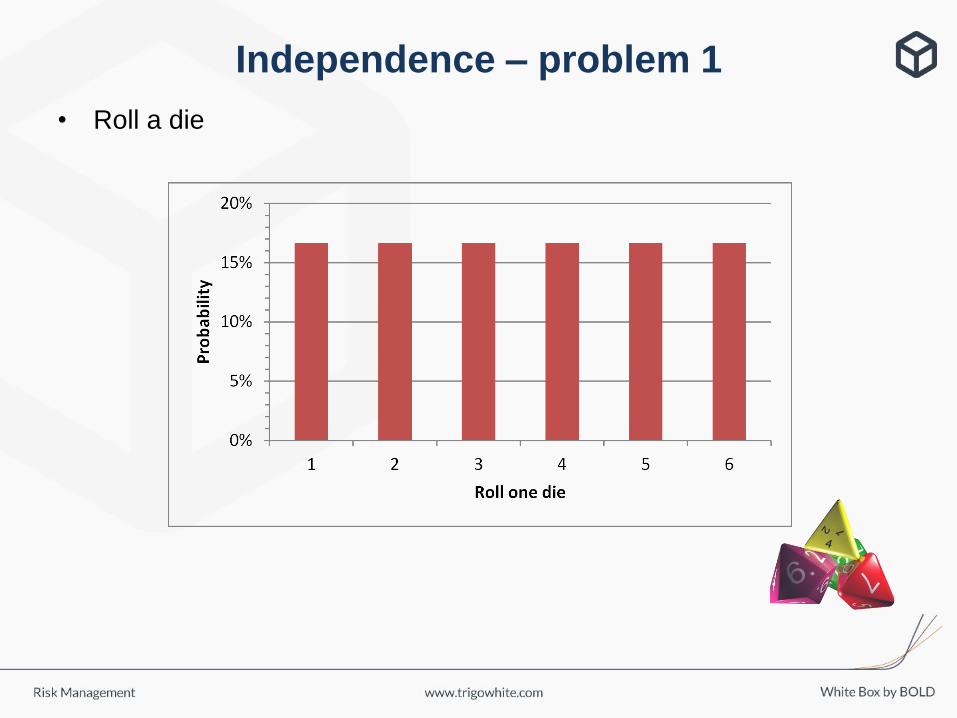
Independence – problem 1
• Roll a die
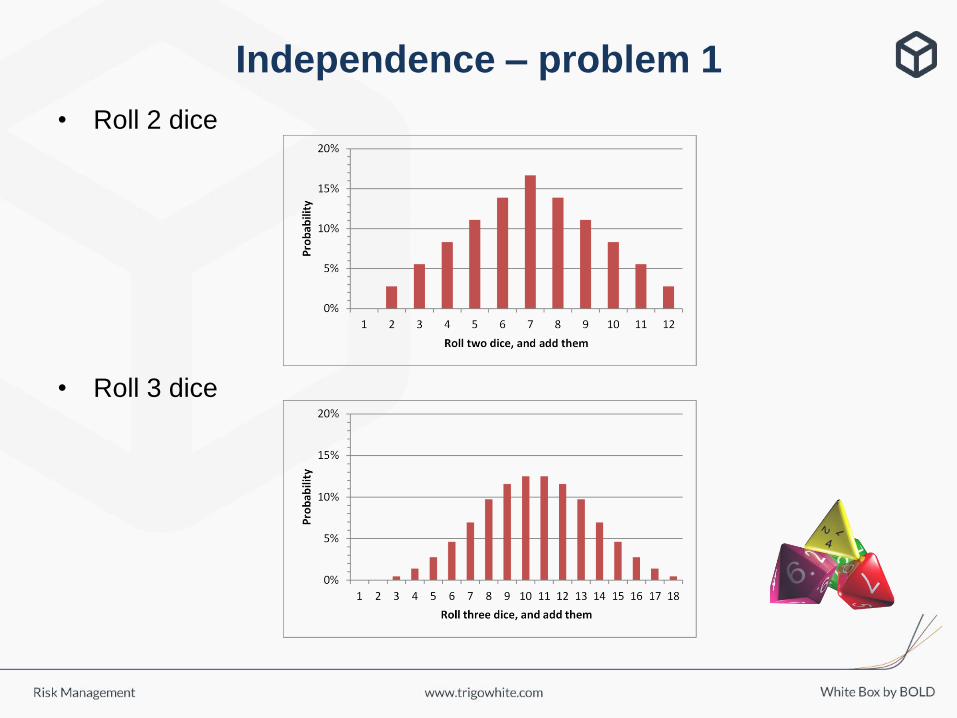
Independence – problem 1
• Roll 2 dice
• Roll 3 dice
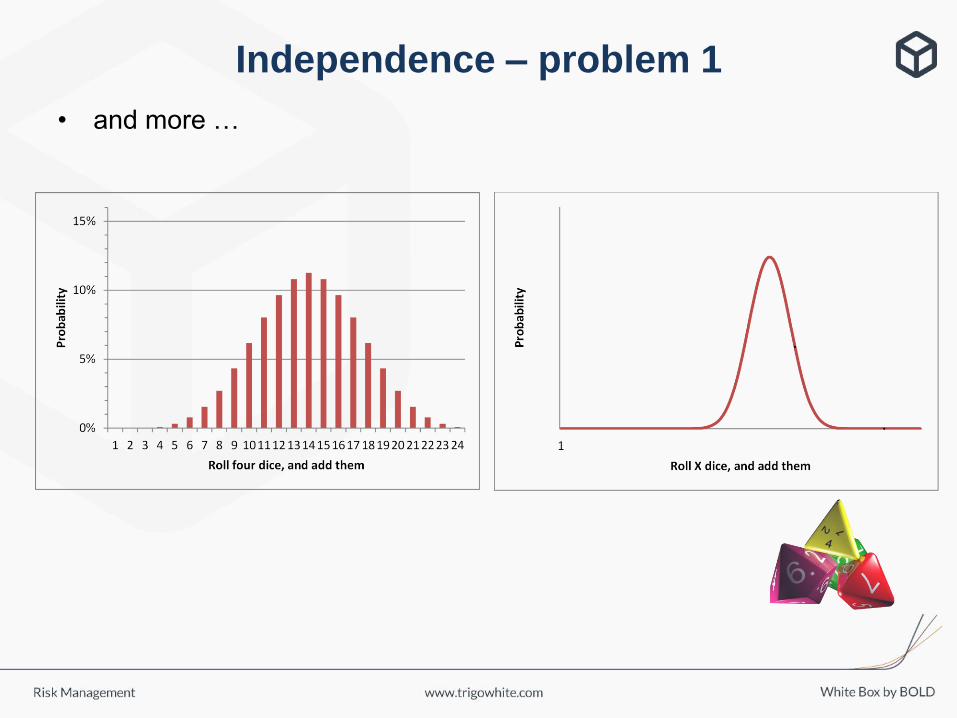
Independence – problem 1
• and more …
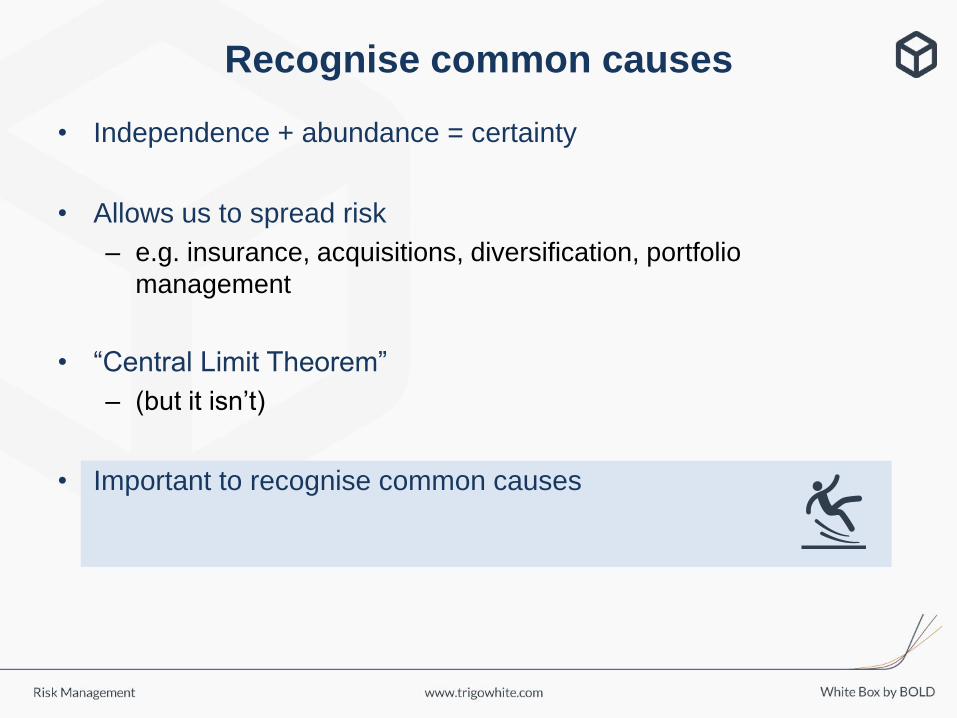
• Independence + abundance = certainty
• Allows us to spread risk
– e.g. insurance, acquisitions, diversification, portfolio
management
• “Central Limit Theorem”
– (but it isn’t)
• Important to recognise common causes
Recognise common causes

INDEPENDENCE II
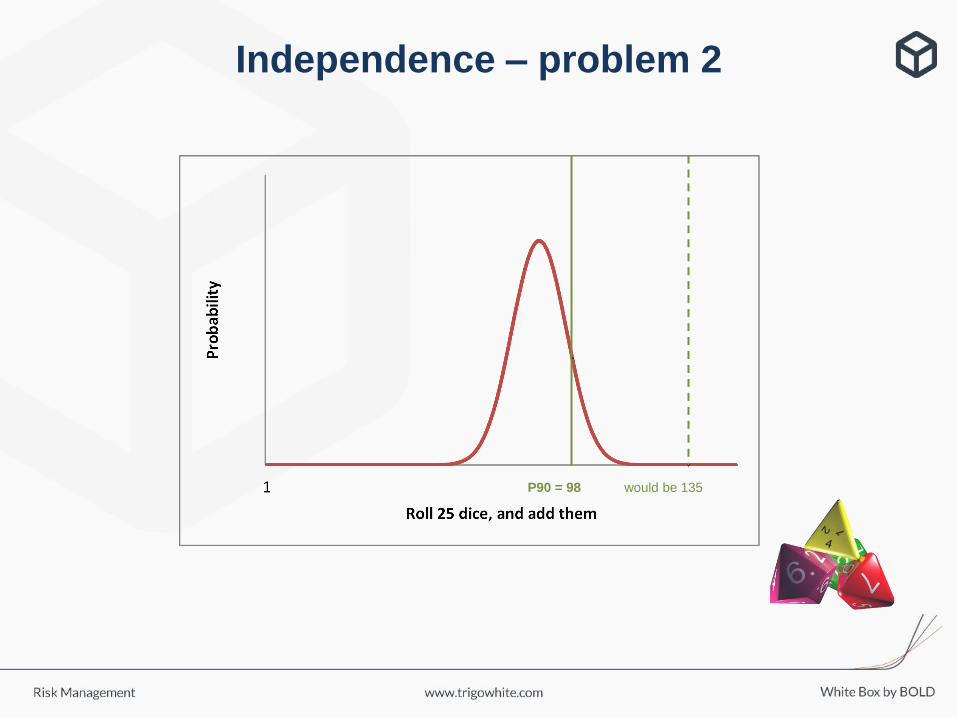
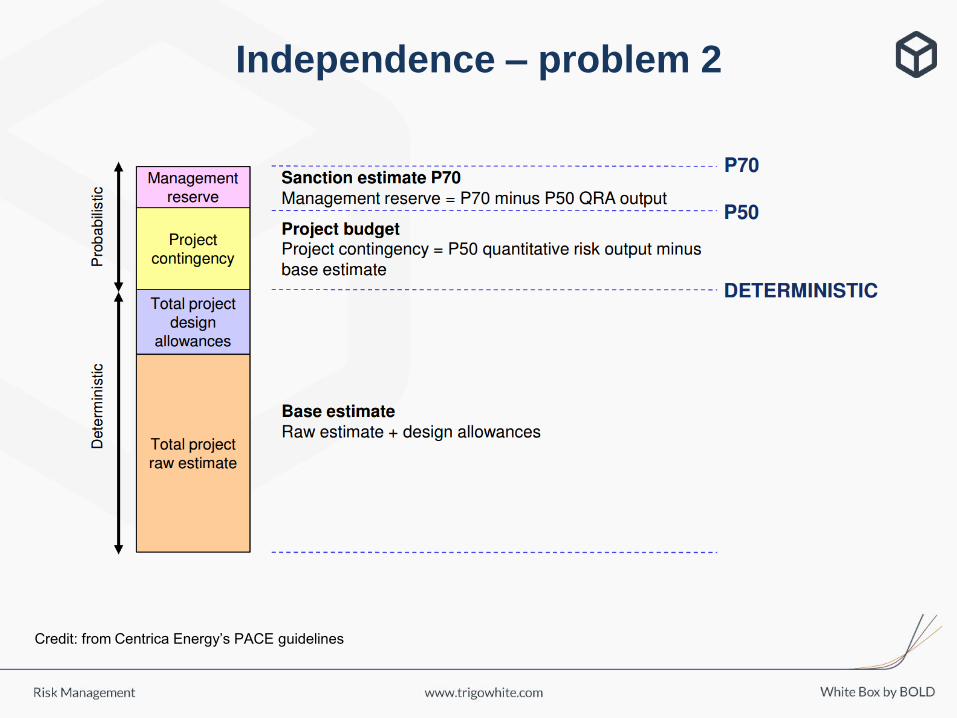
Independence – problem 2
P90 = 98 would be 135
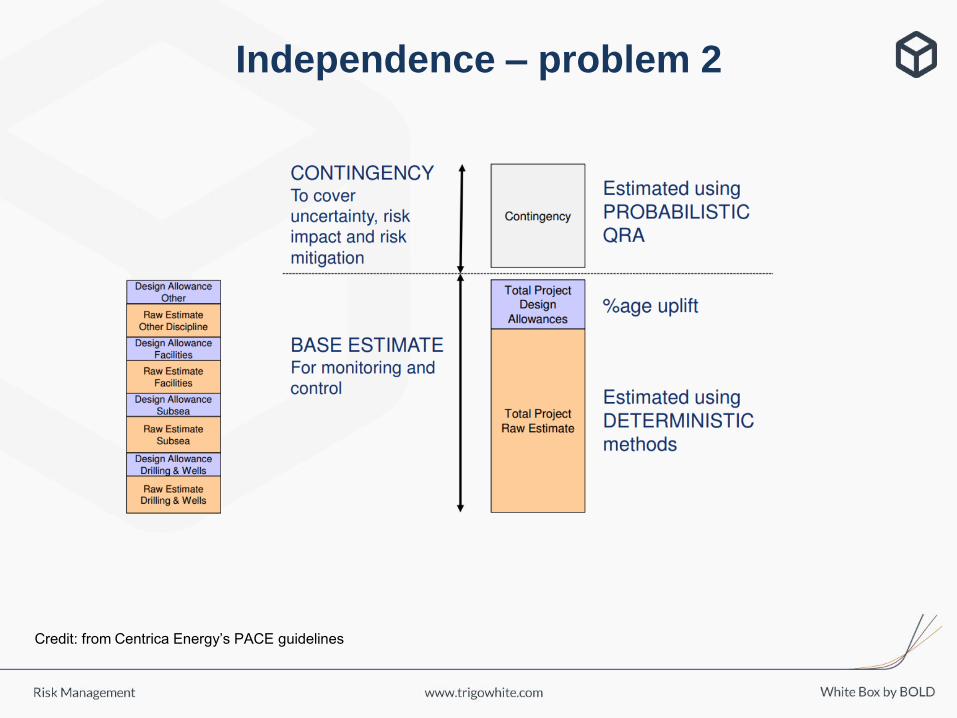
Independence – problem 2
Credit: from Centrica Energy’s PACE guidelines
Independence – problem 2
Credit: from Centrica Energy’s PACE guidelines
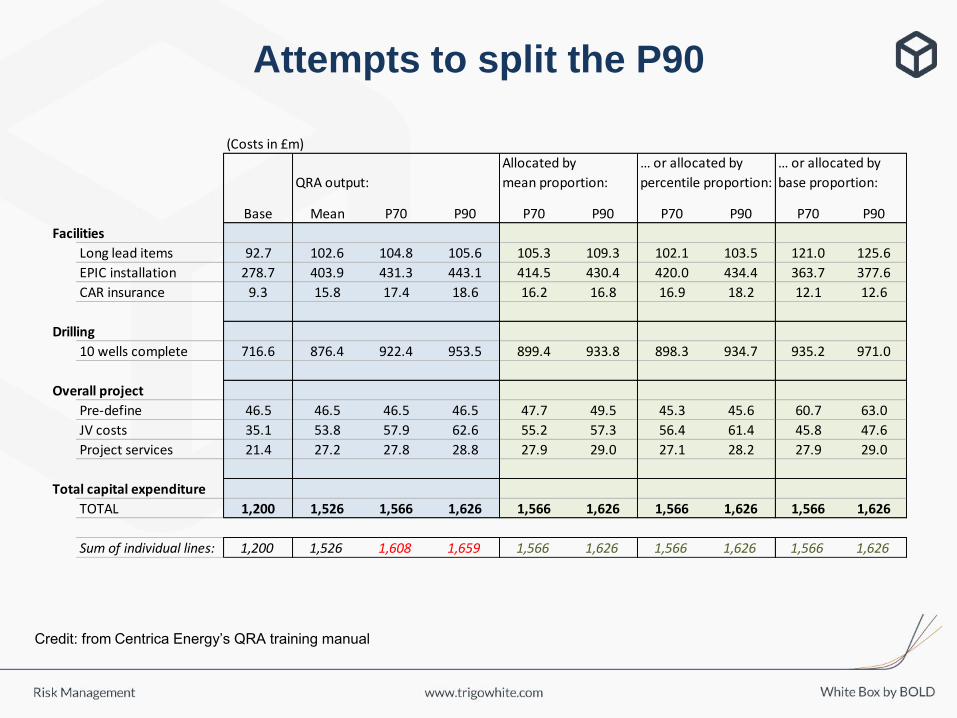
Attempts to split the P90
(Costs in £m)
QRA output:
Base Mean P70 P90 P70 P90 P70 P90 P70 P90
Facilities
Long lead items 92.7 102.6 104.8 105.6 105.3 109.3 102.1 103.5 121.0 125.6
EPIC installation 278.7 403.9 431.3 443.1 414.5 430.4 420.0 434.4 363.7 377.6
CAR insurance 9.3 15.8 17.4 18.6 16.2 16.8 16.9 18.2 12.1 12.6
Drilling
10 wells complete 716.6 876.4 922.4 953.5 899.4 933.8 898.3 934.7 935.2 971.0
Overall project
Pre-define 46.5 46.5 46.5 46.5 47.7 49.5 45.3 45.6 60.7 63.0
JV costs 35.1 53.8 57.9 62.6 55.2 57.3 56.4 61.4 45.8 47.6
Project services 21.4 27.2 27.8 28.8 27.9 29.0 27.1 28.2 27.9 29.0
Total capital expenditure
TOTAL 1,200 1,526 1,566 1,626 1,566 1,626 1,566 1,626 1,566 1,626
Sum of individual lines: 1,200 1,526 1,608 1,659 1,566 1,626 1,566 1,626 1,566 1,626
Allocated by
mean proportion:
… or allocated by
percentile proportion:
… or allocated by
base proportion:
Credit: from Centrica Energy’s QRA training manual

Splitting the P90
• Use conditional averages, conditional on the overall outcome
• P90 factiles are conditional on overall outcome
being (on average) its P90
– Factiles of individual costs sum to the P90 total cost
– Factiles show what each element is “doing” (on average), when
total cost is P90 (on average)
– Condition is based on largest possible subset
• Any split or breakdown
– We can “account for” the risk
– Helps with validation (or invalidation) with the team
– Used by GDF Suez, ConocoPhillips, Centrica …
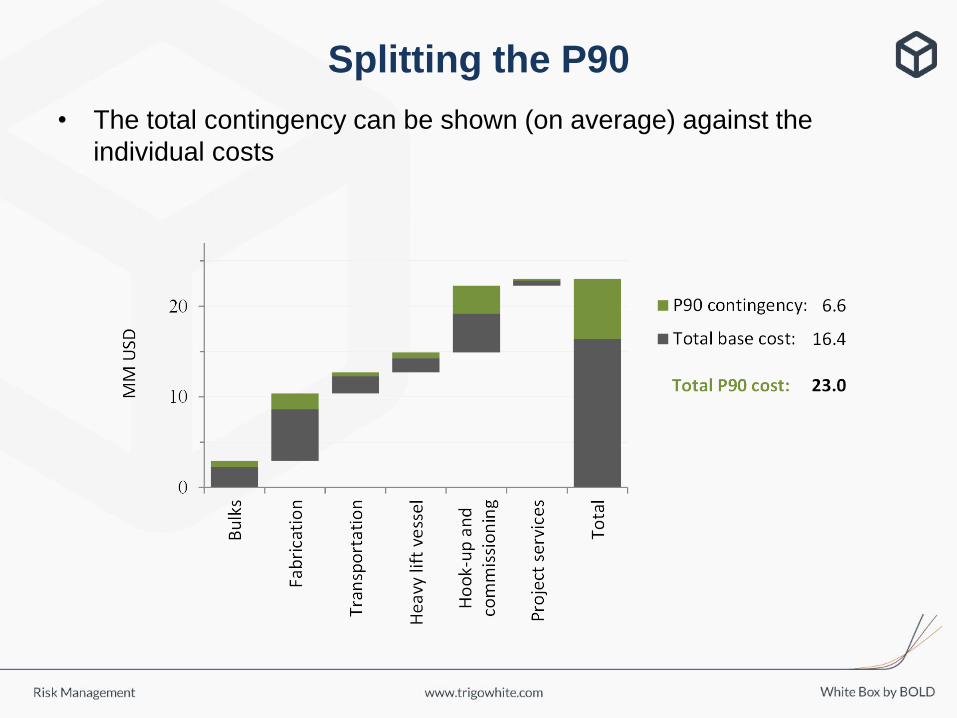
Splitting the P90
• The total contingency can be shown (on average) against the
individual costs
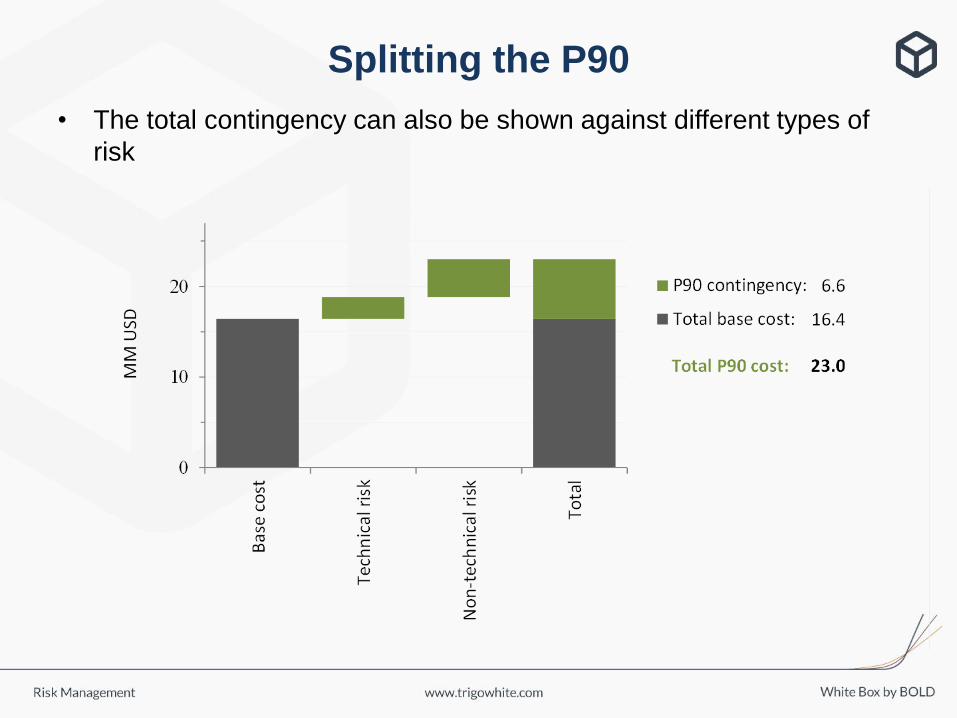
Splitting the P90
• The total contingency can also be shown against different types of
risk

Splitting the P90
• The contribution of risks to the overall project cost or schedule can
be calculated

Splitting the P90
• The total contingency can be shown (on average) phased over time
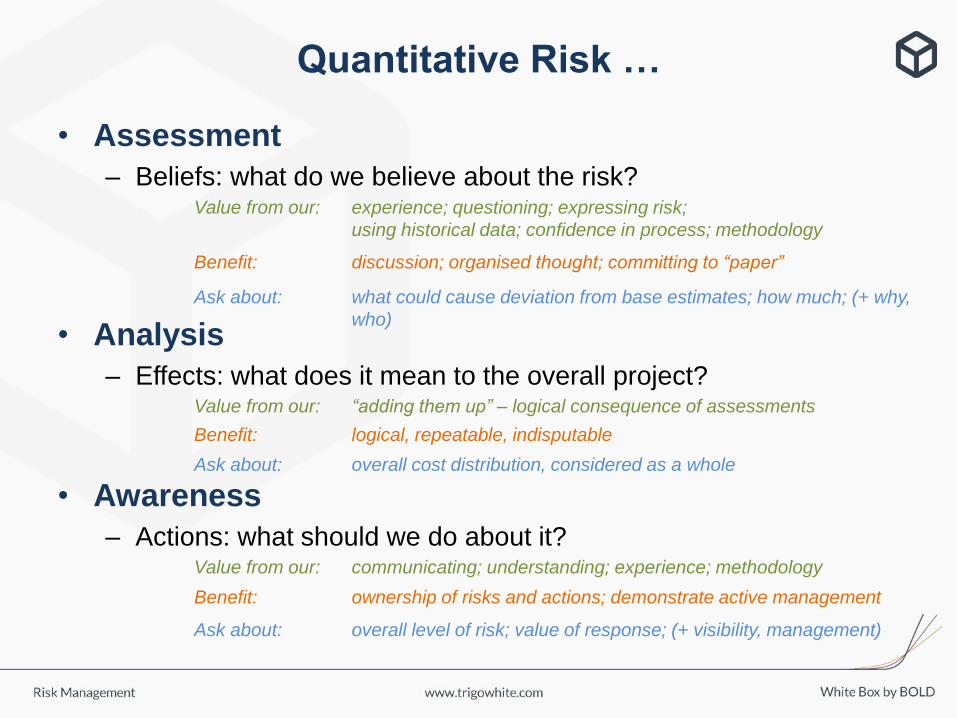
Quantitative Risk …
• Assessment
– Beliefs: what do we believe about the risk?
• Analysis
– Effects: what does it mean to the overall project?
• Awareness
– Actions: what should we do about it?
overall cost distribution, considered as a whole
“adding them up” – logical consequence of assessments
experience; questioning; expressing risk;
using historical data; confidence in process; methodology
what could cause deviation from base estimates; how much; (+ why,
who)
discussion; organised thought; committing to “paper”
communicating; understanding; experience; methodology
overall level of risk; value of response; (+ visibility, management)
ownership of risks and actions; demonstrate active management
Value from our:
Ask about:
Benefit:
Ask about:
Value from our:
Ask about:
Value from our:
Benefit:
Benefit:
logical, repeatable, indisputable

White Box by BOLD