Embed Size (px)
Citation preview
A Forrester Total Economic
Impact™ Study
Commissioned By Epicor
Project Director:
Bob Cormier
June 2014
The Total Economic
Impact™ Of Epicor ERP Cost Savings And Business Benefits Attributed To Epicor ERP
Table Of Contents
Executive Summary .................................................................................... 1
Disclosures .................................................................................................. 2
TEI Framework And Methodology ............................................................ 3
Analysis ........................................................................................................ 4
Financial Summary ................................................................................... 16
Appendix A: About Epicor ERP: Overview ............................................ 18
Appendix B: Interviewed Customers And Epicor Suites ..................... 19
Appendix C: Total Economic Impact™ Overview ................................. 20
Appendix D: Glossary ............................................................................... 21
ABOUT FORRESTER CONSULTING
Forrester Consulting provides independent and objective research-based
consulting to help leaders succeed in their organizations. Ranging in scope from a
short strategy session to custom projects, Forrester’s Consulting services connect
you directly with research analysts who apply expert insight to your specific
business challenges. For more information, visit forrester.com/consulting.
© 2014, Forrester Research, Inc. All rights reserved. Unauthorized reproduction is strictly prohibited.
Information is based on best available resources. Opinions reflect judgment at the time and are subject to
change. Forrester®, Technographics
®, Forrester Wave, RoleView, TechRadar, and Total Economic Impact
are trademarks of Forrester Research, Inc. All other trademarks are the property of their respective
companies. For additional information, go to www.forrester.com.
1
Executive Summary
In the spring of 2014, Epicor commissioned Forrester
Consulting to conduct a Total Economic Impact™ (TEI)
study to examine the potential return on investment
(ROI) enterprises may realize by deploying Epicor ERP.
The purpose of this study is to provide readers with a
framework to evaluate the potential financial impact of
Epicor ERP within their organizations.
To better understand the benefits, costs, and risks
associated with an investment in Epicor ERP, Forrester
interviewed six Epicor customers that had experience
using Epicor ERP. Epicor delivers end-to-end, industry-
specific enterprise software solutions for manufacturing,
distribution, services, retail, and hospitality that enable
companies to increase efficiencies, improve performance, and build competitive advantage. For more details on the Epicor
solution, see Appendix A.
Forrester created a composite Organization to describe the TEI of Epicor ERP. This composite Organization is a global,
midmarket ($100 million to $1 billion) manufacturer that distributes and services its products. It is headquartered and has
operations in North America with multisite operations in EMEA and APAC. It has been using Epicor ERP for one year to
integrate its financial and supply chain activities with real-time connectivity. Forrester has projected costs and benefits over
five years in this study.
EPICOR’S SOLUTION PROVIDED SIGNIFICANT PRODUCTIVITY AND INVENTORY SAVINGS
Our interviews and subsequent financial analysis found that the composite Organization experienced the risk-adjusted ROI,
benefits, and costs shown in Figure 1.
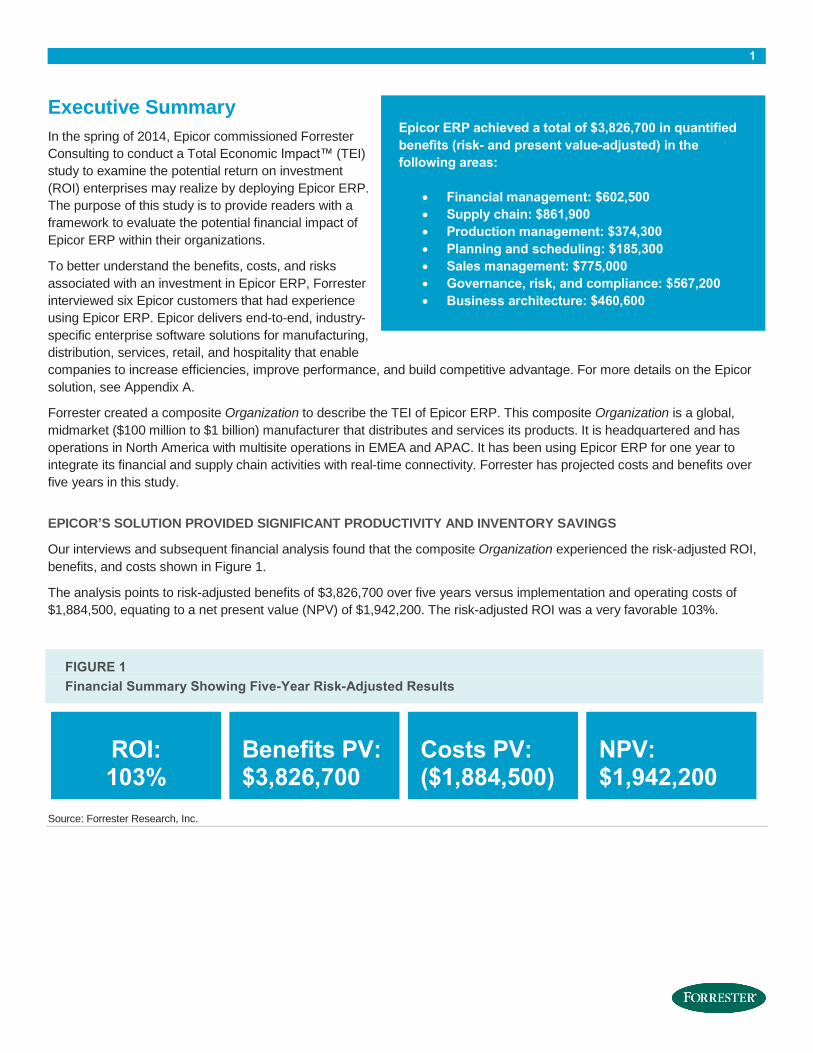
The analysis points to risk-adjusted benefits of $3,826,700 over five years versus implementation and operating costs of
$1,884,500, equating to a net present value (NPV) of $1,942,200. The risk-adjusted ROI was a very favorable 103%.
FIGURE 1
Financial Summary Showing Five-Year Risk-Adjusted Results
ROI: 103%
Benefits PV: $3,826,700
Costs PV: ($1,884,500)
NPV: $1,942,200
Source: Forrester Research, Inc.
Epicor ERP achieved a total of $3,826,700 in quantified
benefits (risk- and present value-adjusted) in the
following areas:
Financial management: $602,500
Supply chain: $861,900
Production management: $374,300
Planning and scheduling: $185,300
Sales management: $775,000
Governance, risk, and compliance: $567,200
Business architecture: $460,600
2
› Benefits associated with Epicor ERP — $3,826,700. The Organization experienced the following benefits (risk- and
present value-adjusted) over five years (further detailed in the Benefits: Quantified section):
• Financial management suite — $602,500. Productivity savings in invoicing and sales tax administration, and
general accounting productivity related to creating, processing, and reporting numerous accounting entries.
• Supply chain suite — $861,900. A 15% reduction in average inventory levels and a reduction in headcount and
avoided future hiring associated with supply chain activities.
• Production management suite — $374,300. Taking advantage of Kanban and manufacturing execution system
(MES) functionality.
• Planning and scheduling suite — $185,300. Monitor project status and costs with a project tracker, the ability to
check supply and demand of a part with available-to-promise functionality, and taking advantage of multisite
management.
• Sales management suite — $775,000. Create customer proposals and quotes much faster with Epicor, with the
ability to import data from a variety of customer and system sources. And simplify the business of accepting credit
cards.
• Governance, risk, and compliance software — $567,200. Mitigate exposure to risk with table and field level audit
tracking, enhance controls; and gain cross-organizational financial visibility and control over financial reporting,
planning, and forecasting processes.
• Business architecture — $460,600. Creation and enforcement of unique business processes, alerts, and
workflows without customizing the software. And the use of Epicor Enterprise Search (engine) for access to its
warehouse distribution solution.
› Costs associated with Epicor ERP — $1,884,500. The Organization experienced the following costs (present value-
adjusted) over five years (further detailed in the Costs section):
• Planning the implementation — $350,000. The labor associated with planning and implementing the solution.
• Hardware requirements to support Epicor version 9 implementation — $100,000. Four servers.
o Note: Deployment for Epicor ERP version 10 will require substantially less (50%) hardware cost. And
hardware is not needed with SaaS/cloud Epicor ERP.
• Epicor software license, maintenance, professional services, and training — $373,100. Epicor’s fees.
• Ongoing management of the solution — $1,061,400. The labor associated with managing the solution is two
FTEs over the five-year analysis.
If risk-adjusted NPV of costs and benefits still demonstrate a compelling business case, it raises confidence that the
investment is likely to succeed because the risks that threaten the project have been taken into consideration and quantified.
The risk-adjusted numbers should be taken as “realistic” expectations, as they represent the expected value considering risk.
Assuming normal success at mitigating risk, the risk-adjusted numbers should more closely reflect the expected outcome of
the investment.
Disclosures
The reader should be aware of the following:
› The study is commissioned by Epicor and delivered by Forrester Consulting. It is not meant to be used as a competitive
analysis.

3
› Forrester makes no assumptions as to the potential return on investment that other organizations will receive. Forrester
strongly advises that readers use their own estimates within the framework provided in the study to determine the
appropriateness of an investment in Epicor ERP.
› Epicor reviewed and provided feedback to Forrester, but Forrester maintained editorial control over the study and its
findings and did not accept changes to the study that contradict Forrester’s findings or obscure the meaning of the study.
› The customers’ names for the interviews were provided by Epicor. Epicor did not participate in the customer interviews.
TEI Framework And Methodology
INTRODUCTION
From the information provided in the interviews, Forrester has constructed a Total Economic Impact™ (TEI) framework for
those organizations considering investing in Epicor ERP. The objective of the framework is to identify the benefits, costs,
flexibility, and risk factors that affect the investment decision.
APPROACH AND METHODOLOGY
Forrester employed four fundamental elements of TEI in modeling Epicor ERP: benefits, costs, flexibility, and risks.
Forrester took a multistep approach to evaluate the impact that Epicor ERP can have on the composite Organization (see
Figure 2). Specifically, we:
› Interviewed Epicor marketing, sales, and product management personnel, along with Forrester analysts, to better
understand the value proposition for Epicor ERP.
› Conducted in-depth interviews with each of the six customers to obtain data with respect to costs, benefits, and risks.
› Constructed a financial model representative of the interviews using the TEI methodology. The financial model is
populated with the cost and benefit data obtained from the interviews.
› Risk adjustment is a key part of the TEI methodology. While the interviewed customers provided cost and benefit
estimates, some categories included future projections, or a broad range of responses, or had a number of internal or
external forces that might have impacted costs and benefits higher or lower. For that reason, each benefit has been risk-
adjusted, and is detailed in the Benefits: Quantified section.
Given the increasing sophistication that enterprises have regarding ROI analyses related to IT investments, Forrester’s TEI
methodology serves to provide a complete picture of the total economic impact of purchase decisions. Please see Appendix
C for additional information on the TEI methodology.
FIGURE 2
TEI Approach
Perform due diligence
Conduct customer interviews
Design composite
organization
Construct financial
model using TEI framework
Write case study
4
Source: Forrester Research, Inc.
Analysis
INTERVIEWED CUSTOMERS
Forrester derived its conclusions in large part from information received in a series of in-depth interviews we conducted with
executives and personnel at six customers, each of which are using the on-premises version of Epicor ERP. See Appendix B
for a list of the Epicor ERP product suites that each customer is using. The following is a brief description of the interviewed
customers, all of which were promised anonymity:
› Customer A — a $200 million (USD) APAC-based metal and minerals processing company that has been using Epicor
ERP for over five years. It has 45 registered Epicor users located in six locations.
› Customer B — a $100 million (USD) European-based entertainment company that has been using Epicor since 2003. It
has three fixed locations and 20 temporary mobile locations.
› Customer C — a US-based design, engineering, and manufacturing company serving customers worldwide. It has been
using Epicor ERP for eight years in two locations.
› Customer D — a $20 million (USD) European-based sheet metal solutions manufacturer that has been using Epicor ERP
for eight months. There are currently 30 users of Epicor ERP in two locations.
› Customer E — a $135 million (USD) North American-based global provider of equipment for the abatement of air pollution.
It has been using Epicor ERP for seven years in 11 different locations.
› Customer F — a large machinery manufacturing company based in China. It has been using Epicor ERP for factory
management for about eight years with a goal of using Epicor to help double revenues.
THE COMPOSITE ORGANIZATION
The composite Organization is a global, midmarket ($100 million to $1 billion) manufacturer that distributes and services its
products. It is headquartered and has operations in North America with multisite operations in EMEA and APAC. It has been
using Epicor ERP for one year to integrate its financial and supply chain activities with real-time connectivity.
After an extensive review process evaluating multiple vendors, the Organization selected Epicor ERP as it believed Epicor
ERP could satisfy the following business challenges, goals, and objectives:
› The need to stay competitive with a limited budget.
› The Organization was experiencing significant annual growth rates and its legacy ERP solutions were not capable of
meeting the information and regulatory requirements of the company.
› It has a need for more agility and flexibility in an ERP solution.
› It wanted a short deployment time frame due to its projected growth plans.
5
BENEFITS: QUANTIFIED
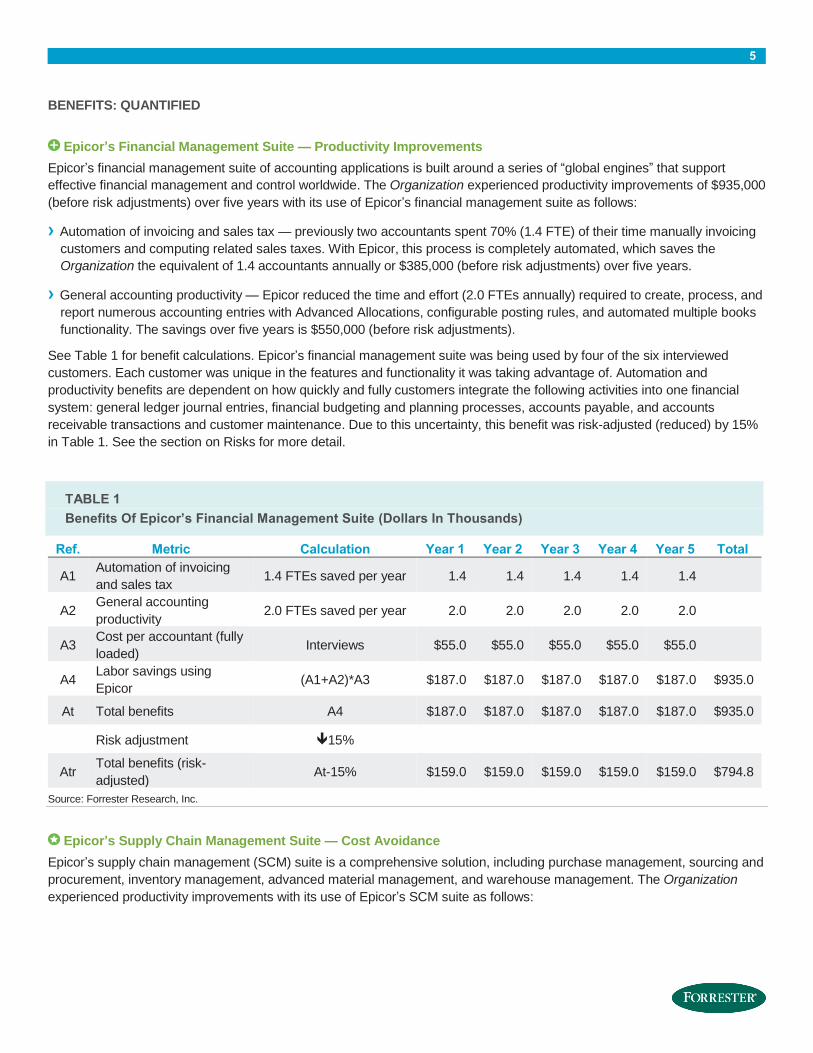
Epicor’s Financial Management Suite — Productivity Improvements
Epicor’s financial management suite of accounting applications is built around a series of “global engines” that support
effective financial management and control worldwide. The Organization experienced productivity improvements of $935,000
(before risk adjustments) over five years with its use of Epicor’s financial management suite as follows:
› Automation of invoicing and sales tax — previously two accountants spent 70% (1.4 FTE) of their time manually invoicing
customers and computing related sales taxes. With Epicor, this process is completely automated, which saves the
Organization the equivalent of 1.4 accountants annually or $385,000 (before risk adjustments) over five years.
› General accounting productivity — Epicor reduced the time and effort (2.0 FTEs annually) required to create, process, and
report numerous accounting entries with Advanced Allocations, configurable posting rules, and automated multiple books
functionality. The savings over five years is $550,000 (before risk adjustments).
See Table 1 for benefit calculations. Epicor’s financial management suite was being used by four of the six interviewed
customers. Each customer was unique in the features and functionality it was taking advantage of. Automation and
productivity benefits are dependent on how quickly and fully customers integrate the following activities into one financial
system: general ledger journal entries, financial budgeting and planning processes, accounts payable, and accounts
receivable transactions and customer maintenance. Due to this uncertainty, this benefit was risk-adjusted (reduced) by 15%
in Table 1. See the section on Risks for more detail.
TABLE 1
Benefits Of Epicor’s Financial Management Suite (Dollars In Thousands)
Ref. Metric Calculation Year 1 Year 2 Year 3 Year 4 Year 5 Total
A1 Automation of invoicing
and sales tax 1.4 FTEs saved per year 1.4 1.4 1.4 1.4 1.4
A2 General accounting
productivity 2.0 FTEs saved per year 2.0 2.0 2.0 2.0 2.0
A3 Cost per accountant (fully
loaded) Interviews $55.0 $55.0 $55.0 $55.0 $55.0
A4 Labor savings using
Epicor (A1+A2)*A3 $187.0 $187.0 $187.0 $187.0 $187.0 $935.0
At Total benefits A4 $187.0 $187.0 $187.0 $187.0 $187.0 $935.0
Risk adjustment 15%
Atr Total benefits (risk-
adjusted) At-15% $159.0 $159.0 $159.0 $159.0 $159.0 $794.8
Source: Forrester Research, Inc.
Epicor’s Supply Chain Management Suite — Cost Avoidance
Epicor’s supply chain management (SCM) suite is a comprehensive solution, including purchase management, sourcing and
procurement, inventory management, advanced material management, and warehouse management. The Organization
experienced productivity improvements with its use of Epicor’s SCM suite as follows:
6
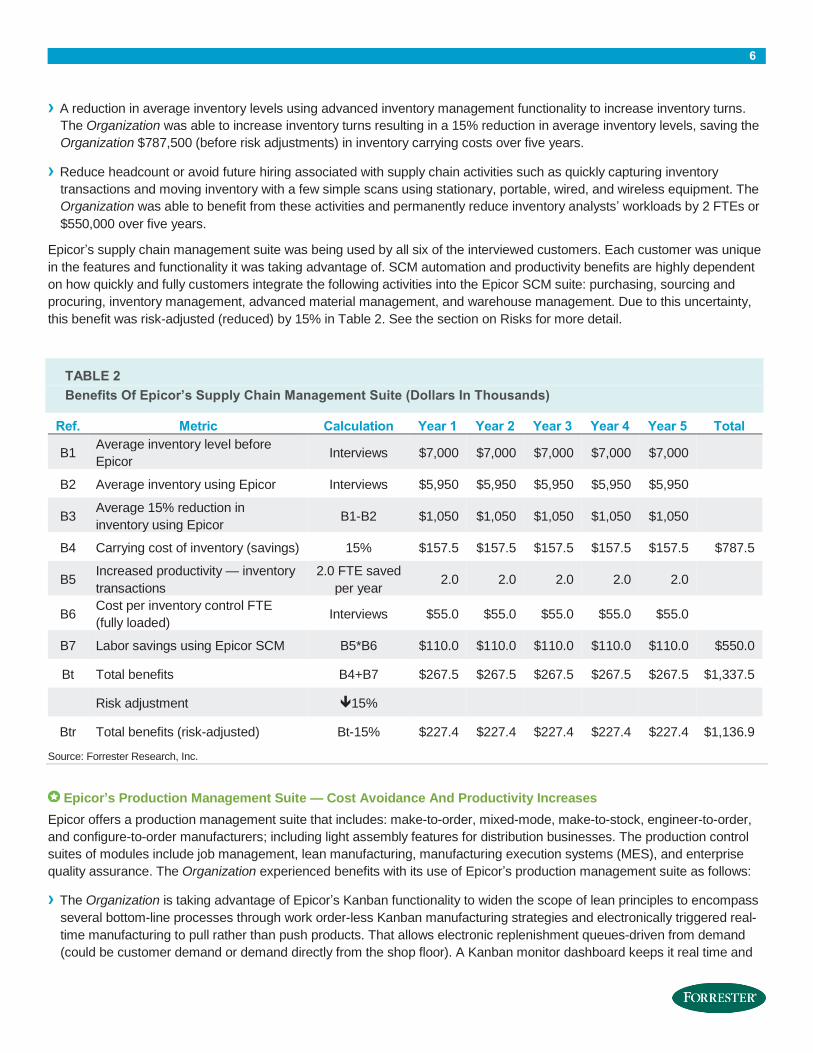
› A reduction in average inventory levels using advanced inventory management functionality to increase inventory turns.
The Organization was able to increase inventory turns resulting in a 15% reduction in average inventory levels, saving the
Organization $787,500 (before risk adjustments) in inventory carrying costs over five years.
› Reduce headcount or avoid future hiring associated with supply chain activities such as quickly capturing inventory
transactions and moving inventory with a few simple scans using stationary, portable, wired, and wireless equipment. The
Organization was able to benefit from these activities and permanently reduce inventory analysts’ workloads by 2 FTEs or
$550,000 over five years.
Epicor’s supply chain management suite was being used by all six of the interviewed customers. Each customer was unique
in the features and functionality it was taking advantage of. SCM automation and productivity benefits are highly dependent
on how quickly and fully customers integrate the following activities into the Epicor SCM suite: purchasing, sourcing and
procuring, inventory management, advanced material management, and warehouse management. Due to this uncertainty,
this benefit was risk-adjusted (reduced) by 15% in Table 2. See the section on Risks for more detail.
TABLE 2
Benefits Of Epicor’s Supply Chain Management Suite (Dollars In Thousands)
Ref. Metric Calculation Year 1 Year 2 Year 3 Year 4 Year 5 Total
B1 Average inventory level before
Epicor Interviews $7,000 $7,000 $7,000 $7,000 $7,000
B2 Average inventory using Epicor Interviews $5,950 $5,950 $5,950 $5,950 $5,950
B3 Average 15% reduction in
inventory using Epicor B1-B2 $1,050 $1,050 $1,050 $1,050 $1,050
B4 Carrying cost of inventory (savings) 15% $157.5 $157.5 $157.5 $157.5 $157.5 $787.5
B5 Increased productivity — inventory
transactions
2.0 FTE saved
per year 2.0 2.0 2.0 2.0 2.0
B6 Cost per inventory control FTE
(fully loaded) Interviews $55.0 $55.0 $55.0 $55.0 $55.0
B7 Labor savings using Epicor SCM B5*B6 $110.0 $110.0 $110.0 $110.0 $110.0 $550.0
Bt Total benefits B4+B7 $267.5 $267.5 $267.5 $267.5 $267.5 $1,337.5
Risk adjustment 15%
Btr Total benefits (risk-adjusted) Bt-15% $227.4 $227.4 $227.4 $227.4 $227.4 $1,136.9
Source: Forrester Research, Inc.
Epicor’s Production Management Suite — Cost Avoidance And Productivity Increases
Epicor offers a production management suite that includes: make-to-order, mixed-mode, make-to-stock, engineer-to-order,
and configure-to-order manufacturers; including light assembly features for distribution businesses. The production control
suites of modules include job management, lean manufacturing, manufacturing execution systems (MES), and enterprise
quality assurance. The Organization experienced benefits with its use of Epicor’s production management suite as follows:
› The Organization is taking advantage of Epicor’s Kanban functionality to widen the scope of lean principles to encompass
several bottom-line processes through work order-less Kanban manufacturing strategies and electronically triggered real-
time manufacturing to pull rather than push products. That allows electronic replenishment queues-driven from demand
(could be customer demand or demand directly from the shop floor). A Kanban monitor dashboard keeps it real time and
7
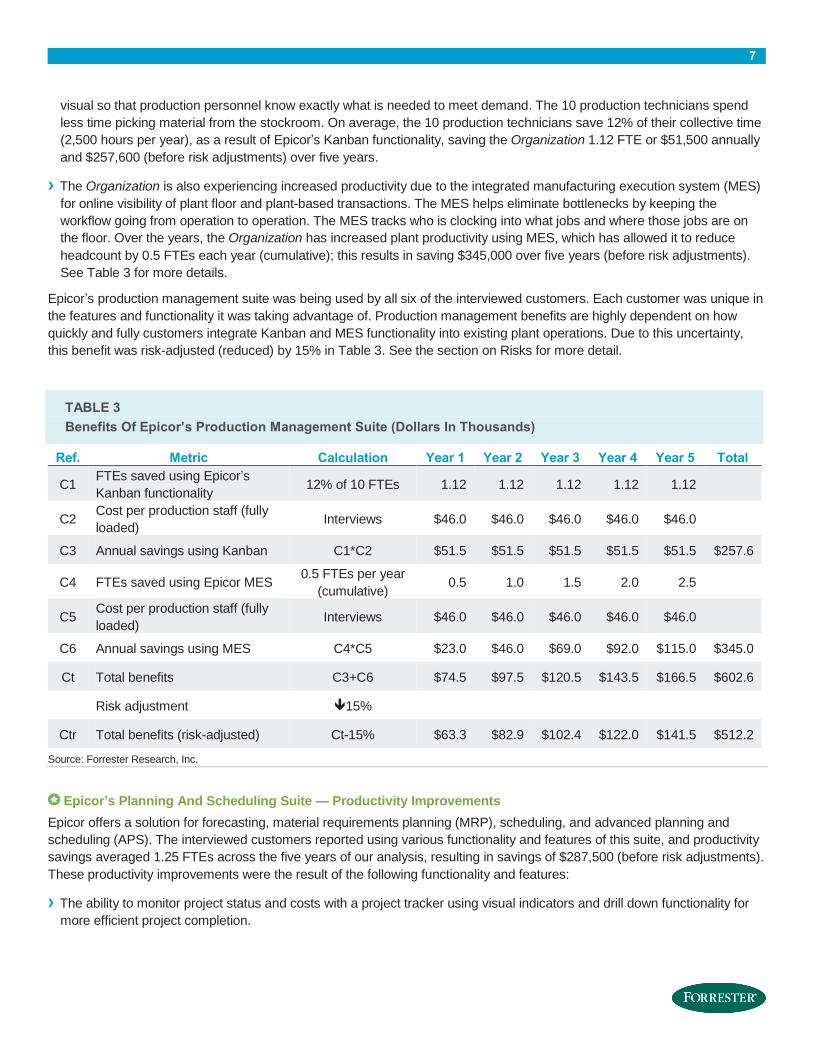
visual so that production personnel know exactly what is needed to meet demand. The 10 production technicians spend
less time picking material from the stockroom. On average, the 10 production technicians save 12% of their collective time
(2,500 hours per year), as a result of Epicor’s Kanban functionality, saving the Organization 1.12 FTE or $51,500 annually
and $257,600 (before risk adjustments) over five years.
› The Organization is also experiencing increased productivity due to the integrated manufacturing execution system (MES)
for online visibility of plant floor and plant-based transactions. The MES helps eliminate bottlenecks by keeping the
workflow going from operation to operation. The MES tracks who is clocking into what jobs and where those jobs are on
the floor. Over the years, the Organization has increased plant productivity using MES, which has allowed it to reduce
headcount by 0.5 FTEs each year (cumulative); this results in saving $345,000 over five years (before risk adjustments).
See Table 3 for more details.
Epicor’s production management suite was being used by all six of the interviewed customers. Each customer was unique in
the features and functionality it was taking advantage of. Production management benefits are highly dependent on how
quickly and fully customers integrate Kanban and MES functionality into existing plant operations. Due to this uncertainty,
this benefit was risk-adjusted (reduced) by 15% in Table 3. See the section on Risks for more detail.
TABLE 3
Benefits Of Epicor’s Production Management Suite (Dollars In Thousands)
Ref. Metric Calculation Year 1 Year 2 Year 3 Year 4 Year 5 Total
C1 FTEs saved using Epicor’s
Kanban functionality 12% of 10 FTEs 1.12 1.12 1.12 1.12 1.12
C2 Cost per production staff (fully
loaded) Interviews $46.0 $46.0 $46.0 $46.0 $46.0
C3 Annual savings using Kanban C1*C2 $51.5 $51.5 $51.5 $51.5 $51.5 $257.6
C4 FTEs saved using Epicor MES 0.5 FTEs per year
(cumulative) 0.5 1.0 1.5 2.0 2.5
C5 Cost per production staff (fully
loaded) Interviews $46.0 $46.0 $46.0 $46.0 $46.0
C6 Annual savings using MES C4*C5 $23.0 $46.0 $69.0 $92.0 $115.0 $345.0
Ct Total benefits C3+C6 $74.5 $97.5 $120.5 $143.5 $166.5 $602.6
Risk adjustment 15%
Ctr Total benefits (risk-adjusted) Ct-15% $63.3 $82.9 $102.4 $122.0 $141.5 $512.2
Source: Forrester Research, Inc.
Epicor’s Planning And Scheduling Suite — Productivity Improvements
Epicor offers a solution for forecasting, material requirements planning (MRP), scheduling, and advanced planning and
scheduling (APS). The interviewed customers reported using various functionality and features of this suite, and productivity
savings averaged 1.25 FTEs across the five years of our analysis, resulting in savings of $287,500 (before risk adjustments).
These productivity improvements were the result of the following functionality and features:
› The ability to monitor project status and costs with a project tracker using visual indicators and drill down functionality for
more efficient project completion.
8
› The ability to check supply and demand of a part with available-to-promise functionality and imported forecast display by
customer and part number.
› Taking advantage of multisite management designed to handle combinations of multiple offices, plants and warehouse, or
companies.
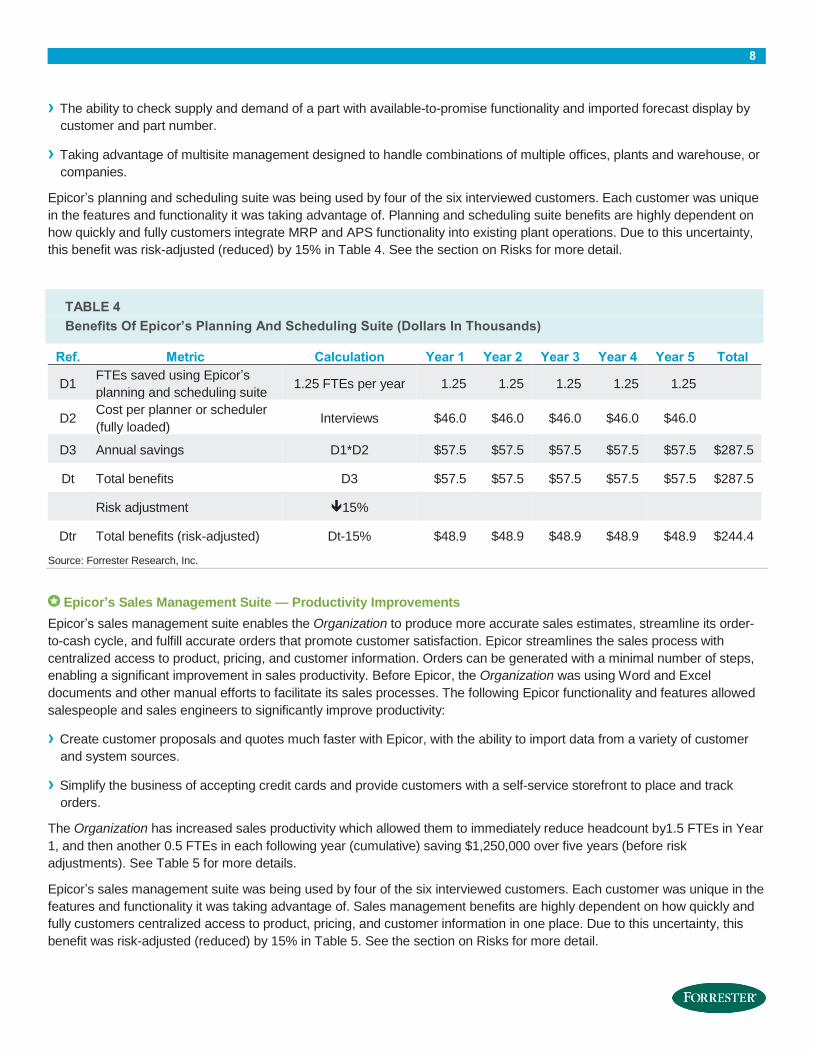
Epicor’s planning and scheduling suite was being used by four of the six interviewed customers. Each customer was unique
in the features and functionality it was taking advantage of. Planning and scheduling suite benefits are highly dependent on
how quickly and fully customers integrate MRP and APS functionality into existing plant operations. Due to this uncertainty,
this benefit was risk-adjusted (reduced) by 15% in Table 4. See the section on Risks for more detail.
TABLE 4
Benefits Of Epicor’s Planning And Scheduling Suite (Dollars In Thousands)
Ref. Metric Calculation Year 1 Year 2 Year 3 Year 4 Year 5 Total
D1 FTEs saved using Epicor’s
planning and scheduling suite 1.25 FTEs per year 1.25 1.25 1.25 1.25 1.25
D2 Cost per planner or scheduler
(fully loaded) Interviews $46.0 $46.0 $46.0 $46.0 $46.0
D3 Annual savings D1*D2 $57.5 $57.5 $57.5 $57.5 $57.5 $287.5
Dt Total benefits D3 $57.5 $57.5 $57.5 $57.5 $57.5 $287.5
Risk adjustment 15%
Dtr Total benefits (risk-adjusted) Dt-15% $48.9 $48.9 $48.9 $48.9 $48.9 $244.4
Source: Forrester Research, Inc.
Epicor’s Sales Management Suite — Productivity Improvements
Epicor’s sales management suite enables the Organization to produce more accurate sales estimates, streamline its order-
to-cash cycle, and fulfill accurate orders that promote customer satisfaction. Epicor streamlines the sales process with
centralized access to product, pricing, and customer information. Orders can be generated with a minimal number of steps,
enabling a significant improvement in sales productivity. Before Epicor, the Organization was using Word and Excel
documents and other manual efforts to facilitate its sales processes. The following Epicor functionality and features allowed
salespeople and sales engineers to significantly improve productivity:
› Create customer proposals and quotes much faster with Epicor, with the ability to import data from a variety of customer
and system sources.
› Simplify the business of accepting credit cards and provide customers with a self-service storefront to place and track
orders.
The Organization has increased sales productivity which allowed them to immediately reduce headcount by1.5 FTEs in Year
1, and then another 0.5 FTEs in each following year (cumulative) saving $1,250,000 over five years (before risk
adjustments). See Table 5 for more details.
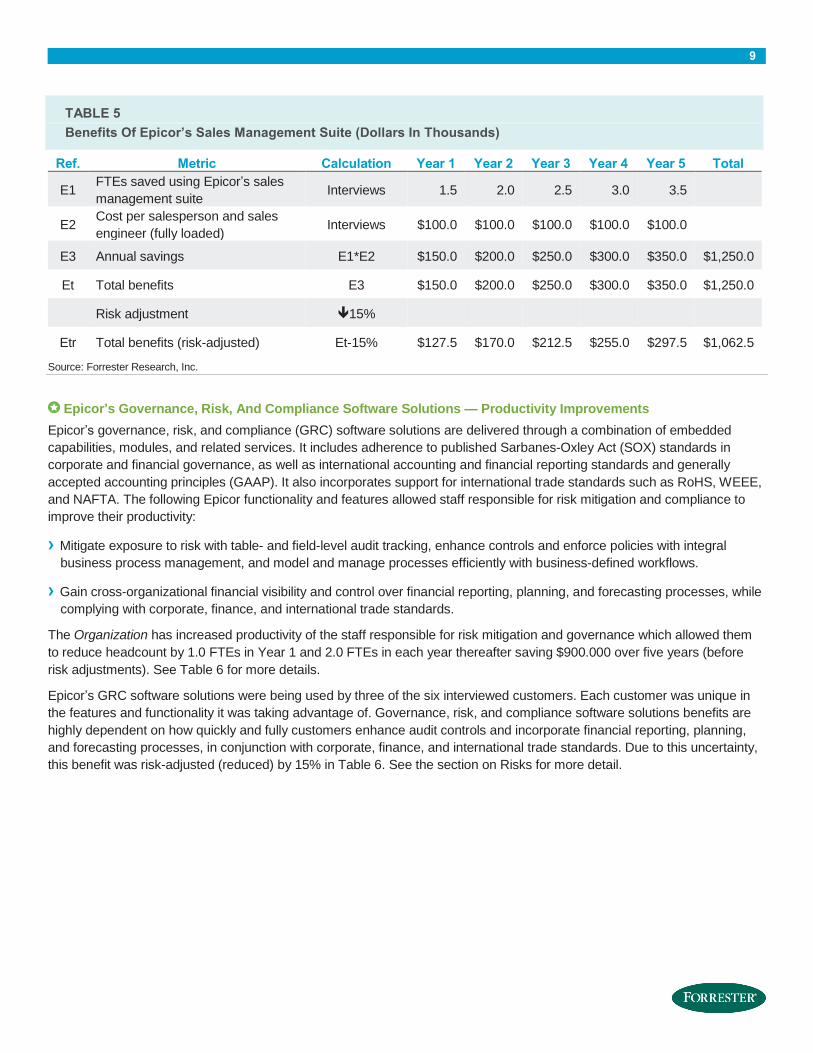
Epicor’s sales management suite was being used by four of the six interviewed customers. Each customer was unique in the
features and functionality it was taking advantage of. Sales management benefits are highly dependent on how quickly and
fully customers centralized access to product, pricing, and customer information in one place. Due to this uncertainty, this
benefit was risk-adjusted (reduced) by 15% in Table 5. See the section on Risks for more detail.
9
TABLE 5
Benefits Of Epicor’s Sales Management Suite (Dollars In Thousands)
Ref. Metric Calculation Year 1 Year 2 Year 3 Year 4 Year 5 Total
E1 FTEs saved using Epicor’s sales
management suite Interviews 1.5 2.0 2.5 3.0 3.5
E2 Cost per salesperson and sales
engineer (fully loaded) Interviews $100.0 $100.0 $100.0 $100.0 $100.0
E3 Annual savings E1*E2 $150.0 $200.0 $250.0 $300.0 $350.0 $1,250.0
Et Total benefits E3 $150.0 $200.0 $250.0 $300.0 $350.0 $1,250.0
Risk adjustment 15%
Etr Total benefits (risk-adjusted) Et-15% $127.5 $170.0 $212.5 $255.0 $297.5 $1,062.5
Source: Forrester Research, Inc.
Epicor’s Governance, Risk, And Compliance Software Solutions — Productivity Improvements
Epicor’s governance, risk, and compliance (GRC) software solutions are delivered through a combination of embedded
capabilities, modules, and related services. It includes adherence to published Sarbanes-Oxley Act (SOX) standards in
corporate and financial governance, as well as international accounting and financial reporting standards and generally
accepted accounting principles (GAAP). It also incorporates support for international trade standards such as RoHS, WEEE,
and NAFTA. The following Epicor functionality and features allowed staff responsible for risk mitigation and compliance to
improve their productivity:
› Mitigate exposure to risk with table- and field-level audit tracking, enhance controls and enforce policies with integral
business process management, and model and manage processes efficiently with business-defined workflows.
› Gain cross-organizational financial visibility and control over financial reporting, planning, and forecasting processes, while
complying with corporate, finance, and international trade standards.
The Organization has increased productivity of the staff responsible for risk mitigation and governance which allowed them
to reduce headcount by 1.0 FTEs in Year 1 and 2.0 FTEs in each year thereafter saving $900.000 over five years (before
risk adjustments). See Table 6 for more details.
Epicor’s GRC software solutions were being used by three of the six interviewed customers. Each customer was unique in
the features and functionality it was taking advantage of. Governance, risk, and compliance software solutions benefits are
highly dependent on how quickly and fully customers enhance audit controls and incorporate financial reporting, planning,
and forecasting processes, in conjunction with corporate, finance, and international trade standards. Due to this uncertainty,
this benefit was risk-adjusted (reduced) by 15% in Table 6. See the section on Risks for more detail.

10
TABLE 6
Benefits Of Epicor’s Governance, Risk, And Compliance Software Solutions (Dollars In Thousands)
Ref. Metric Calculation Year 1 Year 2 Year 3 Year 4 Year 5 Total
F1 FTEs saved using Epicor’s GRC
solutions Interviews 1.0 2.0 2.0 2.0 2.0
F2 Cost per GRC staff (fully loaded) Interviews $100.0 $100.0 $100.0 $100.0 $100.0
F3 Annual savings F1*F2 $100.0 $200.0 $200.0 $200.0 $200.0 $900.0
Ft Total benefits F3 $100.0 $200.0 $200.0 $200.0 $200.0 $900.0
Risk adjustment 15%
Ftr Total benefits (risk-adjusted) Ft-15% $85.0 $170.0 $170.0 $170.0 $170.0 765.0
Source: Forrester Research, Inc.
Epicor’s Business Architecture — Productivity Improvements
Epicor’s business architecture is called Epicor Internet Component Environment (ICE). It considers all logic, including the
client, as “business services,” so all Epicor next-generation enterprise applications can be manipulated using Epicor
business process management (BPM) and Epicor Service Connect. Epicor ICE is a tool set that enables greater productivity
and drives continuous improvement by eliminating waste among critical business processes. The Organization is using the
following business architecture functionality and is able to reduce headcount over five years saving $735,000 (before risk
adjustments):
› Creation and enforcement of unique business processes, alerts, and workflows without customizing the software. The
Organization was able to reduce headcount by 1.5 FTEs in each of the five years of this analysis.
› Enterprise Search — the Organization initiated use of this functionality in Year 3. It’s a sophisticated search engine with a
look and feel that brings the personal Internet experience to the workplace and provides all employees, regardless of
location, with access to for access to its warehouse distribution solution from one search field. Beginning in Year 3 the
Organization was able to reduce headcount by one FTE annually.

11
TABLE 7
Benefits Of Epicor’s Business Architecture (Dollars In Thousands)
Ref. Metric Calculation Year 1 Year 2 Year 3 Year 4 Year 5 Total
G1
FTEs saved using business
architecture (Enterprise Search
starts in Year 3)
Interviews 1.5 1.5 2.5 2.5 2.5
G2 Average cost per user (fully loaded) Interviews $70.0 $70.0 $70.0 $70.0 $70.0
G3 Annual savings G1*G2 $105.0 $105.0 $175.0 $175.0 $175.0 $735.0
Gt Total benefits G3 $105.0 $105.0 $175.0 $175.0 $175.0 $735.0
Risk adjustment 15%
Gtr Total benefits (risk-adjusted) Gt-15% $89.3 $89.3 $148.8 $148.8 $148.8 $624.8
Source: Forrester Research, Inc.
Total Benefits
Table 8 shows the total of all benefits as well as present values (PVs) discounted at 10%. Over five years, the Organization
expects risk-adjusted total benefits to be a PV of $3,826,700
TABLE 8
The Organization — Total Quantified Benefits (Risk-Adjusted) (Dollars In Thousands)
Ref. Metric Year 1 Year 2 Year 3 Year 4 Year 5 Total
Present
value
Atr Epicor’s financial management
suite $159.0 $159.0 $159.0 $159.0 $159.0 $794.8 $602.5
Btr Epicor’s supply chain
management suite $227.4 $227.4 $227.4 $227.4 $227.4 $1,136.9 $861.9
Ctr Epicor’s production
management suite $63.3 $82.9 $102.4 $122.0 $141.5 $512.2 $374.3
Dtr Epicor’s planning and
scheduling suite $48.9 $48.9 $48.9 $48.9 $48.9 $244.4 $185.3
Etr Epicor’s sales management
suite $127.5 $170.0 $212.5 $255.0 $297.5 $1,062.5 $775.0
Ftr Epicor’s governance, risk, and
compliance software solutions $85.0 $170.0 $170.0 $170.0 $170.0 $765.0 $567.2
Gtr Business architecture software $89.3 $89.3 $148.8 $148.8 $148.8 $624.8 $460.6
Ttr Total quantified benefits (risk-
adjusted) $800.3 $947.3 $1,068.9 $1,130.9 $1,193.0 $5,140.5 $3,826.7
Source: Forrester Research, Inc.
BENEFITS: UNQUANTIFIED
The Organization identified the following additional benefits of using Epicor ERP, but it was not able to quantify the benefits
at the present time:
12
› Three interviewed customers were able to stop paying maintenance expenses for legacy point solutions once Epicor ERP
was deployed; however they were not able to quantify these benefits. Readers should consider and quantify these
incremental benefits if applicable in their environment.
› Several interviewed customers reported that with one integrated financial system (Epicor) it took less time to close the
books for fiscal ending periods, than with previous systems.
› Those customers managing all financial transactions with Epicor financial management suite, reported improvements in
DSO (days sales outstanding) and lower accounts receivable balances.
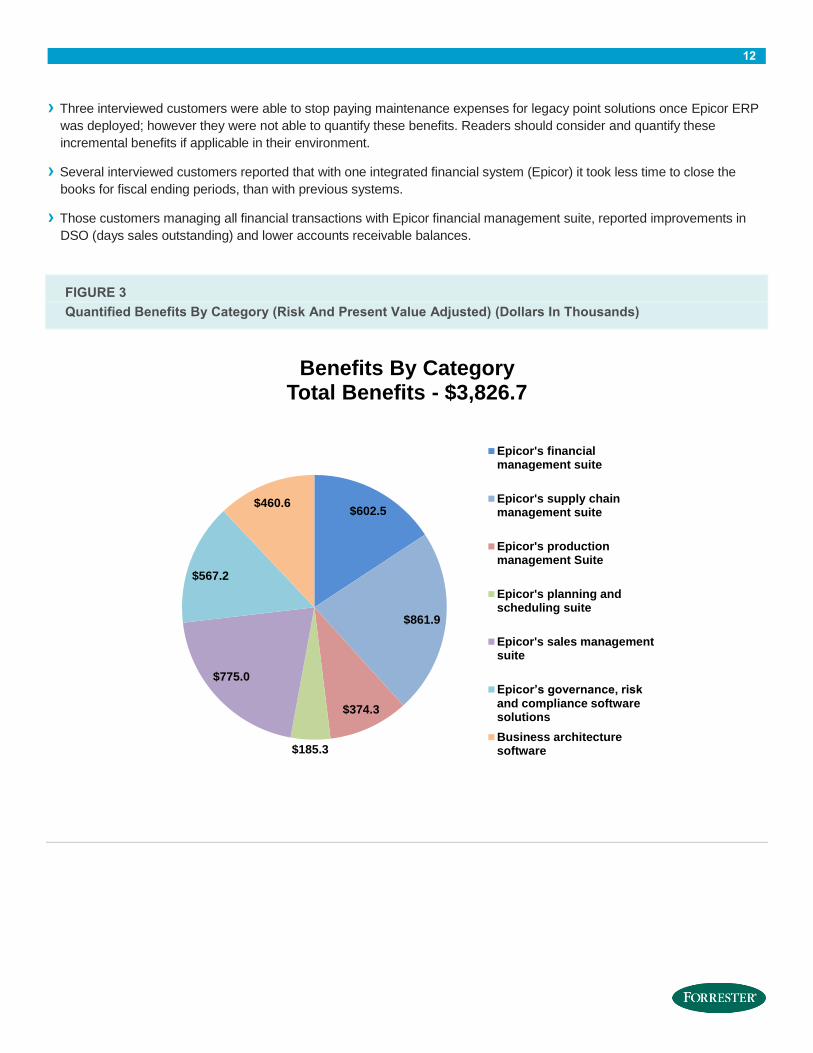
FIGURE 3
Quantified Benefits By Category (Risk And Present Value Adjusted) (Dollars In Thousands)
$602.5
$861.9
$374.3
$185.3
$775.0
$567.2
$460.6
Benefits By Category Total Benefits - $3,826.7
Epicor's financialmanagement suite
Epicor's supply chainmanagement suite
Epicor's productionmanagement Suite
Epicor's planning andscheduling suite
Epicor's sales managementsuite
Epicor’s governance, risk and compliance software solutions
Business architecturesoftware
13
COSTS
Costs Associated With Epicor ERP
The Organization incurred costs in several categories associated with Epicor ERP:
› Planning and deploying Epicor — the internal labor associated with planning and implementing the Epicor solution was
significant. Two FTEs (head of manufacturing systems and a senior analyst) spent 100% of their time over a 15-month
period planning the implementation. The fully loaded average cost per FTE is $140,000 ($11,667 monthly) for a total labor
cost of $350,000 (2 FTEs*15 months*$11,667) as an initial investment period expense.
› Hardware requirements to support Epicor version 9 implementation. The Organization had to upgrade its server
infrastructure to accommodate the Epicor ERP system. It purchased four servers at a fully loaded cost of $25,000 each for
a total hardware, operating systems license, and maintenance cost of $100,000.
o Note: Deployment for Epicor ERP version 10 will require substantially less (50%) hardware cost. And
hardware is not needed with SaaS/cloud Epicor ERP.
› Epicor costs — the Organization will incur the following Epicor software license, maintenance, professional services, and
training costs totaling $373,000. See Appendix A for more information about Epicor ERP.
• Epicor professional implementation services and training (initial).
• Epicor ERP license and ongoing maintenance (initial).
• Epicor implementation and training (initial).
• Epicor Knowledge Mentor license (Year 1) and maintenance fees (years 1 to 5). This helps improve user adoptions
by developing end user training specific to the Organization’s processes and end user roles.
• Epicor Advanced Financial Reporting license (Year 2) and maintenance (years 2 to 5). This advanced functionality
allows the creation and distribution of professional financial reports to company stakeholders. It allows the
management and viewing of financial data in a user-friendly and easy-to-use environment.
• Epicor Enterprise Search license (Year 3) and maintenance (years 3 to 5). Epicor Enterprise Search delivers a
familiar search engine capability that brings the personal Internet experience to the workplace, with a
comprehensive search that is both embedded within Prophet 21 and available for use within popular web browsers.
• Epicor Service Connect license (Year 5) and maintenance (Year 5). Epicor Service Connect is a business
integration platform, functioning as a central integration point for secure workflow orchestrations within Epicor
applications, as well as external connectivity to Epicor and non-Epicor applications.
› Ongoing operations — the Organization requires two FTEs to maintain and enhance the Epicor ERP system. The fully
loaded average cost per FTE is $140,000 or $280,000 as an initial investment period expense.
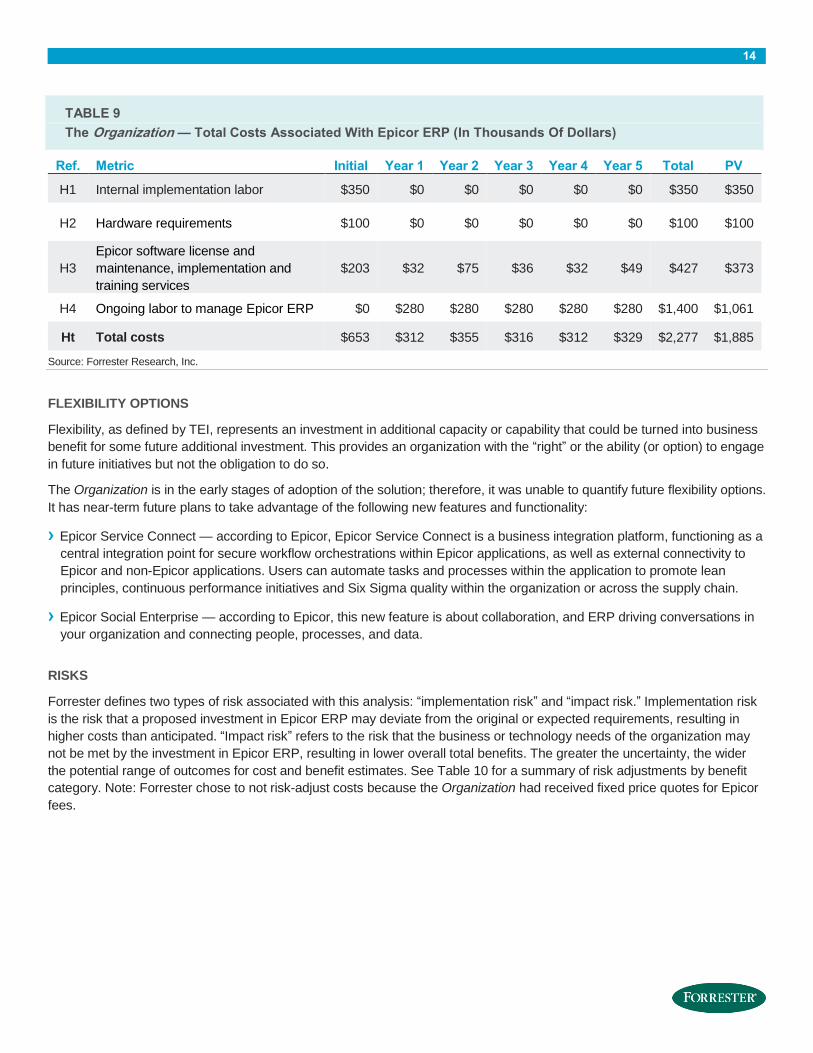
Table 9 shows the total of all costs as well as associated present values, discounted at 10%. Over five years, the
Organization expects costs to total $2,276,600 with a present value of $1,884,500. Forrester chose to not risk-adjust costs
because the Organization had received fixed price quotes for Epicor ERP costs.
14
TABLE 9
The Organization — Total Costs Associated With Epicor ERP (In Thousands Of Dollars)
Ref. Metric Initial Year 1 Year 2 Year 3 Year 4 Year 5 Total PV
H1 Internal implementation labor $350 $0 $0 $0 $0 $0 $350 $350
H2 Hardware requirements $100 $0 $0 $0 $0 $0 $100 $100
H3
Epicor software license and
maintenance, implementation and
training services
$203 $32 $75 $36 $32 $49 $427 $373
H4 Ongoing labor to manage Epicor ERP $0 $280 $280 $280 $280 $280 $1,400 $1,061
Ht Total costs $653 $312 $355 $316 $312 $329 $2,277 $1,885
Source: Forrester Research, Inc.
FLEXIBILITY OPTIONS
Flexibility, as defined by TEI, represents an investment in additional capacity or capability that could be turned into business
benefit for some future additional investment. This provides an organization with the “right” or the ability (or option) to engage
in future initiatives but not the obligation to do so.
The Organization is in the early stages of adoption of the solution; therefore, it was unable to quantify future flexibility options.
It has near-term future plans to take advantage of the following new features and functionality:
› Epicor Service Connect — according to Epicor, Epicor Service Connect is a business integration platform, functioning as a
central integration point for secure workflow orchestrations within Epicor applications, as well as external connectivity to
Epicor and non-Epicor applications. Users can automate tasks and processes within the application to promote lean
principles, continuous performance initiatives and Six Sigma quality within the organization or across the supply chain.
› Epicor Social Enterprise — according to Epicor, this new feature is about collaboration, and ERP driving conversations in
your organization and connecting people, processes, and data.
RISKS
Forrester defines two types of risk associated with this analysis: “implementation risk” and “impact risk.” Implementation risk
is the risk that a proposed investment in Epicor ERP may deviate from the original or expected requirements, resulting in
higher costs than anticipated. “Impact risk” refers to the risk that the business or technology needs of the organization may
not be met by the investment in Epicor ERP, resulting in lower overall total benefits. The greater the uncertainty, the wider
the potential range of outcomes for cost and benefit estimates. See Table 10 for a summary of risk adjustments by benefit
category. Note: Forrester chose to not risk-adjust costs because the Organization had received fixed price quotes for Epicor
fees.

15
TABLE 10
Benefit And Cost Risk Adjustments
Benefit Categories Adjustment
Epicor’s financial management suite 15%
Epicor’s supply chain management suite 15%
Epicor’s production management suite 15%
Epicor’s planning and scheduling suite 15%
Epicor’s sales management suite 15%
Epicor’s governance, risk, and compliance software solutions 15%
Epicor’s Business Architecture 15%
Costs Adjustment
(Costs were not risk-adjusted) 0%
Source: Forrester Research, Inc.
Highlighting risk by adjusting the costs and benefits produces more-meaningful and accurate estimates, and a more accurate
projection of the ROI. In general, risks affect costs by raising the original estimates, and they affect benefits by reducing the
original estimates. The risk-adjusted numbers should be taken as “realistic” expectations since they represent the expected
values considering risk.
The following implementation risk that affects costs is identified as part of this analysis:
› Licensing and maintenance. Although Forrester did not risk-adjust licensing and maintenance fees, other organizations’
costs may vary due to discounts.
The following impact risks that affect benefits are identified as part
of the analysis:
› The Organization is a composite of the six interviewed
customers. There are only two customers (out of six) using the
breadth of suites and functionality outlined in this case study for
the composite Organization. Each interviewed customer was
unique in the Epicor ERP suites, features, and functionality it was
utilizing. The benefits quantified in this study are highly
dependent on how quickly and fully customers integrate Epicor
ERP into their legacy systems and process. Due to this variable
uncertainty each benefit was risk-adjusted (reduced) by 15%.
Table 10 shows the values used to adjust for risk and uncertainty in
the cost and benefit estimates. The TEI model uses a triangular
distribution method to calculate risk-adjusted values. To construct
the distribution, it is necessary to first estimate the low, most likely,
and high values that could occur within the current environment.
The risk-adjusted value is the mean of the distribution of those
points. Readers are urged to apply their own risk ranges based on
their own degree of confidence in the cost and benefit estimates.
Forrester interviewer: Were
there any risks you feel you
took investing in Epicor ERP?
Answer: “The biggest risk was
in not doing Epicor ERP. Our
disparate legacy systems
weren’t integrated, and it was
impeding our ability to
compete in our marketplace.” ~ERP manager, US-based design, engineering
and manufacturing company

16
Financial Summary
The financial results calculated in the Benefits and Costs sections can be used to determine the ROI, NPV, and payback
period for the Organization’s investment in Epicor ERP.
Table 11 below shows the risk-adjusted ROI, NPV, and payback period values. The cost and benefits values are from
summary Tables 8 and 9.
TABLE 11
Cash Flow: Risk-Adjusted
Initial Year 1 Year 2 Year 3 Year 4 Year 5 Total Present value
Costs -$653.1 -$311.8 -$354.7 -$316.1 -$312.0 -$328.9 -$2,276.6 -$1,884.5
Benefits $0.0 $800.3 $947.3 $1,068.9 $1,130.9 $1,193.0 $5,140.5 $3,826.7
Net benefits -$653.1 $488.5 $592.6 $752.8 $818.9 $864.1 $2,863.9 $1,942.2
ROI 103%
Payback period 15 months
Source: Forrester Research, Inc.
The ROI was a very favorable 103%. If risk-adjusted costs, benefits, and ROI still demonstrate a compelling business case, it
raises confidence that the investment is likely to succeed because the risks that threaten the project have been taken into
-$1,000.0
-$500.0
$0.0
$500.0
$1,000.0
$1,500.0
$2,000.0
$2,500.0
$3,000.0
$3,500.0
Initial Year 1 Year 2 Year 3 Year 4 Year 5
Cas
h F
low
s
Cash Flow Analysis (risk-adjusted)
Total Costs Total Benefits Cumulative Total

17
consideration and quantified. The risk-adjusted numbers should be taken as “realistic” expectations, as they represent the
expected value considering risk. Assuming normal success at mitigating risk, the risk-adjusted numbers should more closely
reflect the expected outcome of the investment.
18
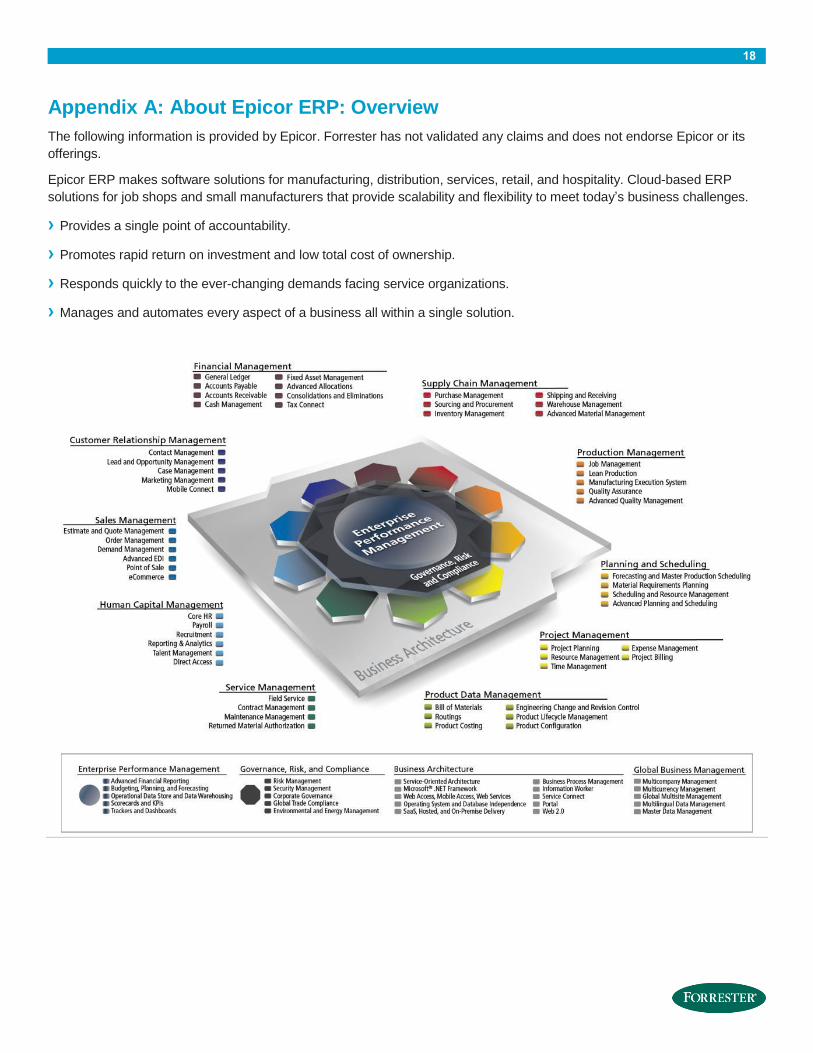
Appendix A: About Epicor ERP: Overview
The following information is provided by Epicor. Forrester has not validated any claims and does not endorse Epicor or its
offerings.
Epicor ERP makes software solutions for manufacturing, distribution, services, retail, and hospitality. Cloud-based ERP
solutions for job shops and small manufacturers that provide scalability and flexibility to meet today’s business challenges.
› Provides a single point of accountability.
› Promotes rapid return on investment and low total cost of ownership.
› Responds quickly to the ever-changing demands facing service organizations.
› Manages and automates every aspect of a business all within a single solution.
19
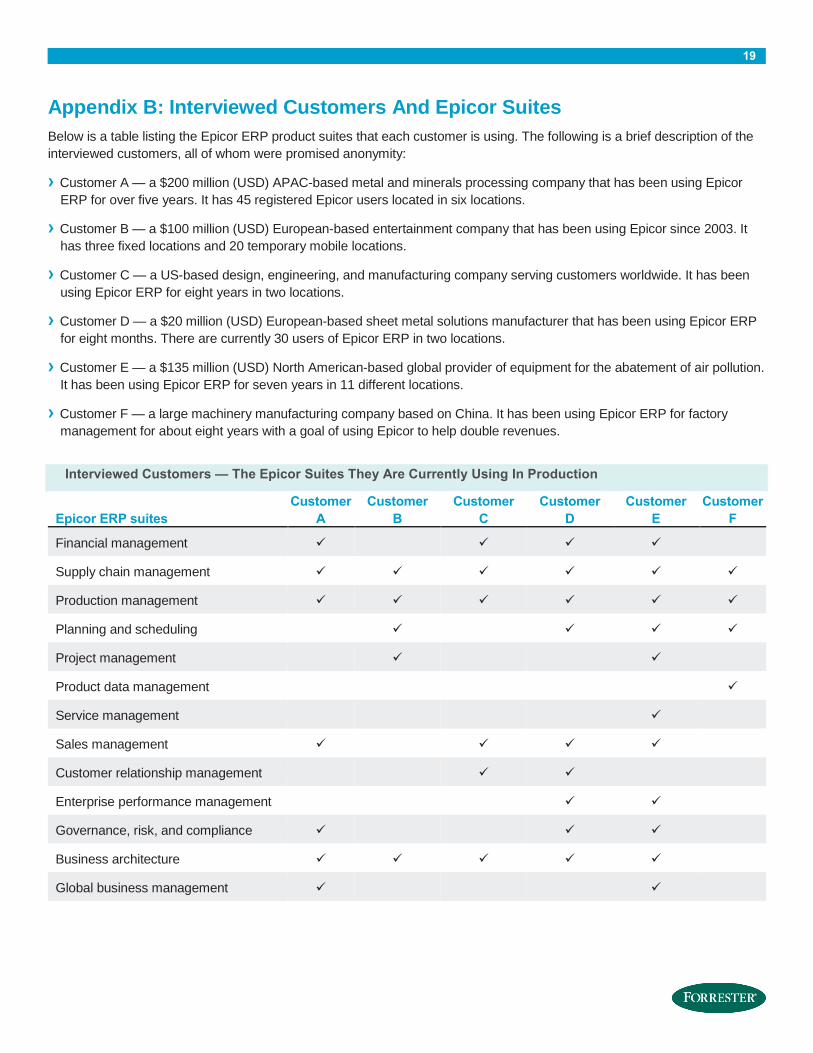
Appendix B: Interviewed Customers And Epicor Suites
Below is a table listing the Epicor ERP product suites that each customer is using. The following is a brief description of the
interviewed customers, all of whom were promised anonymity:
› Customer A — a $200 million (USD) APAC-based metal and minerals processing company that has been using Epicor
ERP for over five years. It has 45 registered Epicor users located in six locations.
› Customer B — a $100 million (USD) European-based entertainment company that has been using Epicor since 2003. It
has three fixed locations and 20 temporary mobile locations.
› Customer C — a US-based design, engineering, and manufacturing company serving customers worldwide. It has been
using Epicor ERP for eight years in two locations.
› Customer D — a $20 million (USD) European-based sheet metal solutions manufacturer that has been using Epicor ERP
for eight months. There are currently 30 users of Epicor ERP in two locations.
› Customer E — a $135 million (USD) North American-based global provider of equipment for the abatement of air pollution.
It has been using Epicor ERP for seven years in 11 different locations.
› Customer F — a large machinery manufacturing company based on China. It has been using Epicor ERP for factory
management for about eight years with a goal of using Epicor to help double revenues.
Interviewed Customers — The Epicor Suites They Are Currently Using In Production
Epicor ERP suites
Customer
A
Customer
B
Customer
C
Customer
D
Customer
E
Customer
F
Financial management
Supply chain management
Production management
Planning and scheduling
Project management
Product data management
Service management
Sales management
Customer relationship management
Enterprise performance management
Governance, risk, and compliance
Business architecture
Global business management
20
Appendix C: Total Economic Impact™ Overview
Total Economic Impact is a methodology developed by Forrester Research that enhances a company’s technology decision-
making processes and assists vendors in communicating the value proposition of their products and services to clients. The
TEI methodology helps companies demonstrate, justify, and realize the tangible value of IT initiatives to both senior
management and other key business stakeholders.
The TEI methodology consists of four components to evaluate investment value: benefits, costs, flexibility, and risks.
BENEFITS
Benefits represent the value delivered to the user organization — IT and/or business units — by the proposed product or
project. Often, product or project justification exercises focus just on IT cost and cost reduction, leaving little room to analyze
the effect of the technology on the entire organization. The TEI methodology and the resulting financial model place equal
weight on the measure of benefits and the measure of costs, allowing for a full examination of the effect of the technology on
the entire organization. Calculation of benefit estimates involves a clear dialogue with the user organization to understand
the specific value that is created. In addition, Forrester also requires that there be a clear line of accountability established
between the measurement and justification of benefit estimates after the project has been completed. This ensures that
benefit estimates tie back directly to the bottom line.
COSTS
Costs represent the investment necessary to capture the value, or benefits, of the proposed project. IT or the business units
may incur costs in the form of fully burdened labor, subcontractors, or materials. Costs consider all the investments and
expenses necessary to deliver the proposed value. In addition, the cost category within TEI captures any incremental costs
over the existing environment for ongoing costs associated with the solution. All costs must be tied to the benefits that are
created.
FLEXIBILITY
Within the TEI methodology, direct benefits represent one part of the investment value. While direct benefits can typically be
the primary way to justify a project, Forrester believes that organizations should be able to measure the strategic value of an
investment. Flexibility represents the value that can be obtained for some future additional investment building on top of the
initial investment already made. For instance, an investment in an enterprisewide upgrade of an office productivity suite can
potentially increase standardization (to increase efficiency) and reduce licensing costs. However, an embedded collaboration
feature may translate to greater worker productivity if activated. The collaboration can only be used with additional
investment in training at some future point. However, having the ability to capture that benefit has a PV that can be
estimated. The flexibility component of TEI captures that value.
RISKS
Risks measure the uncertainty of benefit and cost estimates contained within the investment. Uncertainty is measured in two
ways: 1) the likelihood that the cost and benefit estimates will meet the original projections, and 2) the likelihood that the
estimates will be measured and tracked over time. TEI applies a probability density function known as “triangular distribution”
to the values entered. At a minimum, three values are calculated to estimate the underlying range around each cost and
benefit.
21
Appendix D: Glossary
Discount rate: The interest rate used in cash flow analysis to take into account the time value of money. Although the
Federal Reserve Bank sets a discount rate, companies often set a discount rate based on their business and investment
environment. Forrester assumes a yearly discount rate of 10% for this analysis. Organizations typically use discount rates
between 8% and 16% based on their current environment. Readers are urged to consult their respective organizations to
determine the most appropriate discount rate to use in their own environment.
Net present value (NPV): The present or current value of (discounted) future net cash flows given an interest rate (the
discount rate). A positive project NPV normally indicates that the investment should be made, unless other projects have
higher NPVs.
Present value (PV): The present or current value of (discounted) cost and benefit estimates given at an interest rate (the
discount rate). The PV of costs and benefits feed into the total NPV of cash flows.
Payback period: The breakeven point for an investment. This is the point in time at which net benefits (benefits minus costs)
equal initial investment or cost.
Return on investment (ROI): A measure of a project’s expected return in percentage terms. ROI is calculated by dividing
net benefits (benefits minus costs) by costs.
A NOTE ON CASH FLOW TABLES
The following is a note on the cash flow tables used in this study (see the example table below). The initial investment
column contains costs incurred at “time 0” or at the beginning of Year 1. Those costs are not discounted. All other cash flows
in Years 1 through 3 are discounted using the discount rate (shown in Framework Assumptions section) at the end of the
year. PV calculations are calculated for each total cost and benefit estimate. NPV calculations are not calculated until the
summary tables are the sum of the initial investment and the discounted cash flows in each year.
TABLE [EXAMPLE]
Example Table
Ref. Metric Calculation Year 1 Year 2 Year 3
Source: Forrester Research, Inc.
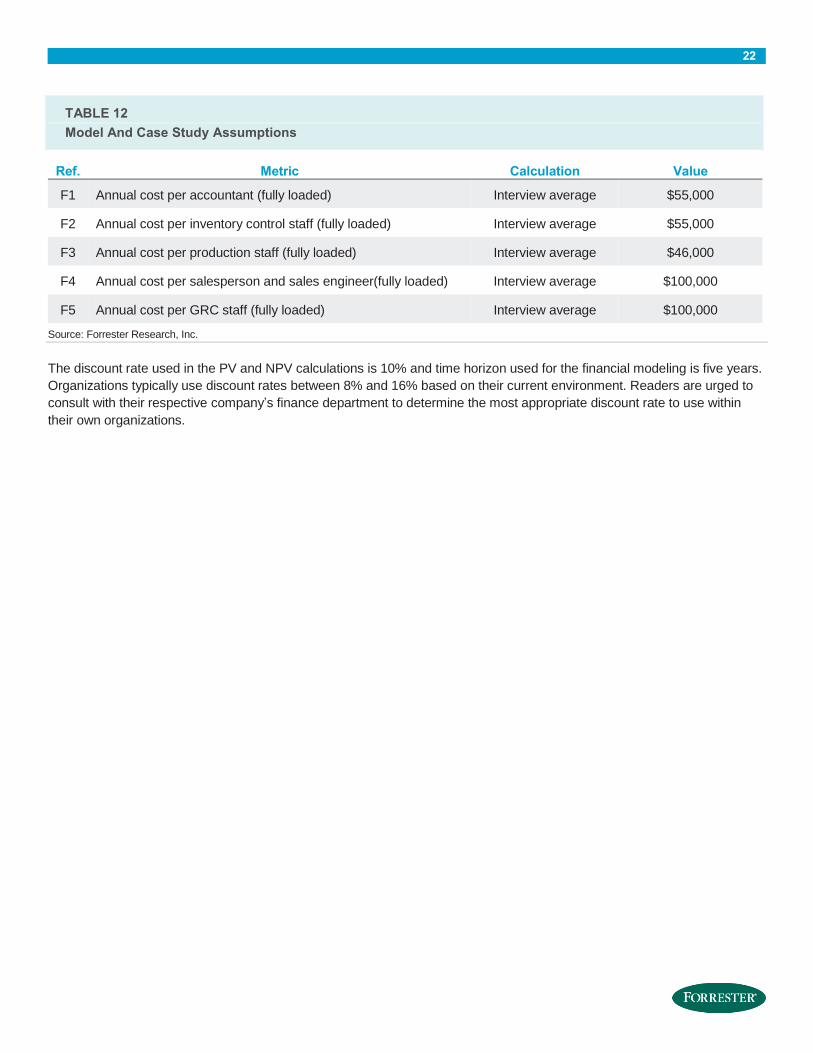
FRAMEWORK ASSUMPTIONS
Table 12 provides the model assumptions that Forrester used in this analysis.
22
TABLE 12
Model And Case Study Assumptions
Ref. Metric Calculation Value
F1 Annual cost per accountant (fully loaded) Interview average $55,000
F2 Annual cost per inventory control staff (fully loaded) Interview average $55,000
F3 Annual cost per production staff (fully loaded) Interview average $46,000
F4 Annual cost per salesperson and sales engineer(fully loaded) Interview average $100,000
F5 Annual cost per GRC staff (fully loaded) Interview average $100,000
Source: Forrester Research, Inc.
The discount rate used in the PV and NPV calculations is 10% and time horizon used for the financial modeling is five years.
Organizations typically use discount rates between 8% and 16% based on their current environment. Readers are urged to
consult with their respective company’s finance department to determine the most appropriate discount rate to use within
their own organizations.