Embed Size (px)
Citation preview
The State of Automotive Internet Marketing
Jeff TireyMongoose Metrics, CMO
May 16, 2012
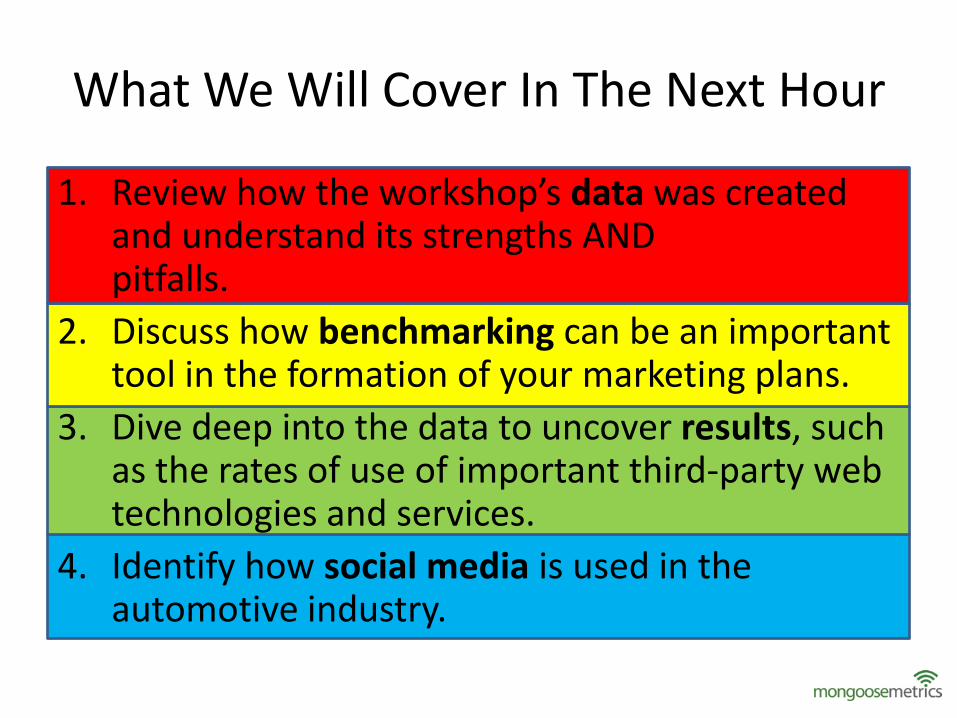
What We Will Cover In The Next Hour
1. Review how the workshop’s data was created and understand its strengths AND pitfalls.
2. Discuss how benchmarking can be an important tool in the formation of your marketing plans.
3. Dive deep into the data to uncover results, such as the rates of use of important third-party web technologies and services.
4. Identify how social media is used in the automotive industry.
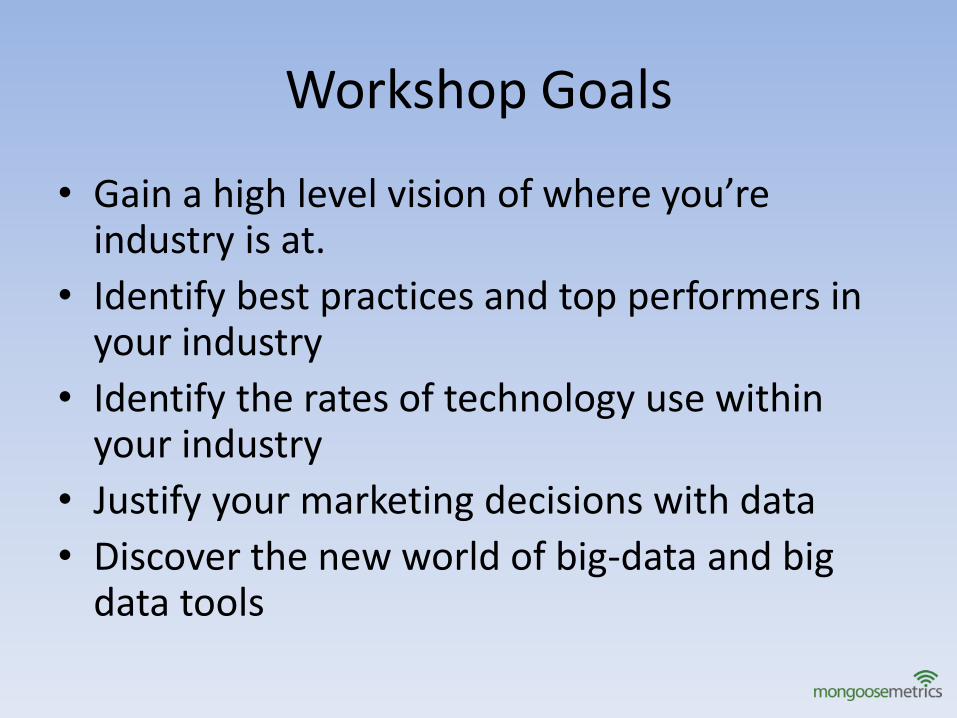
Workshop Goals
• Gain a high level vision of where you’re industry is at.
• Identify best practices and top performers in your industry
• Identify the rates of technology use within your industry
• Justify your marketing decisions with data
• Discover the new world of big-data and big data tools
Key Goal
More than anything…
I want you to understand at a high level what your industry is doing and have confidencewhen forming your own Internet marketing strategic plan.
… because, you’ll have the data to backup your decisions.

Best Of All
All the data we discuss in this workshop,
you will have full access to for your own further study.
About The Data
• Approximately 17,669 U.S. automotive dealer websites
• The data was built by first retrieving company information, including web address, using the Jigsaw.com API.
• With the website address, a website crawler visited each website and download the source-code of the homepage.
Part 1 – The Data
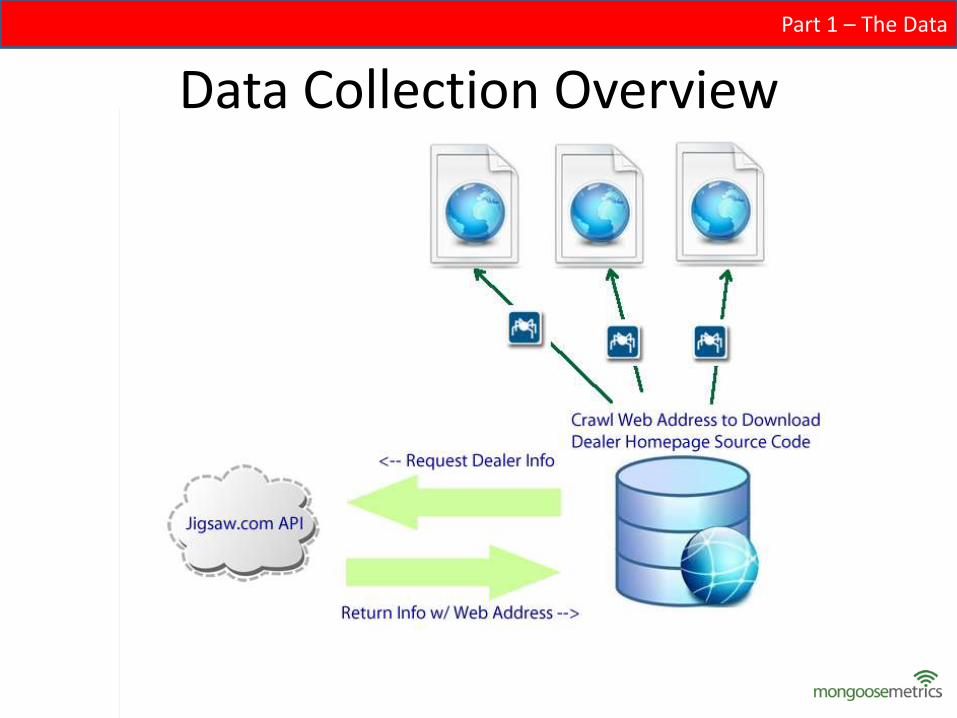
Data Collection Overview
Part 1 – The Data
To Be Clear
• The data-set only contains the homepage source code.
• Not the entire website.
• If a technology is not present on the homepage, it will not be found.
Part 1 – The Data
This Data Set is Not Perfect
• It’s only the homepage
• It contains rouge records introduced by Jigsaw through the incorrect categorization of companies
Part 1 – The Data
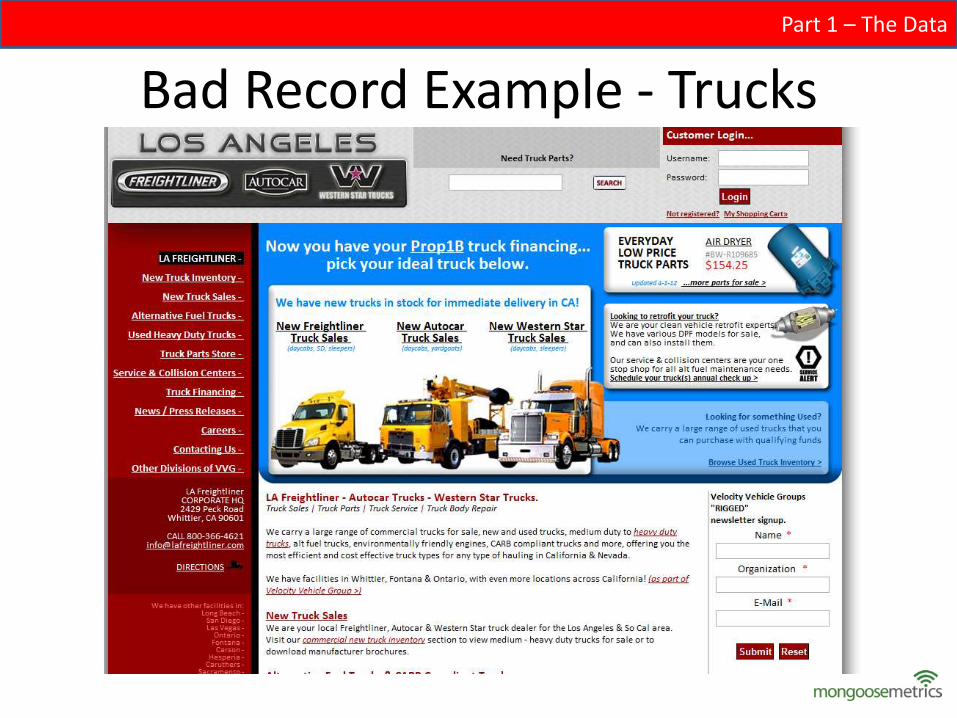
Bad Record Example - Trucks
Part 1 – The Data
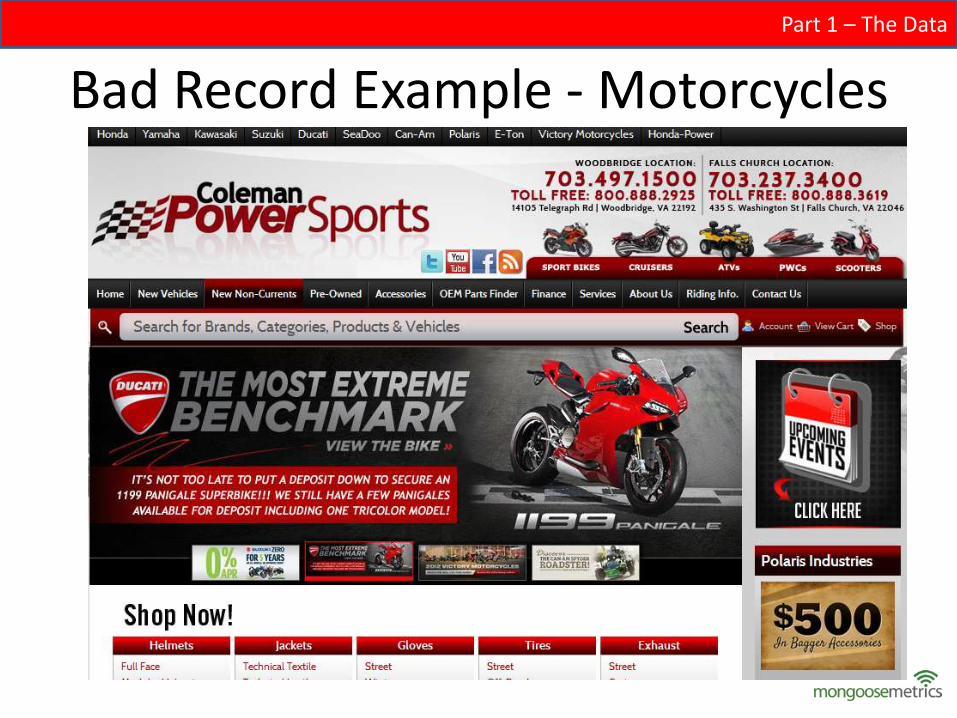
Bad Record Example - Motorcycles
Part 1 – The Data
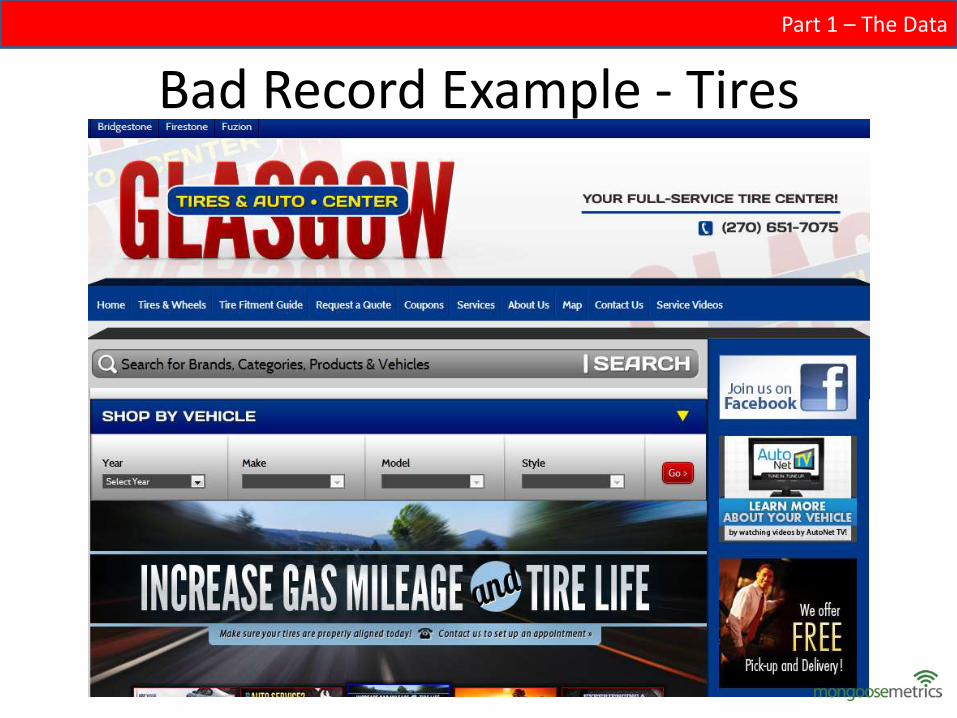
Bad Record Example - Tires
Part 1 – The Data
So How Can We Trust This Data?
• The API returned an initial dataset of 32,000 records.
• Approximately 15,000 records – about 46% of records -where purged through cleaning to bring the dataset to 17,669
• While stragglers remain in the record-set, they are low enough to not skew the findings.
• This is the nature of big-data. It’s big, but imperfect. (This is true for Hoovers and D&B.)
Part 1 – The Data
How do we know the study’s data-set is a good representation of all U.S.
automotive dealer websites?
Part 1 – The Data
NADA Industry Research
Part 1 – The Data
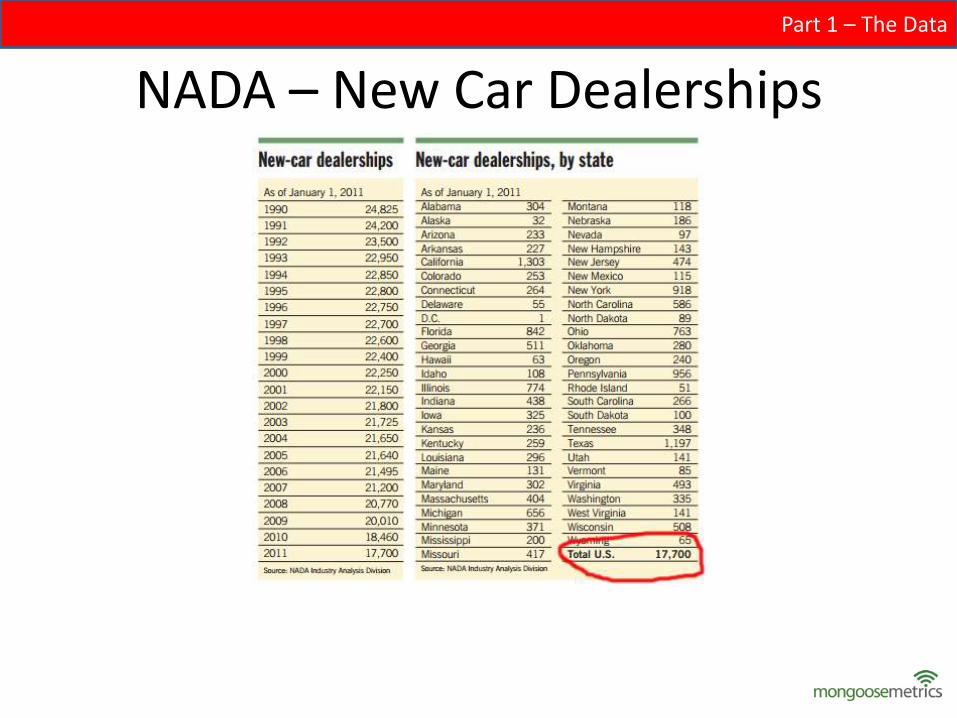
NADA – New Car Dealerships
Part 1 – The Data
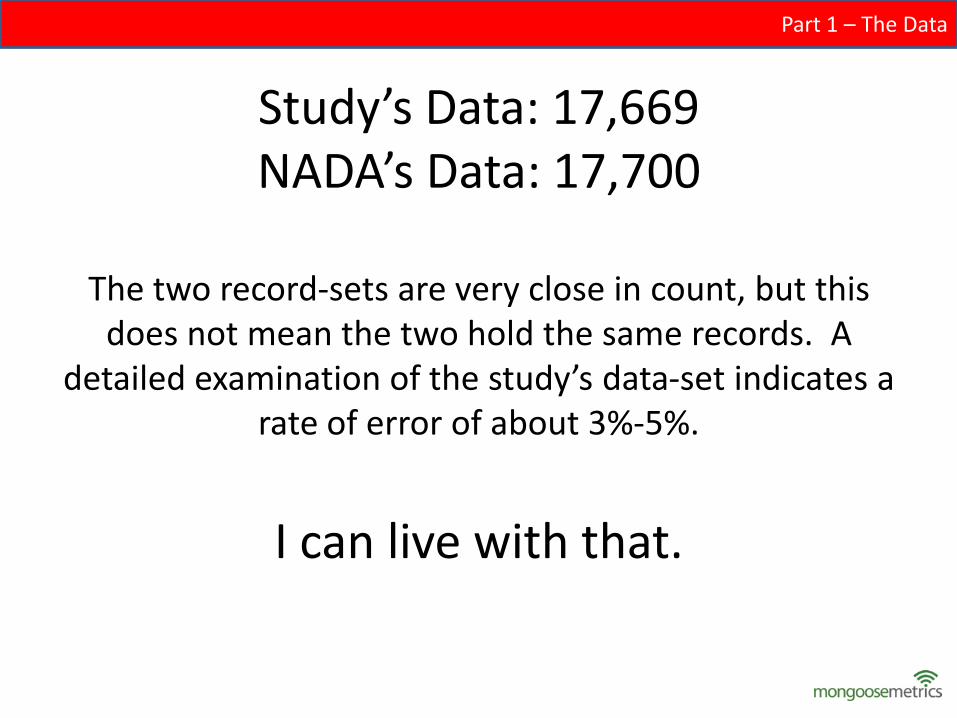
Study’s Data: 17,669NADA’s Data: 17,700
The two record-sets are very close in count, but this does not mean the two hold the same records. A
detailed examination of the study’s data-set indicates a rate of error of about 3%-5%.
I can live with that.
Part 1 – The Data
Ok, so we have the data... What do we do with it?
Part 1 – The Data
Benchmarking
• Benchmarking provides a moment in time snapshot of your business’s performance and helps you see clearly your position in a relation with a particular standard.
Part 2 – Benchmarking
Benchmarking Provides Context
• Context makes data relevant
• With context you can compare your company’s efforts to other companies in direct competition.
• Compare your company to best-performers in your industry
Part 2 – Benchmarking
Benchmarking Beware!
• Benchmarking does not tell you what to do.
• You need KPIs for that
Part 2 – Benchmarking
Develop Your Own KPIs
• What is not measured is not managed.
• KPIs define and measure progress
• Base KPIs on your own overall business goals
• Measure KPIs over time
• Example: If overall company goal is to increase customer service appointments, your KPI could be to increase existing customer social media engagement by 30%
Part 2 – Benchmarking
“We have the facts and we’re using them too”
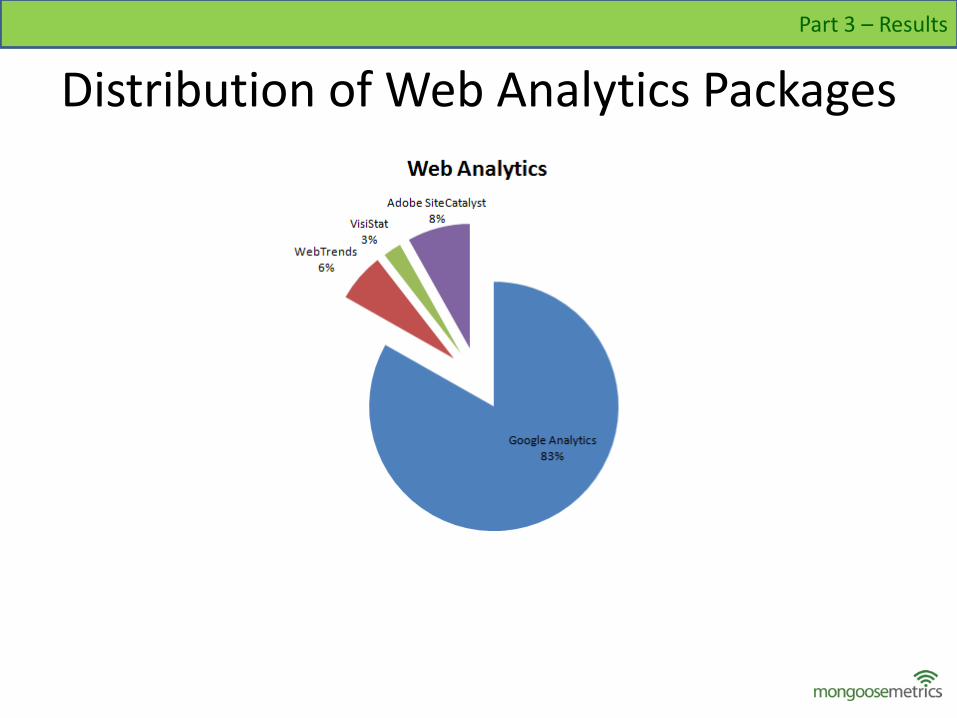
Distribution of Web Analytics Packages
Part 3 – Results
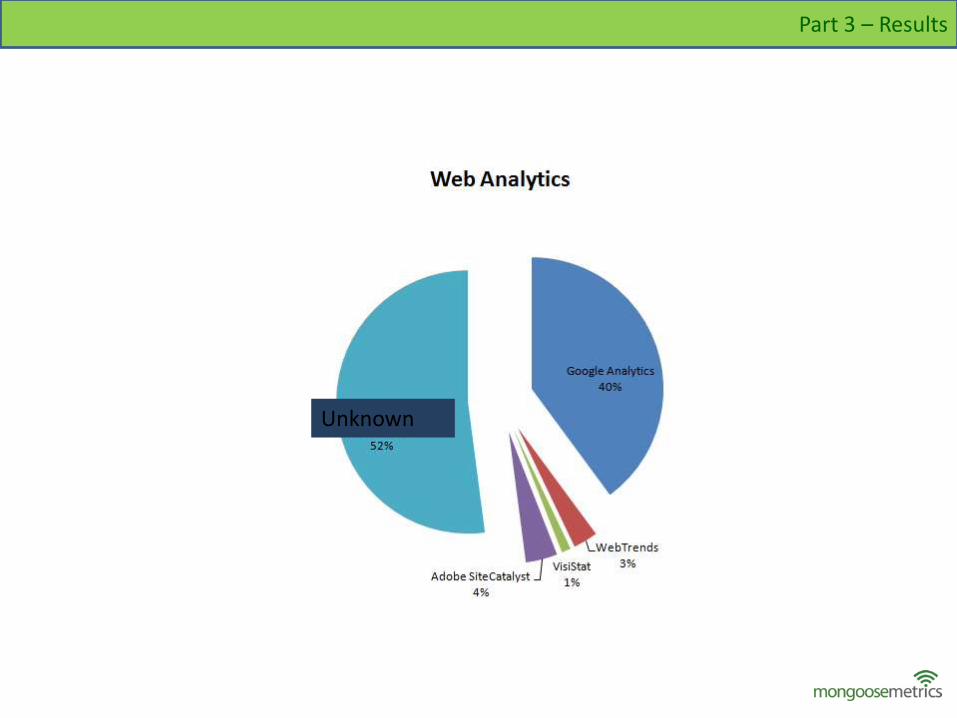
Part 3 – Results
Unknown
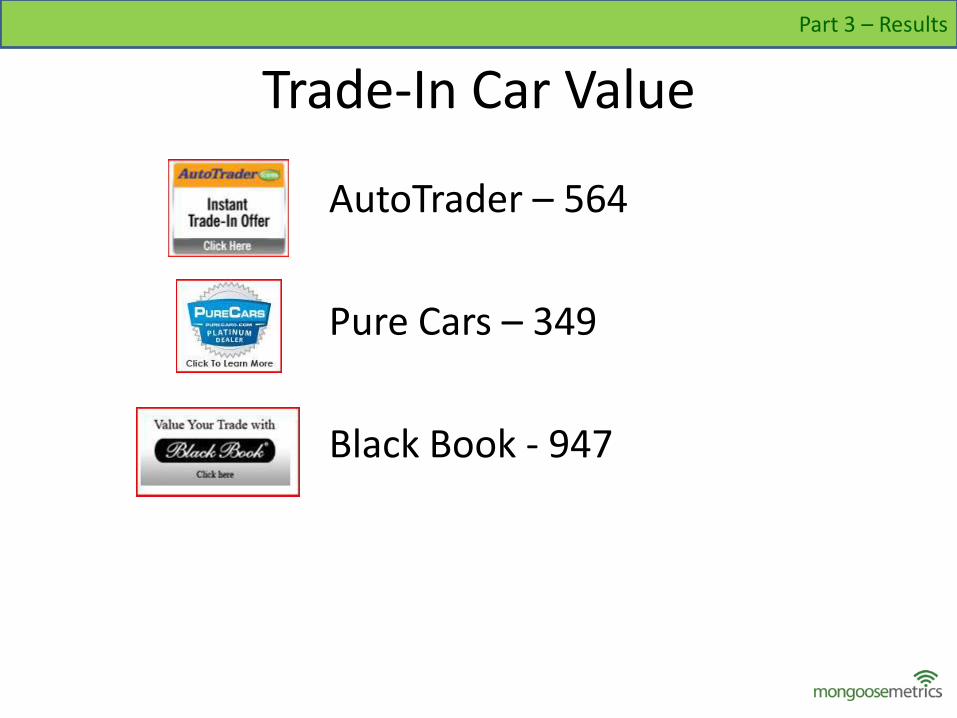
Trade-In Car Value
AutoTrader – 564
Pure Cars – 349
Black Book - 947
Part 3 – Results
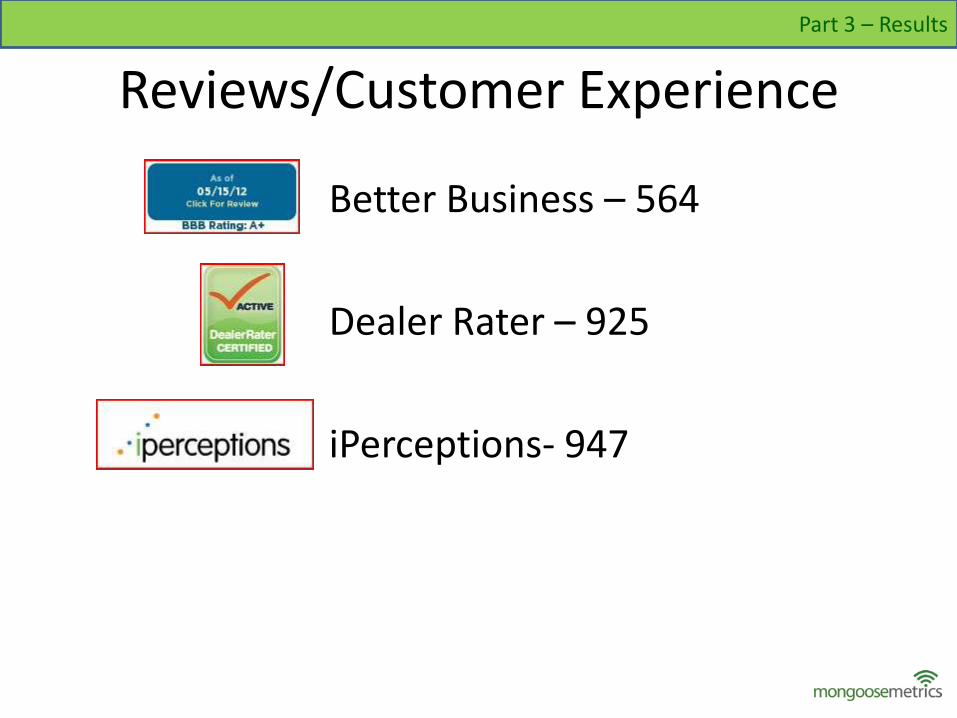
Reviews/Customer Experience
Better Business – 564
Dealer Rater – 925
iPerceptions- 947
Part 3 – Results
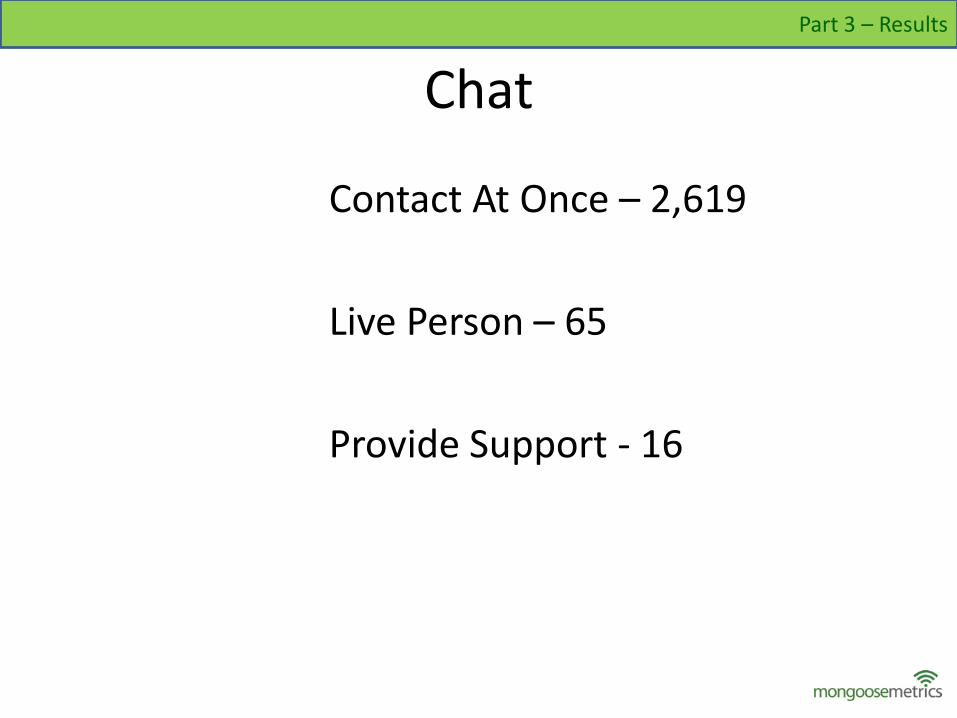
Chat
Contact At Once – 2,619
Live Person – 65
Provide Support - 16
Part 3 – Results
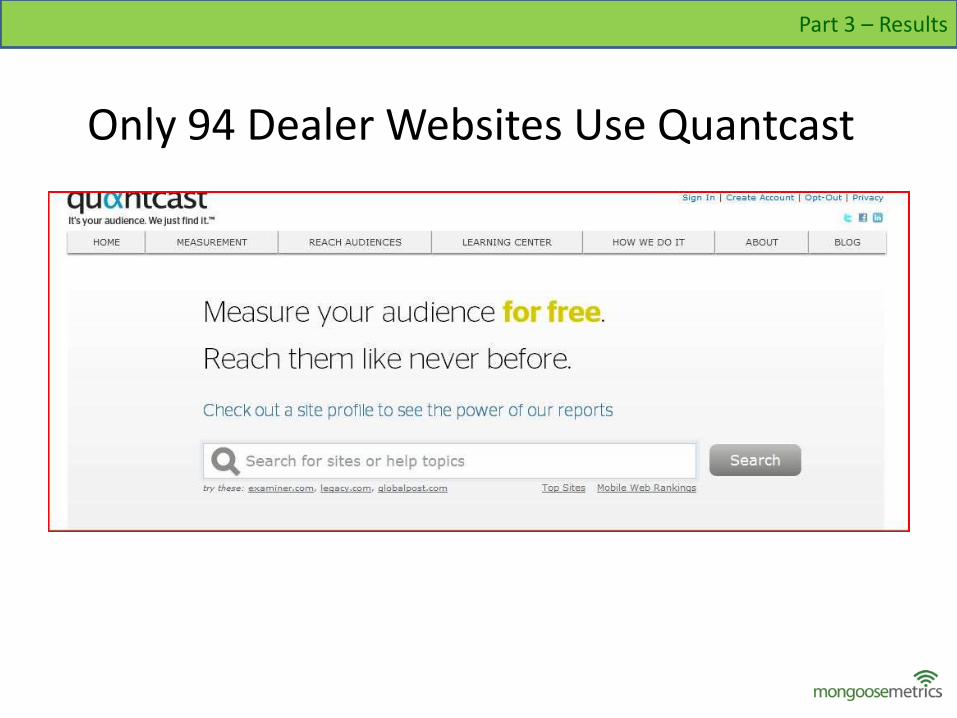
Only 94 Dealer Websites Use Quantcast
Part 3 – Results
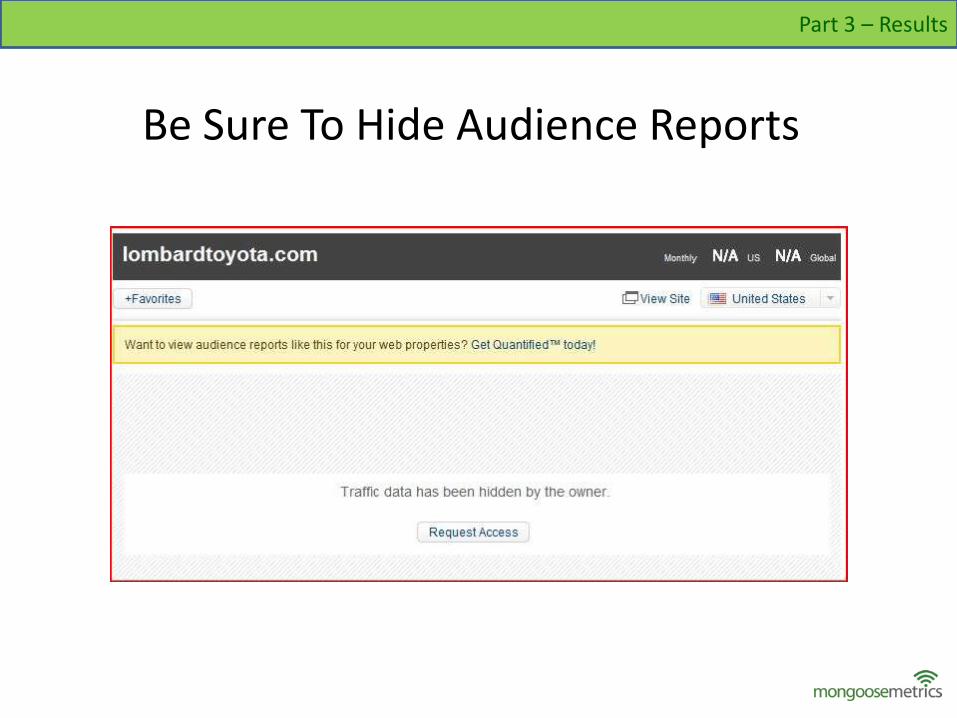
Be Sure To Hide Audience Reports
Part 3 – Results
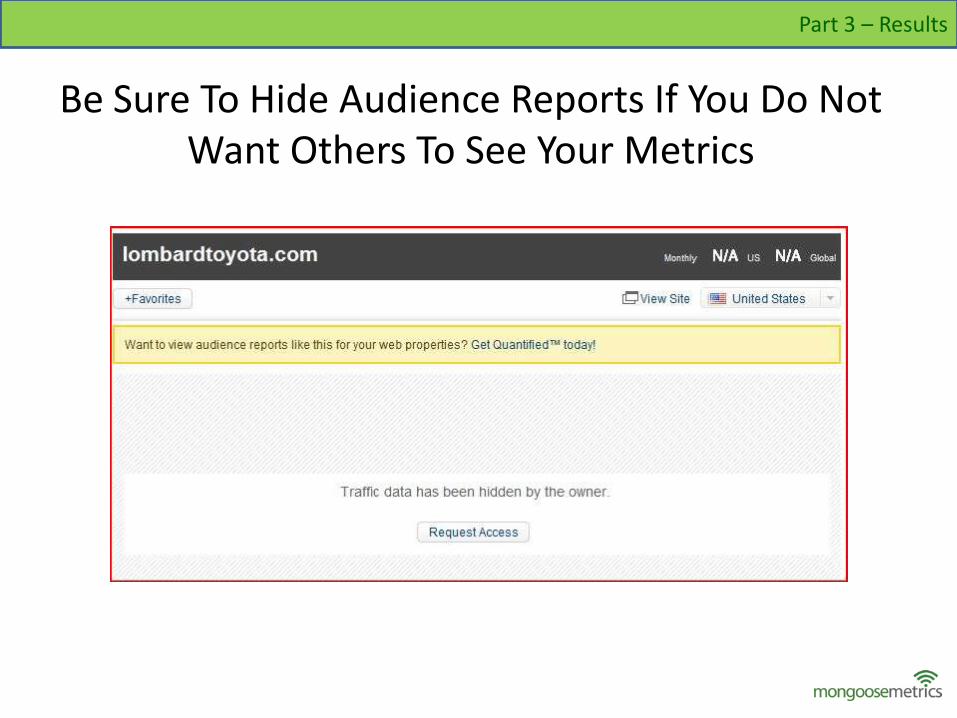
Be Sure To Hide Audience Reports If You Do Not Want Others To See Your Metrics
Part 3 – Results
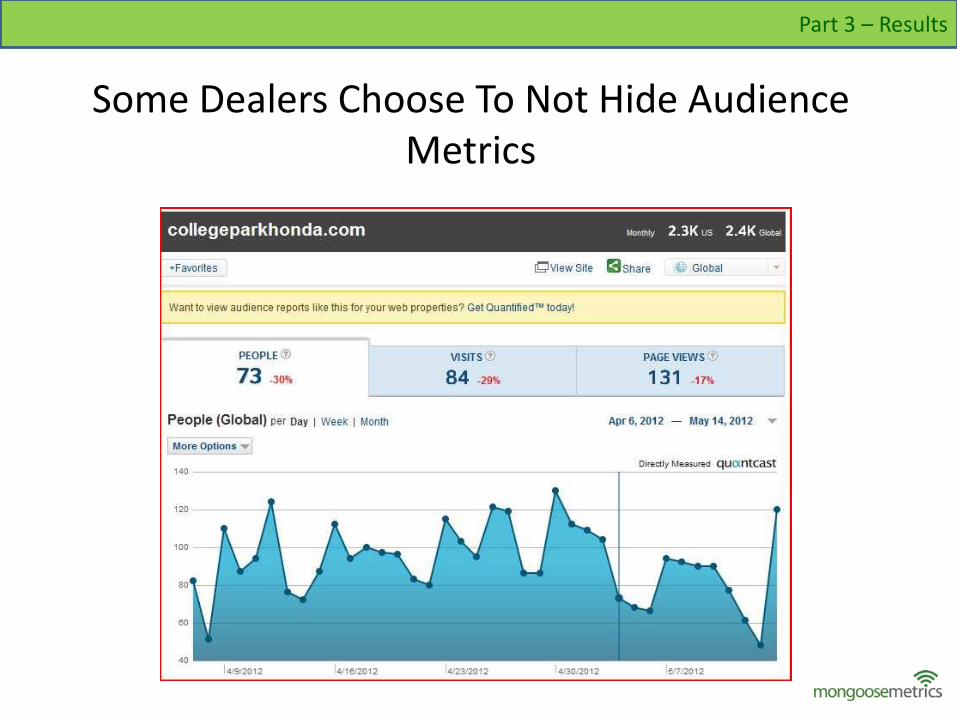
Some Dealers Choose To Not Hide Audience Metrics
Part 3 – Results
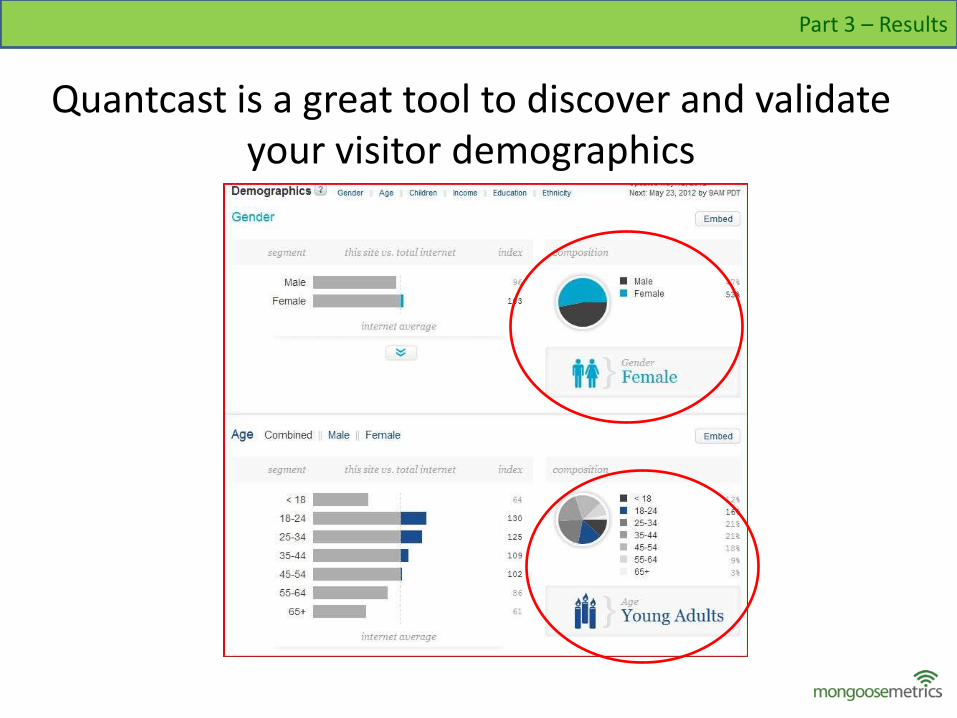
Quantcast is a great tool to discover and validate your visitor demographics
Part 3 – Results
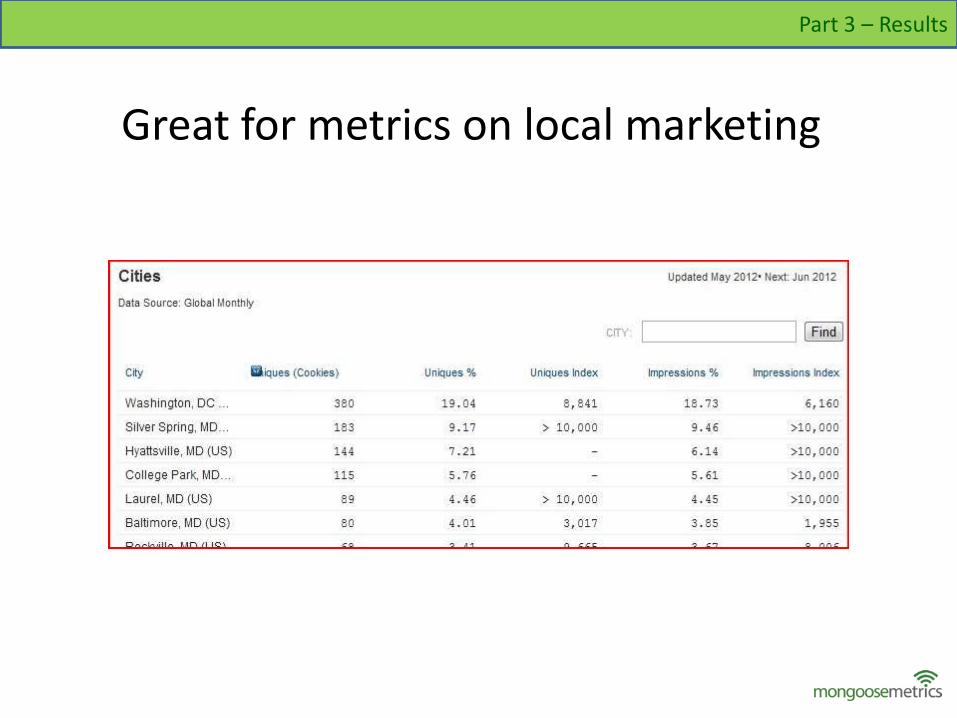
Great for metrics on local marketing
Part 3 – Results
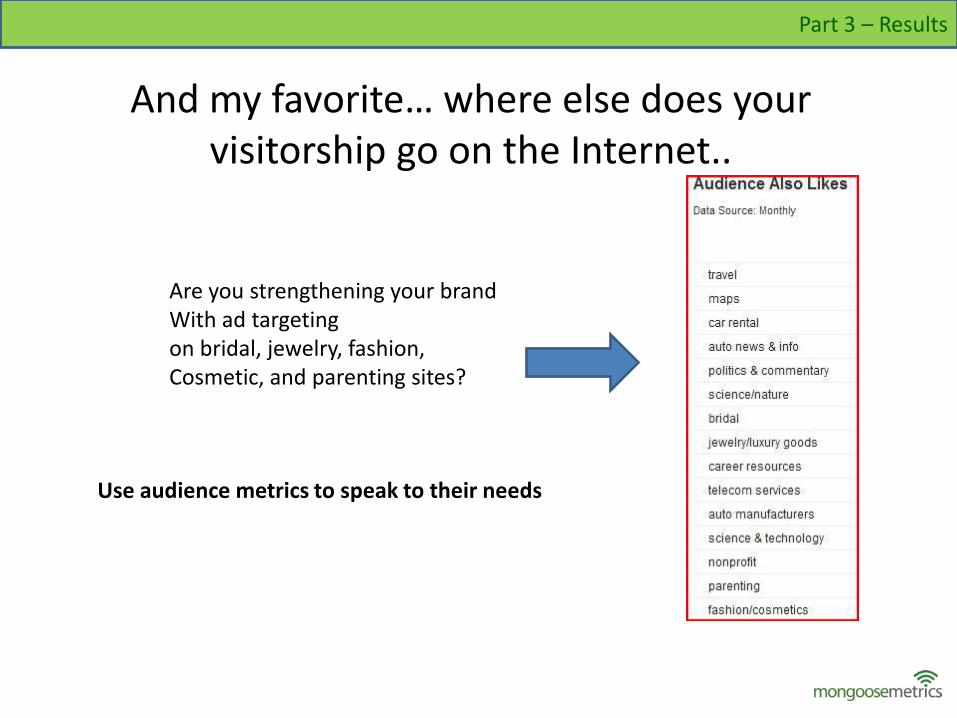
And my favorite… where else does your visitorship go on the Internet..
Part 3 – Results
Are you strengthening your brand With ad targetingon bridal, jewelry, fashion, Cosmetic, and parenting sites?
Use audience metrics to speak to their needs
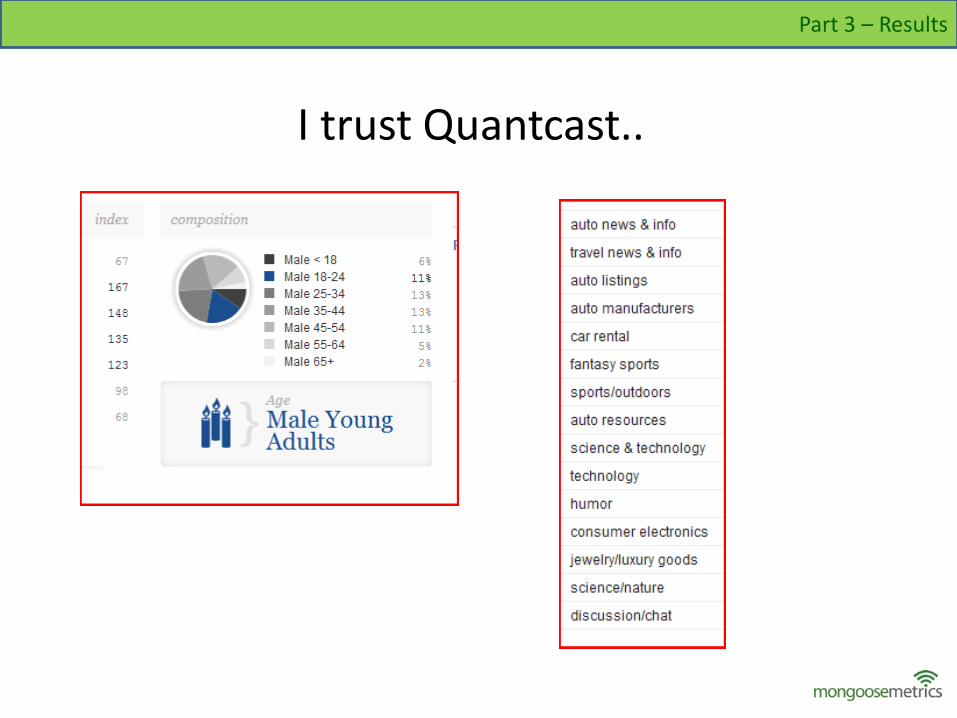
I trust Quantcast..
Part 3 – Results
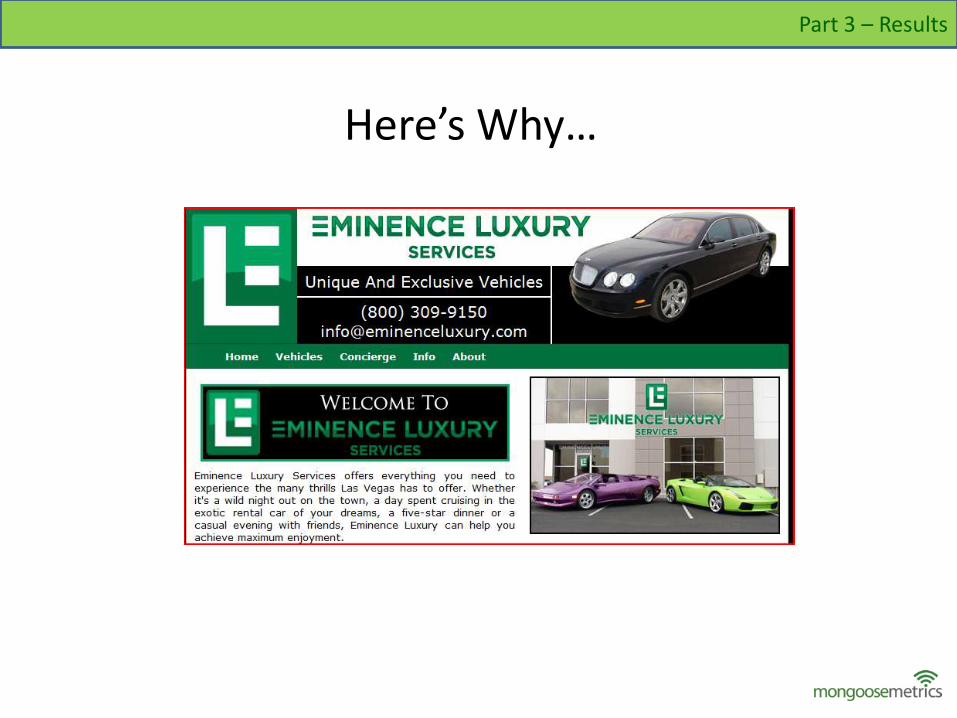
Here’s Why…
Part 3 – Results
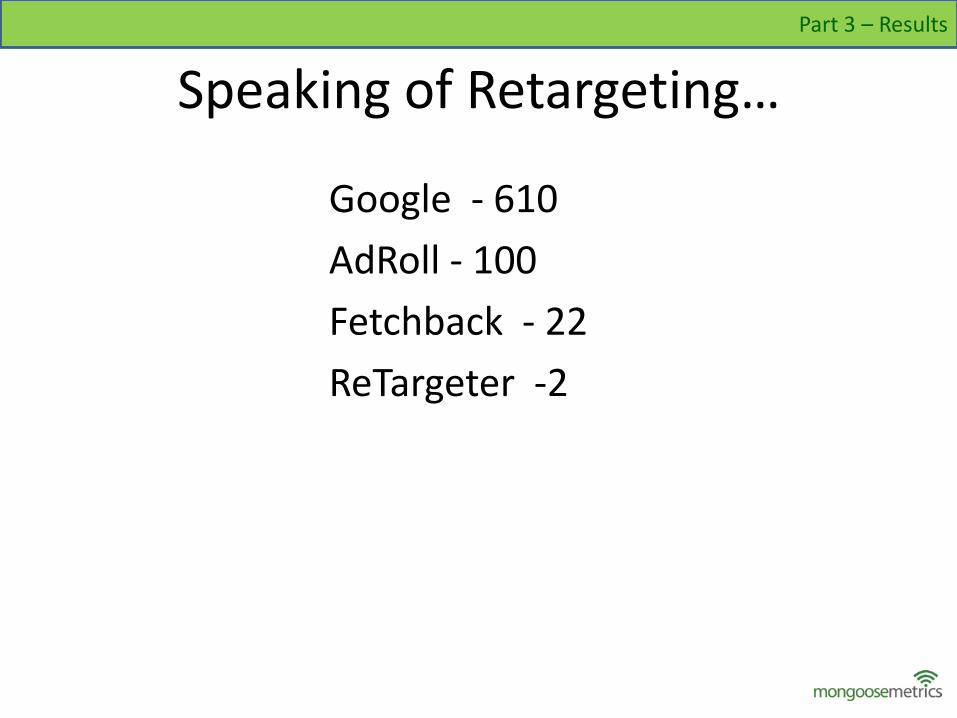
Speaking of Retargeting…
Google - 610
AdRoll - 100
Fetchback - 22
ReTargeter -2
Part 3 – Results
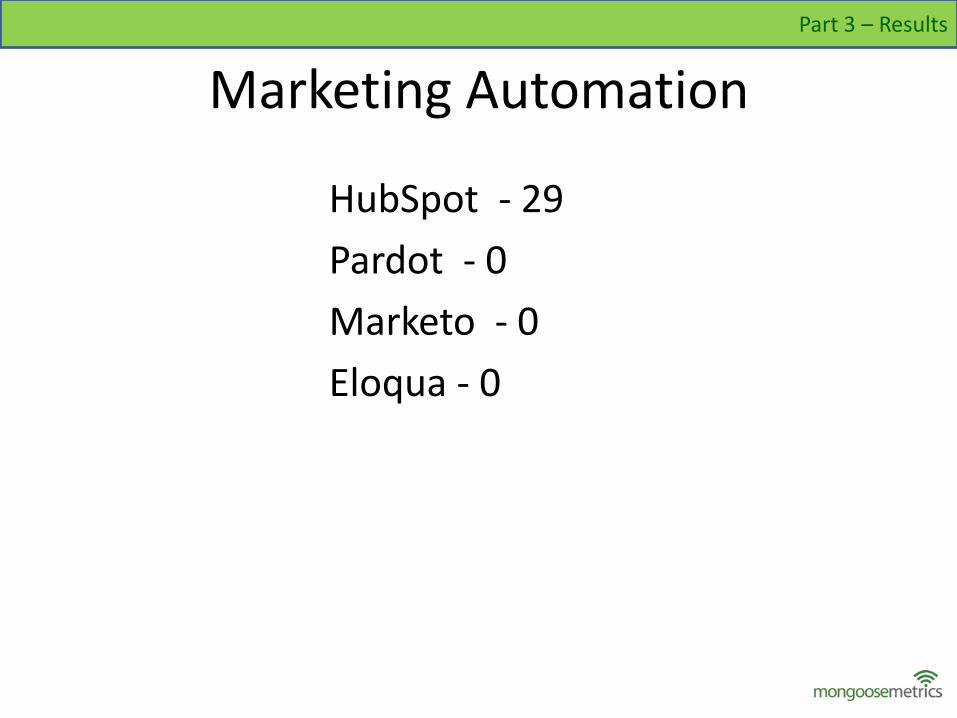
Marketing Automation
HubSpot - 29
Pardot - 0
Marketo - 0
Eloqua - 0
Part 3 – Results
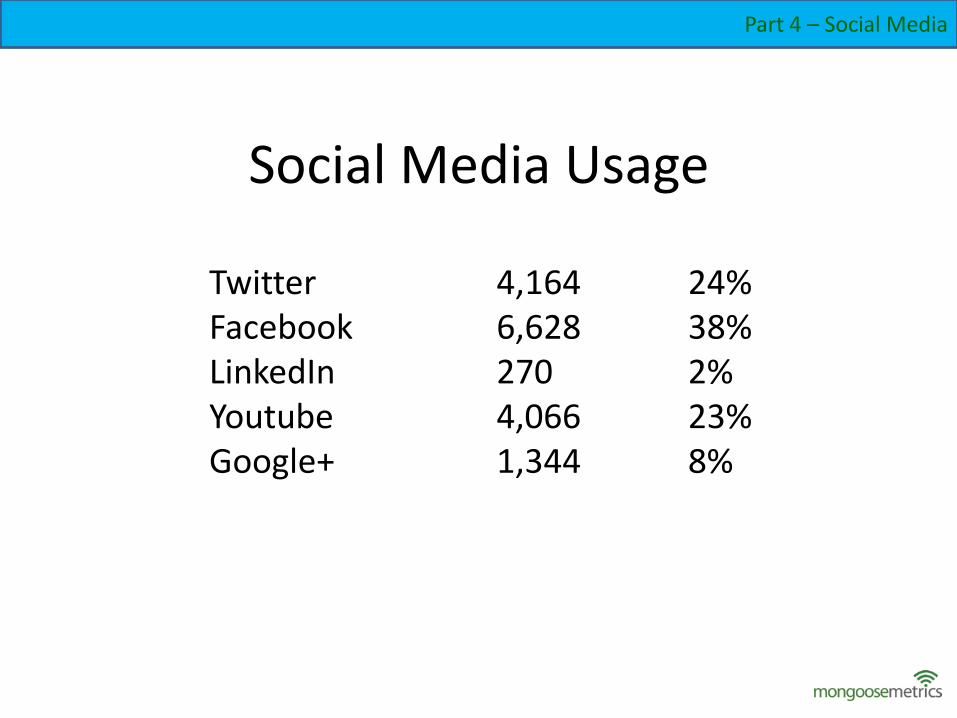
Social Media Usage
Twitter 4,164 24%Facebook 6,628 38%LinkedIn 270 2%Youtube 4,066 23%Google+ 1,344 8%
Part 4 – Social Media
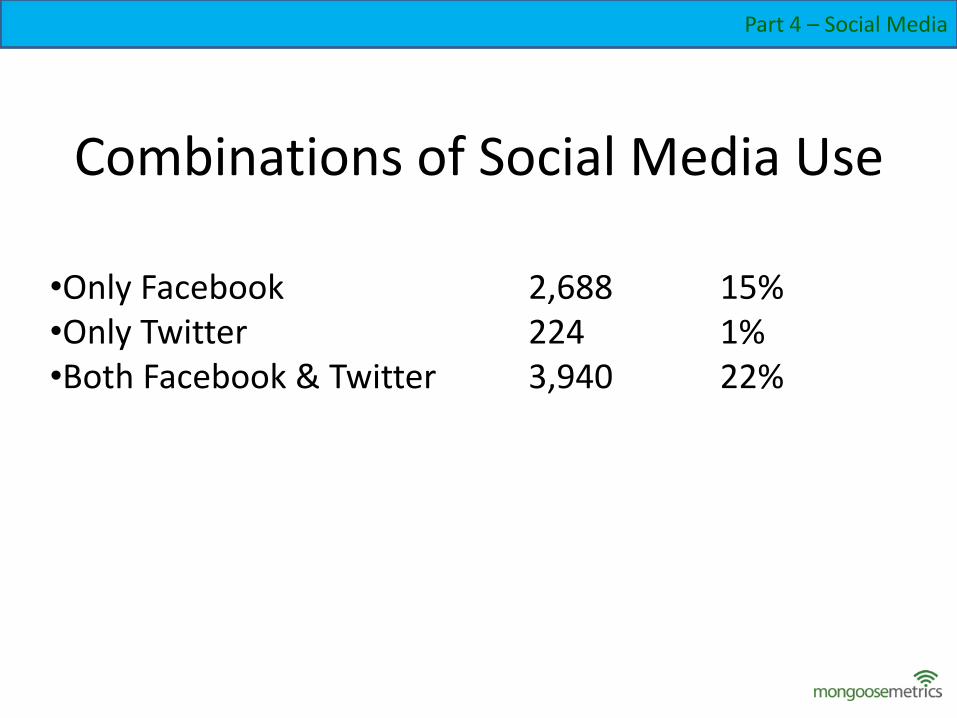
Combinations of Social Media Use
Part 4 – Social Media
•Only Facebook 2,688 15%•Only Twitter 224 1%•Both Facebook & Twitter 3,940 22%
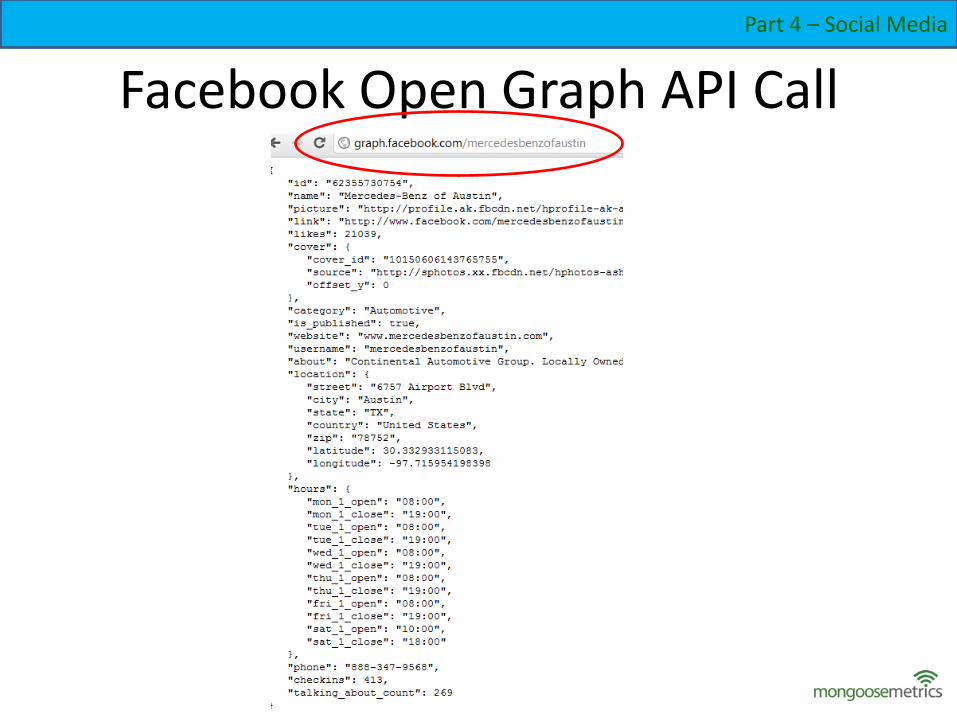
Facebook Open Graph API Call
Part 4 – Social Media
Facebook’s ‘People Talking About’ Metric
This metric refreshes daily but goes back a week. So it’s the current barometer of how much conversation is being generated by someone’s Page on Facebook. It’s a good gauge of the content Pages are putting up and how to generate more conversations around a Page
Part 4 – Social Media
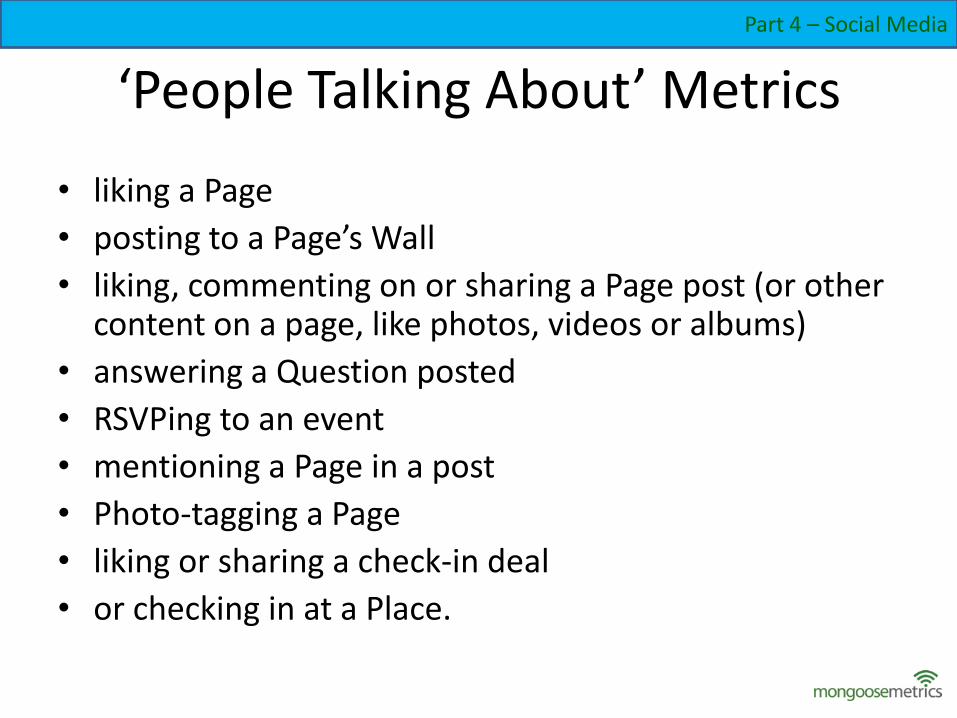
‘People Talking About’ Metrics
• liking a Page
• posting to a Page’s Wall
• liking, commenting on or sharing a Page post (or other content on a page, like photos, videos or albums)
• answering a Question posted
• RSVPing to an event
• mentioning a Page in a post
• Photo-tagging a Page
• liking or sharing a check-in deal
• or checking in at a Place.
Part 4 – Social Media
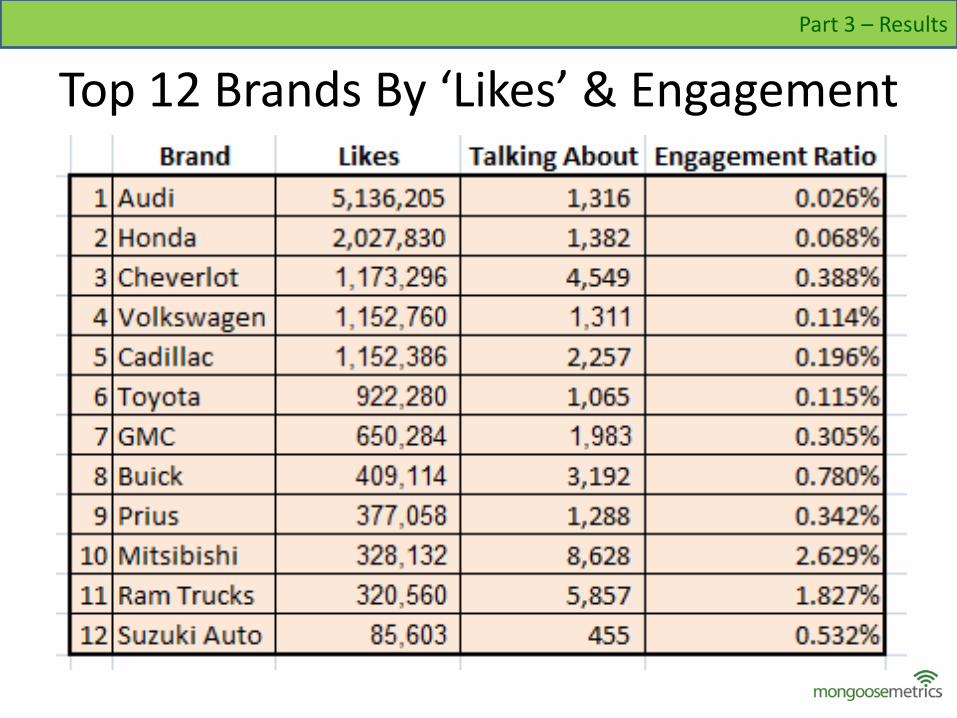
Top 12 Brands By ‘Likes’ & Engagement
Part 3 – Results
But how do these rates of FacebookEngagement Stack Up? ..
An example in another vertical for context …
Part 4 – Social Media
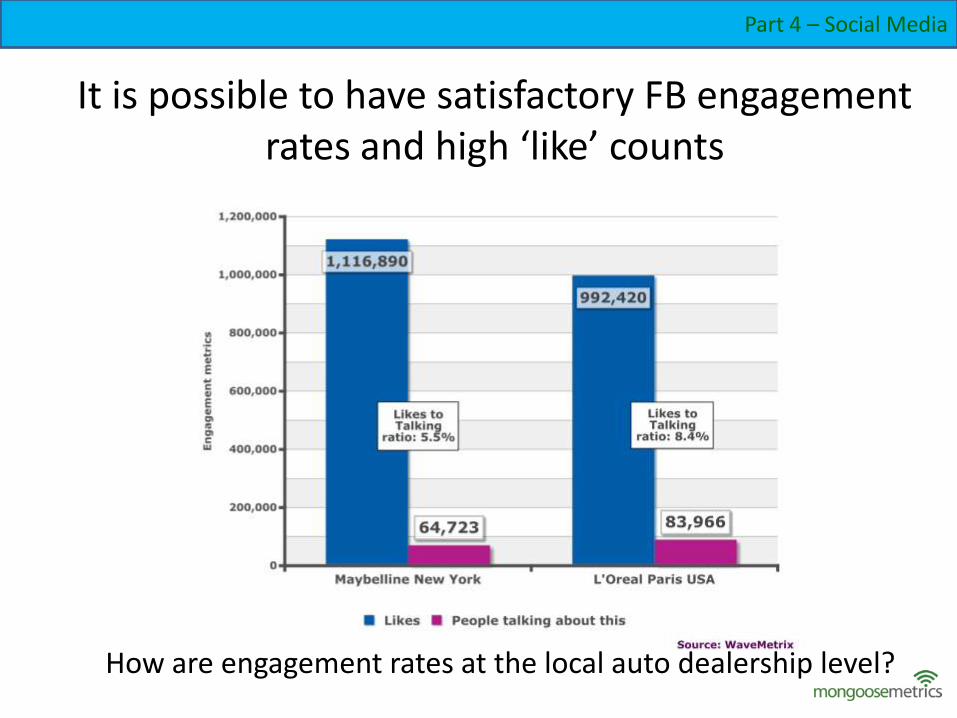
It is possible to have satisfactory FB engagement rates and high ‘like’ counts
How are engagement rates at the local auto dealership level?
Part 4 – Social Media
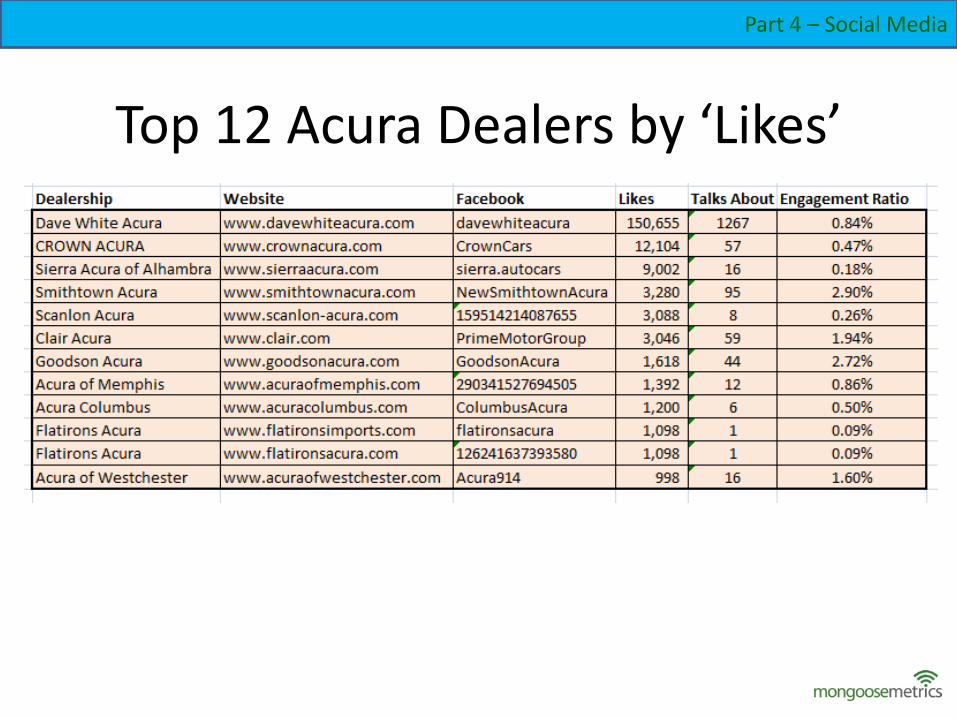
Top 12 Acura Dealers by ‘Likes’
Part 4 – Social Media
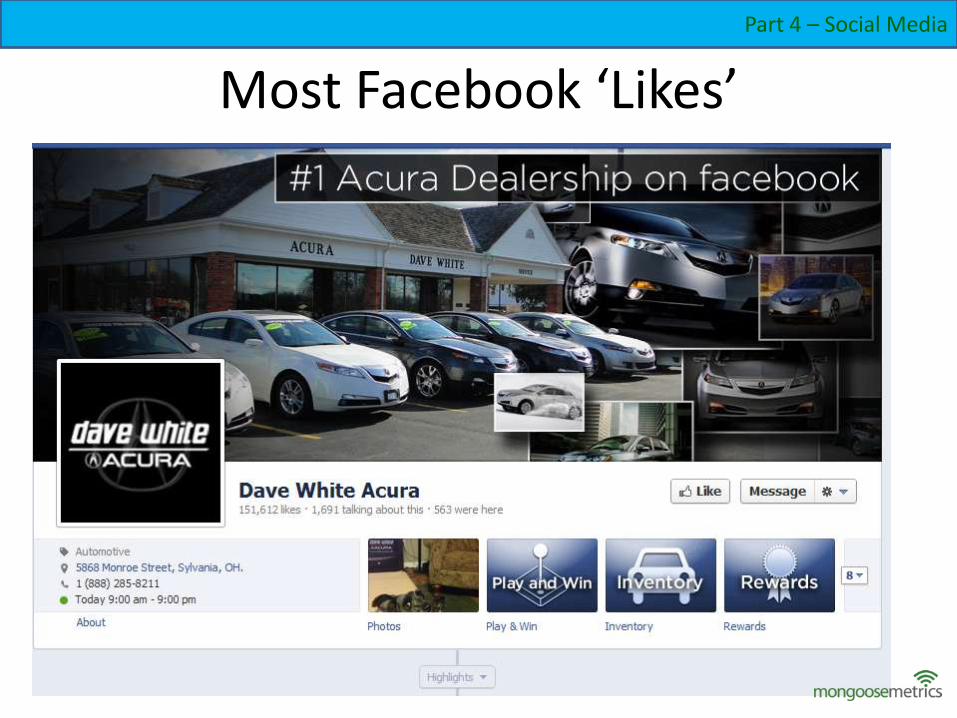
Most Facebook ‘Likes’
Part 4 – Social Media
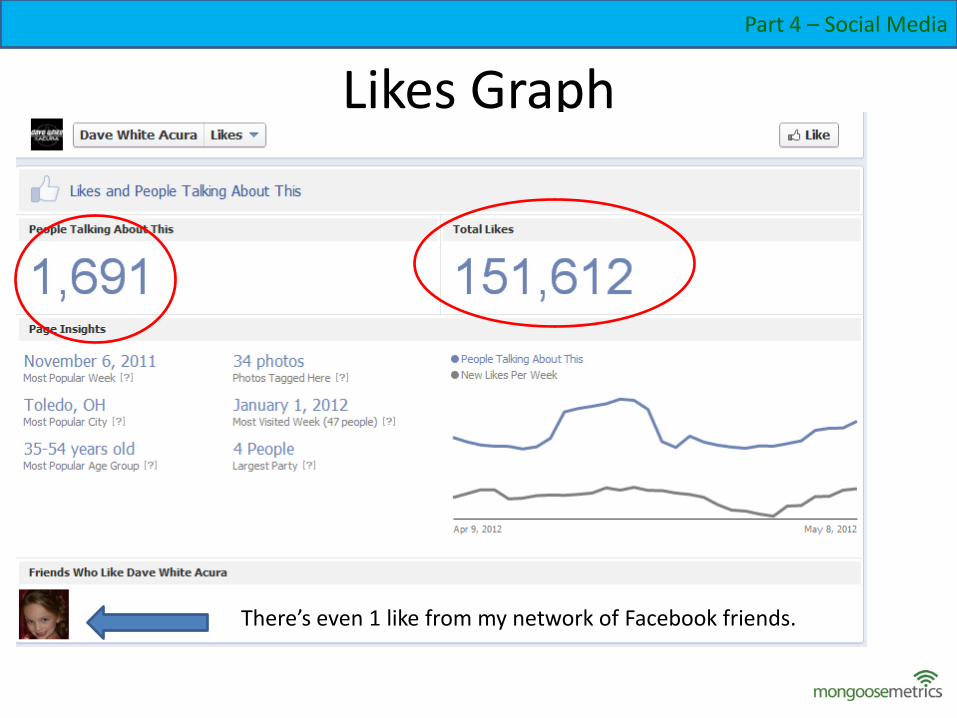
Likes Graph
There’s even 1 like from my network of Facebook friends.
Part 4 – Social Media
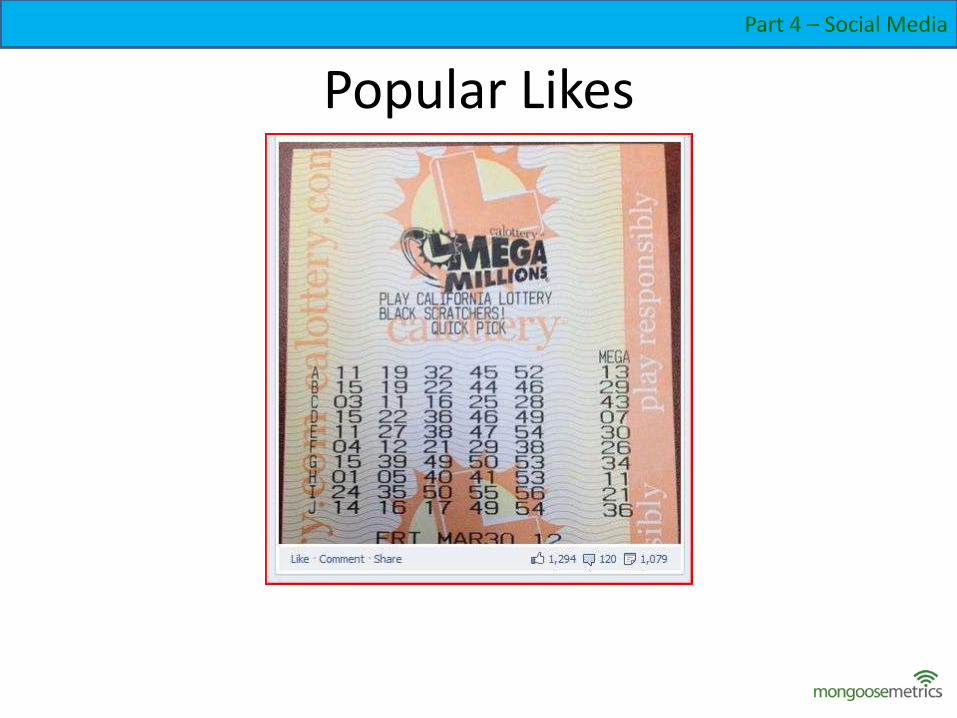
Popular Likes
Part 4 – Social Media
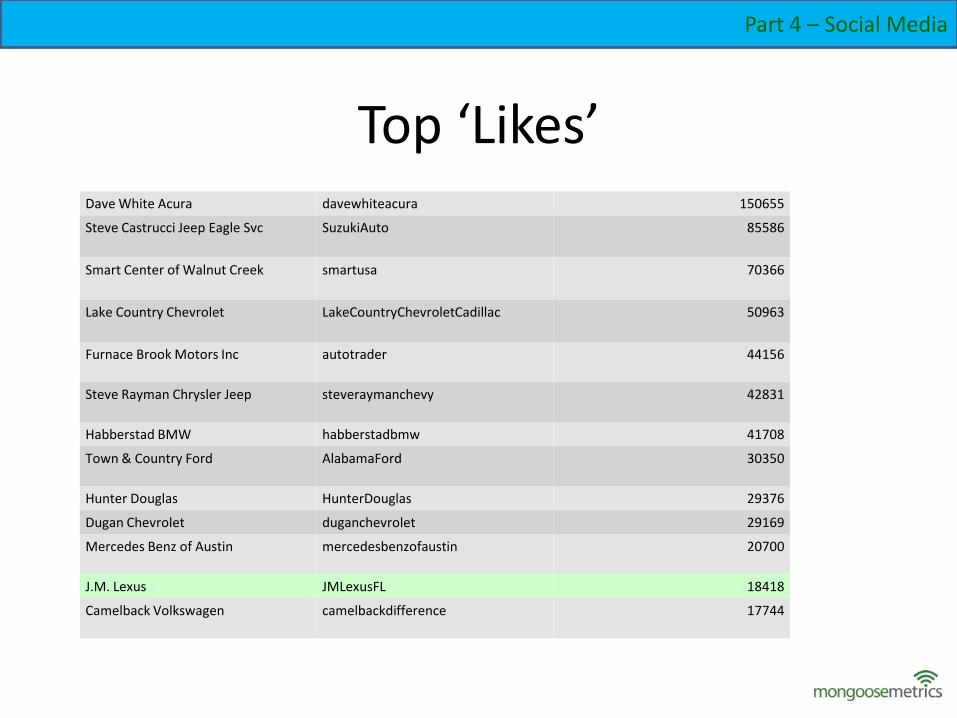
Top ‘Likes’
Part 4 – Social Media
Dave White Acura davewhiteacura 150655
Steve Castrucci Jeep Eagle Svc SuzukiAuto 85586
Smart Center of Walnut Creek smartusa 70366
Lake Country Chevrolet LakeCountryChevroletCadillac 50963
Furnace Brook Motors Inc autotrader 44156
Steve Rayman Chrysler Jeep steveraymanchevy 42831
Habberstad BMW habberstadbmw 41708
Town & Country Ford AlabamaFord 30350
Hunter Douglas HunterDouglas 29376
Dugan Chevrolet duganchevrolet 29169
Mercedes Benz of Austin mercedesbenzofaustin 20700
J.M. Lexus JMLexusFL 18418
Camelback Volkswagen camelbackdifference 17744
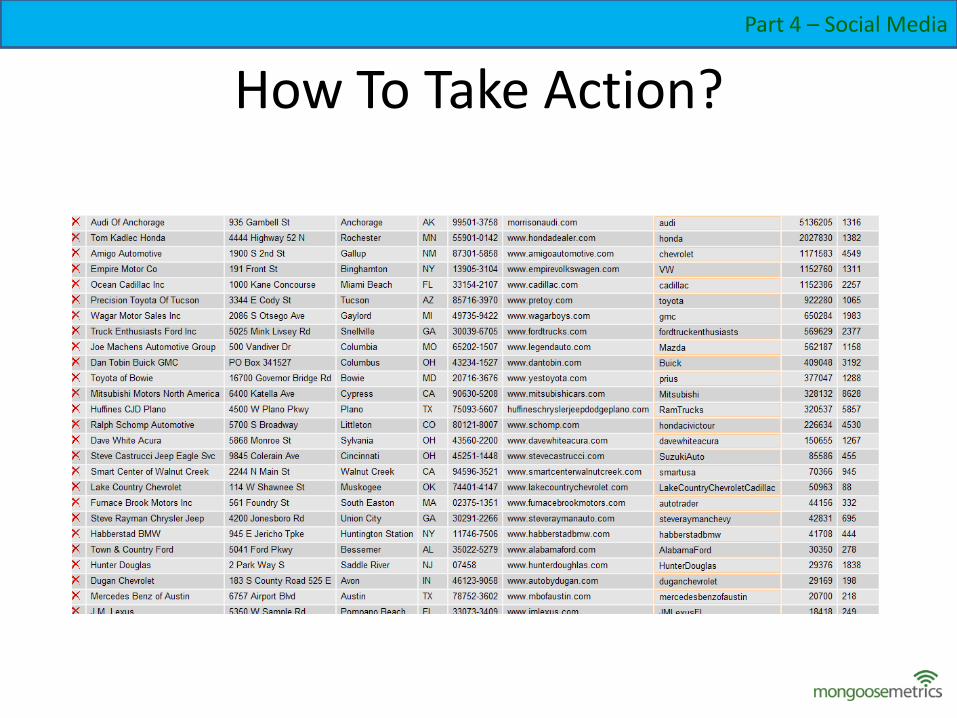
How To Take Action?
Part 4 – Social Media
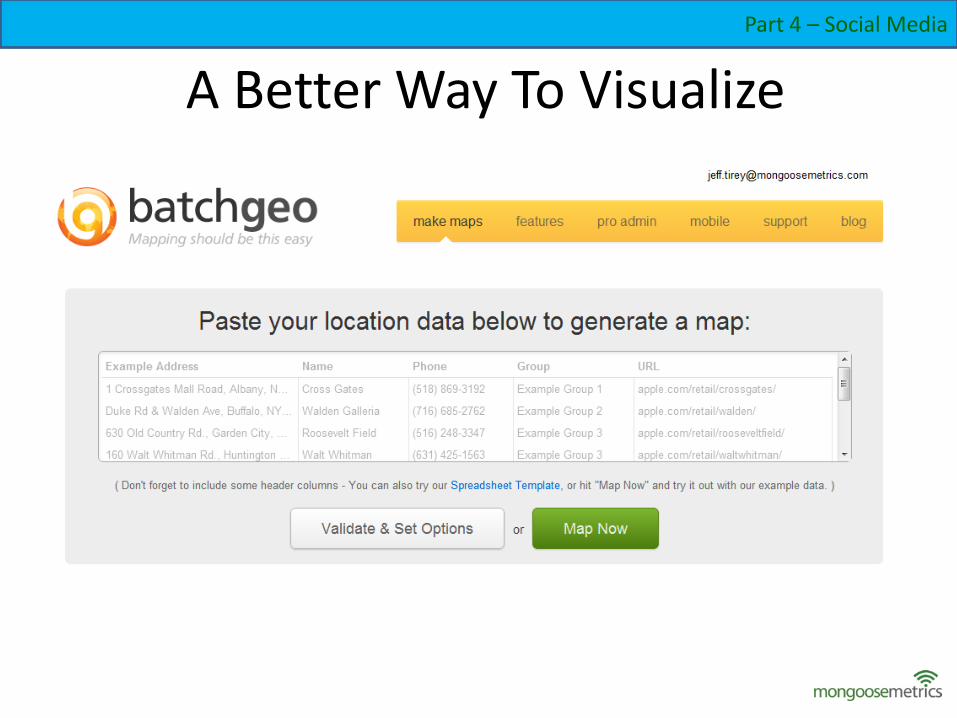
A Better Way To Visualize
Part 4 – Social Media
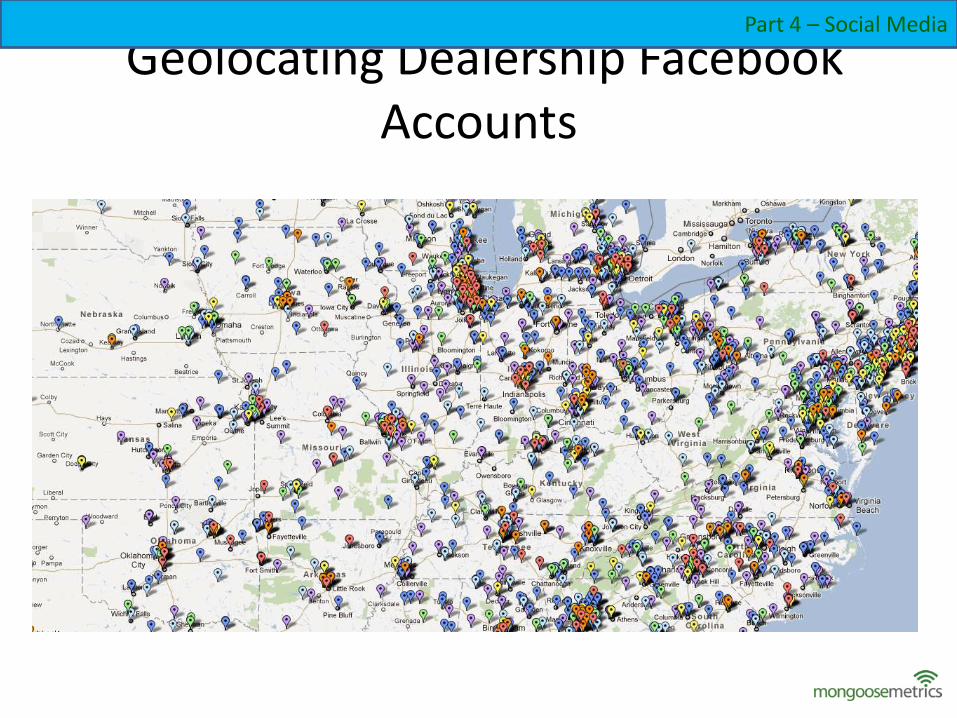
Geolocating Dealership FacebookAccounts
Part 4 – Social Media
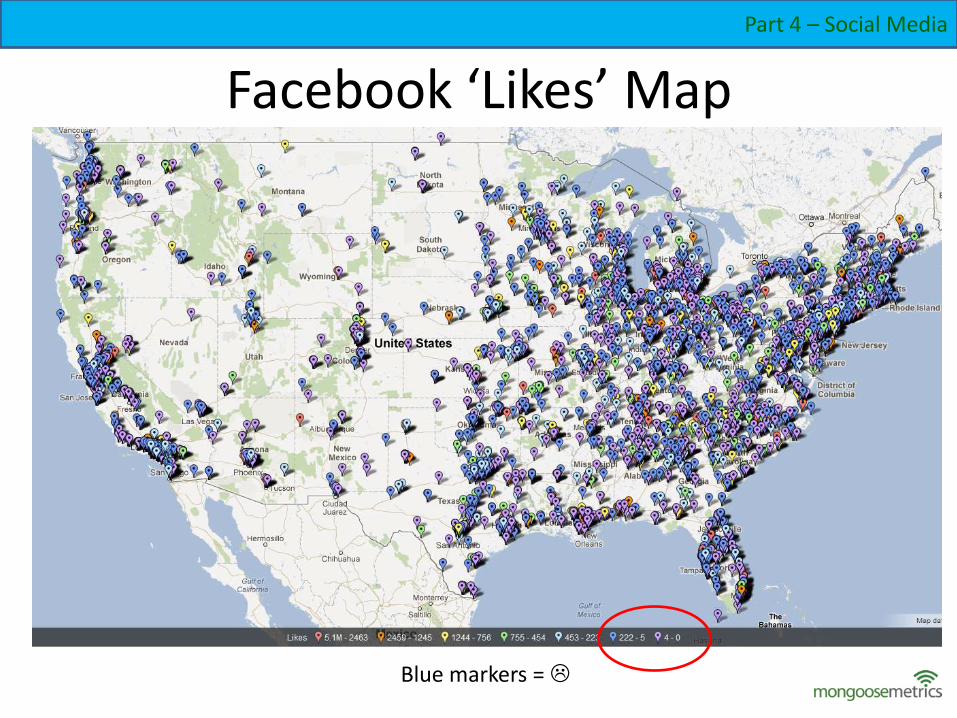
Facebook ‘Likes’ Map
Blue markers =
Part 4 – Social Media
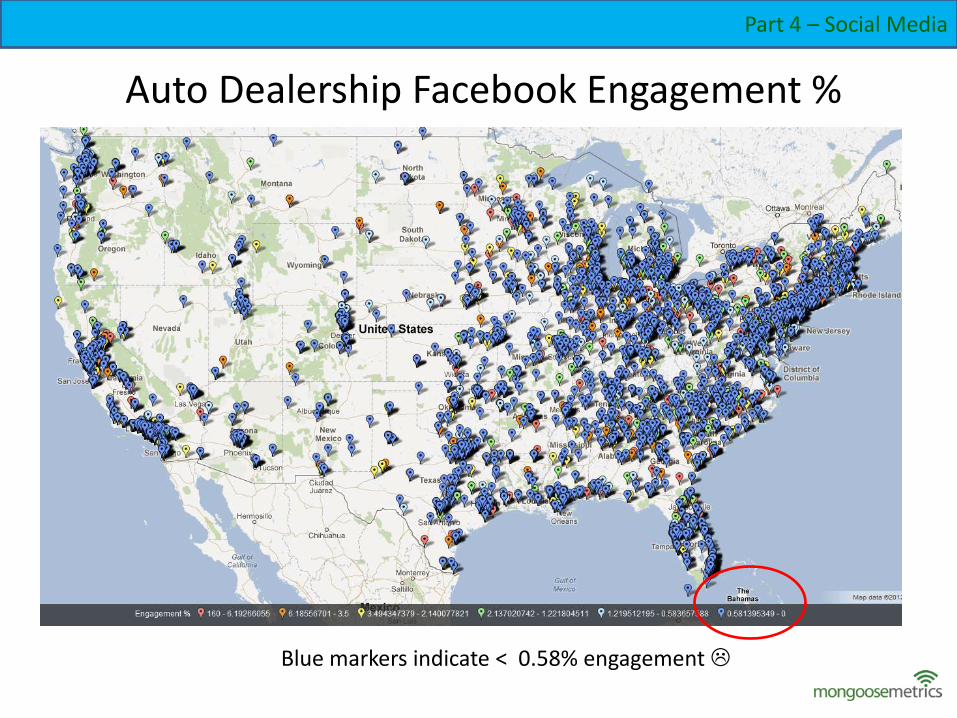
Auto Dealership Facebook Engagement %
Blue markers indicate < 0.58% engagement
Part 4 – Social Media
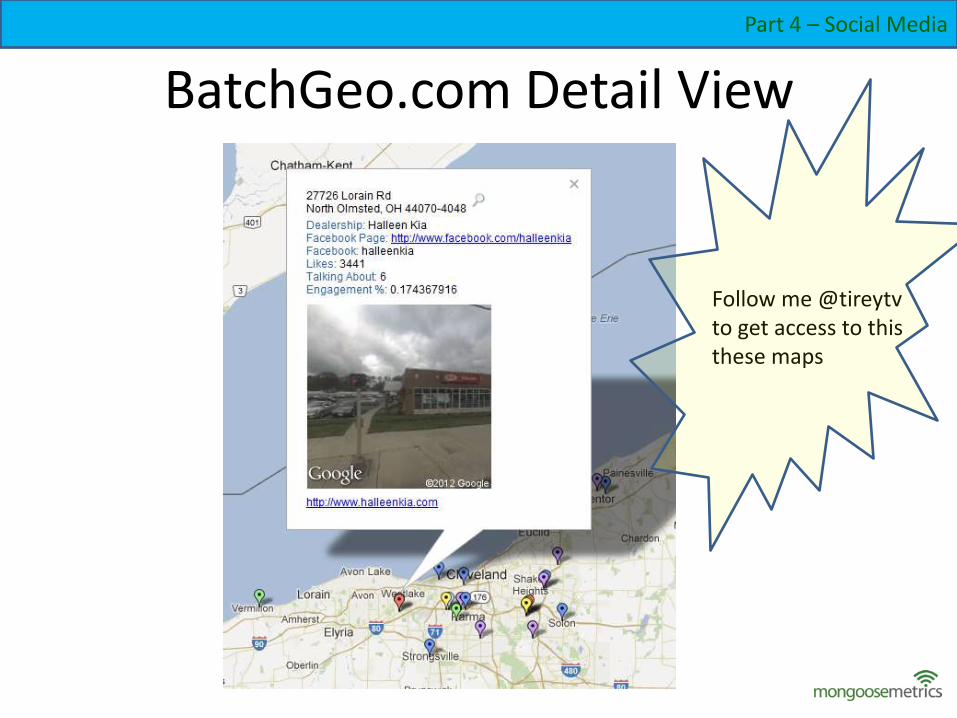
BatchGeo.com Detail View
Follow me @tireytvto get access to thisthese maps
Part 4 – Social Media
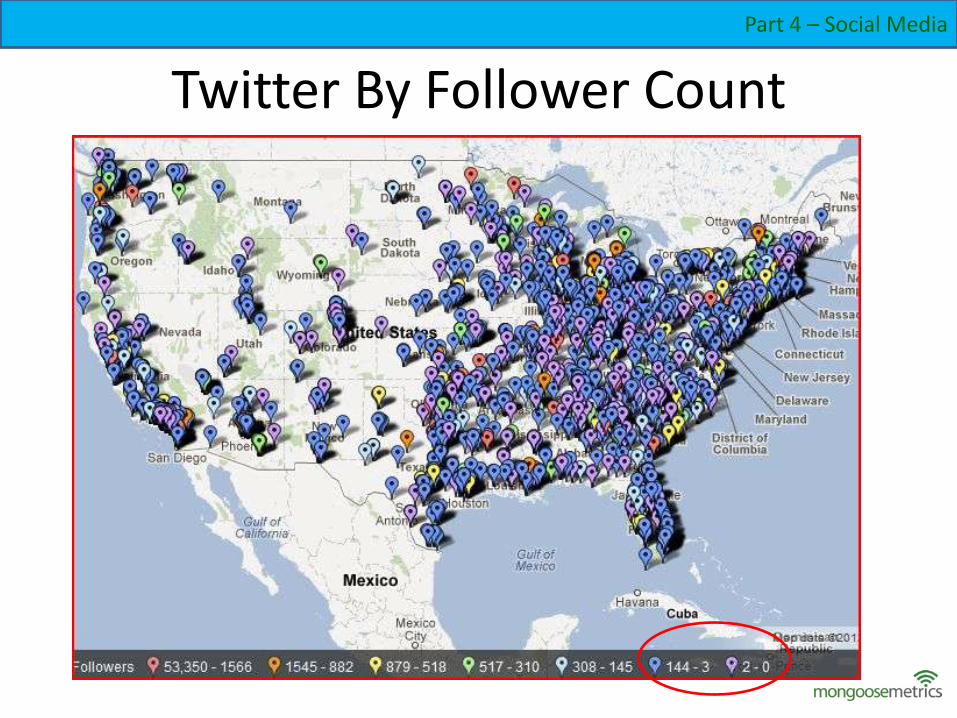
Twitter By Follower Count
Part 4 – Social Media
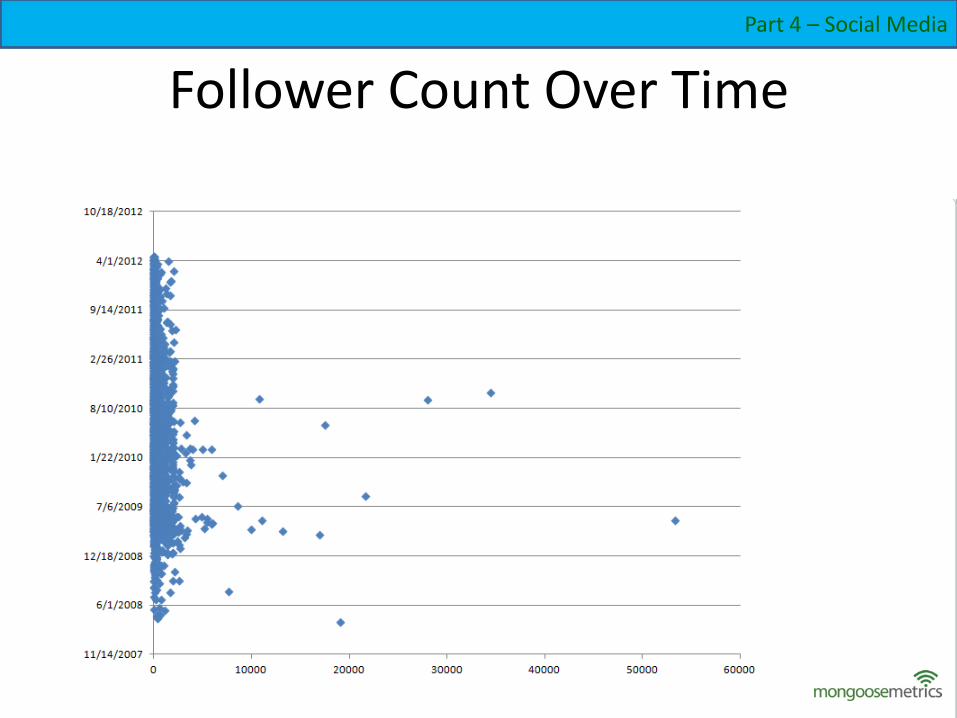
Follower Count Over Time
Part 4 – Social Media
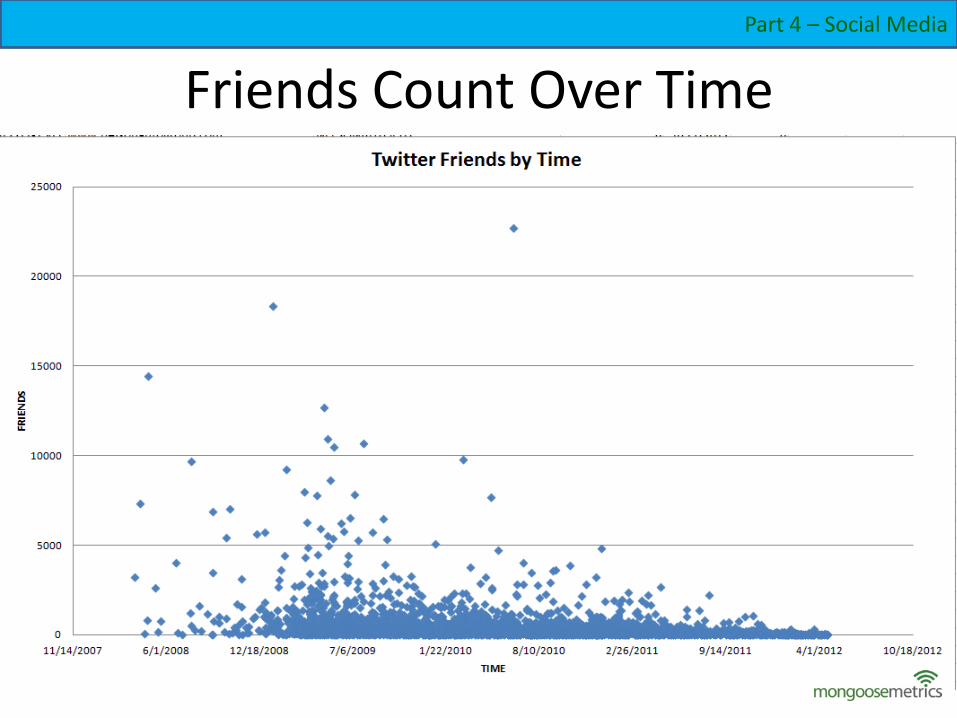
Friends Count Over Time
Part 4 – Social Media
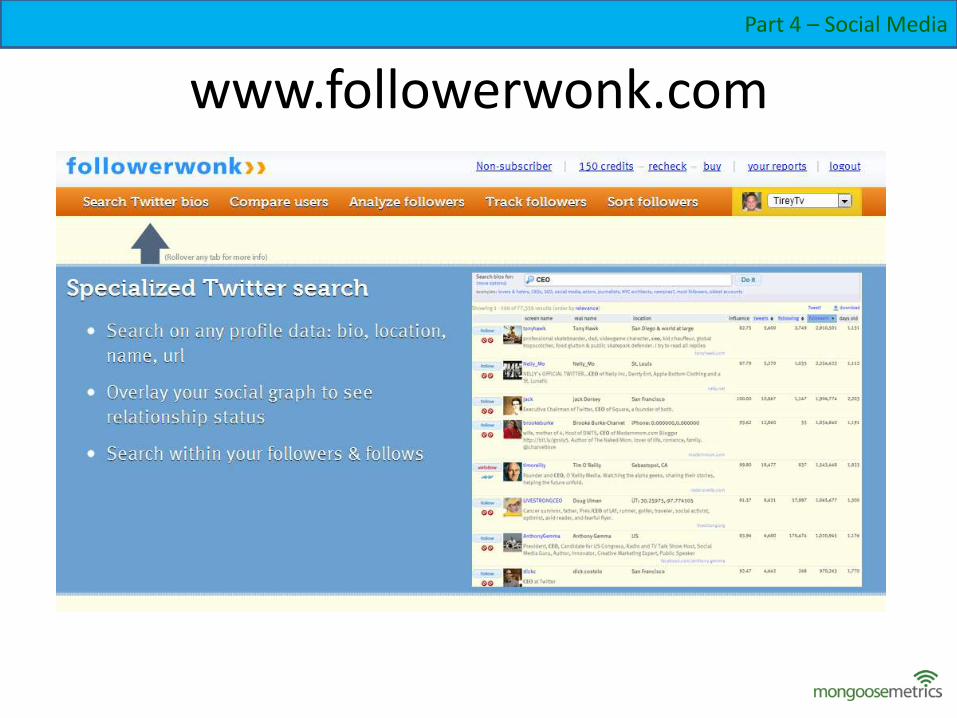
www.followerwonk.com
Part 4 – Social Media
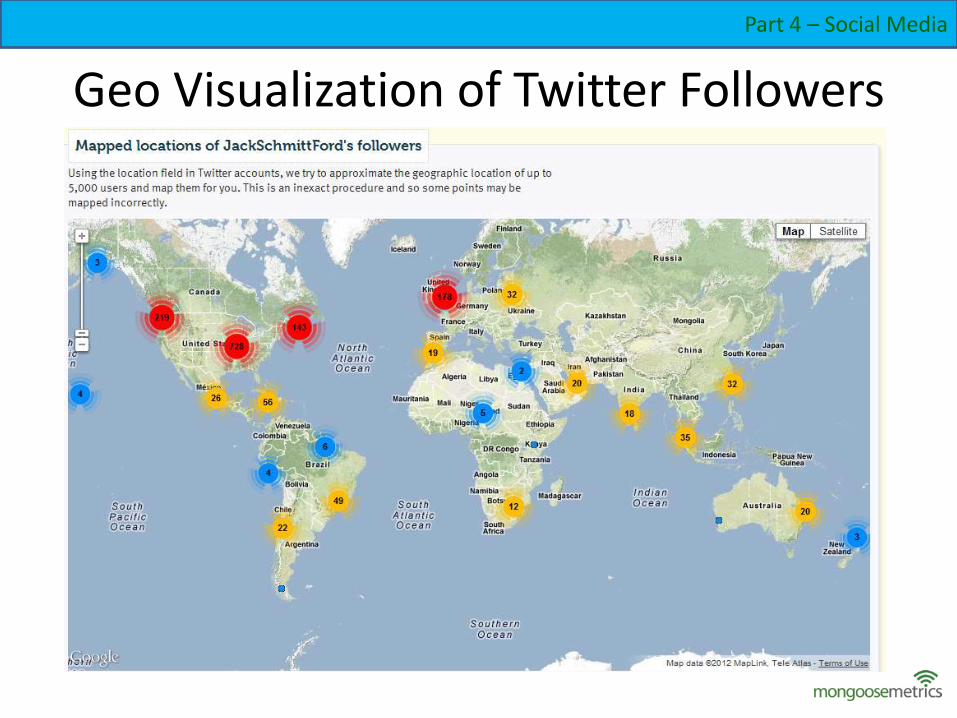
Geo Visualization of Twitter Followers
Part 4 – Social Media
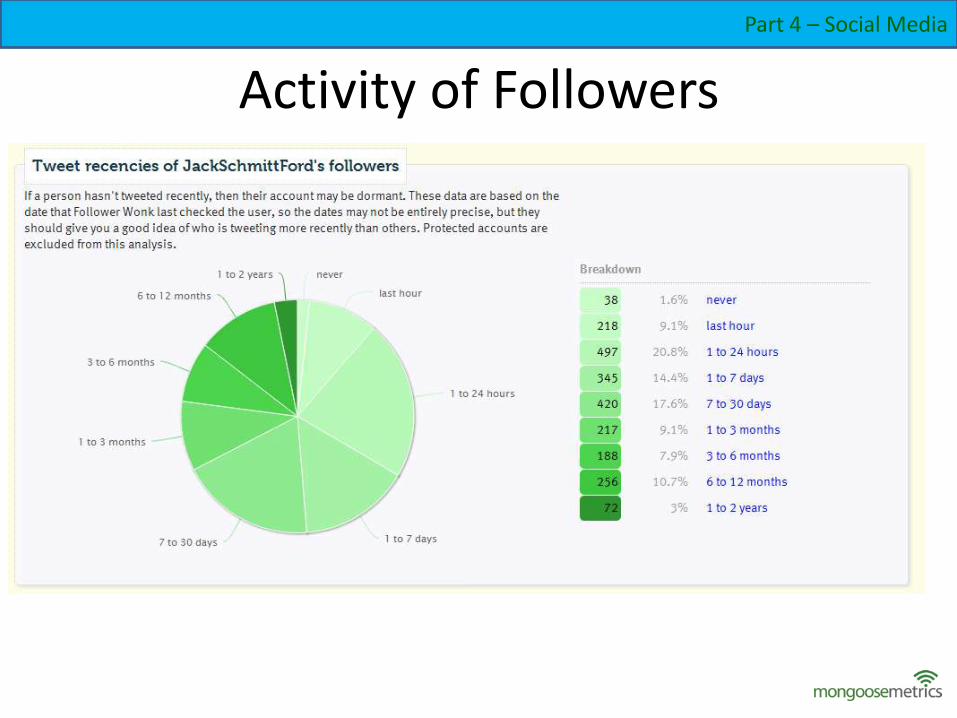
Activity of Followers
Part 4 – Social Media
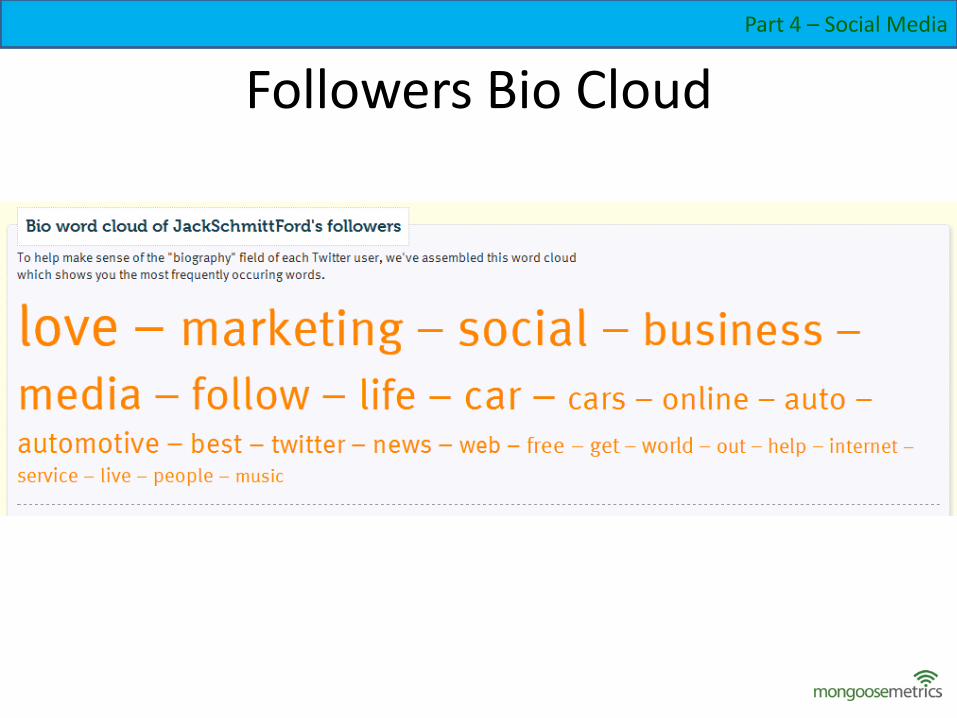
Followers Bio Cloud
Part 4 – Social Media
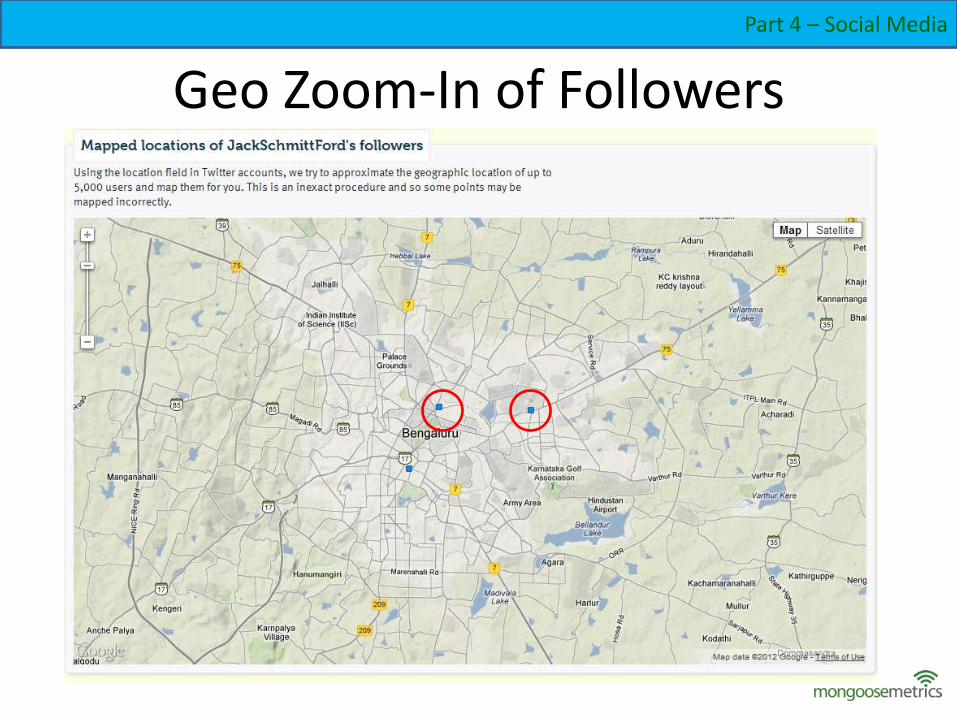
Geo Zoom-In of Followers
Part 4 – Social Media
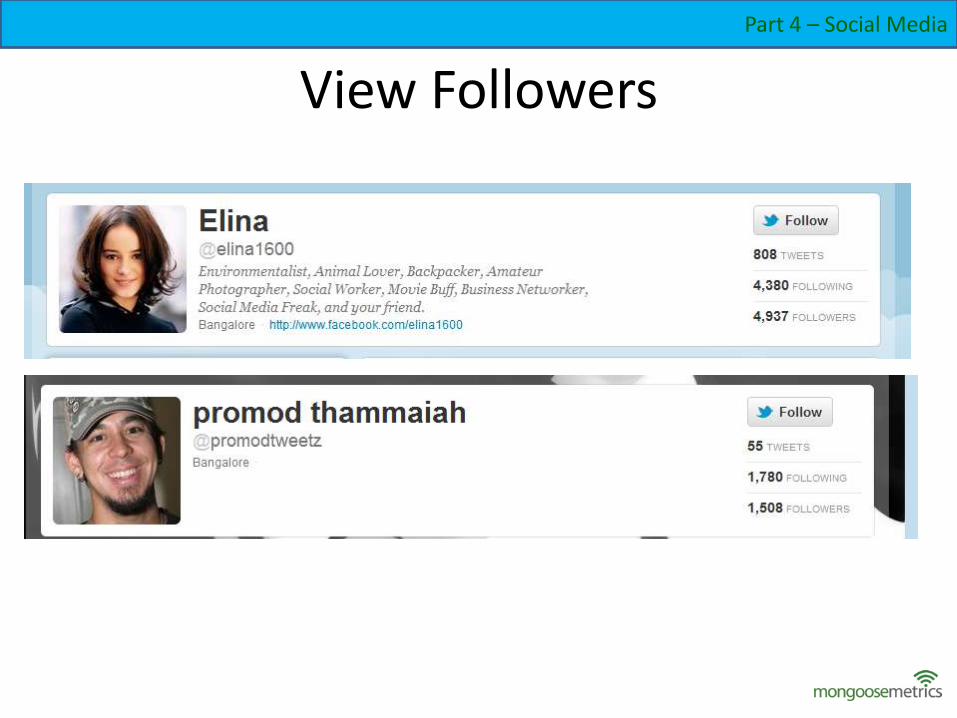
View Followers
Part 4 – Social Media
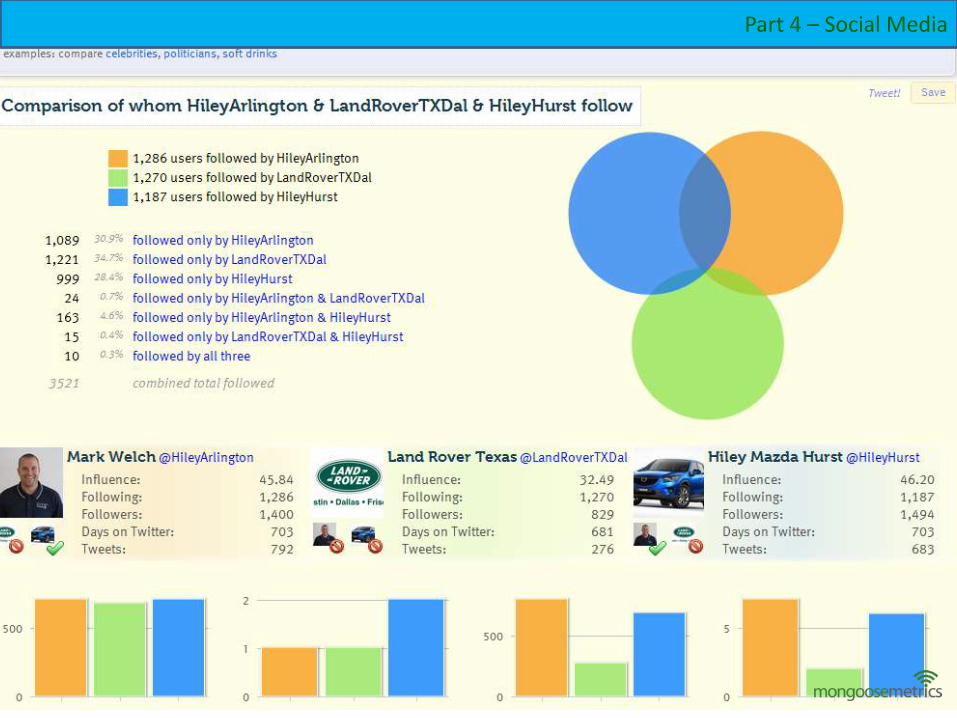
Part 4 – Social Media
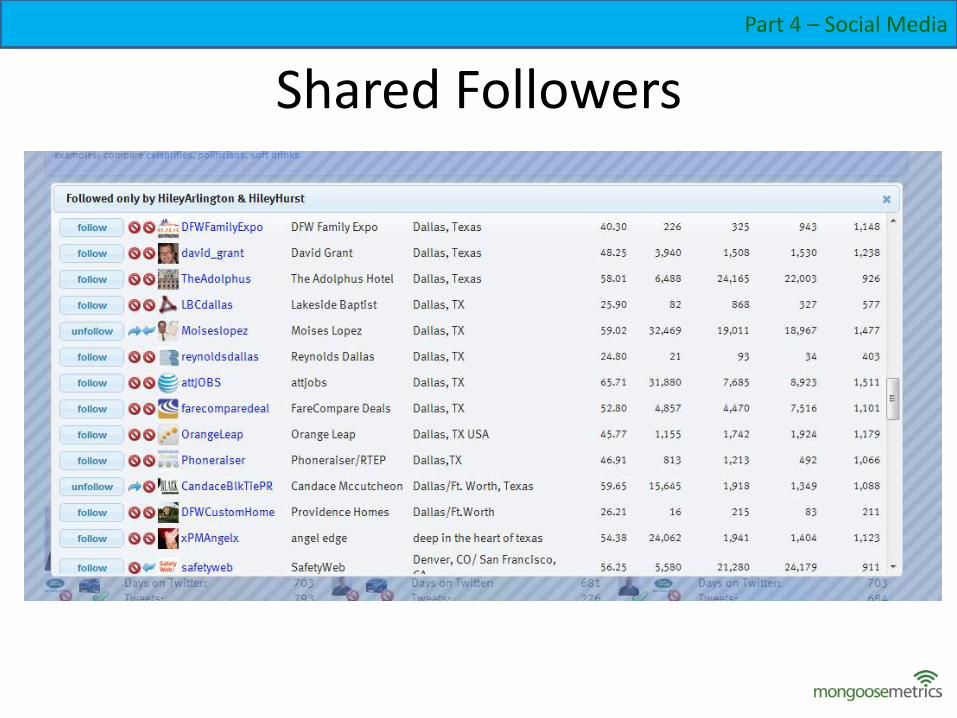
Shared Followers
Part 4 – Social Media
Thank You!Jeff TireyCMO, Founding [email protected]@mongoosemetrics.com