Embed Size (px)
Citation preview
This document includes source material that is the exclusive property of Euromonitor International Ltd and its licensors. All such source material is © Euromonitor International Ltd 2014
and provided without any warranties or representations about accuracy or completeness. Any reliance on such material is made at users’ own risk. Publication or making available of all
or part of the material contained in this document (or any data or other material derived from it) may require Euromonitor’s prior written consent. Please refer to the applicable terms and
conditions with Euromonitor.
THE ILLEGAL ALCOHOLIC BEVERAGES MARKET IN SIX COUNTRIES LATAM 2013A custom report compiled by Euromonitor International
November 2014
INTRODUCTION
METHODOLOGY
ANALYSIS - REGION
ANALYSIS - COUNTRIES
2014 OUTLOOK
APPENDIX

© Euromonitor International Ltd 2013. Applicable terms and conditions of use and the disclaimer at the front of this document apply. 3
Our Services
Syndicated Market Research
Custom Research and Consulting
Expansive Network
On-the-ground researchers in 80 countries
Complete view of the global marketplace
Cross-comparable data across every market
Our Expertise
Consumer Trends & Lifestyles
Companies & Brands
Product Categories & Distribution Channels
Production & Supply Chains
Economics & Forecasting
Comparable data across markets
Euromonitor International
INTRODUCTION | METHODOLOGY | REGION | COUNTRIES | OUTLOOK | APPENDIX
© Euromonitor International Ltd 2013. Applicable terms and conditions of use and the disclaimer at the front of this document apply. 4
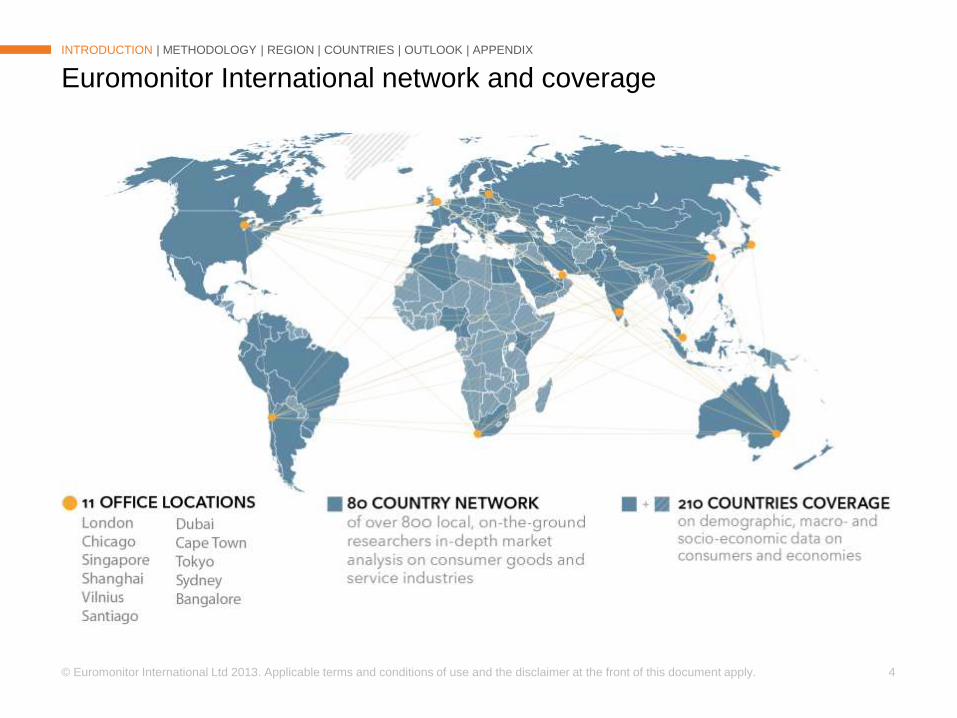
Euromonitor International network and coverage
INTRODUCTION | METHODOLOGY | REGION | COUNTRIES | OUTLOOK | APPENDIX
© Euromonitor International Ltd 2013. Applicable terms and conditions of use and the disclaimer at the front of this document apply. 5
Euromonitor International research methodology
INTRODUCTION | METHODOLOGY | REGION | COUNTRIES | OUTLOOK | APPENDIX

INTRODUCTION
METHODOLOGY
ANALYSIS - REGION
ANALYSIS - COUNTRIES
2014 OUTLOOK
APPENDIX
© Euromonitor International Ltd 2013. Applicable terms and conditions of use and the disclaimer at the front of this document apply. 7
Category/subcategory Definition
Recorded alcohol
Alcohol products that are subject to government regulation and are
appropriately recorded for taxation, consumption and other commercial
purposes. Recorded alcohol comprises Formal Alcohol production and trade.
Unrecorded alcohol
Alcohol products that are not subject to government regulation and/or
purposefully evade commercial and governmental regulation, including
payment of excise tax. Unrecorded alcohol includes Informal and Illicit
Alcohol production.
Informal alcohol
Informal alcohol is typically produced as part of long-standing traditional
and/or cultural practices. While some governments permit the production and
sale of informal alcohol, it typically is not subject to excise tax payments or
health and safety requirements due to the nature of production and
consumption.
Illicit alcohol
Illicit alcohol products can pose a health risk - including death - to
consumers. By its very nature, illicit alcohol illegally enters the economy
either through production, distribution and/or purchase channels outside of
the formal and recorded market, thereby eluding excise tax payments and/or
industry safety standards. In many instances, illicit alcohol is traded by
criminal organisations involved in other contraband and illegal commercial
enterprises. Illicit alcohol can take many forms, including: counterfeit,
smuggled, adulterated, surrogate and tax-avoidance.
Definitions
INTRODUCTION | METHODOLOGY | REGION | COUNTRIES | OUTLOOK | APPENDIX
Source: Position Statement and Principles regarding Illicit and Informal Alcohol, SABMiller 2014
© Euromonitor International Ltd 2013. Applicable terms and conditions of use and the disclaimer at the front of this document apply. 8
Category/subcategory Definition
Counterfeit & illegal brands
Substitute/refillIllegal alcohol sold as legal brands or empty bottles of legitimate products
refilled with cheaper alcohol
Industrial manufacturing of
illegal brandsManufacturing of illegal branded or unbranded alcohol
Contraband
Ethanol as raw material Illegal imports of ethanol as a raw material
Finished products Illegal imports of alcoholic beverages
Illegal artisanal
Illegal artisanal alcoholic beverages made for commercial purposes
Surrogate
Alcohol not meant for human consumption (e.g. pharmaceutical alcohol)
diverted to the alcoholic beverages market
Tax leakage
Legal alcoholic beverages (locally produced) on which excise was not paid
Definitions
INTRODUCTION | METHODOLOGY | REGION | COUNTRIES | OUTLOOK | APPENDIX
© Euromonitor International Ltd 2013. Applicable terms and conditions of use and the disclaimer at the front of this document apply. 9
Alcohol categorisation
INTRODUCTION | METHODOLOGY | REGION | COUNTRIES | OUTLOOK | APPENDIX
INTRODUCTION
METHODOLOGY
ANALYSIS - REGION
ANALYSIS - COUNTRIES
2014 OUTLOOK
APPENDIX

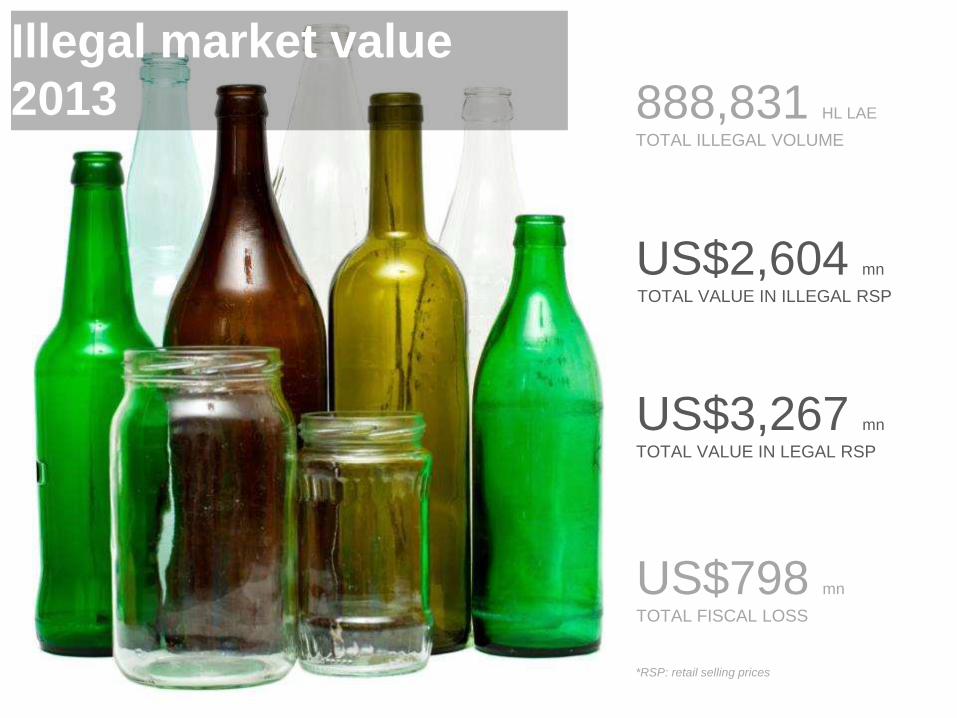
888,831 HL LAE
TOTAL ILLEGAL VOLUME
Illegal market volumes
2013
US$2,604 mn
TOTAL VALUE IN ILLEGAL RSP
US$798 mn
TOTAL FISCAL LOSS
US$3,267 mn
TOTAL VALUE IN LEGAL RSP
*RSP: retail selling prices
© Euromonitor International Ltd 2013. Applicable terms and conditions of use and the disclaimer at the front of this document apply. 12
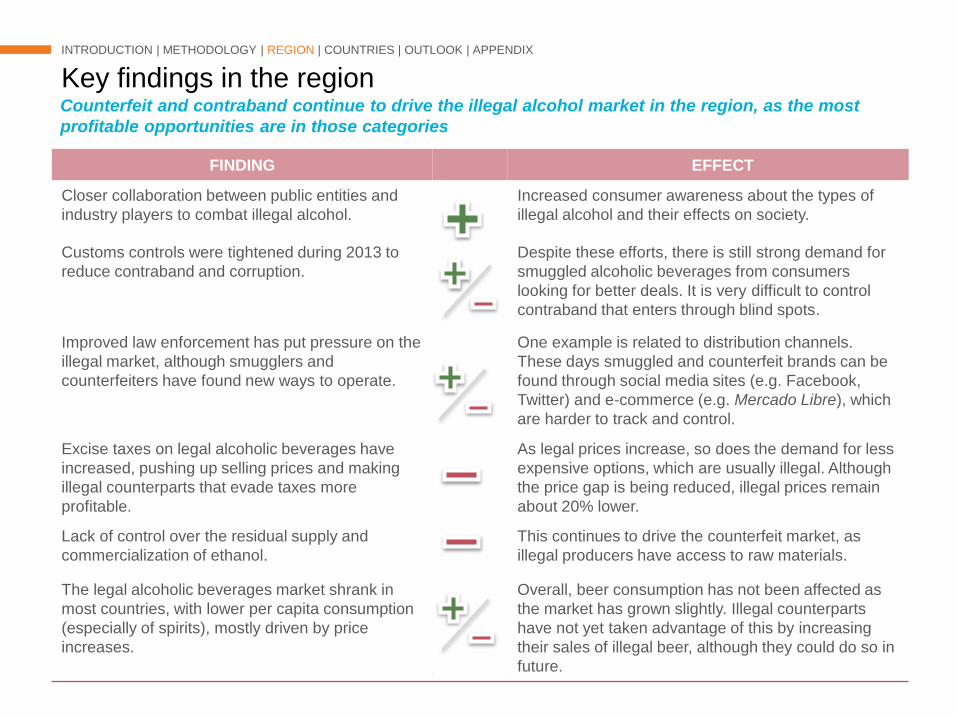
Key findings in the region
INTRODUCTION | METHODOLOGY | REGION | COUNTRIES | OUTLOOK | APPENDIX
Counterfeit and contraband continue to drive the illegal alcohol market in the region, as the most
profitable opportunities are in those categories
FINDING EFFECT
Closer collaboration between public entities and
industry players to combat illegal alcohol.
Increased consumer awareness about the types of
illegal alcohol and their effects on society.
Customs controls were tightened during 2013 to
reduce contraband and corruption.
Despite these efforts, there is still strong demand for
smuggled alcoholic beverages from consumers
looking for better deals. It is very difficult to control
contraband that enters through blind spots.
Improved law enforcement has put pressure on the
illegal market, although smugglers and
counterfeiters have found new ways to operate.
One example is related to distribution channels.
These days smuggled and counterfeit brands can be
found through social media sites (e.g. Facebook,
Twitter) and e-commerce (e.g. Mercado Libre), which
are harder to track and control.
Excise taxes on legal alcoholic beverages have
increased, pushing up selling prices and making
illegal counterparts that evade taxes more
profitable.
As legal prices increase, so does the demand for less
expensive options, which are usually illegal. Although
the price gap is being reduced, illegal prices remain
about 20% lower.
Lack of control over the residual supply and
commercialization of ethanol.
This continues to drive the counterfeit market, as
illegal producers have access to raw materials.
The legal alcoholic beverages market shrank in
most countries, with lower per capita consumption
(especially of spirits), mostly driven by price
increases.
Overall, beer consumption has not been affected as
the market has grown slightly. Illegal counterparts
have not yet taken advantage of this by increasing
their sales of illegal beer, although they could do so in
future.
© Euromonitor International Ltd 2013. Applicable terms and conditions of use and the disclaimer at the front of this document apply. 13
-
200,000
400,000
600,000
800,000
1,000,000
1,200,000
1,400,000
1,600,000
HL L
AE
Legal LAE Illegal LAE
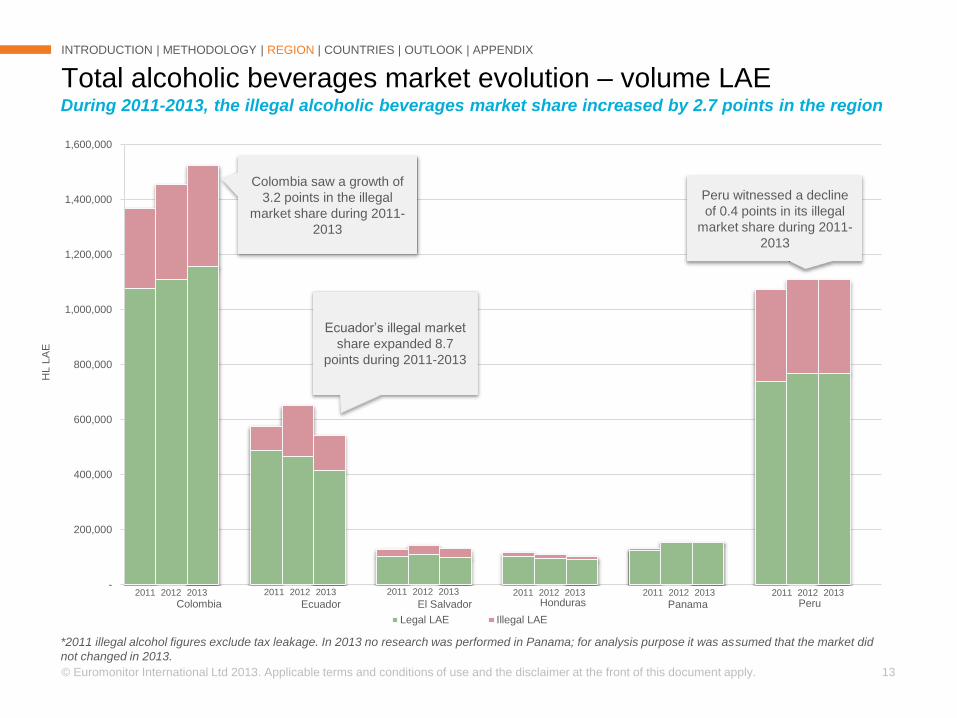
Colombia saw a growth of
3.2 points in the illegal
market share during 2011-
2013
Ecuador’s illegal market
share expanded 8.7
points during 2011-2013
Peru witnessed a decline
of 0.4 points in its illegal
market share during 2011-
2013
Total alcoholic beverages market evolution – volume LAE
INTRODUCTION | METHODOLOGY | REGION | COUNTRIES | OUTLOOK | APPENDIX
During 2011-2013, the illegal alcoholic beverages market share increased by 2.7 points in the region
PeruPanamaHondurasEl SalvadorEcuadorColombia2011 2012 2013 2011 2012 2013 2011 2012 2013 2011 2012 2013 2011 2012 2013 2011 2012 2013
*2011 illegal alcohol figures exclude tax leakage. In 2013 no research was performed in Panama; for analysis purpose it was assumed that the market did
not changed in 2013.
© Euromonitor International Ltd 2013. Applicable terms and conditions of use and the disclaimer at the front of this document apply. 14
6.0%
-31.6%
-5.6%
-5.5%
-2.2%
-2.9%
-5.6%
2.4%
-12.7%
-12.7%
-8.7%
-2.2%
-1.6%
-2.6%
3.2%
-18.1%
-11.0%
-8.3%
-2.2%
-2.0%
-3.4%
-32.0% -24.0% -16.0% -8.0% 0.0% 8.0%
Per capita consumption - % growth 2012-2013
Per capita total consumption Per Capita legal consumption Per Capita illegal consumption
Aggre
gate
Pe
ruP
anam
aH
ondura
sE
l S
alv
ador
Ecuador
Colo
mb
ia
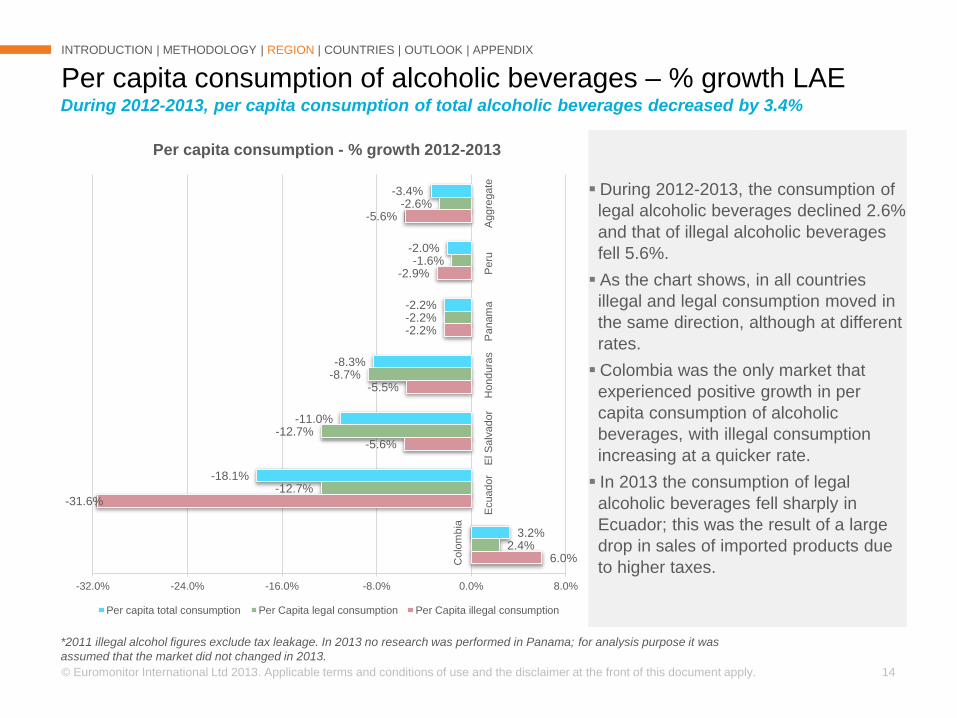
During 2012-2013, the consumption of
legal alcoholic beverages declined 2.6%
and that of illegal alcoholic beverages
fell 5.6%.
As the chart shows, in all countries
illegal and legal consumption moved in
the same direction, although at different
rates.
Colombia was the only market that
experienced positive growth in per
capita consumption of alcoholic
beverages, with illegal consumption
increasing at a quicker rate.
In 2013 the consumption of legal
alcoholic beverages fell sharply in
Ecuador; this was the result of a large
drop in sales of imported products due
to higher taxes.
Per capita consumption of alcoholic beverages – % growth LAE
INTRODUCTION | METHODOLOGY | REGION | COUNTRIES | OUTLOOK | APPENDIX
During 2012-2013, per capita consumption of total alcoholic beverages decreased by 3.4%
*2011 illegal alcohol figures exclude tax leakage. In 2013 no research was performed in Panama; for analysis purpose it was
assumed that the market did not changed in 2013.
© Euromonitor International Ltd 2013. Applicable terms and conditions of use and the disclaimer at the front of this document apply. 15
0%
10%
20%
30%
40%
50%
60%
70%
80%
90%
100%
% Legal Market % Illegal Market
Colombia Ecuador El Salvador Honduras Panama Peru
2011 2012 2013
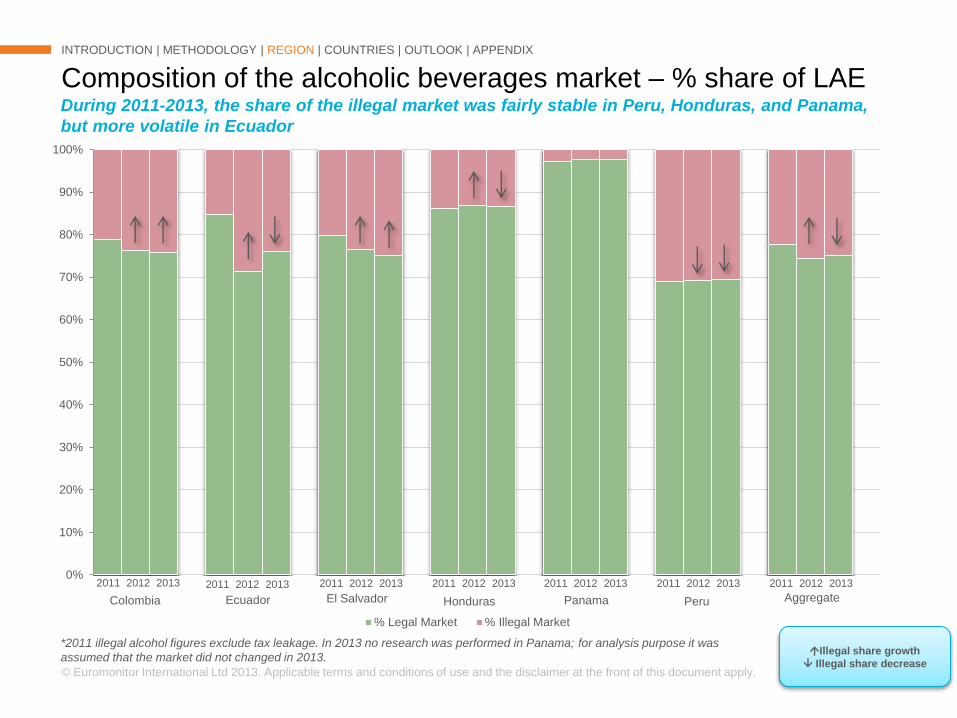
Composition of the alcoholic beverages market – % share of LAE
INTRODUCTION | METHODOLOGY | REGION | COUNTRIES | OUTLOOK | APPENDIX
During 2011-2013, the share of the illegal market was fairly stable in Peru, Honduras, and Panama,
but more volatile in Ecuador
Aggregate
2011 2012 20132011 2012 20132011 2012 20132011 2012 20132011 2012 2013 2011 2012 2013
*2011 illegal alcohol figures exclude tax leakage. In 2013 no research was performed in Panama; for analysis purpose it was
assumed that the market did not changed in 2013. Illegal share growth
Illegal share decrease
© Euromonitor International Ltd 2013. Applicable terms and conditions of use and the disclaimer at the front of this document apply. 16
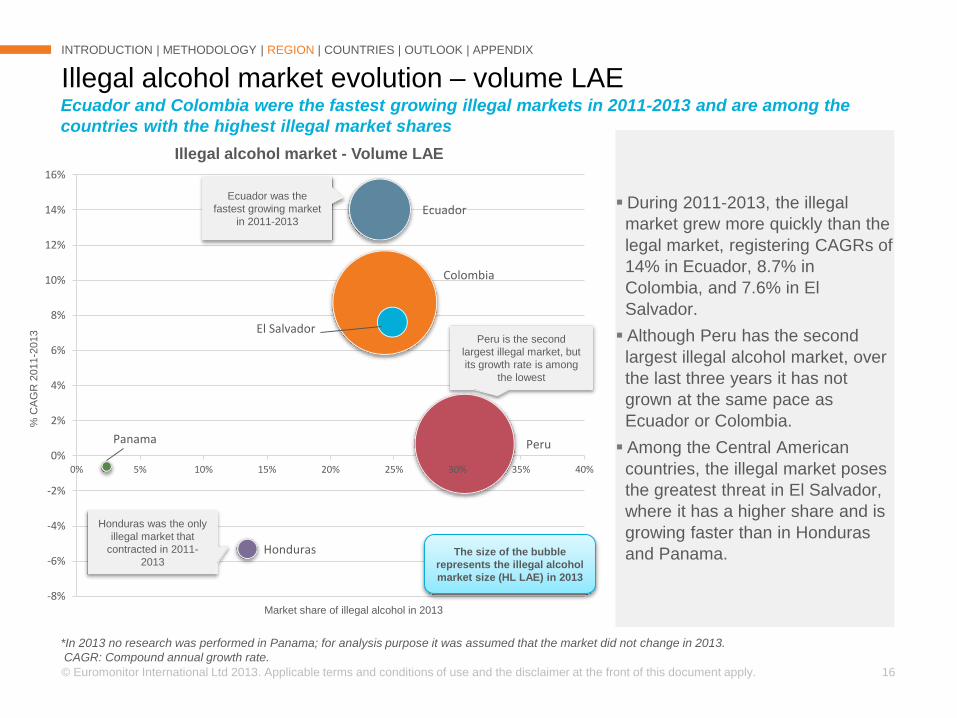
During 2011-2013, the illegal
market grew more quickly than the
legal market, registering CAGRs of
14% in Ecuador, 8.7% in
Colombia, and 7.6% in El
Salvador.
Although Peru has the second
largest illegal alcohol market, over
the last three years it has not
grown at the same pace as
Ecuador or Colombia.
Among the Central American
countries, the illegal market poses
the greatest threat in El Salvador,
where it has a higher share and is
growing faster than in Honduras
and Panama.
Illegal alcohol market evolution – volume LAE
INTRODUCTION | METHODOLOGY | REGION | COUNTRIES | OUTLOOK | APPENDIX
Ecuador and Colombia were the fastest growing illegal markets in 2011-2013 and are among the
countries with the highest illegal market shares
Colombia
Ecuador
El Salvador
Honduras
Panama Peru
-8%
-6%
-4%
-2%
0%
2%
4%
6%
8%
10%
12%
14%
16%
0% 5% 10% 15% 20% 25% 30% 35% 40%
% C
AG
R 2
011-2
013
Market share of illegal alcohol in 2013
Illegal alcohol market - Volume LAE
The size of the bubble
represents the illegal alcohol
market size (HL LAE) in 2013
Ecuador was the
fastest growing market
in 2011-2013
Peru is the second
largest illegal market, but
its growth rate is among
the lowest
Honduras was the only
illegal market that
contracted in 2011-
2013
*In 2013 no research was performed in Panama; for analysis purpose it was assumed that the market did not change in 2013.
CAGR: Compound annual growth rate.
© Euromonitor International Ltd 2013. Applicable terms and conditions of use and the disclaimer at the front of this document apply. 17
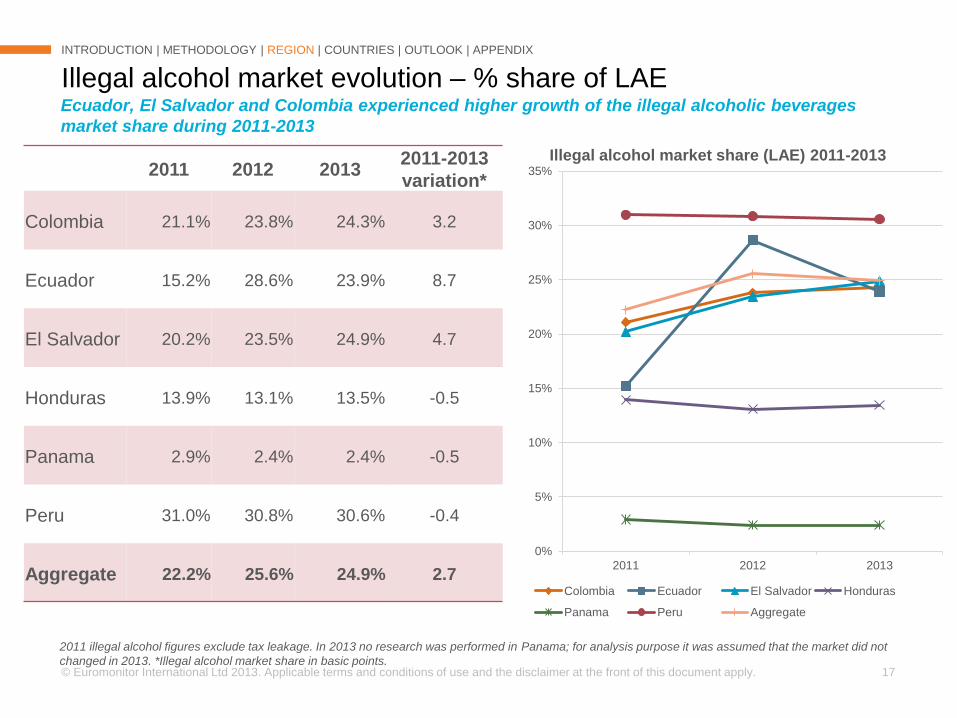
Illegal alcohol market evolution – % share of LAE
INTRODUCTION | METHODOLOGY | REGION | COUNTRIES | OUTLOOK | APPENDIX
2011 2012 20132011-2013
variation*
Colombia 21.1% 23.8% 24.3% 3.2
Ecuador 15.2% 28.6% 23.9% 8.7
El Salvador 20.2% 23.5% 24.9% 4.7
Honduras 13.9% 13.1% 13.5% -0.5
Panama 2.9% 2.4% 2.4% -0.5
Peru 31.0% 30.8% 30.6% -0.4
Aggregate 22.2% 25.6% 24.9% 2.7
Ecuador, El Salvador and Colombia experienced higher growth of the illegal alcoholic beverages
market share during 2011-2013
2011 illegal alcohol figures exclude tax leakage. In 2013 no research was performed in Panama; for analysis purpose it was assumed that the market did not
changed in 2013. *Illegal alcohol market share in basic points.
0%
5%
10%
15%
20%
25%
30%
35%
2011 2012 2013
Illegal alcohol market share (LAE) 2011-2013
Colombia Ecuador El Salvador Honduras
Panama Peru Aggregate
© Euromonitor International Ltd 2013. Applicable terms and conditions of use and the disclaimer at the front of this document apply. 18
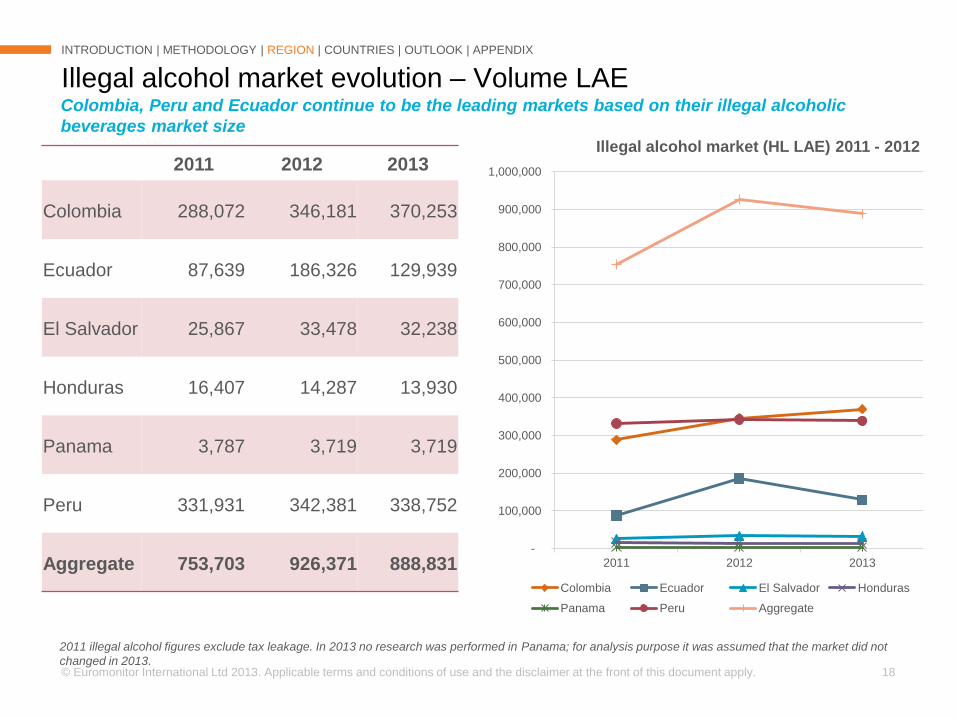
Illegal alcohol market evolution – Volume LAE
INTRODUCTION | METHODOLOGY | REGION | COUNTRIES | OUTLOOK | APPENDIX
2011 2012 2013
Colombia 288,072 346,181 370,253
Ecuador 87,639 186,326 129,939
El Salvador 25,867 33,478 32,238
Honduras 16,407 14,287 13,930
Panama 3,787 3,719 3,719
Peru 331,931 342,381 338,752
Aggregate 753,703 926,371 888,831
Colombia, Peru and Ecuador continue to be the leading markets based on their illegal alcoholic
beverages market size
2011 illegal alcohol figures exclude tax leakage. In 2013 no research was performed in Panama; for analysis purpose it was assumed that the market did not
changed in 2013.
-
100,000
200,000
300,000
400,000
500,000
600,000
700,000
800,000
900,000
1,000,000
2011 2012 2013
Illegal alcohol market (HL LAE) 2011 - 2012
Colombia Ecuador El Salvador Honduras
Panama Peru Aggregate
© Euromonitor International Ltd 2013. Applicable terms and conditions of use and the disclaimer at the front of this document apply. 19
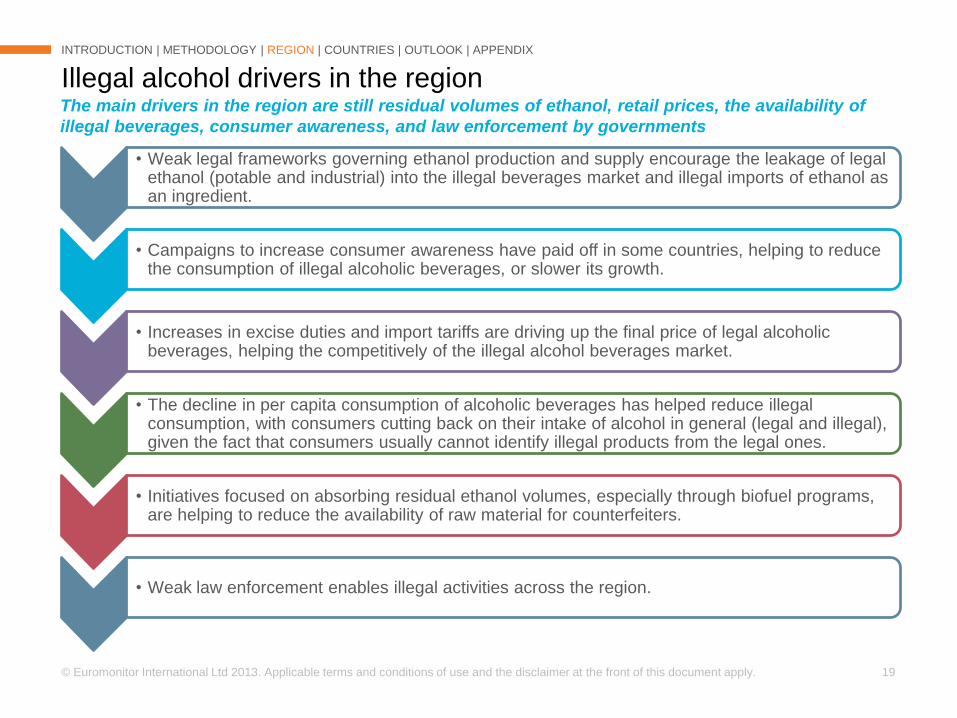
• Weak legal frameworks governing ethanol production and supply encourage the leakage of legal ethanol (potable and industrial) into the illegal beverages market and illegal imports of ethanol as an ingredient.
• Campaigns to increase consumer awareness have paid off in some countries, helping to reduce the consumption of illegal alcoholic beverages, or slower its growth.
• Increases in excise duties and import tariffs are driving up the final price of legal alcoholic beverages, helping the competitively of the illegal alcohol beverages market.
• The decline in per capita consumption of alcoholic beverages has helped reduce illegal consumption, with consumers cutting back on their intake of alcohol in general (legal and illegal), given the fact that consumers usually cannot identify illegal products from the legal ones.
• Initiatives focused on absorbing residual ethanol volumes, especially through biofuel programs, are helping to reduce the availability of raw material for counterfeiters.
• Weak law enforcement enables illegal activities across the region.
Illegal alcohol drivers in the region
INTRODUCTION | METHODOLOGY | REGION | COUNTRIES | OUTLOOK | APPENDIX
The main drivers in the region are still residual volumes of ethanol, retail prices, the availability of
illegal beverages, consumer awareness, and law enforcement by governments
© Euromonitor International Ltd 2013. Applicable terms and conditions of use and the disclaimer at the front of this document apply. 20
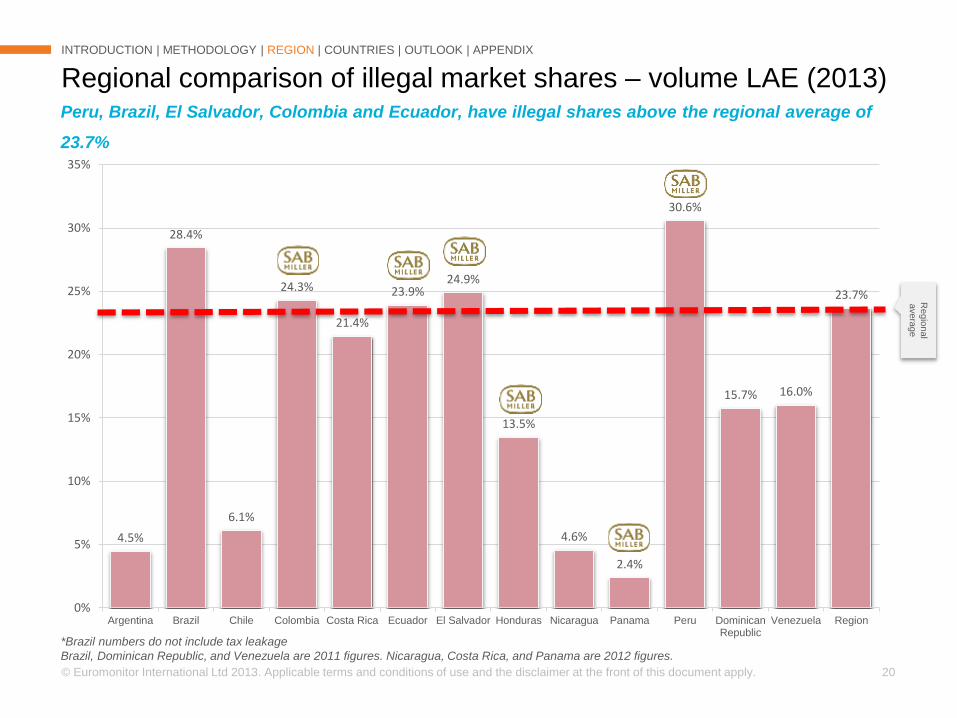
4.5%
28.4%
6.1%
24.3%
21.4%
23.9%24.9%
13.5%
4.6%
2.4%
30.6%
15.7% 16.0%
23.7%
0%
5%
10%
15%
20%
25%
30%
35%
Argentina Brazil Chile Colombia Costa Rica Ecuador El Salvador Honduras Nicaragua Panama Peru DominicanRepublic
Venezuela Region
Regional comparison of illegal market shares – volume LAE (2013)
INTRODUCTION | METHODOLOGY | REGION | COUNTRIES | OUTLOOK | APPENDIX
Peru, Brazil, El Salvador, Colombia and Ecuador, have illegal shares above the regional average of
23.7%
*Brazil numbers do not include tax leakage
Brazil, Dominican Republic, and Venezuela are 2011 figures. Nicaragua, Costa Rica, and Panama are 2012 figures.
Regio
nal
avera
ge
© Euromonitor International Ltd 2013. Applicable terms and conditions of use and the disclaimer at the front of this document apply. 21
24.3%
23.9%
24.9%
13.5%
2.4%
30.6%
24.9%
0% 10% 20% 30% 40% 50% 60% 70% 80% 90% 100%
Colombia
Ecuador
El Salvador
Honduras
Panama
Peru
Aggregate
Illegal LAE % Legal LAE %
Illegal market shares – volume LAE (2013)
INTRODUCTION | METHODOLOGY | REGION | COUNTRIES | OUTLOOK | APPENDIX
Peru, Colombia and Ecuador, continue to drive the illegal consumption of alcoholic beverages in the
region
*Panama figures correspond to 2012.
Regional average
© Euromonitor International Ltd 2013. Applicable terms and conditions of use and the disclaimer at the front of this document apply. 22
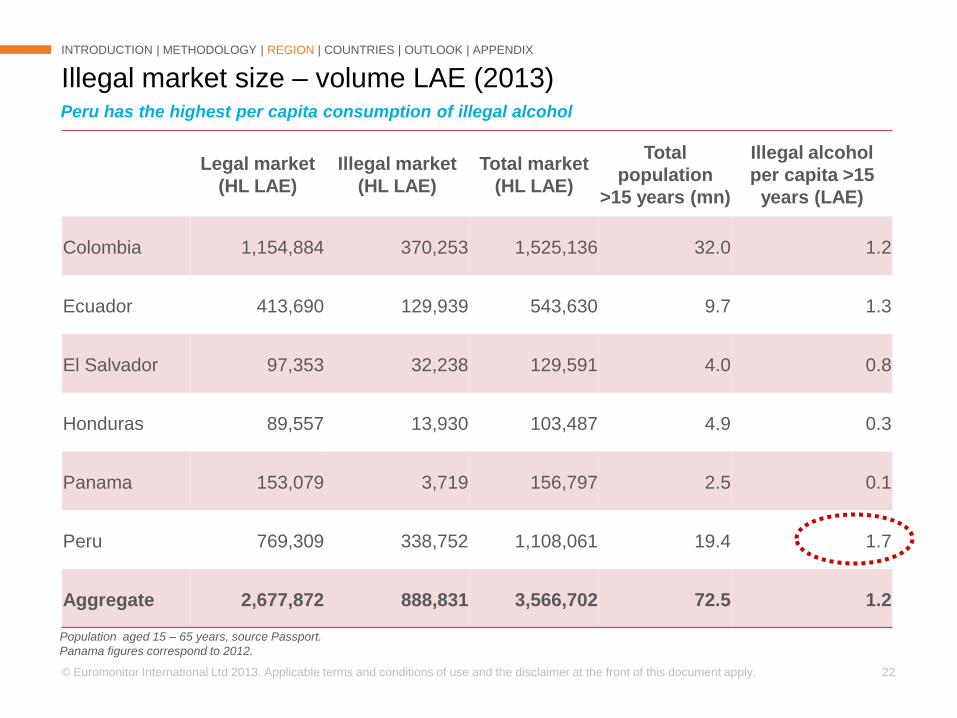
Illegal market size – volume LAE (2013)
INTRODUCTION | METHODOLOGY | REGION | COUNTRIES | OUTLOOK | APPENDIX
Legal market
(HL LAE)
Illegal market
(HL LAE)
Total market
(HL LAE)
Total
population
>15 years (mn)
Illegal alcohol
per capita >15
years (LAE)
Colombia 1,154,884 370,253 1,525,136 32.0 1.2
Ecuador 413,690 129,939 543,630 9.7 1.3
El Salvador 97,353 32,238 129,591 4.0 0.8
Honduras 89,557 13,930 103,487 4.9 0.3
Panama 153,079 3,719 156,797 2.5 0.1
Peru 769,309 338,752 1,108,061 19.4 1.7
Aggregate 2,677,872 888,831 3,566,702 72.5 1.2
Peru has the highest per capita consumption of illegal alcohol
Population aged 15 – 65 years, source Passport.
Panama figures correspond to 2012.
© Euromonitor International Ltd 2013. Applicable terms and conditions of use and the disclaimer at the front of this document apply. 23
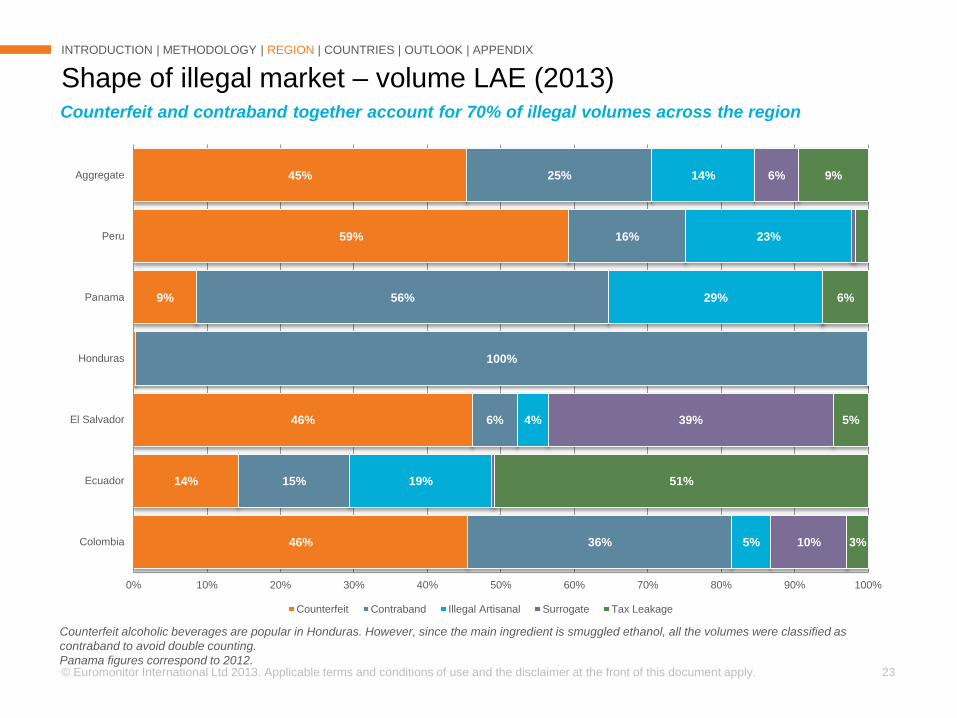
Shape of illegal market – volume LAE (2013)
INTRODUCTION | METHODOLOGY | REGION | COUNTRIES | OUTLOOK | APPENDIX
Counterfeit and contraband together account for 70% of illegal volumes across the region
Counterfeit alcoholic beverages are popular in Honduras. However, since the main ingredient is smuggled ethanol, all the volumes were classified as
contraband to avoid double counting.
Panama figures correspond to 2012.
46%
14%
46%
9%
59%
45%
36%
15%
6%
100%
56%
16%
25%
5%
19%
4%
29%
23%
14%
10%
39%
6%
3%
51%
5%
6%
9%
0% 10% 20% 30% 40% 50% 60% 70% 80% 90% 100%
Colombia
Ecuador
El Salvador
Honduras
Panama
Peru
Aggregate
Counterfeit Contraband Illegal Artisanal Surrogate Tax Leakage
© Euromonitor International Ltd 2013. Applicable terms and conditions of use and the disclaimer at the front of this document apply. 24
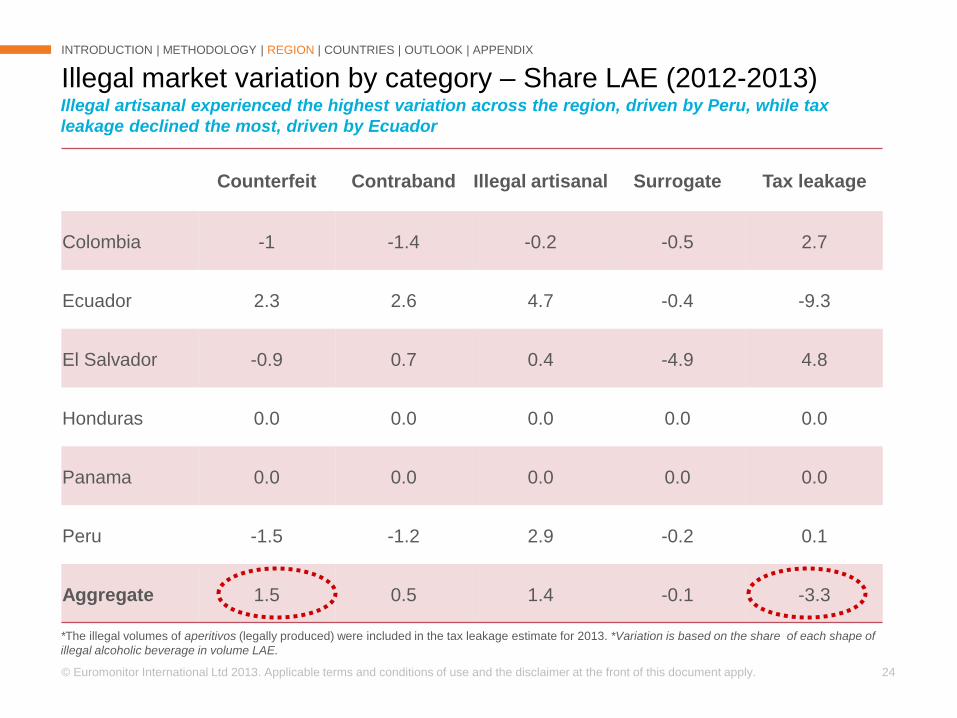
Illegal market variation by category – Share LAE (2012-2013)
INTRODUCTION | METHODOLOGY | REGION | COUNTRIES | OUTLOOK | APPENDIX
Counterfeit Contraband Illegal artisanal Surrogate Tax leakage
Colombia -1 -1.4 -0.2 -0.5 2.7
Ecuador 2.3 2.6 4.7 -0.4 -9.3
El Salvador -0.9 0.7 0.4 -4.9 4.8
Honduras 0.0 0.0 0.0 0.0 0.0
Panama 0.0 0.0 0.0 0.0 0.0
Peru -1.5 -1.2 2.9 -0.2 0.1
Aggregate 1.5 0.5 1.4 -0.1 -3.3
Illegal artisanal experienced the highest variation across the region, driven by Peru, while tax
leakage declined the most, driven by Ecuador
*The illegal volumes of aperitivos (legally produced) were included in the tax leakage estimate for 2013. *Variation is based on the share of each shape of
illegal alcoholic beverage in volume LAE.
© Euromonitor International Ltd 2013. Applicable terms and conditions of use and the disclaimer at the front of this document apply. 25
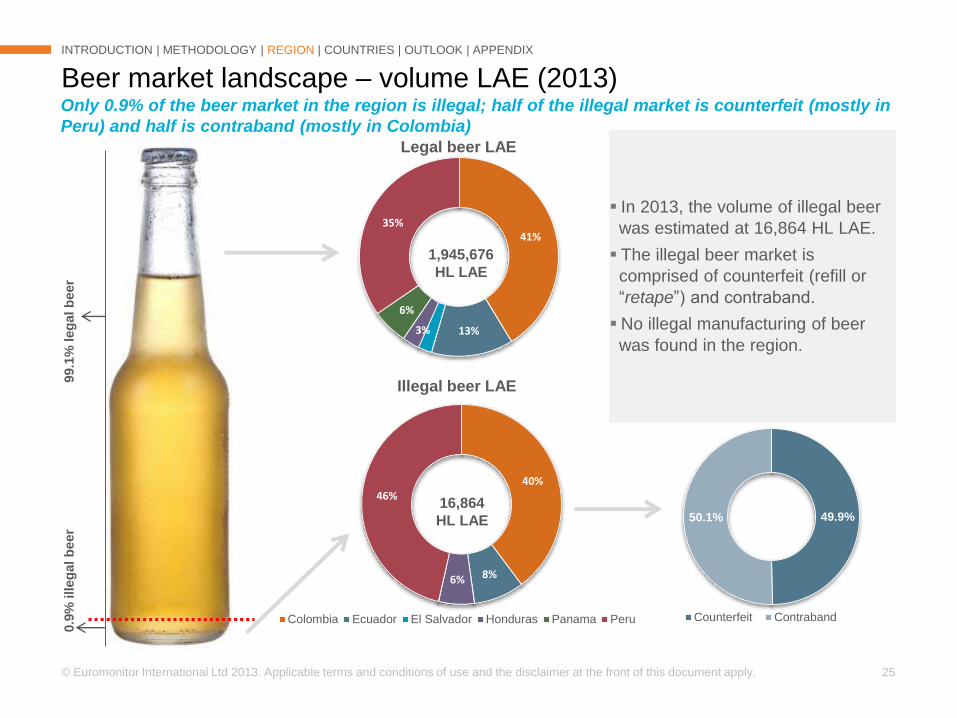
Beer market landscape – volume LAE (2013)
INTRODUCTION | METHODOLOGY | REGION | COUNTRIES | OUTLOOK | APPENDIX
Only 0.9% of the beer market in the region is illegal; half of the illegal market is counterfeit (mostly in
Peru) and half is contraband (mostly in Colombia)
99.1
% leg
al b
eer
0.9
% illeg
al b
eer
41%
13%3%
6%
35%
Legal beer LAE
1,945,676
HL LAE
40%
8%6%
46%
Illegal beer LAE
Colombia Ecuador El Salvador Honduras Panama Peru
16,864
HL LAE 49.9%50.1%
Counterfeit Contraband
In 2013, the volume of illegal beer
was estimated at 16,864 HL LAE.
The illegal beer market is
comprised of counterfeit (refill or
“retape”) and contraband.
No illegal manufacturing of beer
was found in the region.
© Euromonitor International Ltd 2013. Applicable terms and conditions of use and the disclaimer at the front of this document apply. 26
Counterfeit Contraband Total
Colombia 1,423 5,289 6,712
Ecuador 2 1,379 1,381
El Salvador 0 0 0
Honduras 0 971 971
Peru 6,988 813 7,800
Aggregate 8,412 8,452 16,864
Illegal beer – volume LAE (2013)
INTRODUCTION | METHODOLOGY | REGION | COUNTRIES | OUTLOOK | APPENDIX
In Peru 90% of illegal beer is counterfeit, whereas in Colombia 79% is contraband; these two
countries are the largest illegal beer markets in the region
In Panama, as no research was performed for 2013; for analysis purpose it was assumed that the market did not changed in 2013.
Illegal market value
2013 888,831 HL LAE
TOTAL ILLEGAL VOLUME
US$2,604 mn
TOTAL VALUE IN ILLEGAL RSP
US$798 mn
TOTAL FISCAL LOSS
US$3,267 mn
TOTAL VALUE IN LEGAL RSP
*RSP: retail selling prices
© Euromonitor International Ltd 2013. Applicable terms and conditions of use and the disclaimer at the front of this document apply. 28
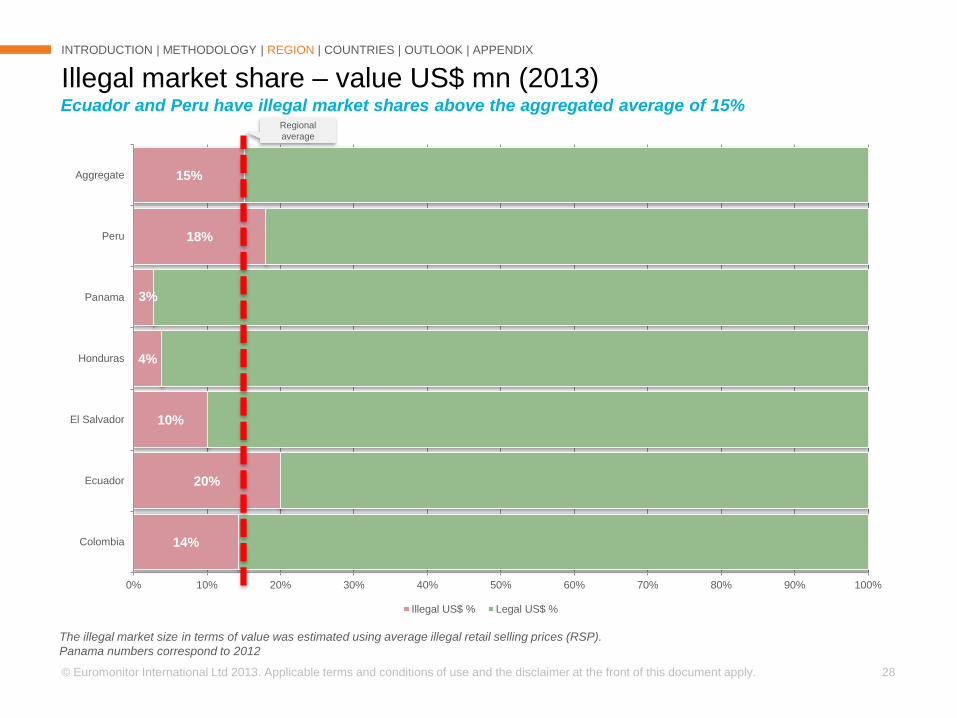
14%
20%
10%
4%
3%
18%
15%
0% 10% 20% 30% 40% 50% 60% 70% 80% 90% 100%
Colombia
Ecuador
El Salvador
Honduras
Panama
Peru
Aggregate
Illegal US$ % Legal US$ %
Illegal market share – value US$ mn (2013)
INTRODUCTION | METHODOLOGY | REGION | COUNTRIES | OUTLOOK | APPENDIX
Ecuador and Peru have illegal market shares above the aggregated average of 15%
The illegal market size in terms of value was estimated using average illegal retail selling prices (RSP).
Panama numbers correspond to 2012
Regional
average
© Euromonitor International Ltd 2013. Applicable terms and conditions of use and the disclaimer at the front of this document apply. 29
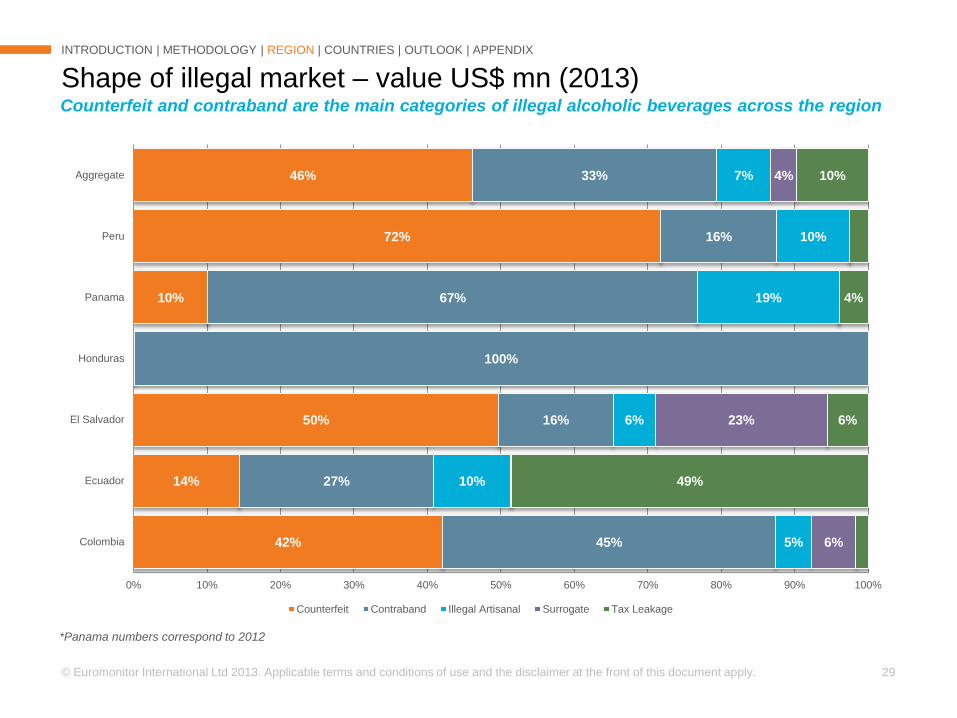
Shape of illegal market – value US$ mn (2013)
INTRODUCTION | METHODOLOGY | REGION | COUNTRIES | OUTLOOK | APPENDIX
Counterfeit and contraband are the main categories of illegal alcoholic beverages across the region
42%
14%
50%
10%
72%
46%
45%
27%
16%
100%
67%
16%
33%
5%
10%
6%
19%
10%
7%
6%
23%
4%
49%
6%
4%
10%
0% 10% 20% 30% 40% 50% 60% 70% 80% 90% 100%
Colombia
Ecuador
El Salvador
Honduras
Panama
Peru
Aggregate
Counterfeit Contraband Illegal Artisanal Surrogate Tax Leakage
*Panama numbers correspond to 2012
© Euromonitor International Ltd 2013. Applicable terms and conditions of use and the disclaimer at the front of this document apply. 30
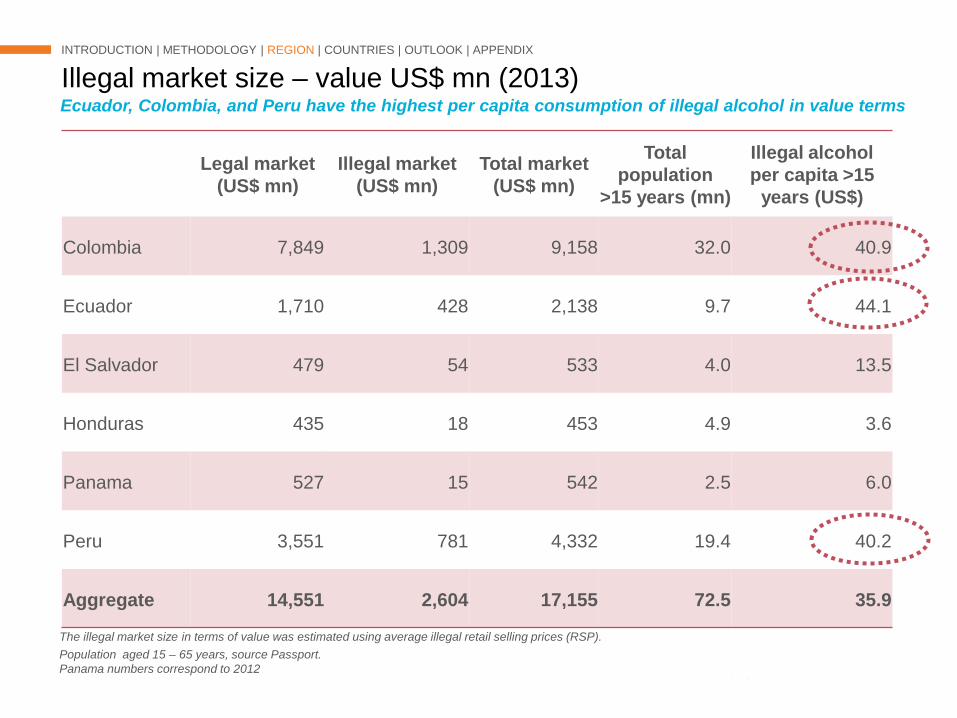
Legal market
(US$ mn)
Illegal market
(US$ mn)
Total market
(US$ mn)
Total
population
>15 years (mn)
Illegal alcohol
per capita >15
years (US$)
Colombia 7,849 1,309 9,158 32.0 40.9
Ecuador 1,710 428 2,138 9.7 44.1
El Salvador 479 54 533 4.0 13.5
Honduras 435 18 453 4.9 3.6
Panama 527 15 542 2.5 6.0
Peru 3,551 781 4,332 19.4 40.2
Aggregate 14,551 2,604 17,155 72.5 35.9
Illegal market size – value US$ mn (2013)
INTRODUCTION | METHODOLOGY | REGION | COUNTRIES | OUTLOOK | APPENDIX
The illegal market size in terms of value was estimated using average illegal retail selling prices (RSP).
Ecuador, Colombia, and Peru have the highest per capita consumption of illegal alcohol in value terms
Population aged 15 – 65 years, source Passport.
Panama numbers correspond to 2012
© Euromonitor International Ltd 2013. Applicable terms and conditions of use and the disclaimer at the front of this document apply. 31
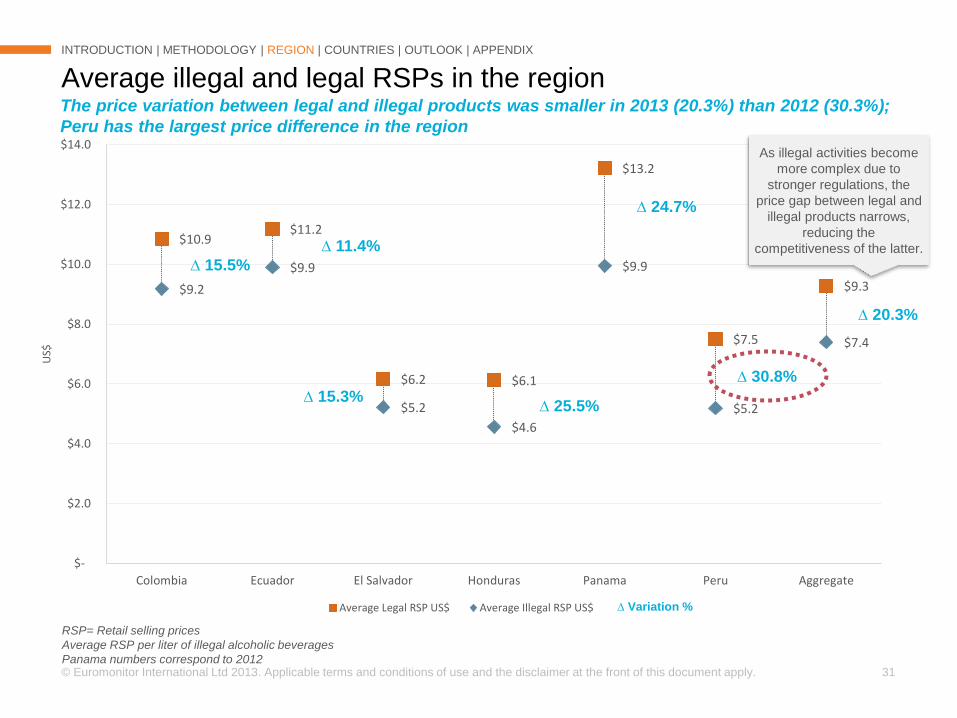
$10.9 $11.2
$6.2 $6.1
$13.2
$7.5
$9.3 $9.2
$9.9
$5.2
$4.6
$9.9
$5.2
$7.4
$-
$2.0
$4.0
$6.0
$8.0
$10.0
$12.0
$14.0
Colombia Ecuador El Salvador Honduras Panama Peru Aggregate
US$
Average Legal RSP US$ Average Illegal RSP US$
Average illegal and legal RSPs in the region
INTRODUCTION | METHODOLOGY | REGION | COUNTRIES | OUTLOOK | APPENDIX
The price variation between legal and illegal products was smaller in 2013 (20.3%) than 2012 (30.3%);
Peru has the largest price difference in the region
∆ 25.5%
∆ 11.4%
∆ 30.8%
RSP= Retail selling prices
Average RSP per liter of illegal alcoholic beverages
Panama numbers correspond to 2012
∆ 20.3%
∆ 24.7%
∆ 15.5%
∆ 15.3%
∆ Variation %
As illegal activities become
more complex due to
stronger regulations, the
price gap between legal and
illegal products narrows,
reducing the
competitiveness of the latter.
© Euromonitor International Ltd 2013. Applicable terms and conditions of use and the disclaimer at the front of this document apply. 32
20%
15%
7%
58%
Illegal beer US$ mn
Colombia Ecuador El Salvador Honduras Panama Peru
50%
11%
3%
29%
Legal beer US$ mn
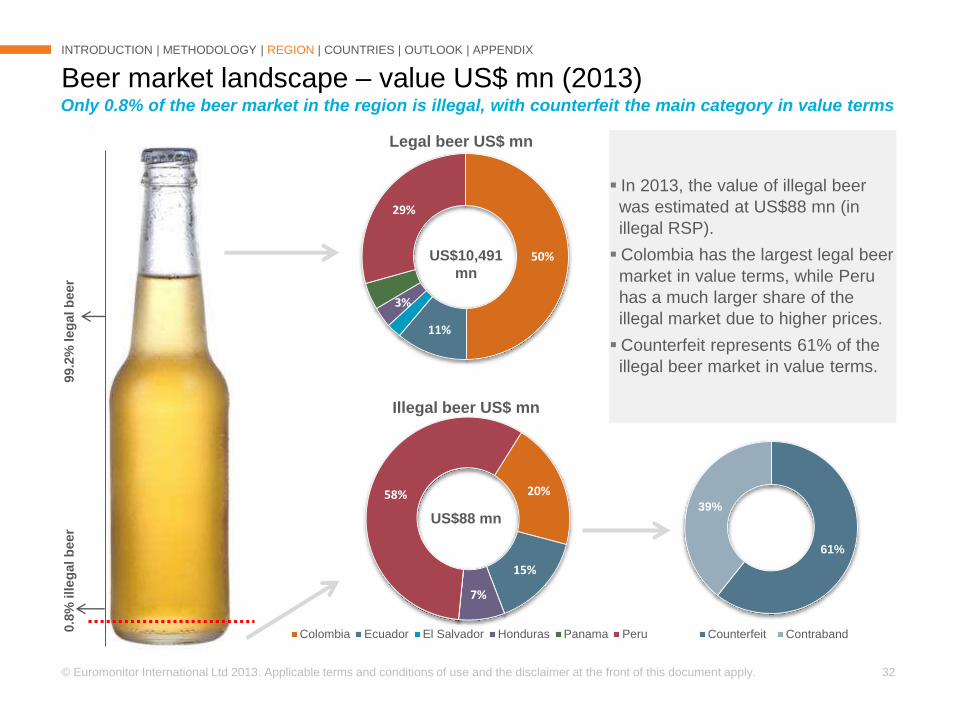
Beer market landscape – value US$ mn (2013)
INTRODUCTION | METHODOLOGY | REGION | COUNTRIES | OUTLOOK | APPENDIX
Only 0.8% of the beer market in the region is illegal, with counterfeit the main category in value terms
99.2
% leg
al b
eer
0.8
% illeg
al b
eer
US$10,491
mn
US$88 mn
In 2013, the value of illegal beer
was estimated at US$88 mn (in
illegal RSP).
Colombia has the largest legal beer
market in value terms, while Peru
has a much larger share of the
illegal market due to higher prices.
Counterfeit represents 61% of the
illegal beer market in value terms.
61%
39%
Counterfeit Contraband
© Euromonitor International Ltd 2013. Applicable terms and conditions of use and the disclaimer at the front of this document apply. 33
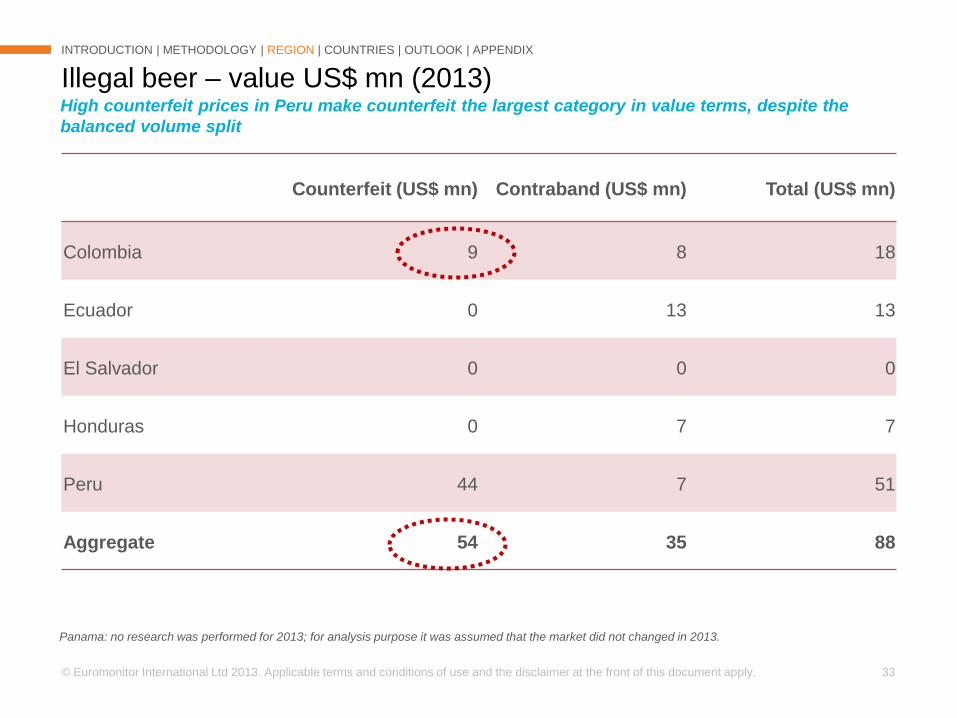
Counterfeit (US$ mn) Contraband (US$ mn) Total (US$ mn)
Colombia 9 8 18
Ecuador 0 13 13
El Salvador 0 0 0
Honduras 0 7 7
Peru 44 7 51
Aggregate 54 35 88
Illegal beer – value US$ mn (2013)
INTRODUCTION | METHODOLOGY | REGION | COUNTRIES | OUTLOOK | APPENDIX
High counterfeit prices in Peru make counterfeit the largest category in value terms, despite the
balanced volume split
Panama: no research was performed for 2013; for analysis purpose it was assumed that the market did not changed in 2013.

Fiscal loss 2013
888,831 HL LAE
TOTAL ILLEGAL VOLUME
US$2,604 mn
TOTAL VALUE IN ILLEGAL RSP
US$798 mn
TOTAL FISCAL LOSS
US$3,267 mn
TOTAL VALUE IN LEGAL RSP
*RSP: retail selling prices
© Euromonitor International Ltd 2013. Applicable terms and conditions of use and the disclaimer at the front of this document apply. 35
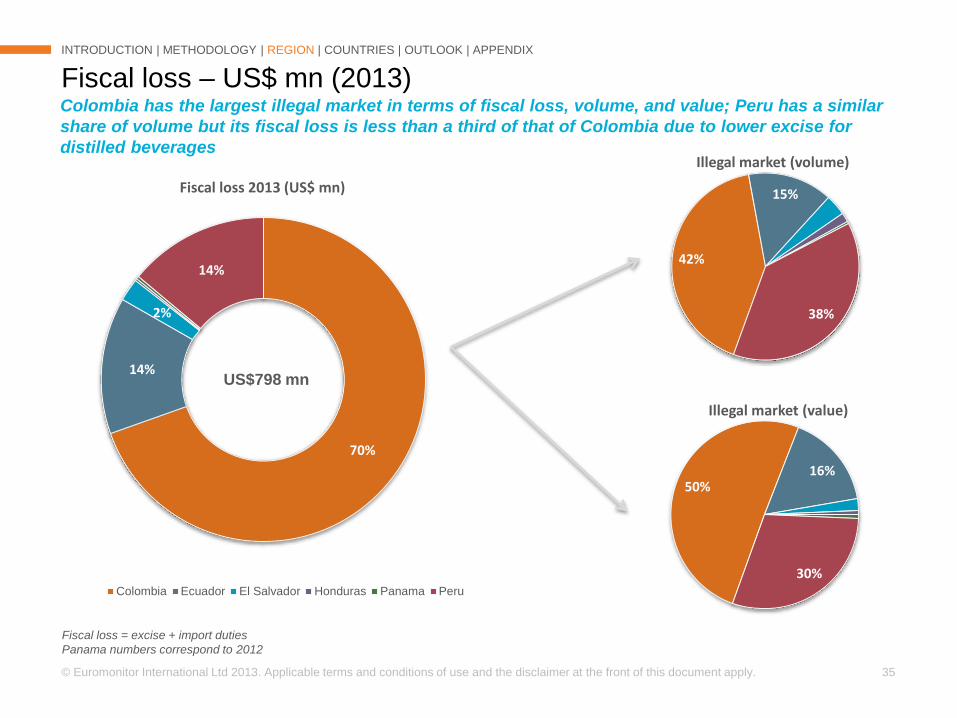
70%
14%
2%
14%
Fiscal loss 2013 (US$ mn)
Colombia Ecuador El Salvador Honduras Panama Peru
42%
15%
38%
Illegal market (volume)
Fiscal loss – US$ mn (2013)
INTRODUCTION | METHODOLOGY | REGION | COUNTRIES | OUTLOOK | APPENDIX
Colombia has the largest illegal market in terms of fiscal loss, volume, and value; Peru has a similar
share of volume but its fiscal loss is less than a third of that of Colombia due to lower excise for
distilled beverages
Fiscal loss = excise + import duties
Panama numbers correspond to 2012
50%16%
30%
Illegal market (value)
US$798 mn
© Euromonitor International Ltd 2013. Applicable terms and conditions of use and the disclaimer at the front of this document apply. 36
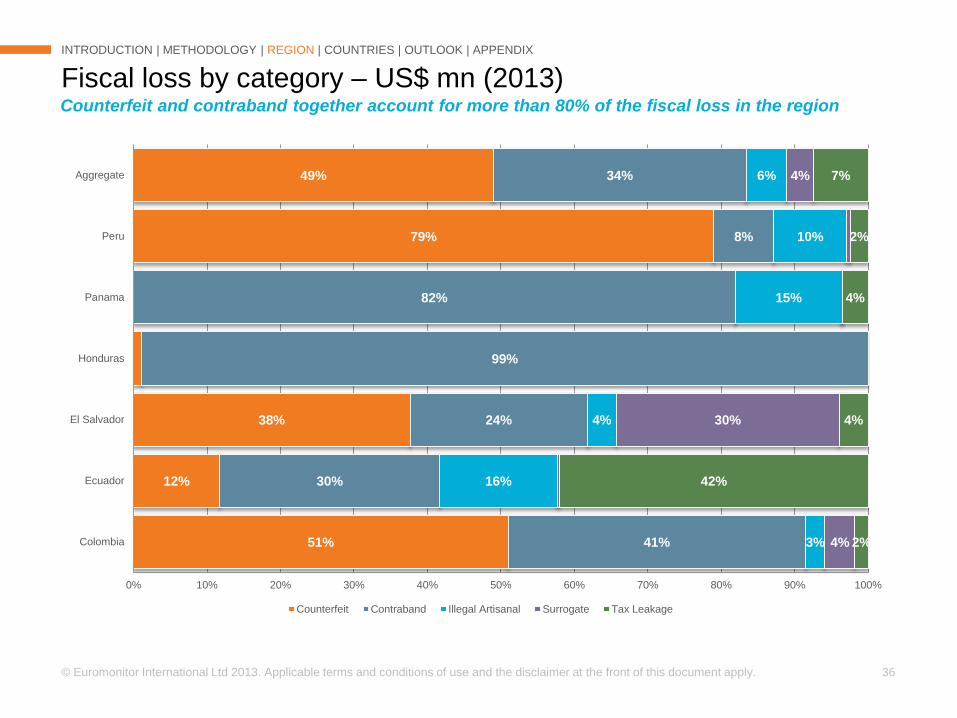
Fiscal loss by category – US$ mn (2013)
INTRODUCTION | METHODOLOGY | REGION | COUNTRIES | OUTLOOK | APPENDIX
Counterfeit and contraband together account for more than 80% of the fiscal loss in the region
51%
12%
38%
79%
49%
41%
30%
24%
99%
82%
8%
34%
3%
16%
4%
15%
10%
6%
4%
30%
4%
2%
42%
4%
4%
2%
7%
0% 10% 20% 30% 40% 50% 60% 70% 80% 90% 100%
Colombia
Ecuador
El Salvador
Honduras
Panama
Peru
Aggregate
Counterfeit Contraband Illegal Artisanal Surrogate Tax Leakage
© Euromonitor International Ltd 2013. Applicable terms and conditions of use and the disclaimer at the front of this document apply. 37
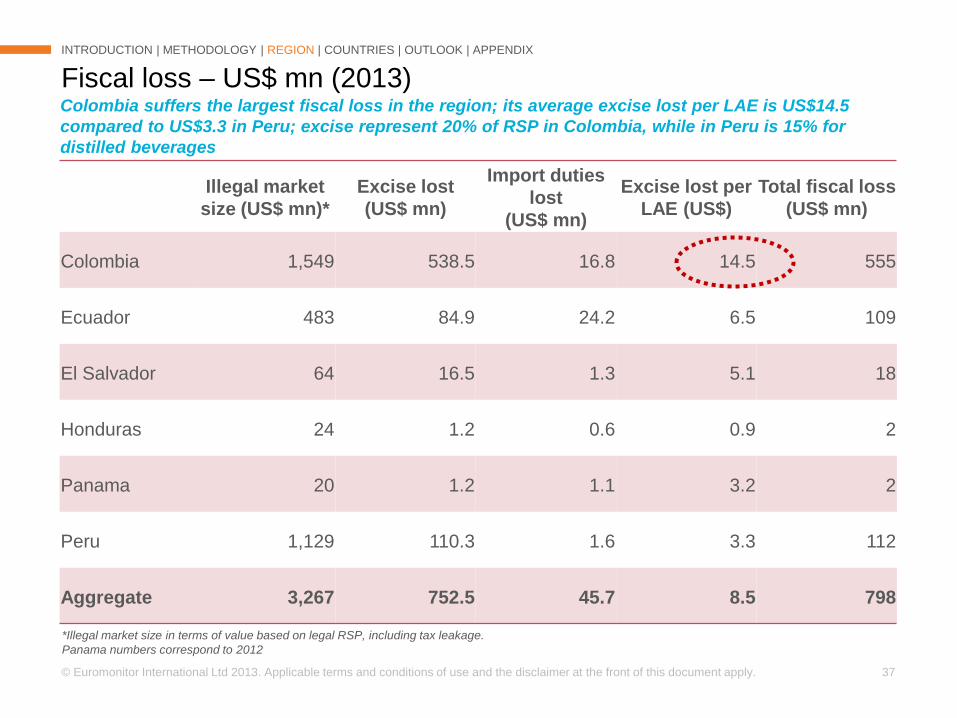
Fiscal loss – US$ mn (2013)
INTRODUCTION | METHODOLOGY | REGION | COUNTRIES | OUTLOOK | APPENDIX
Illegal market
size (US$ mn)*
Excise lost
(US$ mn)
Import duties
lost
(US$ mn)
Excise lost per
LAE (US$)
Total fiscal loss
(US$ mn)
Colombia 1,549 538.5 16.8 14.5 555
Ecuador 483 84.9 24.2 6.5 109
El Salvador 64 16.5 1.3 5.1 18
Honduras 24 1.2 0.6 0.9 2
Panama 20 1.2 1.1 3.2 2
Peru 1,129 110.3 1.6 3.3 112
Aggregate 3,267 752.5 45.7 8.5 798
Colombia suffers the largest fiscal loss in the region; its average excise lost per LAE is US$14.5
compared to US$3.3 in Peru; excise represent 20% of RSP in Colombia, while in Peru is 15% for
distilled beverages
*Illegal market size in terms of value based on legal RSP, including tax leakage.
Panama numbers correspond to 2012
© Euromonitor International Ltd 2013. Applicable terms and conditions of use and the disclaimer at the front of this document apply. 38
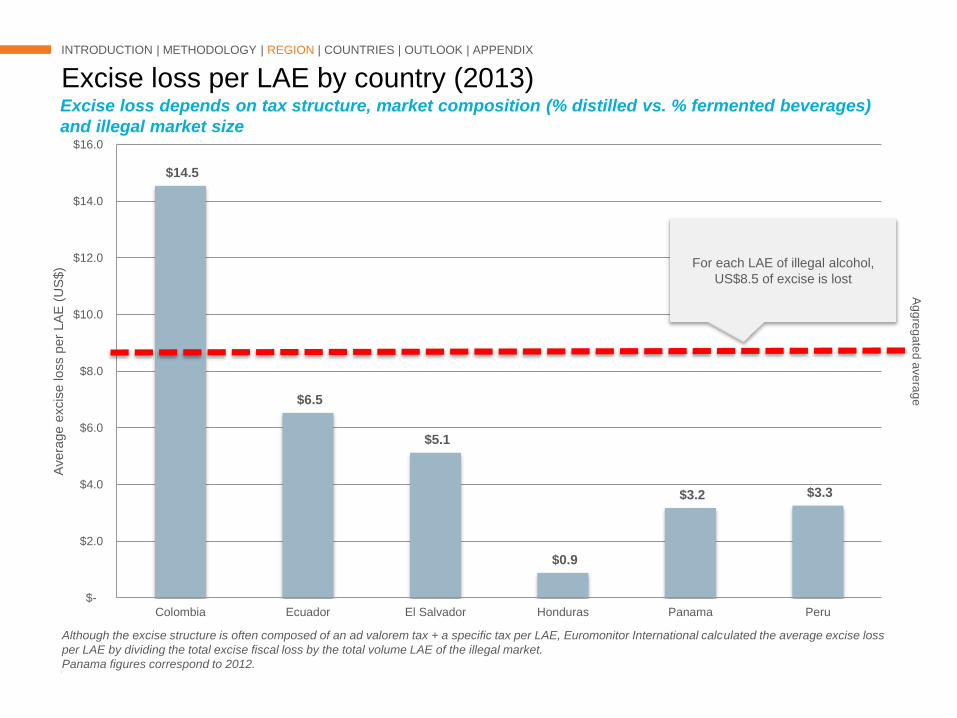
$14.5
$6.5
$5.1
$0.9
$3.2 $3.3
$-
$2.0
$4.0
$6.0
$8.0
$10.0
$12.0
$14.0
$16.0
Colombia Ecuador El Salvador Honduras Panama Peru
Avera
ge e
xcis
e loss p
er
LA
E (
US
$)
Excise loss per LAE by country (2013)
INTRODUCTION | METHODOLOGY | REGION | COUNTRIES | OUTLOOK | APPENDIX
Although the excise structure is often composed of an ad valorem tax + a specific tax per LAE, Euromonitor International calculated the average excise loss
per LAE by dividing the total excise fiscal loss by the total volume LAE of the illegal market.
Panama figures correspond to 2012.
For each LAE of illegal alcohol,
US$8.5 of excise is lost
Excise loss depends on tax structure, market composition (% distilled vs. % fermented beverages)
and illegal market size
Ag
gre
ga
ted
ave
rag
e
© Euromonitor International Ltd 2013. Applicable terms and conditions of use and the disclaimer at the front of this document apply. 39
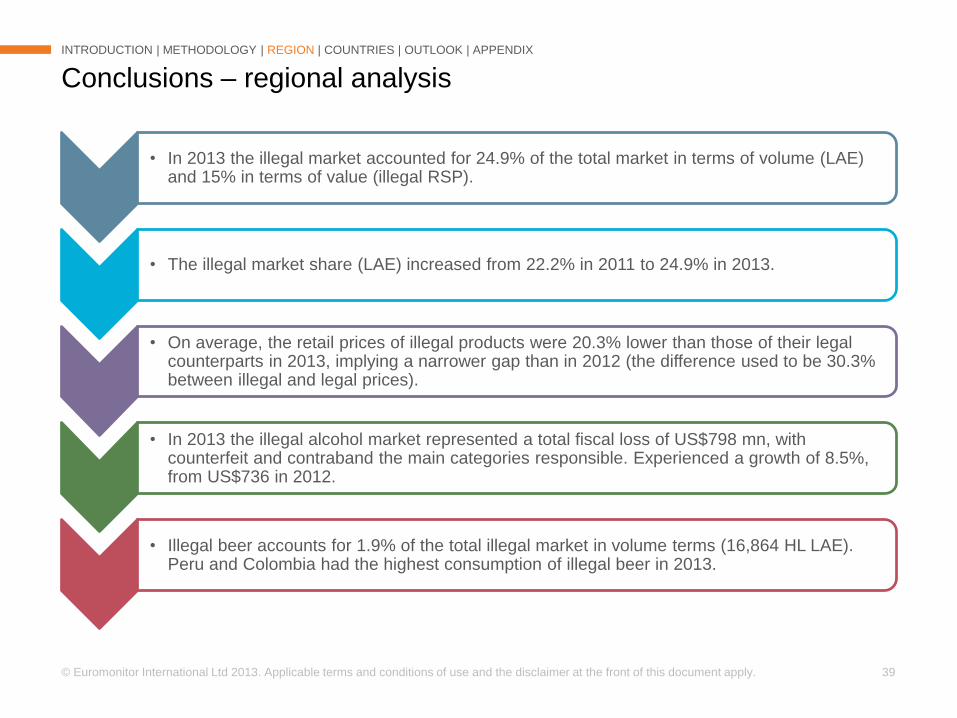
• In 2013 the illegal market accounted for 24.9% of the total market in terms of volume (LAE) and 15% in terms of value (illegal RSP).
• The illegal market share (LAE) increased from 22.2% in 2011 to 24.9% in 2013.
• On average, the retail prices of illegal products were 20.3% lower than those of their legal counterparts in 2013, implying a narrower gap than in 2012 (the difference used to be 30.3% between illegal and legal prices).
• In 2013 the illegal alcohol market represented a total fiscal loss of US$798 mn, with counterfeit and contraband the main categories responsible. Experienced a growth of 8.5%, from US$736 in 2012.
• Illegal beer accounts for 1.9% of the total illegal market in volume terms (16,864 HL LAE). Peru and Colombia had the highest consumption of illegal beer in 2013.
Conclusions – regional analysis
INTRODUCTION | METHODOLOGY | REGION | COUNTRIES | OUTLOOK | APPENDIX

INTRODUCTION
METHODOLOGY
ANALYSIS - REGION
ANALYSIS - COUNTRIES
2014 OUTLOOK
APPENDIX
INTRODUCTION
METHODOLOGY
ANALYSIS - REGION
ANALYSIS – COUNTRIES
2014 OUTLOOK
APPENDIX
►►Colombia
© Euromonitor International Ltd 2013. Applicable terms and conditions of use and the disclaimer at the front of this document apply. 42
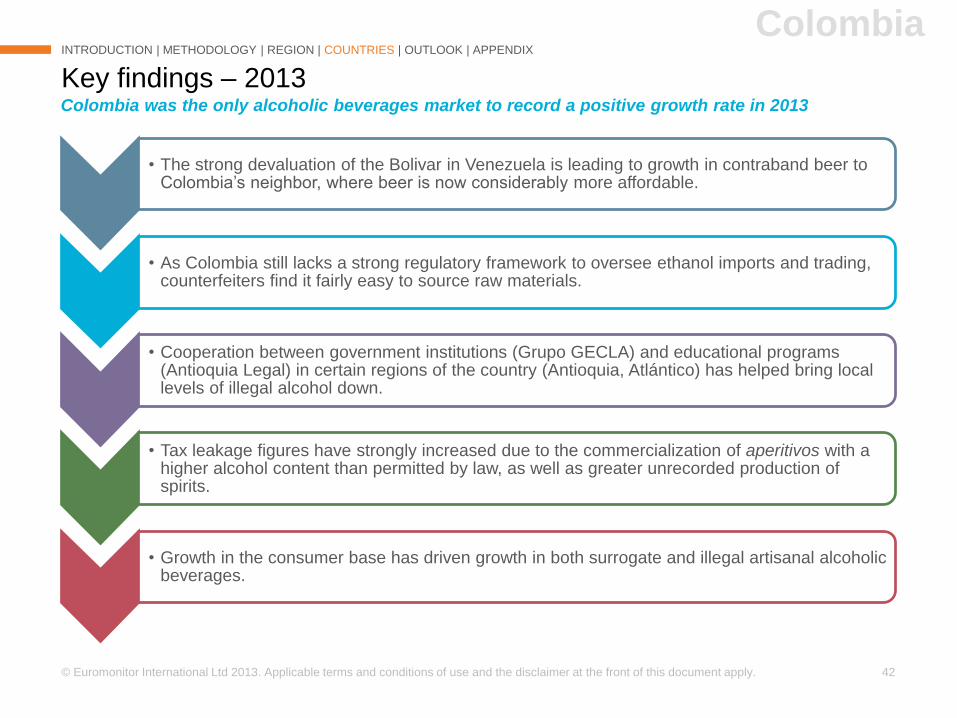
• The strong devaluation of the Bolivar in Venezuela is leading to growth in contraband beer to Colombia’s neighbor, where beer is now considerably more affordable.
• As Colombia still lacks a strong regulatory framework to oversee ethanol imports and trading, counterfeiters find it fairly easy to source raw materials.
• Cooperation between government institutions (Grupo GECLA) and educational programs (Antioquia Legal) in certain regions of the country (Antioquia, Atlántico) has helped bring local levels of illegal alcohol down.
• Tax leakage figures have strongly increased due to the commercialization of aperitivos with a higher alcohol content than permitted by law, as well as greater unrecorded production of spirits.
• Growth in the consumer base has driven growth in both surrogate and illegal artisanal alcoholic beverages.
Key findings – 2013
INTRODUCTION | METHODOLOGY | REGION | COUNTRIES | OUTLOOK | APPENDIX
Colombia was the only alcoholic beverages market to record a positive growth rate in 2013
Colombia
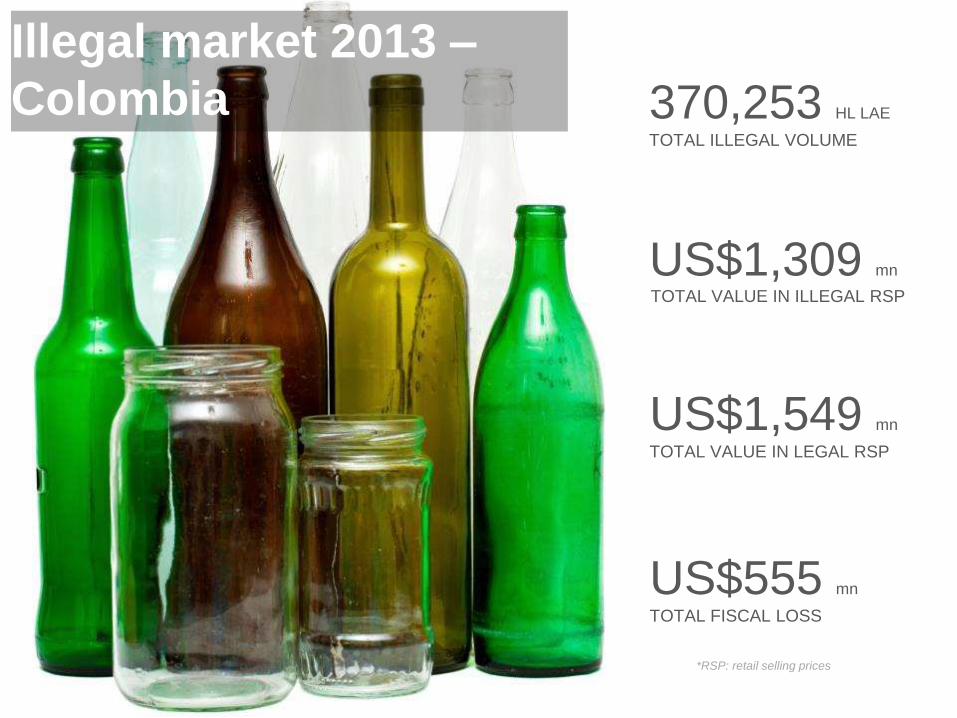
370,253 HL LAE
TOTAL ILLEGAL VOLUME
Illegal market 2013 –
Colombia
US$1,309 mn
TOTAL VALUE IN ILLEGAL RSP
US$555 mn
TOTAL FISCAL LOSS
US$1,549 mn
TOTAL VALUE IN LEGAL RSP
*RSP: retail selling prices
© Euromonitor International Ltd 2013. Applicable terms and conditions of use and the disclaimer at the front of this document apply. 44
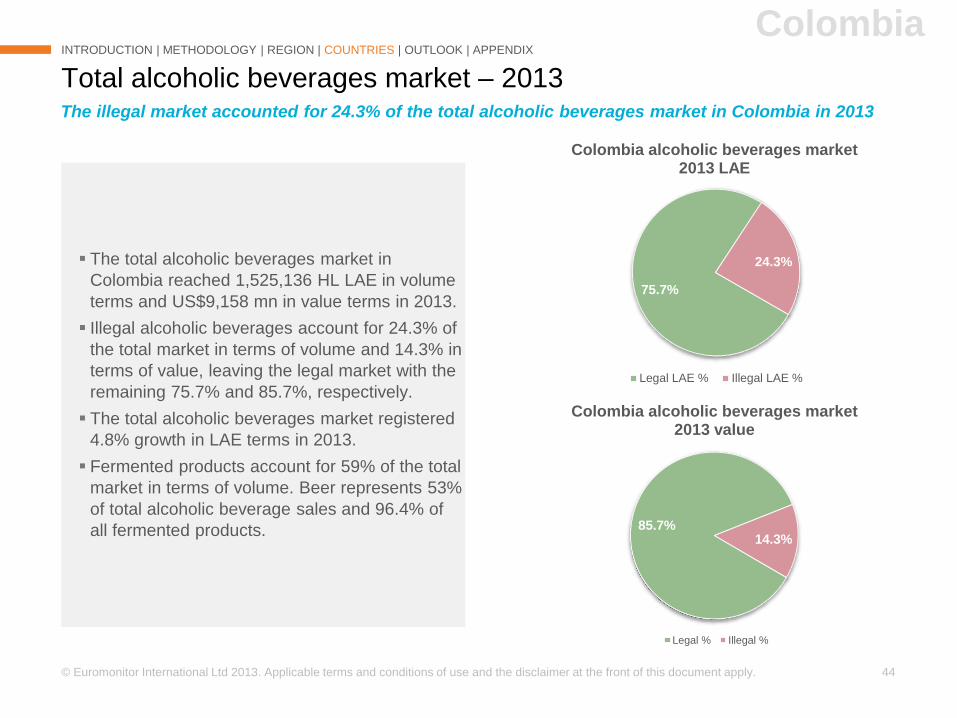
Total alcoholic beverages market – 2013
INTRODUCTION | METHODOLOGY | REGION | COUNTRIES | OUTLOOK | APPENDIX
The illegal market accounted for 24.3% of the total alcoholic beverages market in Colombia in 2013
Colombia
The total alcoholic beverages market in
Colombia reached 1,525,136 HL LAE in volume
terms and US$9,158 mn in value terms in 2013.
Illegal alcoholic beverages account for 24.3% of
the total market in terms of volume and 14.3% in
terms of value, leaving the legal market with the
remaining 75.7% and 85.7%, respectively.
The total alcoholic beverages market registered
4.8% growth in LAE terms in 2013.
Fermented products account for 59% of the total
market in terms of volume. Beer represents 53%
of total alcoholic beverage sales and 96.4% of
all fermented products.
75.7%
24.3%
Colombia alcoholic beverages market 2013 LAE
Legal LAE % Illegal LAE %
85.7%14.3%
Colombia alcoholic beverages market 2013 value
Legal % Illegal %
© Euromonitor International Ltd 2013. Applicable terms and conditions of use and the disclaimer at the front of this document apply. 45
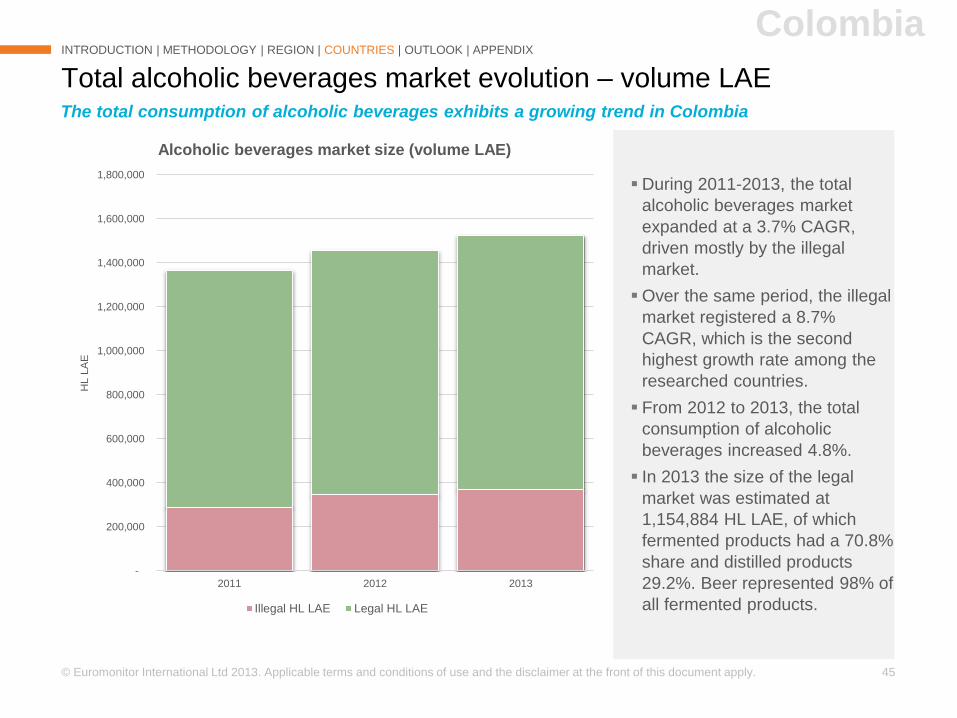
During 2011-2013, the total
alcoholic beverages market
expanded at a 3.7% CAGR,
driven mostly by the illegal
market.
Over the same period, the illegal
market registered a 8.7%
CAGR, which is the second
highest growth rate among the
researched countries.
From 2012 to 2013, the total
consumption of alcoholic
beverages increased 4.8%.
In 2013 the size of the legal
market was estimated at
1,154,884 HL LAE, of which
fermented products had a 70.8%
share and distilled products
29.2%. Beer represented 98% of
all fermented products.
Total alcoholic beverages market evolution – volume LAE
INTRODUCTION | METHODOLOGY | REGION | COUNTRIES | OUTLOOK | APPENDIX
Colombia
The total consumption of alcoholic beverages exhibits a growing trend in Colombia
-
200,000
400,000
600,000
800,000
1,000,000
1,200,000
1,400,000
1,600,000
1,800,000
2011 2012 2013
HL L
AE
Alcoholic beverages market size (volume LAE)
Illegal HL LAE Legal HL LAE
© Euromonitor International Ltd 2013. Applicable terms and conditions of use and the disclaimer at the front of this document apply. 46
Illegal alcoholic beverages market – Main drivers
INTRODUCTION | METHODOLOGY | REGION | COUNTRIES | OUTLOOK | APPENDIX
• Cheap smuggled products from Venezuela have driven the consumption of contraband, especially beer and rum.
• Higher levels of unemployment have also contributed to an increased preference for illegal alcoholic beverages, as consumers have limited resources.
• The illegal alcoholic beverages industry has embedded itself in the country’s culture. For people from some regions it has become an accepted way of life (especially counterfeit and contraband).
• Due to the specialized practices of the counterfeiters of aguardiente, consumers are often unaware that they are buying illegal alcoholic beverages.
• The lack of effective regulation over the trade/importation of ethanol makes it easy for counterfeiters to buy ethanol as a raw material.
A lack of control over ethanol supply continues to enable the illegal manufacture of spirits
Colombia
© Euromonitor International Ltd 2013. Applicable terms and conditions of use and the disclaimer at the front of this document apply. 47
51%40%
3%
4%
Fiscal loss 2013 (US$)
42%
45%
5%6%
Value 2013 (US$)
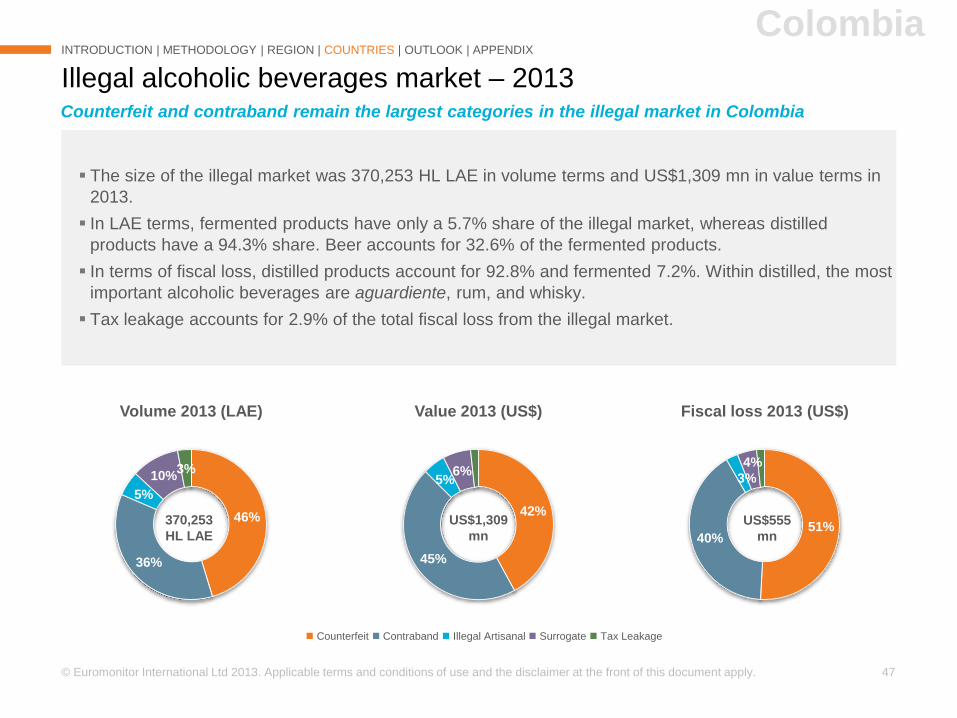
The size of the illegal market was 370,253 HL LAE in volume terms and US$1,309 mn in value terms in
2013.
In LAE terms, fermented products have only a 5.7% share of the illegal market, whereas distilled
products have a 94.3% share. Beer accounts for 32.6% of the fermented products.
In terms of fiscal loss, distilled products account for 92.8% and fermented 7.2%. Within distilled, the most
important alcoholic beverages are aguardiente, rum, and whisky.
Tax leakage accounts for 2.9% of the total fiscal loss from the illegal market.
Illegal alcoholic beverages market – 2013
INTRODUCTION | METHODOLOGY | REGION | COUNTRIES | OUTLOOK | APPENDIX
Counterfeit Contraband Illegal Artisanal Surrogate Tax Leakage
Counterfeit and contraband remain the largest categories in the illegal market in Colombia
370,253
HL LAE
US$555
mn
Colombia
US$1,309
mn
46%
36%
5%
10%3%
Volume 2013 (LAE)
© Euromonitor International Ltd 2013. Applicable terms and conditions of use and the disclaimer at the front of this document apply. 48
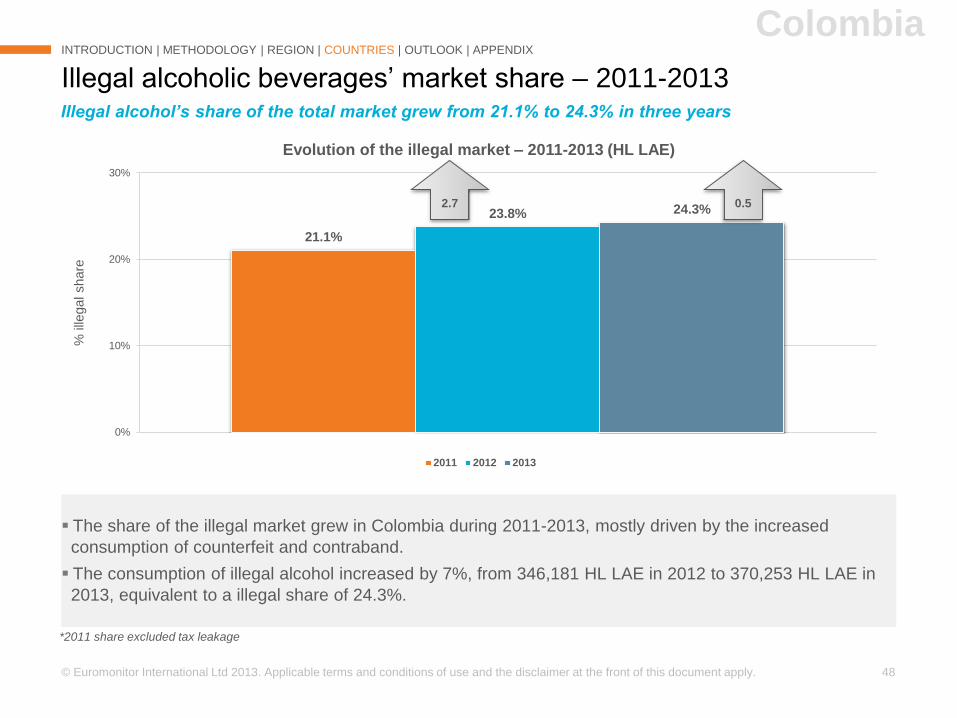
21.1%
23.8% 24.3%
0%
10%
20%
30%
% ille
gal share
Evolution of the illegal market – 2011-2013 (HL LAE)
2011 2012 2013
The share of the illegal market grew in Colombia during 2011-2013, mostly driven by the increased
consumption of counterfeit and contraband.
The consumption of illegal alcohol increased by 7%, from 346,181 HL LAE in 2012 to 370,253 HL LAE in
2013, equivalent to a illegal share of 24.3%.
Illegal alcoholic beverages’ market share – 2011-2013
INTRODUCTION | METHODOLOGY | REGION | COUNTRIES | OUTLOOK | APPENDIX
Illegal alcohol’s share of the total market grew from 21.1% to 24.3% in three years
Colombia
*2011 share excluded tax leakage
2.7 0.5
© Euromonitor International Ltd 2013. Applicable terms and conditions of use and the disclaimer at the front of this document apply. 49
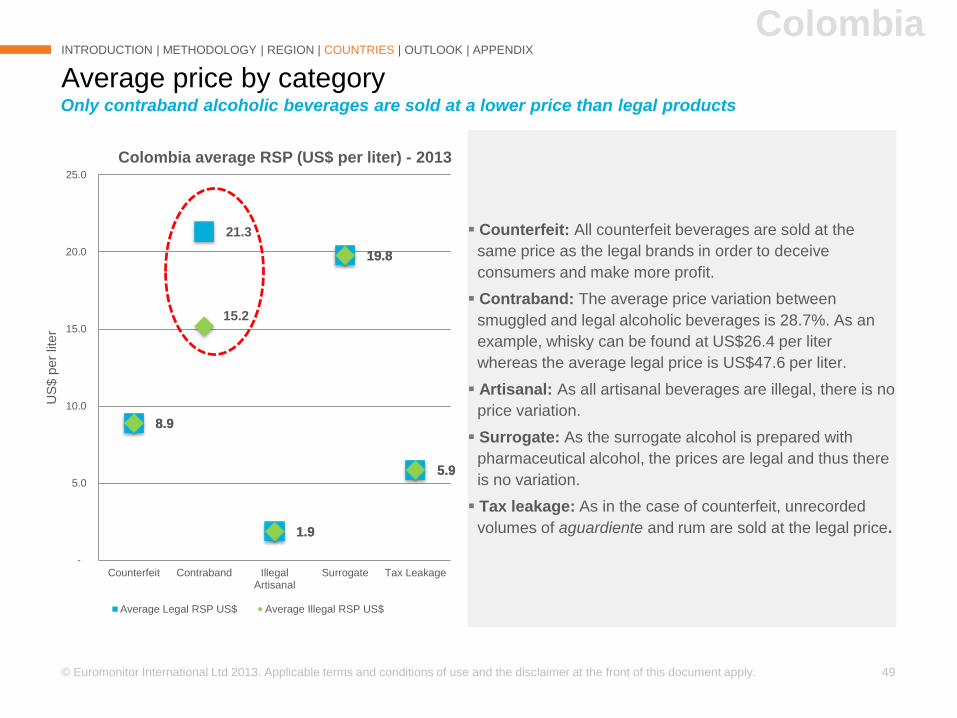
8.9
21.3
1.9
19.8
5.9
8.9
15.2
1.9
19.8
5.9
-
5.0
10.0
15.0
20.0
25.0
Counterfeit Contraband IllegalArtisanal
Surrogate Tax Leakage
US
$ p
er
liter
Colombia average RSP (US$ per liter) - 2013
Average Legal RSP US$ Average Illegal RSP US$
Counterfeit: All counterfeit beverages are sold at the
same price as the legal brands in order to deceive
consumers and make more profit.
Contraband: The average price variation between
smuggled and legal alcoholic beverages is 28.7%. As an
example, whisky can be found at US$26.4 per liter
whereas the average legal price is US$47.6 per liter.
Artisanal: As all artisanal beverages are illegal, there is no
price variation.
Surrogate: As the surrogate alcohol is prepared with
pharmaceutical alcohol, the prices are legal and thus there
is no variation.
Tax leakage: As in the case of counterfeit, unrecorded
volumes of aguardiente and rum are sold at the legal price.
Average price by category
INTRODUCTION | METHODOLOGY | REGION | COUNTRIES | OUTLOOK | APPENDIX
Only contraband alcoholic beverages are sold at a lower price than legal products
Colombia
© Euromonitor International Ltd 2013. Applicable terms and conditions of use and the disclaimer at the front of this document apply. 50
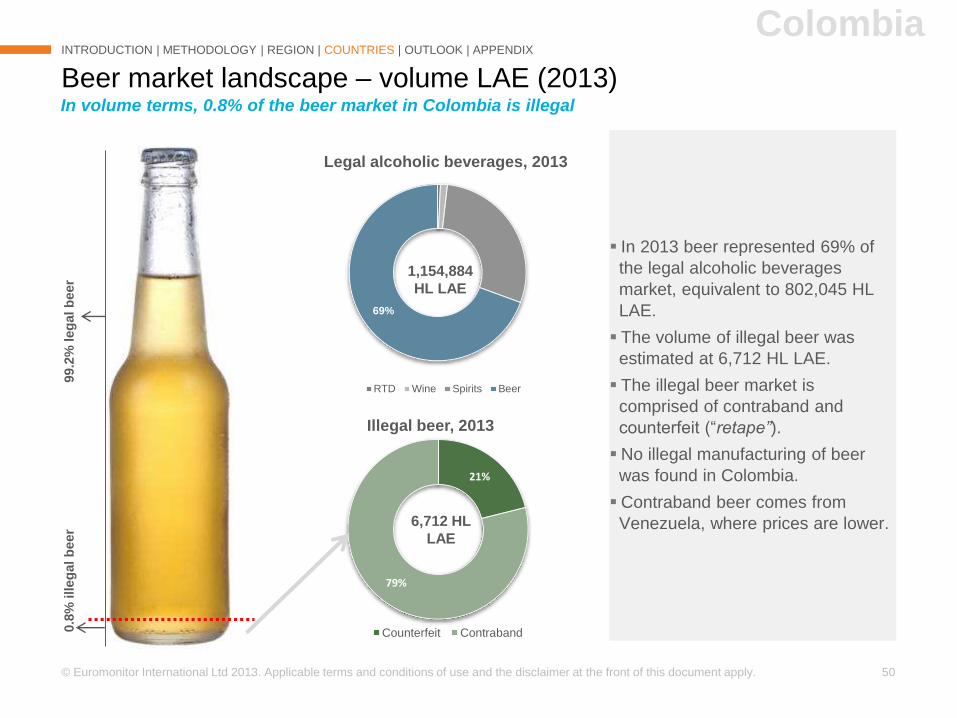
21%
79%
Illegal beer, 2013
Counterfeit Contraband
69%
Legal alcoholic beverages, 2013
RTD Wine Spirits Beer
Beer market landscape – volume LAE (2013)
INTRODUCTION | METHODOLOGY | REGION | COUNTRIES | OUTLOOK | APPENDIX
In volume terms, 0.8% of the beer market in Colombia is illegal
99.2
% leg
al b
eer
0.8
% illeg
al b
eer
In 2013 beer represented 69% of
the legal alcoholic beverages
market, equivalent to 802,045 HL
LAE.
The volume of illegal beer was
estimated at 6,712 HL LAE.
The illegal beer market is
comprised of contraband and
counterfeit (“retape”).
No illegal manufacturing of beer
was found in Colombia.
Contraband beer comes from
Venezuela, where prices are lower.
Colombia
6,712 HL
LAE
1,154,884
HL LAE
© Euromonitor International Ltd 2013. Applicable terms and conditions of use and the disclaimer at the front of this document apply. 51
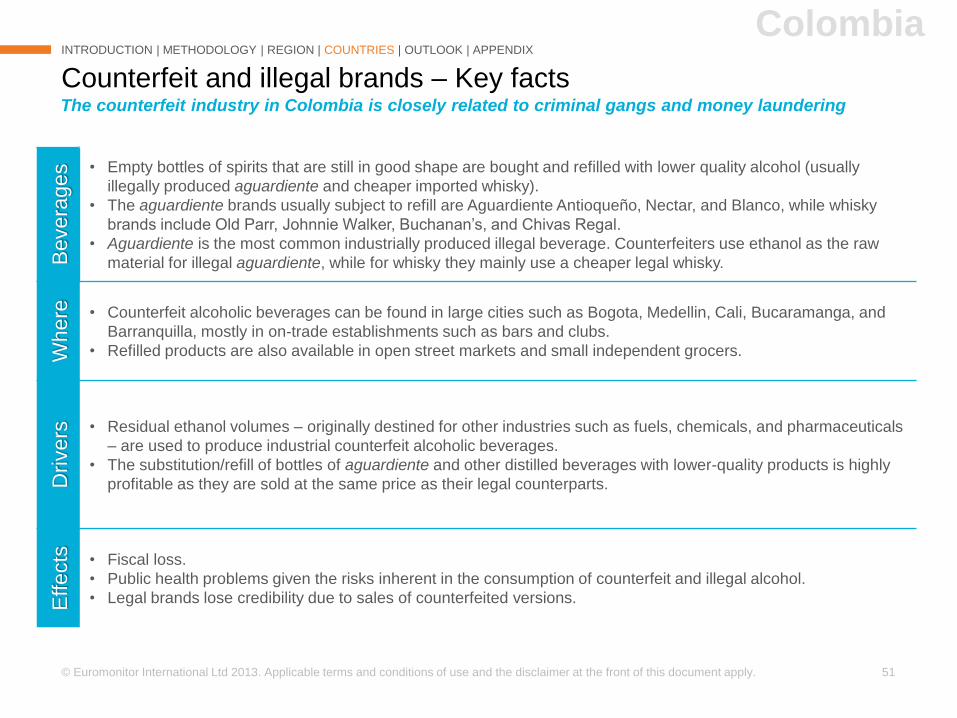
Counterfeit and illegal brands – Key facts
INTRODUCTION | METHODOLOGY | REGION | COUNTRIES | OUTLOOK | APPENDIX
The counterfeit industry in Colombia is closely related to criminal gangs and money laundering
ColombiaB
evera
ges • Empty bottles of spirits that are still in good shape are bought and refilled with lower quality alcohol (usually
illegally produced aguardiente and cheaper imported whisky).
• The aguardiente brands usually subject to refill are Aguardiente Antioqueño, Nectar, and Blanco, while whisky
brands include Old Parr, Johnnie Walker, Buchanan’s, and Chivas Regal.
• Aguardiente is the most common industrially produced illegal beverage. Counterfeiters use ethanol as the raw
material for illegal aguardiente, while for whisky they mainly use a cheaper legal whisky.
Where • Counterfeit alcoholic beverages can be found in large cities such as Bogota, Medellin, Cali, Bucaramanga, and
Barranquilla, mostly in on-trade establishments such as bars and clubs.
• Refilled products are also available in open street markets and small independent grocers.
Dri
vers • Residual ethanol volumes – originally destined for other industries such as fuels, chemicals, and pharmaceuticals
– are used to produce industrial counterfeit alcoholic beverages.
• The substitution/refill of bottles of aguardiente and other distilled beverages with lower-quality products is highly
profitable as they are sold at the same price as their legal counterparts.
Effects • Fiscal loss.
• Public health problems given the risks inherent in the consumption of counterfeit and illegal alcohol.
• Legal brands lose credibility due to sales of counterfeited versions.
© Euromonitor International Ltd 2013. Applicable terms and conditions of use and the disclaimer at the front of this document apply. 52
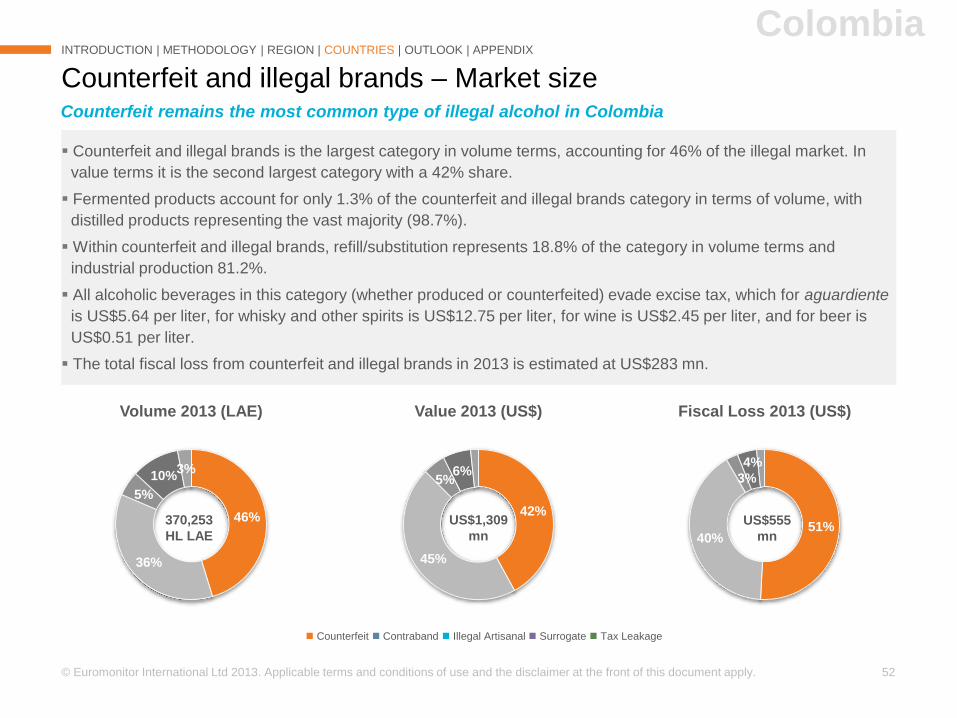
Counterfeit and illegal brands is the largest category in volume terms, accounting for 46% of the illegal market. In
value terms it is the second largest category with a 42% share.
Fermented products account for only 1.3% of the counterfeit and illegal brands category in terms of volume, with
distilled products representing the vast majority (98.7%).
Within counterfeit and illegal brands, refill/substitution represents 18.8% of the category in volume terms and
industrial production 81.2%.
All alcoholic beverages in this category (whether produced or counterfeited) evade excise tax, which for aguardiente
is US$5.64 per liter, for whisky and other spirits is US$12.75 per liter, for wine is US$2.45 per liter, and for beer is
US$0.51 per liter.
The total fiscal loss from counterfeit and illegal brands in 2013 is estimated at US$283 mn.
Counterfeit and illegal brands – Market size
INTRODUCTION | METHODOLOGY | REGION | COUNTRIES | OUTLOOK | APPENDIX
Counterfeit remains the most common type of illegal alcohol in Colombia
Colombia
51%40%
3%
4%
Fiscal Loss 2013 (US$)
42%
45%
5%6%
Value 2013 (US$)
Counterfeit Contraband Illegal Artisanal Surrogate Tax Leakage
370,253
HL LAE
US$555
mn
US$1,309
mn
46%
36%
5%
10%3%
Volume 2013 (LAE)
© Euromonitor International Ltd 2013. Applicable terms and conditions of use and the disclaimer at the front of this document apply. 53
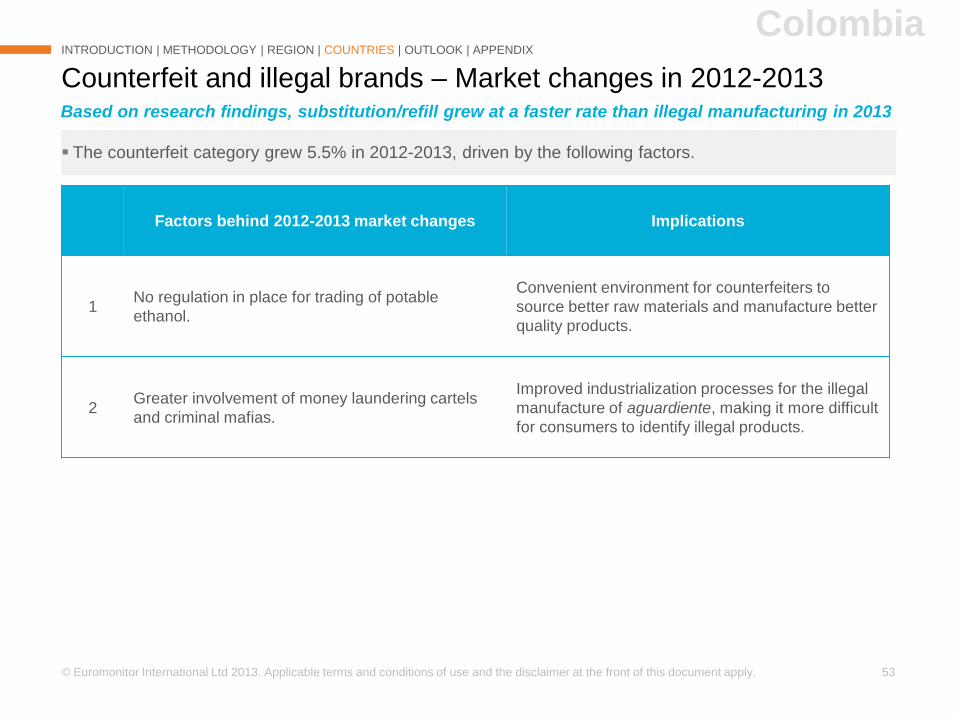
The counterfeit category grew 5.5% in 2012-2013, driven by the following factors.
Counterfeit and illegal brands – Market changes in 2012-2013
Factors behind 2012-2013 market changes Implications
1No regulation in place for trading of potable
ethanol.
Convenient environment for counterfeiters to
source better raw materials and manufacture better
quality products.
2Greater involvement of money laundering cartels
and criminal mafias.
Improved industrialization processes for the illegal
manufacture of aguardiente, making it more difficult
for consumers to identify illegal products.
INTRODUCTION | METHODOLOGY | REGION | COUNTRIES | OUTLOOK | APPENDIX
Colombia
Based on research findings, substitution/refill grew at a faster rate than illegal manufacturing in 2013
© Euromonitor International Ltd 2013. Applicable terms and conditions of use and the disclaimer at the front of this document apply. 54
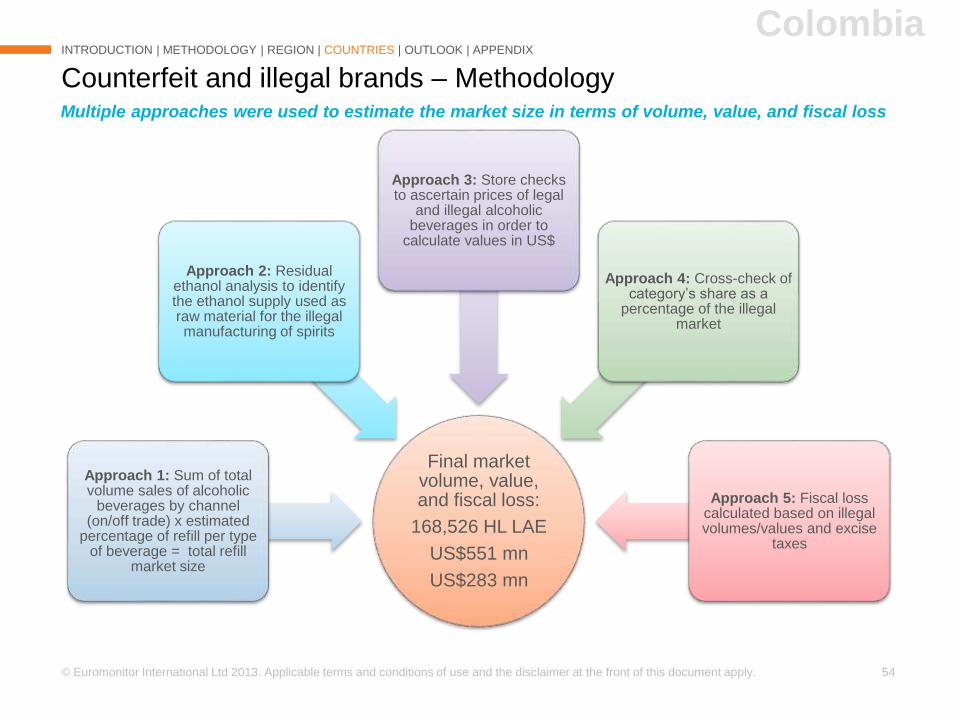
Counterfeit and illegal brands – Methodology
INTRODUCTION | METHODOLOGY | REGION | COUNTRIES | OUTLOOK | APPENDIX
Final market volume, value, and fiscal loss:
168,526 HL LAE
US$551 mn
US$283 mn
Approach 1: Sum of total volume sales of alcoholic
beverages by channel (on/off trade) x estimated
percentage of refill per type of beverage = total refill
market size
Approach 2: Residual ethanol analysis to identify the ethanol supply used as raw material for the illegal manufacturing of spirits
Approach 3: Store checks to ascertain prices of legal
and illegal alcoholic beverages in order to
calculate values in US$
Approach 4: Cross-check of category’s share as a
percentage of the illegal market
Approach 5: Fiscal loss calculated based on illegal volumes/values and excise
taxes
Colombia
Multiple approaches were used to estimate the market size in terms of volume, value, and fiscal loss
© Euromonitor International Ltd 2013. Applicable terms and conditions of use and the disclaimer at the front of this document apply. 55
Contraband – Key facts
INTRODUCTION | METHODOLOGY | REGION | COUNTRIES | OUTLOOK | APPENDIX
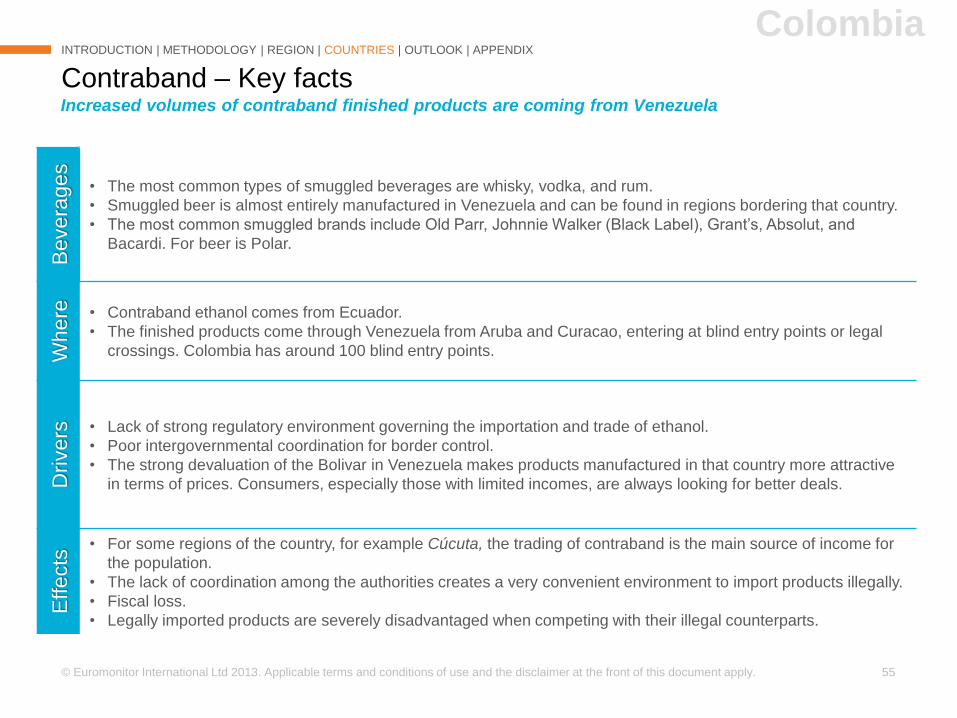
Increased volumes of contraband finished products are coming from Venezuela
ColombiaB
evera
ges
• The most common types of smuggled beverages are whisky, vodka, and rum.
• Smuggled beer is almost entirely manufactured in Venezuela and can be found in regions bordering that country.
• The most common smuggled brands include Old Parr, Johnnie Walker (Black Label), Grant’s, Absolut, and
Bacardi. For beer is Polar.
Where • Contraband ethanol comes from Ecuador.
• The finished products come through Venezuela from Aruba and Curacao, entering at blind entry points or legal
crossings. Colombia has around 100 blind entry points.
Dri
vers • Lack of strong regulatory environment governing the importation and trade of ethanol.
• Poor intergovernmental coordination for border control.
• The strong devaluation of the Bolivar in Venezuela makes products manufactured in that country more attractive
in terms of prices. Consumers, especially those with limited incomes, are always looking for better deals.
Effects
• For some regions of the country, for example Cúcuta, the trading of contraband is the main source of income for
the population.
• The lack of coordination among the authorities creates a very convenient environment to import products illegally.
• Fiscal loss.
• Legally imported products are severely disadvantaged when competing with their illegal counterparts.
© Euromonitor International Ltd 2013. Applicable terms and conditions of use and the disclaimer at the front of this document apply. 56
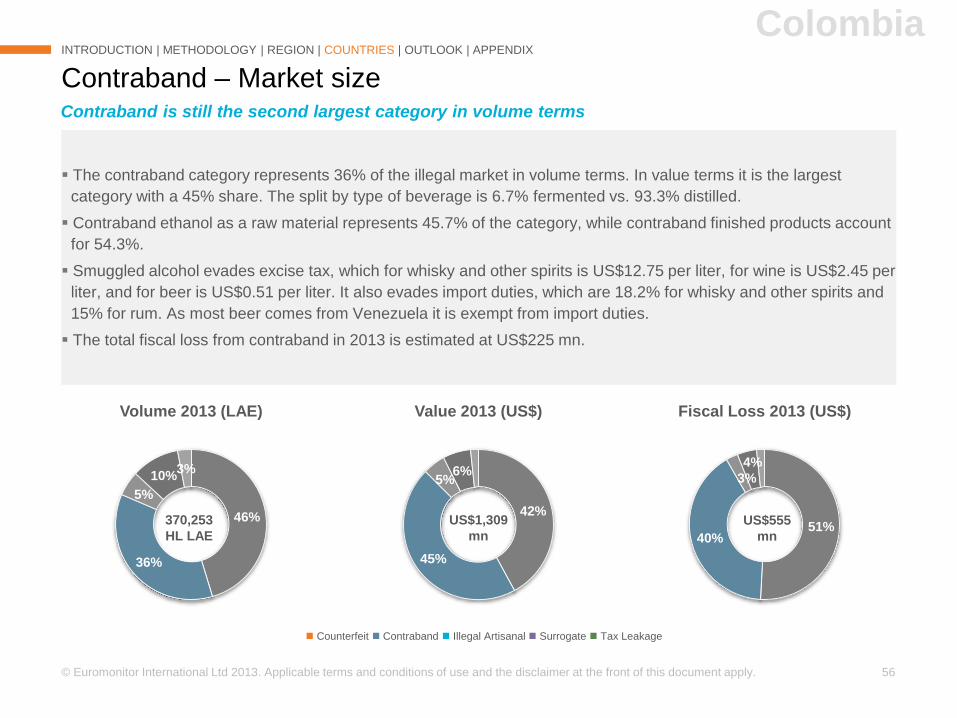
The contraband category represents 36% of the illegal market in volume terms. In value terms it is the largest
category with a 45% share. The split by type of beverage is 6.7% fermented vs. 93.3% distilled.
Contraband ethanol as a raw material represents 45.7% of the category, while contraband finished products account
for 54.3%.
Smuggled alcohol evades excise tax, which for whisky and other spirits is US$12.75 per liter, for wine is US$2.45 per
liter, and for beer is US$0.51 per liter. It also evades import duties, which are 18.2% for whisky and other spirits and
15% for rum. As most beer comes from Venezuela it is exempt from import duties.
The total fiscal loss from contraband in 2013 is estimated at US$225 mn.
Contraband – Market size
INTRODUCTION | METHODOLOGY | REGION | COUNTRIES | OUTLOOK | APPENDIX
Contraband is still the second largest category in volume terms
Colombia
51%40%
3%
4%
Fiscal Loss 2013 (US$)
42%
45%
5%6%
Value 2013 (US$)
Counterfeit Contraband Illegal Artisanal Surrogate Tax Leakage
370,253
HL LAE
US$555
mn
US$1,309
mn
46%
36%
5%
10%3%
Volume 2013 (LAE)
© Euromonitor International Ltd 2013. Applicable terms and conditions of use and the disclaimer at the front of this document apply. 57
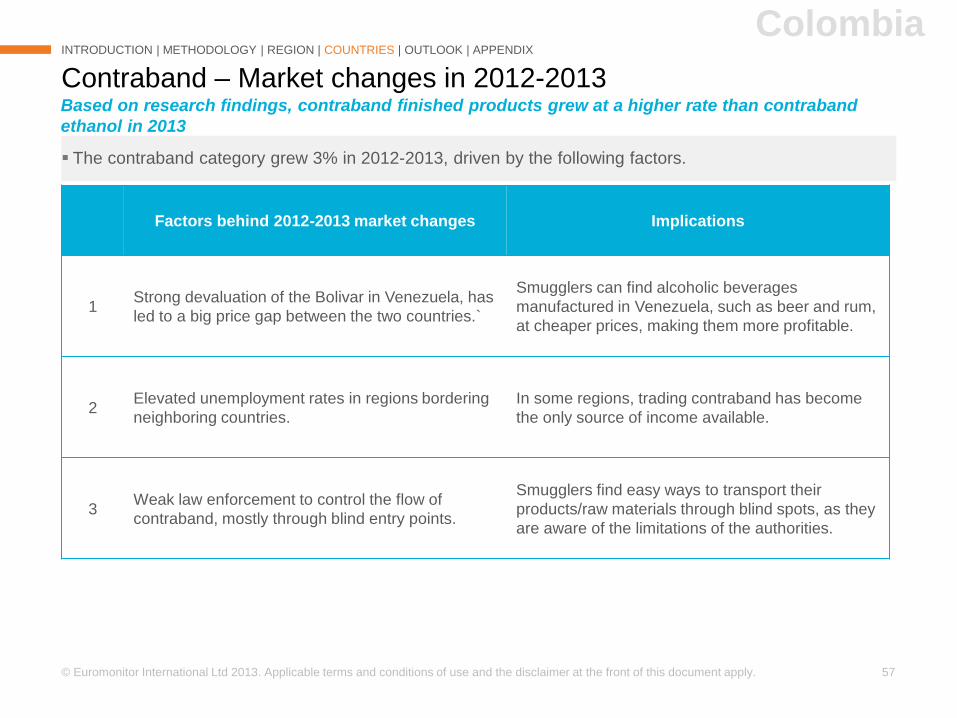
The contraband category grew 3% in 2012-2013, driven by the following factors.
Contraband – Market changes in 2012-2013
Factors behind 2012-2013 market changes Implications
1Strong devaluation of the Bolivar in Venezuela, has
led to a big price gap between the two countries.`
Smugglers can find alcoholic beverages
manufactured in Venezuela, such as beer and rum,
at cheaper prices, making them more profitable.
2Elevated unemployment rates in regions bordering
neighboring countries.
In some regions, trading contraband has become
the only source of income available.
3Weak law enforcement to control the flow of
contraband, mostly through blind entry points.
Smugglers find easy ways to transport their
products/raw materials through blind spots, as they
are aware of the limitations of the authorities.
INTRODUCTION | METHODOLOGY | REGION | COUNTRIES | OUTLOOK | APPENDIX
Colombia
Based on research findings, contraband finished products grew at a higher rate than contraband
ethanol in 2013
© Euromonitor International Ltd 2013. Applicable terms and conditions of use and the disclaimer at the front of this document apply. 58
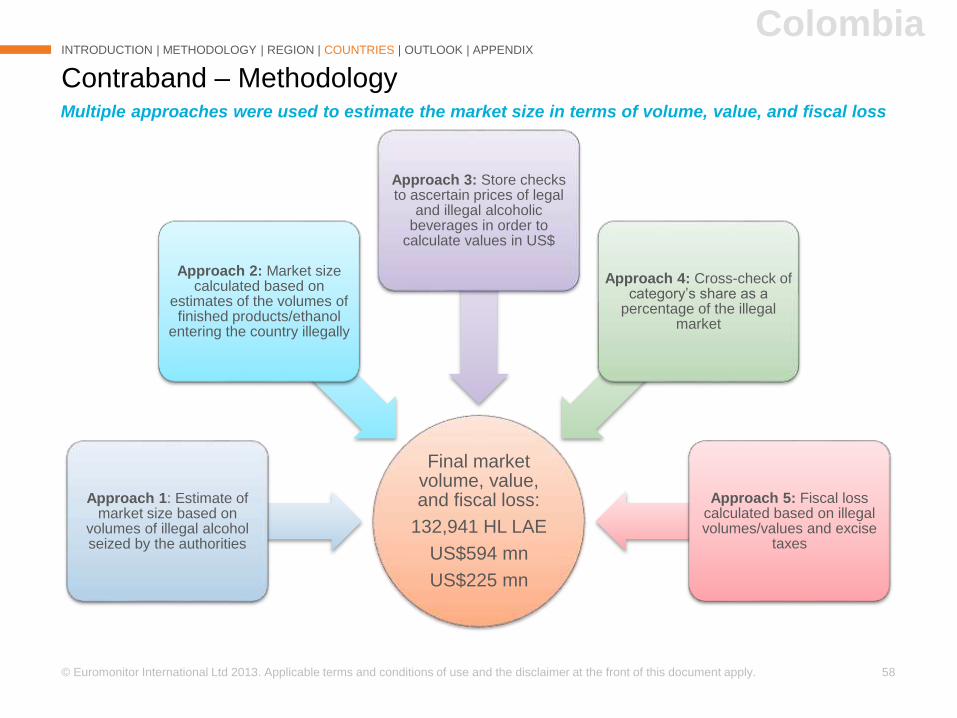
Contraband – Methodology
INTRODUCTION | METHODOLOGY | REGION | COUNTRIES | OUTLOOK | APPENDIX
Final market volume, value, and fiscal loss:
132,941 HL LAE
US$594 mn
US$225 mn
Approach 1: Estimate of market size based on
volumes of illegal alcohol seized by the authorities
Approach 2: Market size calculated based on
estimates of the volumes of finished products/ethanol
entering the country illegally
Approach 3: Store checks to ascertain prices of legal
and illegal alcoholic beverages in order to
calculate values in US$
Approach 4: Cross-check of category’s share as a
percentage of the illegal market
Approach 5: Fiscal loss calculated based on illegal volumes/values and excise
taxes
Multiple approaches were used to estimate the market size in terms of volume, value, and fiscal loss
Colombia
© Euromonitor International Ltd 2013. Applicable terms and conditions of use and the disclaimer at the front of this document apply. 59
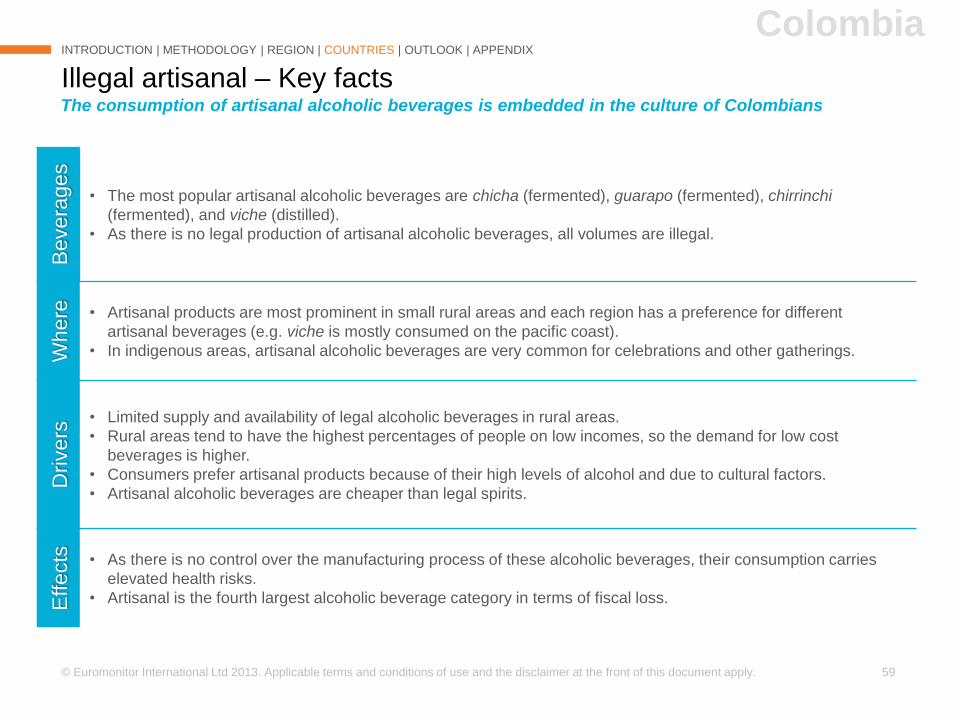
Illegal artisanal – Key facts
INTRODUCTION | METHODOLOGY | REGION | COUNTRIES | OUTLOOK | APPENDIX
The consumption of artisanal alcoholic beverages is embedded in the culture of Colombians
ColombiaB
evera
ges
• The most popular artisanal alcoholic beverages are chicha (fermented), guarapo (fermented), chirrinchi
(fermented), and viche (distilled).
• As there is no legal production of artisanal alcoholic beverages, all volumes are illegal.
Where • Artisanal products are most prominent in small rural areas and each region has a preference for different
artisanal beverages (e.g. viche is mostly consumed on the pacific coast).
• In indigenous areas, artisanal alcoholic beverages are very common for celebrations and other gatherings.
Dri
vers
• Limited supply and availability of legal alcoholic beverages in rural areas.
• Rural areas tend to have the highest percentages of people on low incomes, so the demand for low cost
beverages is higher.
• Consumers prefer artisanal products because of their high levels of alcohol and due to cultural factors.
• Artisanal alcoholic beverages are cheaper than legal spirits.
Effects • As there is no control over the manufacturing process of these alcoholic beverages, their consumption carries
elevated health risks.
• Artisanal is the fourth largest alcoholic beverage category in terms of fiscal loss.
© Euromonitor International Ltd 2013. Applicable terms and conditions of use and the disclaimer at the front of this document apply. 60
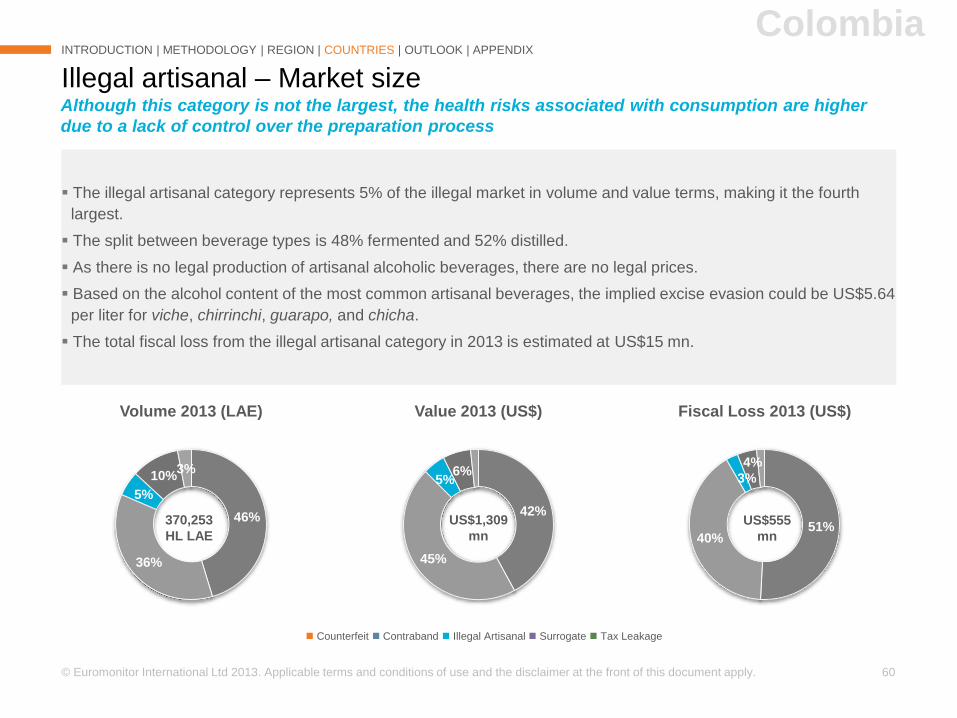
The illegal artisanal category represents 5% of the illegal market in volume and value terms, making it the fourth
largest.
The split between beverage types is 48% fermented and 52% distilled.
As there is no legal production of artisanal alcoholic beverages, there are no legal prices.
Based on the alcohol content of the most common artisanal beverages, the implied excise evasion could be US$5.64
per liter for viche, chirrinchi, guarapo, and chicha.
The total fiscal loss from the illegal artisanal category in 2013 is estimated at US$15 mn.
Illegal artisanal – Market size
INTRODUCTION | METHODOLOGY | REGION | COUNTRIES | OUTLOOK | APPENDIX
Although this category is not the largest, the health risks associated with consumption are higher
due to a lack of control over the preparation process
Colombia
51%40%
3%
4%
Fiscal Loss 2013 (US$)
42%
45%
5%6%
Value 2013 (US$)
Counterfeit Contraband Illegal Artisanal Surrogate Tax Leakage
370,253
HL LAE
US$555
mn
US$1,309
mn
46%
36%
5%
10%3%
Volume 2013 (LAE)
© Euromonitor International Ltd 2013. Applicable terms and conditions of use and the disclaimer at the front of this document apply. 61
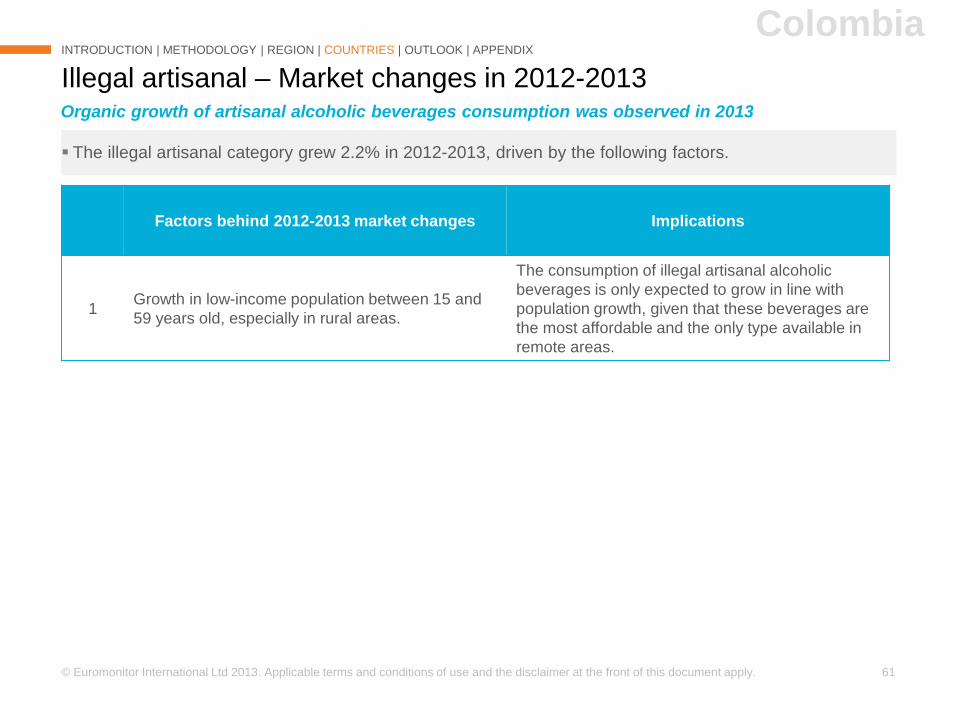
The illegal artisanal category grew 2.2% in 2012-2013, driven by the following factors.
Illegal artisanal – Market changes in 2012-2013
Factors behind 2012-2013 market changes Implications
1Growth in low-income population between 15 and
59 years old, especially in rural areas.
The consumption of illegal artisanal alcoholic
beverages is only expected to grow in line with
population growth, given that these beverages are
the most affordable and the only type available in
remote areas.
INTRODUCTION | METHODOLOGY | REGION | COUNTRIES | OUTLOOK | APPENDIX
Colombia
Organic growth of artisanal alcoholic beverages consumption was observed in 2013
© Euromonitor International Ltd 2013. Applicable terms and conditions of use and the disclaimer at the front of this document apply. 62
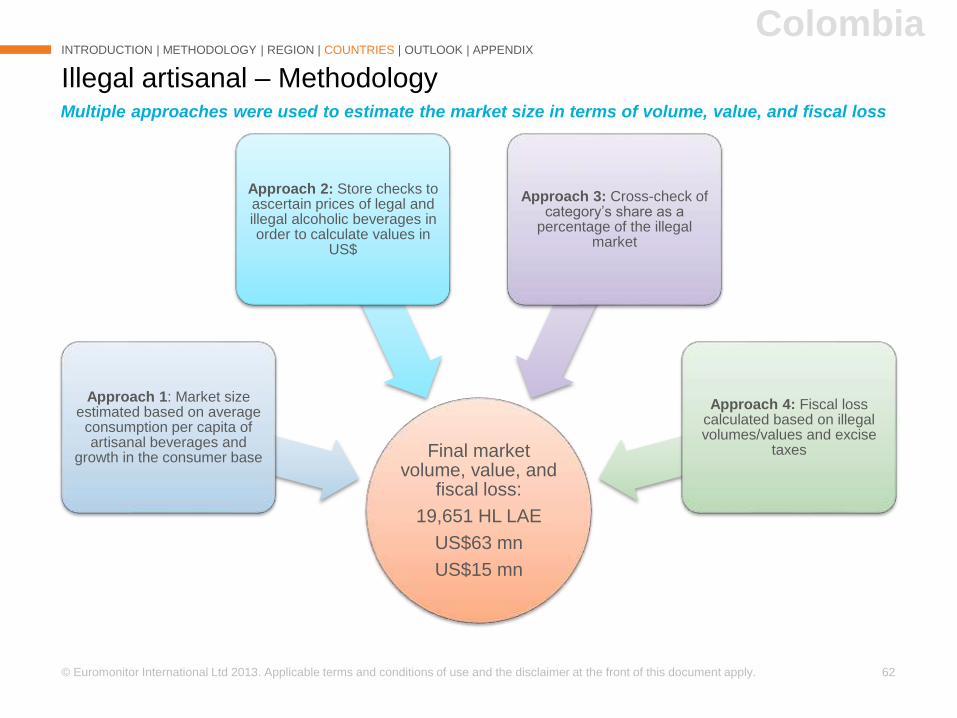
Illegal artisanal – Methodology
INTRODUCTION | METHODOLOGY | REGION | COUNTRIES | OUTLOOK | APPENDIX
Final market volume, value, and
fiscal loss:
19,651 HL LAE
US$63 mn
US$15 mn
Approach 1: Market size estimated based on average
consumption per capita of artisanal beverages and
growth in the consumer base
Approach 2: Store checks to ascertain prices of legal and illegal alcoholic beverages in order to calculate values in
US$
Approach 3: Cross-check of category’s share as a
percentage of the illegal market
Approach 4: Fiscal loss calculated based on illegal volumes/values and excise
taxes
Multiple approaches were used to estimate the market size in terms of volume, value, and fiscal loss
Colombia
© Euromonitor International Ltd 2013. Applicable terms and conditions of use and the disclaimer at the front of this document apply. 63
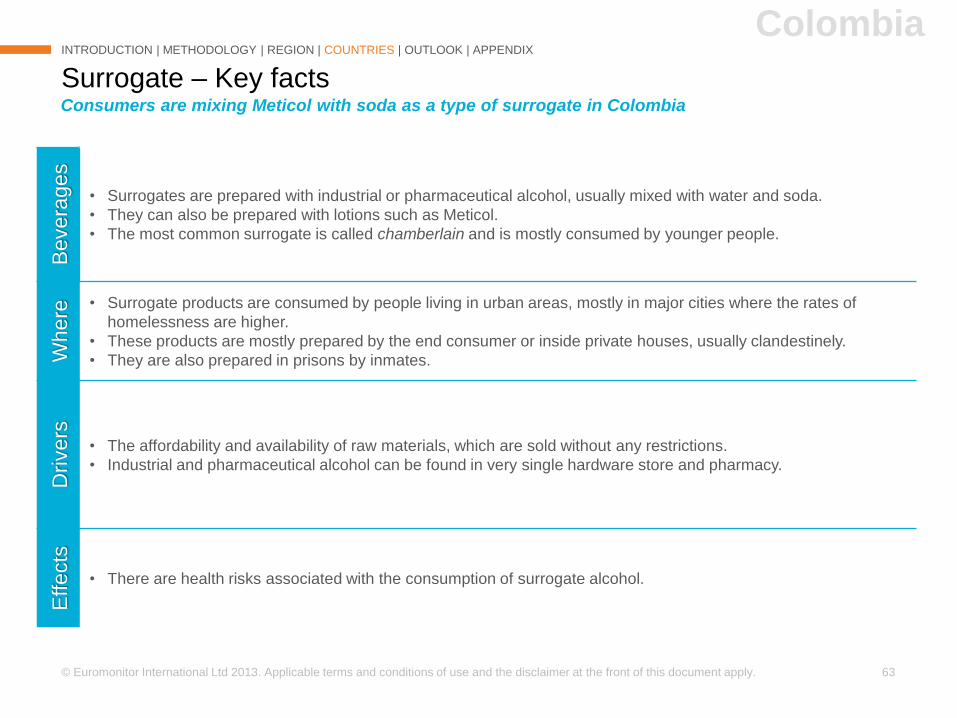
Surrogate – Key facts
INTRODUCTION | METHODOLOGY | REGION | COUNTRIES | OUTLOOK | APPENDIX
Consumers are mixing Meticol with soda as a type of surrogate in Colombia
ColombiaB
evera
ges
• Surrogates are prepared with industrial or pharmaceutical alcohol, usually mixed with water and soda.
• They can also be prepared with lotions such as Meticol.
• The most common surrogate is called chamberlain and is mostly consumed by younger people.
Where
• Surrogate products are consumed by people living in urban areas, mostly in major cities where the rates of
homelessness are higher.
• These products are mostly prepared by the end consumer or inside private houses, usually clandestinely.
• They are also prepared in prisons by inmates.
Dri
vers
• The affordability and availability of raw materials, which are sold without any restrictions.
• Industrial and pharmaceutical alcohol can be found in very single hardware store and pharmacy.
Effects
• There are health risks associated with the consumption of surrogate alcohol.
© Euromonitor International Ltd 2013. Applicable terms and conditions of use and the disclaimer at the front of this document apply. 64
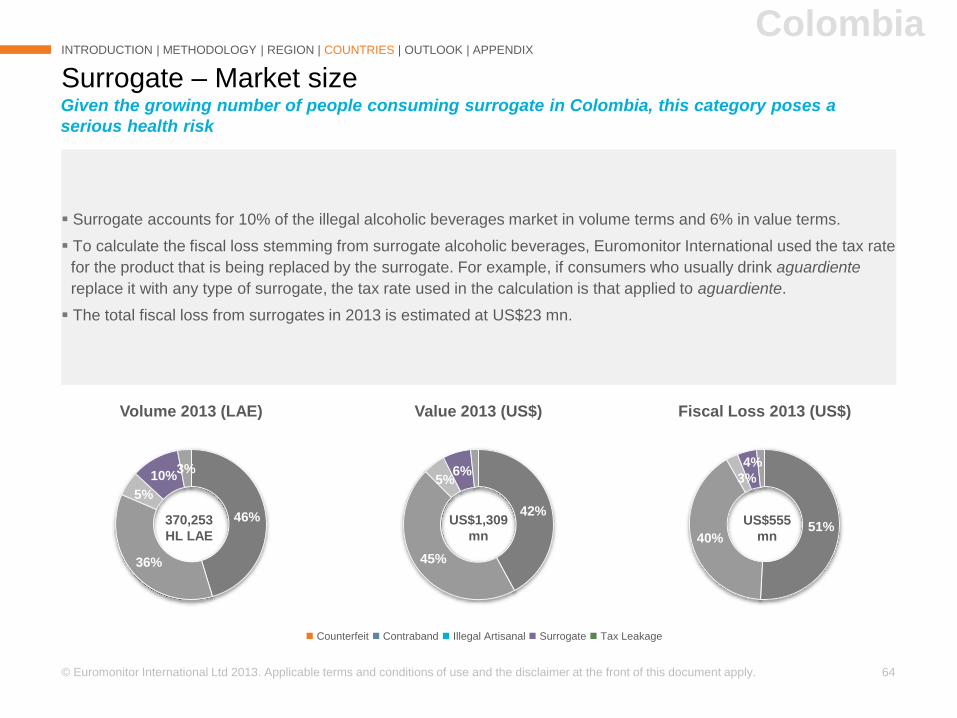
Surrogate accounts for 10% of the illegal alcoholic beverages market in volume terms and 6% in value terms.
To calculate the fiscal loss stemming from surrogate alcoholic beverages, Euromonitor International used the tax rate
for the product that is being replaced by the surrogate. For example, if consumers who usually drink aguardiente
replace it with any type of surrogate, the tax rate used in the calculation is that applied to aguardiente.
The total fiscal loss from surrogates in 2013 is estimated at US$23 mn.
Surrogate – Market size
INTRODUCTION | METHODOLOGY | REGION | COUNTRIES | OUTLOOK | APPENDIX
Given the growing number of people consuming surrogate in Colombia, this category poses a
serious health risk
Colombia
51%40%
3%
4%
Fiscal Loss 2013 (US$)
42%
45%
5%6%
Value 2013 (US$)
Counterfeit Contraband Illegal Artisanal Surrogate Tax Leakage
370,253
HL LAE
US$555
mn
US$1,309
mn
46%
36%
5%
10%3%
Volume 2013 (LAE)
© Euromonitor International Ltd 2013. Applicable terms and conditions of use and the disclaimer at the front of this document apply. 65
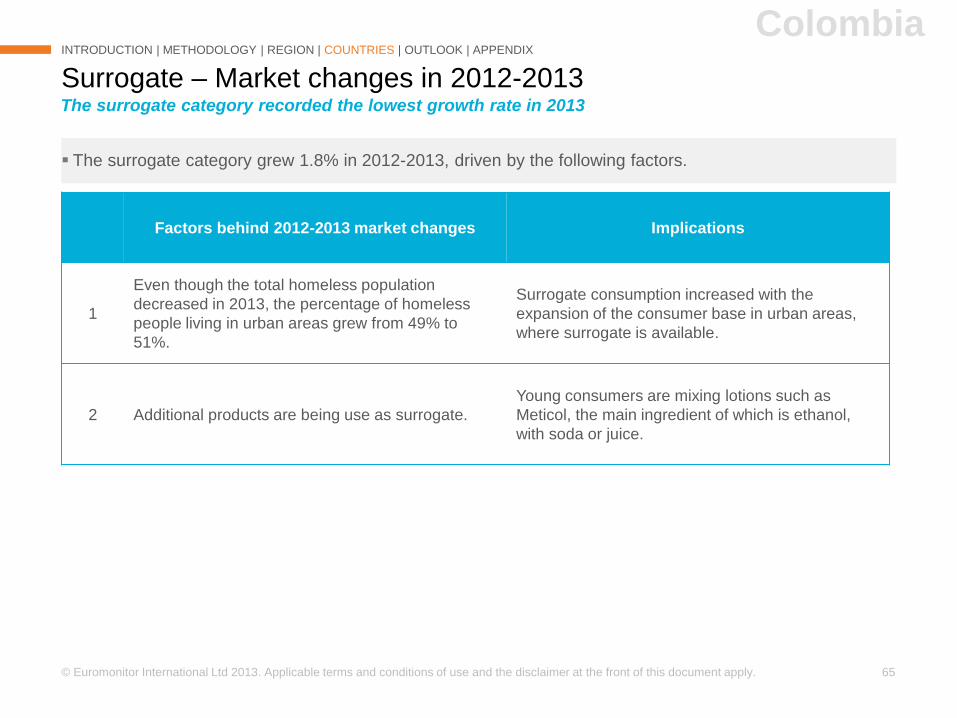
The surrogate category grew 1.8% in 2012-2013, driven by the following factors.
Surrogate – Market changes in 2012-2013
Factors behind 2012-2013 market changes Implications
1
Even though the total homeless population
decreased in 2013, the percentage of homeless
people living in urban areas grew from 49% to
51%.
Surrogate consumption increased with the
expansion of the consumer base in urban areas,
where surrogate is available.
2 Additional products are being use as surrogate.
Young consumers are mixing lotions such as
Meticol, the main ingredient of which is ethanol,
with soda or juice.
INTRODUCTION | METHODOLOGY | REGION | COUNTRIES | OUTLOOK | APPENDIX
Colombia
The surrogate category recorded the lowest growth rate in 2013
© Euromonitor International Ltd 2013. Applicable terms and conditions of use and the disclaimer at the front of this document apply. 66
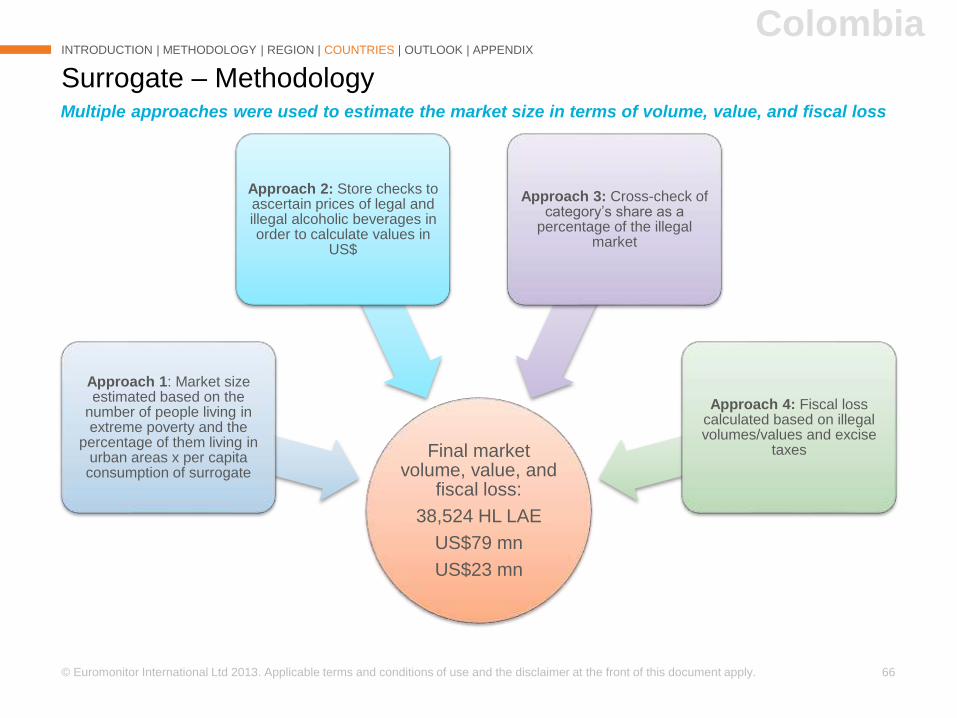
Surrogate – Methodology
INTRODUCTION | METHODOLOGY | REGION | COUNTRIES | OUTLOOK | APPENDIX
Final market volume, value, and
fiscal loss:
38,524 HL LAE
US$79 mn
US$23 mn
Approach 1: Market size estimated based on the
number of people living in extreme poverty and the
percentage of them living in urban areas x per capita consumption of surrogate
Approach 2: Store checks to ascertain prices of legal and illegal alcoholic beverages in order to calculate values in
US$
Approach 3: Cross-check of category’s share as a
percentage of the illegal market
Approach 4: Fiscal loss calculated based on illegal volumes/values and excise
taxes
Multiple approaches were used to estimate the market size in terms of volume, value, and fiscal loss
Colombia
© Euromonitor International Ltd 2013. Applicable terms and conditions of use and the disclaimer at the front of this document apply. 67
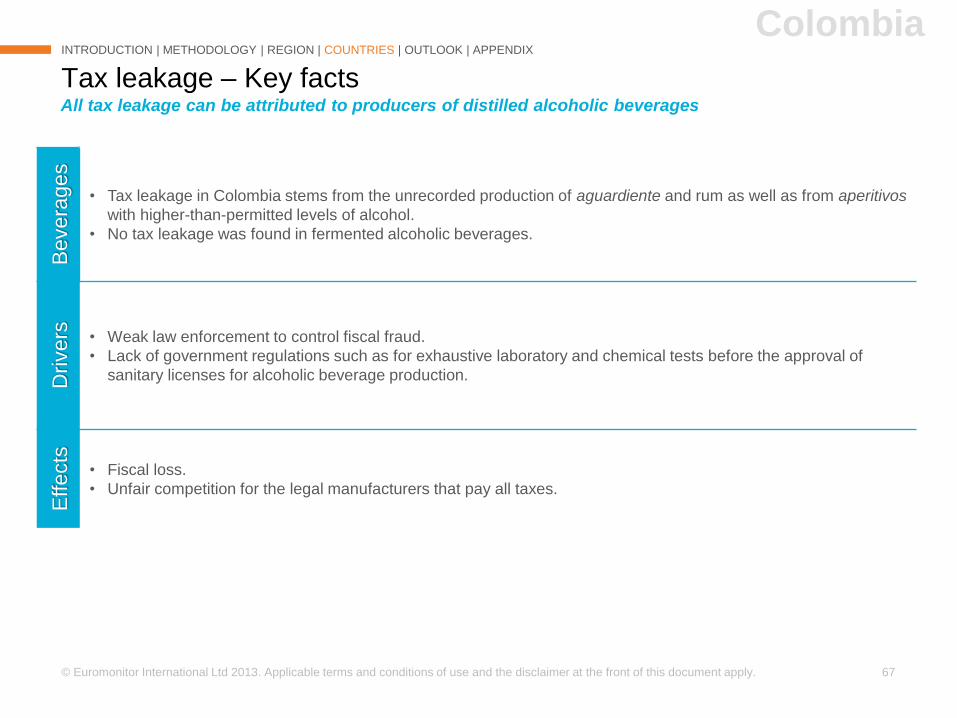
Tax leakage – Key facts
INTRODUCTION | METHODOLOGY | REGION | COUNTRIES | OUTLOOK | APPENDIX
All tax leakage can be attributed to producers of distilled alcoholic beverages
ColombiaB
evera
ges
• Tax leakage in Colombia stems from the unrecorded production of aguardiente and rum as well as from aperitivos
with higher-than-permitted levels of alcohol.
• No tax leakage was found in fermented alcoholic beverages.
Drivers • Weak law enforcement to control fiscal fraud.
• Lack of government regulations such as for exhaustive laboratory and chemical tests before the approval of
sanitary licenses for alcoholic beverage production.
Effects
• Fiscal loss.
• Unfair competition for the legal manufacturers that pay all taxes.
© Euromonitor International Ltd 2013. Applicable terms and conditions of use and the disclaimer at the front of this document apply. 68
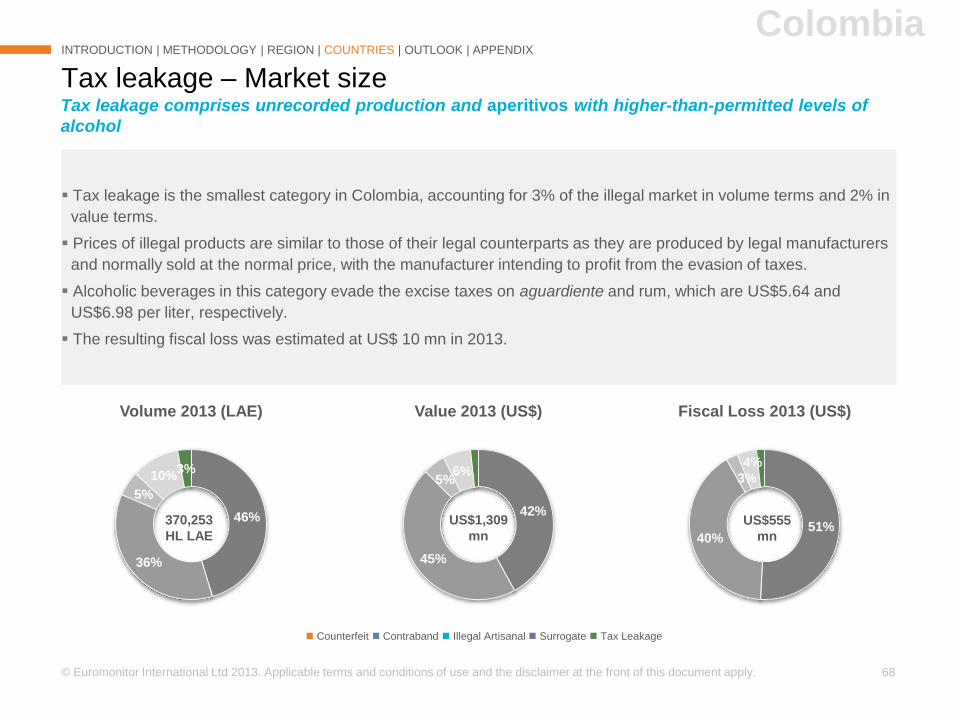
Tax leakage is the smallest category in Colombia, accounting for 3% of the illegal market in volume terms and 2% in
value terms.
Prices of illegal products are similar to those of their legal counterparts as they are produced by legal manufacturers
and normally sold at the normal price, with the manufacturer intending to profit from the evasion of taxes.
Alcoholic beverages in this category evade the excise taxes on aguardiente and rum, which are US$5.64 and
US$6.98 per liter, respectively.
The resulting fiscal loss was estimated at US$ 10 mn in 2013.
Tax leakage – Market size
INTRODUCTION | METHODOLOGY | REGION | COUNTRIES | OUTLOOK | APPENDIX
Tax leakage comprises unrecorded production and aperitivos with higher-than-permitted levels of
alcohol
Colombia
51%40%
3%
4%
Fiscal Loss 2013 (US$)
42%
45%
5%6%
Value 2013 (US$)
Counterfeit Contraband Illegal Artisanal Surrogate Tax Leakage
370,253
HL LAE
US$555
mn
US$1,309
mn
46%
36%
5%
10%3%
Volume 2013 (LAE)
© Euromonitor International Ltd 2013. Applicable terms and conditions of use and the disclaimer at the front of this document apply. 69
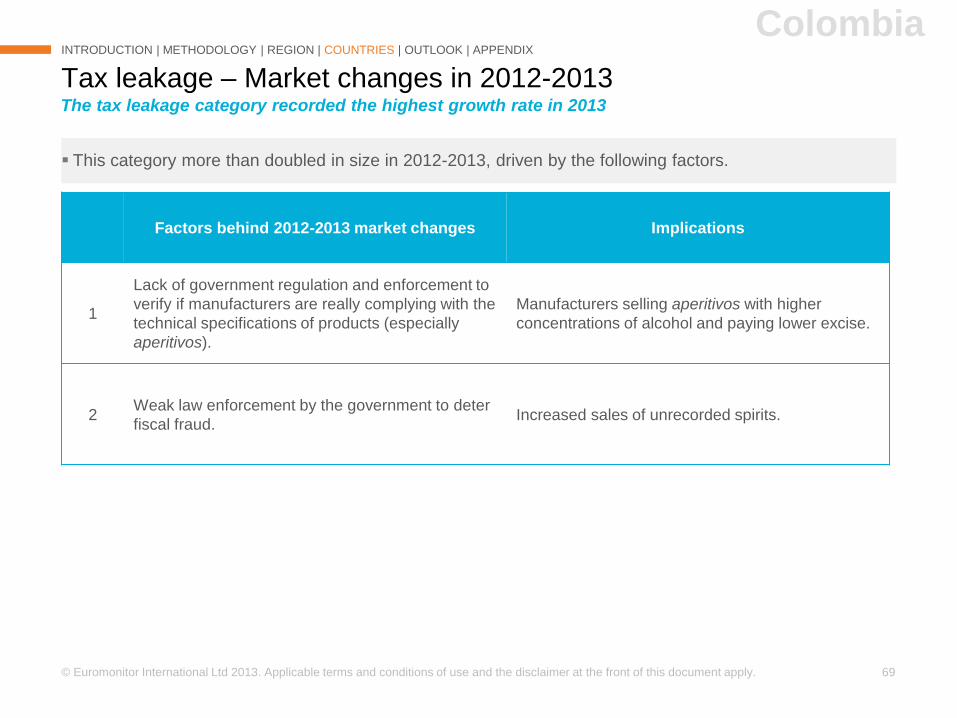
This category more than doubled in size in 2012-2013, driven by the following factors.
Tax leakage – Market changes in 2012-2013
Factors behind 2012-2013 market changes Implications
1
Lack of government regulation and enforcement to
verify if manufacturers are really complying with the
technical specifications of products (especially
aperitivos).
Manufacturers selling aperitivos with higher
concentrations of alcohol and paying lower excise.
2Weak law enforcement by the government to deter
fiscal fraud.Increased sales of unrecorded spirits.
INTRODUCTION | METHODOLOGY | REGION | COUNTRIES | OUTLOOK | APPENDIX
Colombia
The tax leakage category recorded the highest growth rate in 2013
© Euromonitor International Ltd 2013. Applicable terms and conditions of use and the disclaimer at the front of this document apply. 70
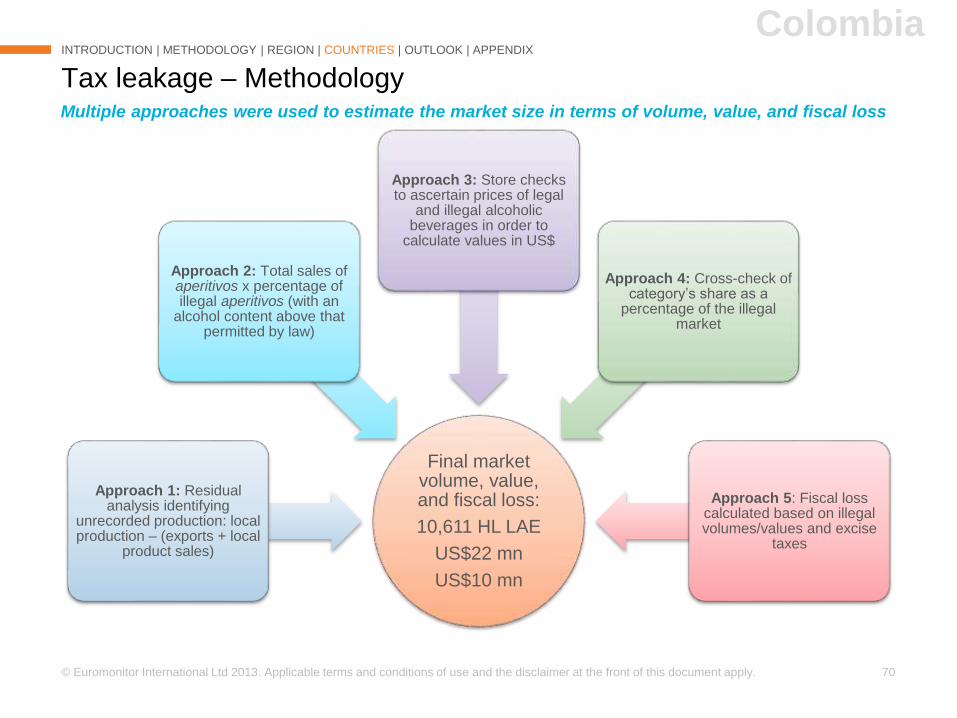
Tax leakage – Methodology
INTRODUCTION | METHODOLOGY | REGION | COUNTRIES | OUTLOOK | APPENDIX
Final market volume, value, and fiscal loss:
10,611 HL LAE
US$22 mn
US$10 mn
Approach 1: Residual analysis identifying
unrecorded production: local production – (exports + local
product sales)
Approach 2: Total sales of aperitivos x percentage of illegal aperitivos (with an
alcohol content above that permitted by law)
Approach 3: Store checks to ascertain prices of legal
and illegal alcoholic beverages in order to
calculate values in US$
Approach 4: Cross-check of category’s share as a
percentage of the illegal market
Approach 5: Fiscal loss calculated based on illegal volumes/values and excise
taxes
Multiple approaches were used to estimate the market size in terms of volume, value, and fiscal loss
Colombia
© Euromonitor International Ltd 2013. Applicable terms and conditions of use and the disclaimer at the front of this document apply. 71
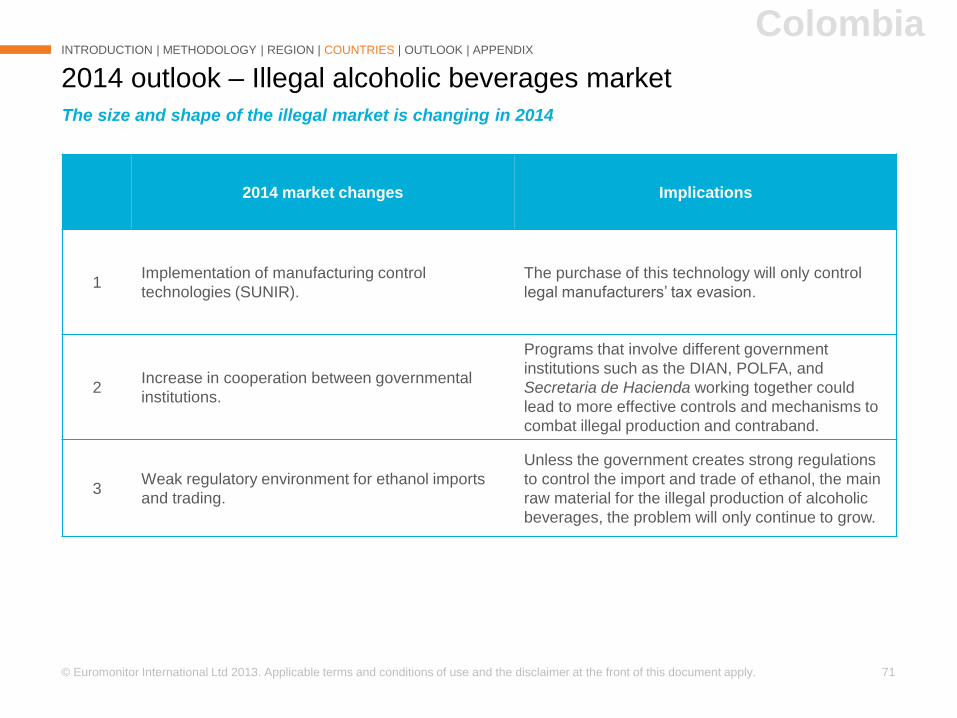
2014 outlook – Illegal alcoholic beverages market
INTRODUCTION | METHODOLOGY | REGION | COUNTRIES | OUTLOOK | APPENDIX
2014 market changes Implications
1Implementation of manufacturing control
technologies (SUNIR).
The purchase of this technology will only control
legal manufacturers’ tax evasion.
2Increase in cooperation between governmental
institutions.
Programs that involve different government
institutions such as the DIAN, POLFA, and
Secretaria de Hacienda working together could
lead to more effective controls and mechanisms to
combat illegal production and contraband.
3Weak regulatory environment for ethanol imports
and trading.
Unless the government creates strong regulations
to control the import and trade of ethanol, the main
raw material for the illegal production of alcoholic
beverages, the problem will only continue to grow.
The size and shape of the illegal market is changing in 2014
Colombia
INTRODUCTION
METHODOLOGY
ANALYSIS - REGION
ANALYSIS – COUNTRIES
2014 OUTLOOK
APPENDIX
►►Ecuador
© Euromonitor International Ltd 2013. Applicable terms and conditions of use and the disclaimer at the front of this document apply. 73
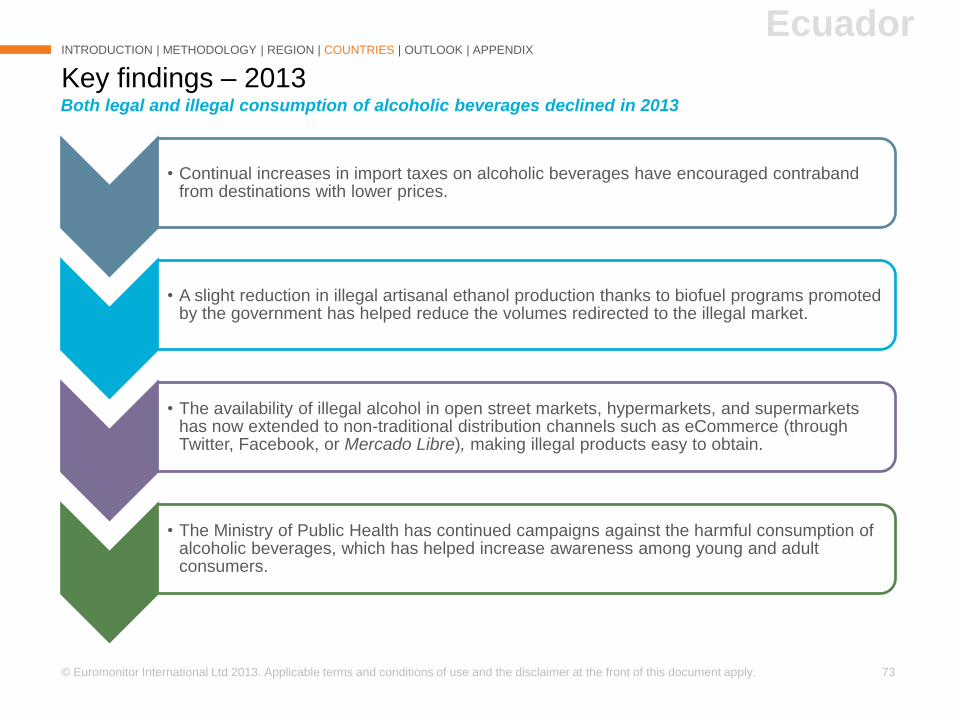
• Continual increases in import taxes on alcoholic beverages have encouraged contraband from destinations with lower prices.
• A slight reduction in illegal artisanal ethanol production thanks to biofuel programs promoted by the government has helped reduce the volumes redirected to the illegal market.
• The availability of illegal alcohol in open street markets, hypermarkets, and supermarkets has now extended to non-traditional distribution channels such as eCommerce (through Twitter, Facebook, or Mercado Libre), making illegal products easy to obtain.
• The Ministry of Public Health has continued campaigns against the harmful consumption of alcoholic beverages, which has helped increase awareness among young and adult consumers.
Key findings – 2013
INTRODUCTION | METHODOLOGY | REGION | COUNTRIES | OUTLOOK | APPENDIX
Both legal and illegal consumption of alcoholic beverages declined in 2013
Ecuador

129,939 HL LAE
TOTAL ILLEGAL VOLUME
Illegal market 2013 –
Ecuador
US$428 mn
TOTAL VALUE IN ILLEGAL RSP
US$109 mn
TOTAL FISCAL LOSS
US$483 mn
TOTAL VALUE IN LEGAL RSP
*RSP: retail selling prices
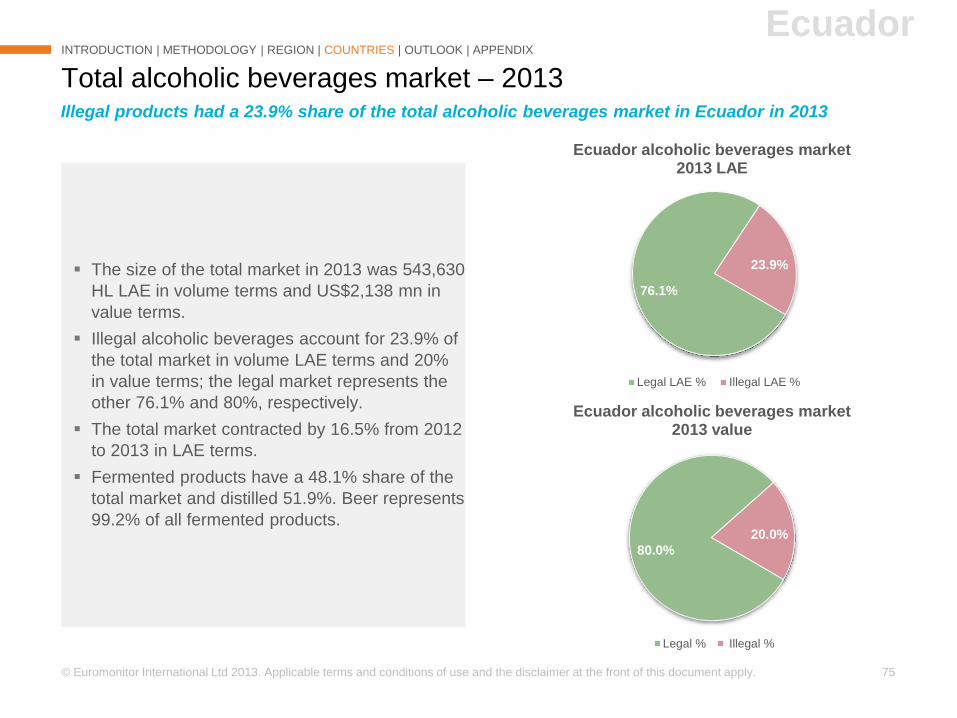
© Euromonitor International Ltd 2013. Applicable terms and conditions of use and the disclaimer at the front of this document apply. 75
80.0%
20.0%
Ecuador alcoholic beverages market 2013 value
Legal % Illegal %
Total alcoholic beverages market – 2013
INTRODUCTION | METHODOLOGY | REGION | COUNTRIES | OUTLOOK | APPENDIX
Illegal products had a 23.9% share of the total alcoholic beverages market in Ecuador in 2013
Ecuador
The size of the total market in 2013 was 543,630
HL LAE in volume terms and US$2,138 mn in
value terms.
Illegal alcoholic beverages account for 23.9% of
the total market in volume LAE terms and 20%
in value terms; the legal market represents the
other 76.1% and 80%, respectively.
The total market contracted by 16.5% from 2012
to 2013 in LAE terms.
Fermented products have a 48.1% share of the
total market and distilled 51.9%. Beer represents
99.2% of all fermented products.
76.1%
23.9%
Ecuador alcoholic beverages market 2013 LAE
Legal LAE % Illegal LAE %
© Euromonitor International Ltd 2013. Applicable terms and conditions of use and the disclaimer at the front of this document apply. 76
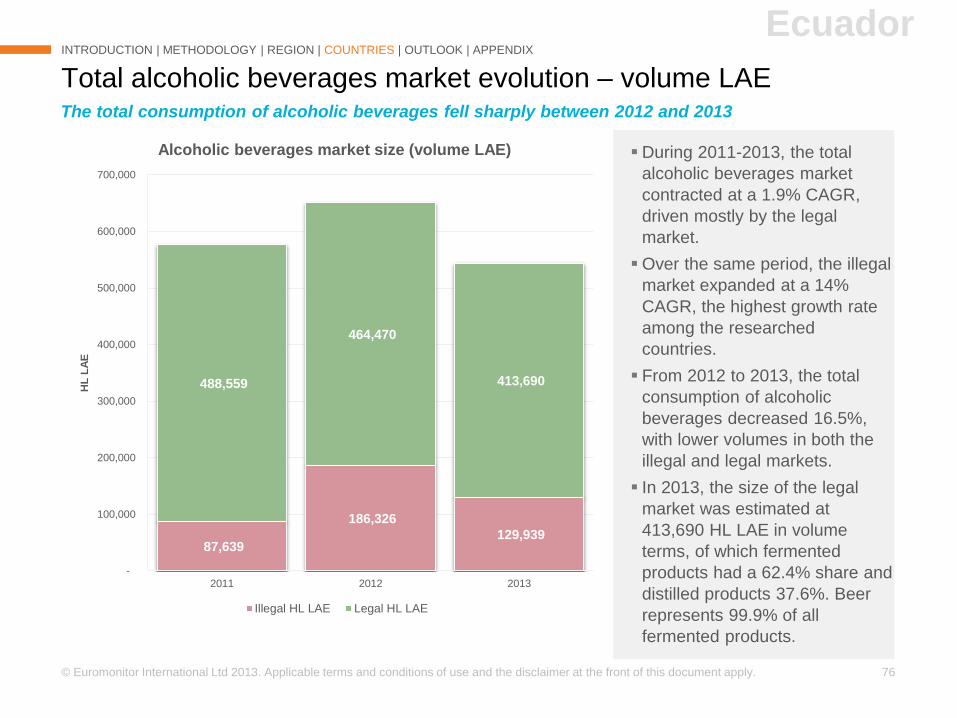
During 2011-2013, the total
alcoholic beverages market
contracted at a 1.9% CAGR,
driven mostly by the legal
market.
Over the same period, the illegal
market expanded at a 14%
CAGR, the highest growth rate
among the researched
countries.
From 2012 to 2013, the total
consumption of alcoholic
beverages decreased 16.5%,
with lower volumes in both the
illegal and legal markets.
In 2013, the size of the legal
market was estimated at
413,690 HL LAE in volume
terms, of which fermented
products had a 62.4% share and
distilled products 37.6%. Beer
represents 99.9% of all
fermented products.
Total alcoholic beverages market evolution – volume LAE
INTRODUCTION | METHODOLOGY | REGION | COUNTRIES | OUTLOOK | APPENDIX
Ecuador
The total consumption of alcoholic beverages fell sharply between 2012 and 2013
87,639
186,326
129,939
488,559
464,470
413,690
-
100,000
200,000
300,000
400,000
500,000
600,000
700,000
2011 2012 2013
HL
LA
E
Alcoholic beverages market size (volume LAE)
Illegal HL LAE Legal HL LAE
© Euromonitor International Ltd 2013. Applicable terms and conditions of use and the disclaimer at the front of this document apply. 77
Illegal alcoholic beverages market – Main drivers
INTRODUCTION | METHODOLOGY | REGION | COUNTRIES | OUTLOOK | APPENDIX
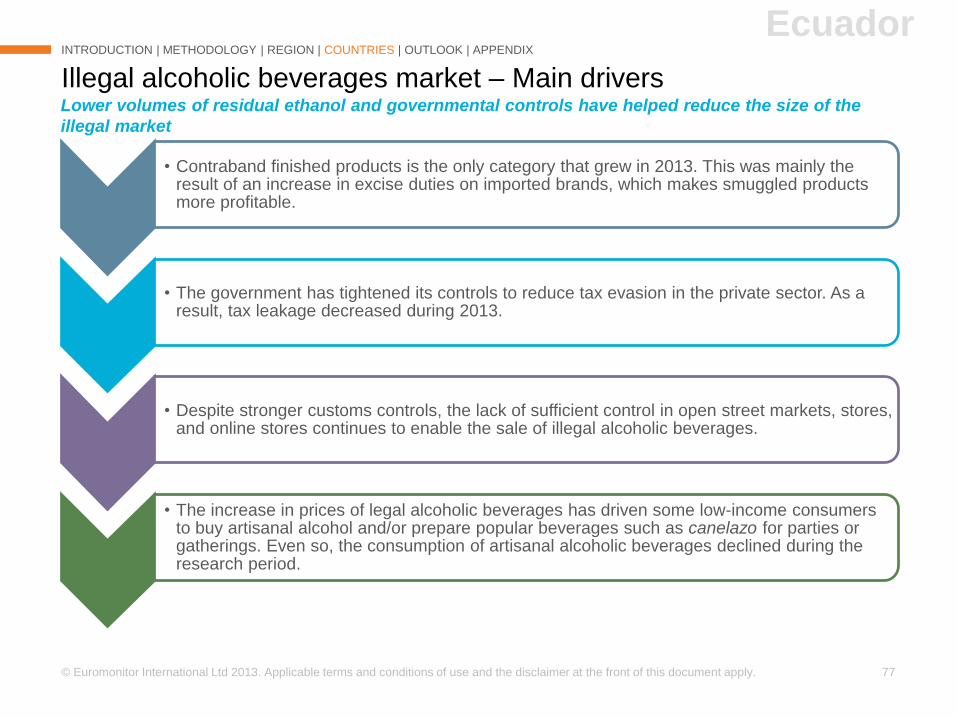
• Contraband finished products is the only category that grew in 2013. This was mainly the result of an increase in excise duties on imported brands, which makes smuggled products more profitable.
• The government has tightened its controls to reduce tax evasion in the private sector. As a result, tax leakage decreased during 2013.
• Despite stronger customs controls, the lack of sufficient control in open street markets, stores, and online stores continues to enable the sale of illegal alcoholic beverages.
• The increase in prices of legal alcoholic beverages has driven some low-income consumers to buy artisanal alcohol and/or prepare popular beverages such as canelazo for parties or gatherings. Even so, the consumption of artisanal alcoholic beverages declined during the research period.
Lower volumes of residual ethanol and governmental controls have helped reduce the size of the
illegal market
Ecuador
© Euromonitor International Ltd 2013. Applicable terms and conditions of use and the disclaimer at the front of this document apply. 78
14%
27%
10%
49%
Value 2013 (US$)
14%
15%
19%1%
51%
Volume 2013 (LAE)
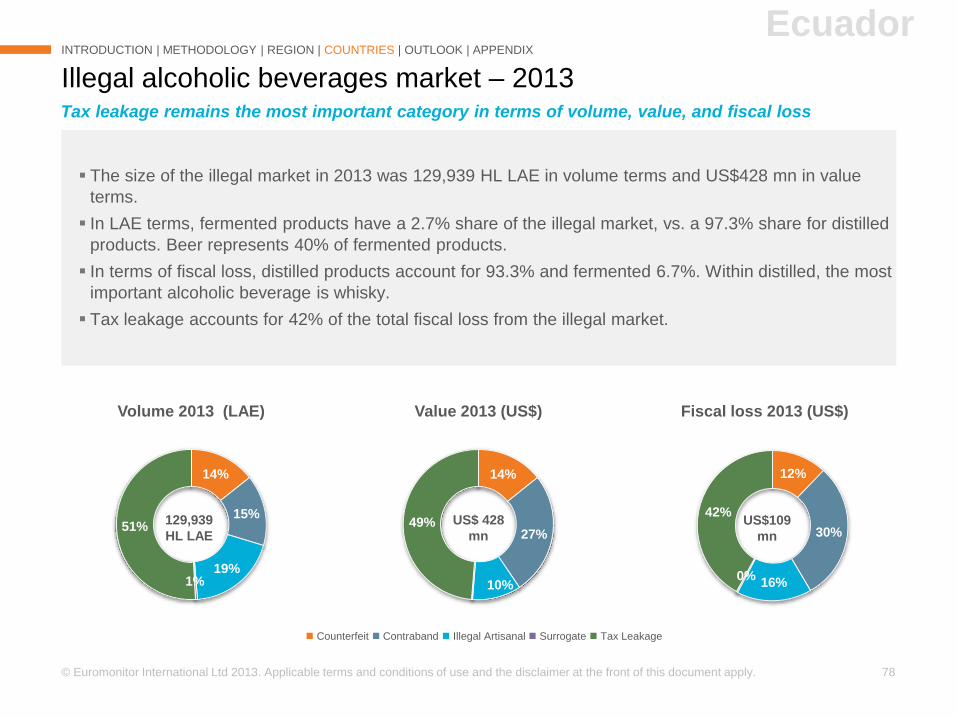
The size of the illegal market in 2013 was 129,939 HL LAE in volume terms and US$428 mn in value
terms.
In LAE terms, fermented products have a 2.7% share of the illegal market, vs. a 97.3% share for distilled
products. Beer represents 40% of fermented products.
In terms of fiscal loss, distilled products account for 93.3% and fermented 6.7%. Within distilled, the most
important alcoholic beverage is whisky.
Tax leakage accounts for 42% of the total fiscal loss from the illegal market.
Illegal alcoholic beverages market – 2013
INTRODUCTION | METHODOLOGY | REGION | COUNTRIES | OUTLOOK | APPENDIX
Counterfeit Contraband Illegal Artisanal Surrogate Tax Leakage
Tax leakage remains the most important category in terms of volume, value, and fiscal loss
129,939
HL LAE
US$109
mn
Ecuador
US$ 428
mn
12%
30%
16%0%
42%
Fiscal loss 2013 (US$)
© Euromonitor International Ltd 2013. Applicable terms and conditions of use and the disclaimer at the front of this document apply. 79
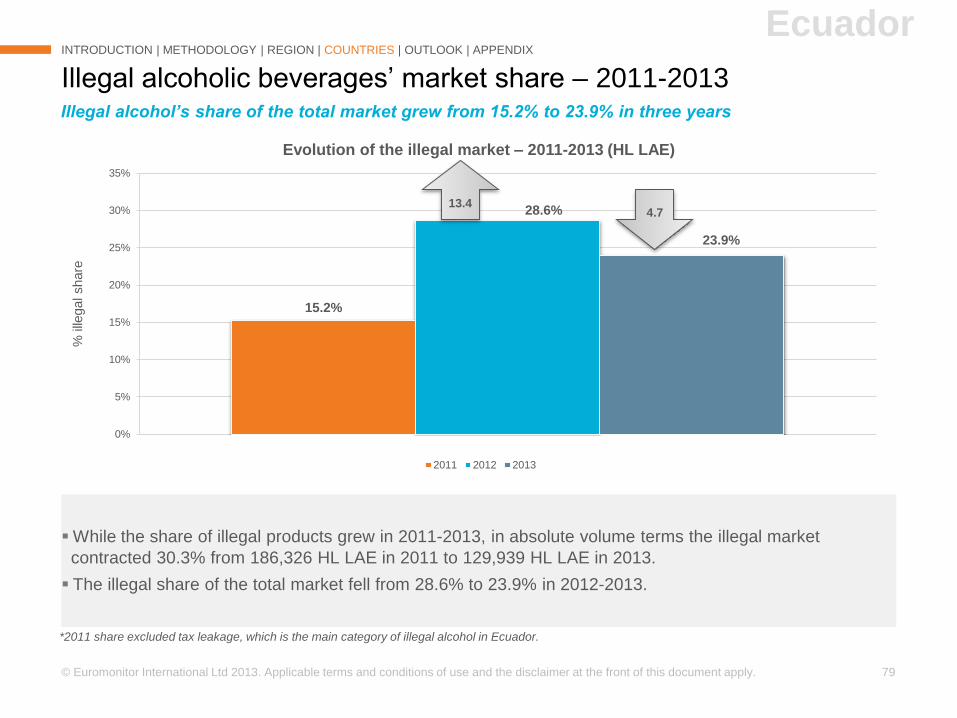
15.2%
28.6%
23.9%
0%
5%
10%
15%
20%
25%
30%
35%
% ille
gal share
Evolution of the illegal market – 2011-2013 (HL LAE)
2011 2012 2013
While the share of illegal products grew in 2011-2013, in absolute volume terms the illegal market
contracted 30.3% from 186,326 HL LAE in 2011 to 129,939 HL LAE in 2013.
The illegal share of the total market fell from 28.6% to 23.9% in 2012-2013.
Illegal alcoholic beverages’ market share – 2011-2013
INTRODUCTION | METHODOLOGY | REGION | COUNTRIES | OUTLOOK | APPENDIX
Illegal alcohol’s share of the total market grew from 15.2% to 23.9% in three years
Ecuador
*2011 share excluded tax leakage, which is the main category of illegal alcohol in Ecuador.
13.44.7
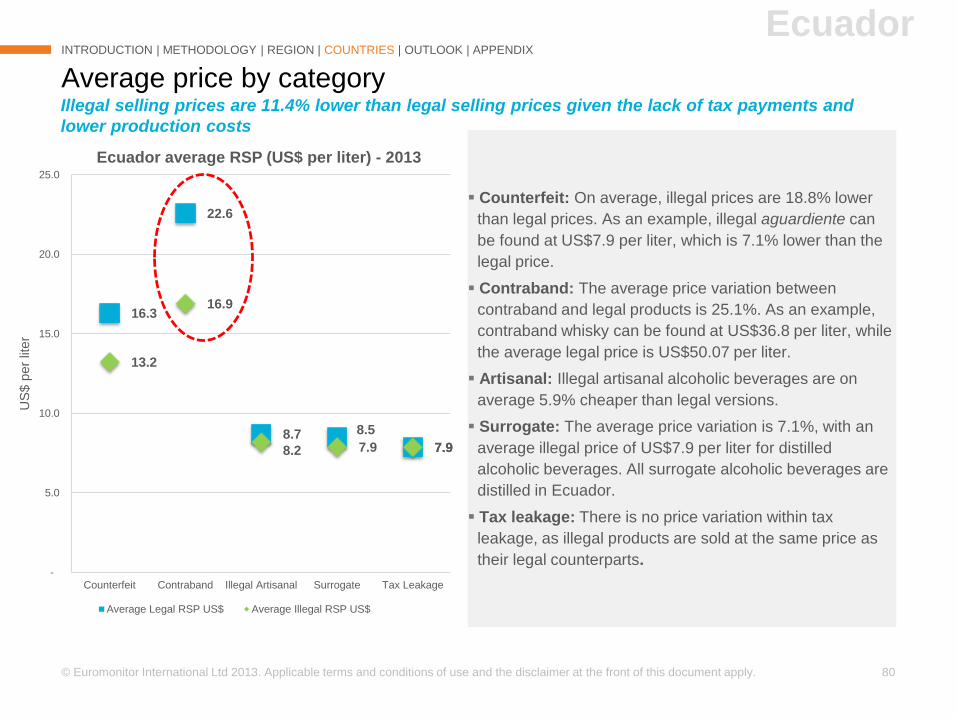
© Euromonitor International Ltd 2013. Applicable terms and conditions of use and the disclaimer at the front of this document apply. 80
16.3
22.6
8.7 8.5
7.9
13.2
16.9
8.2 7.9 7.9
-
5.0
10.0
15.0
20.0
25.0
Counterfeit Contraband Illegal Artisanal Surrogate Tax Leakage
US
$ p
er
liter
Ecuador average RSP (US$ per liter) - 2013
Average Legal RSP US$ Average Illegal RSP US$
Counterfeit: On average, illegal prices are 18.8% lower
than legal prices. As an example, illegal aguardiente can
be found at US$7.9 per liter, which is 7.1% lower than the
legal price.
Contraband: The average price variation between
contraband and legal products is 25.1%. As an example,
contraband whisky can be found at US$36.8 per liter, while
the average legal price is US$50.07 per liter.
Artisanal: Illegal artisanal alcoholic beverages are on
average 5.9% cheaper than legal versions.
Surrogate: The average price variation is 7.1%, with an
average illegal price of US$7.9 per liter for distilled
alcoholic beverages. All surrogate alcoholic beverages are
distilled in Ecuador.
Tax leakage: There is no price variation within tax
leakage, as illegal products are sold at the same price as
their legal counterparts.
Average price by category
INTRODUCTION | METHODOLOGY | REGION | COUNTRIES | OUTLOOK | APPENDIX
Illegal selling prices are 11.4% lower than legal selling prices given the lack of tax payments and
lower production costs
Ecuador
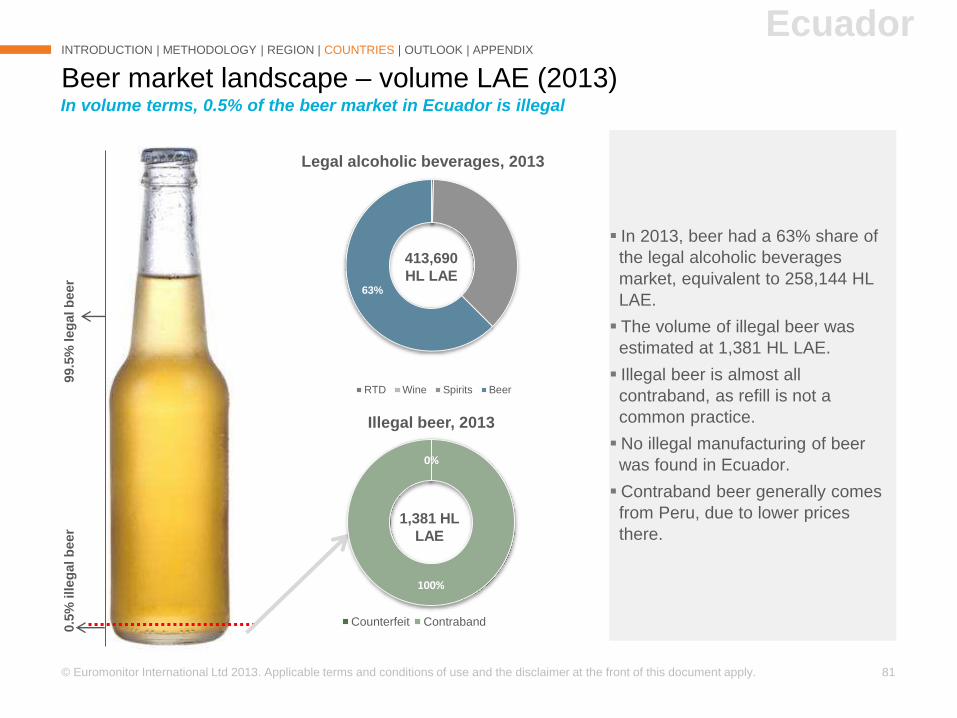
© Euromonitor International Ltd 2013. Applicable terms and conditions of use and the disclaimer at the front of this document apply. 81
63%
Legal alcoholic beverages, 2013
RTD Wine Spirits Beer
Beer market landscape – volume LAE (2013)
INTRODUCTION | METHODOLOGY | REGION | COUNTRIES | OUTLOOK | APPENDIX
In volume terms, 0.5% of the beer market in Ecuador is illegal
99.5
% leg
al b
eer
0.5
% illeg
al b
eer
In 2013, beer had a 63% share of
the legal alcoholic beverages
market, equivalent to 258,144 HL
LAE.
The volume of illegal beer was
estimated at 1,381 HL LAE.
Illegal beer is almost all
contraband, as refill is not a
common practice.
No illegal manufacturing of beer
was found in Ecuador.
Contraband beer generally comes
from Peru, due to lower prices
there.
Ecuador
0%
100%
Illegal beer, 2013
Counterfeit Contraband
1,381 HL
LAE
413,690
HL LAE
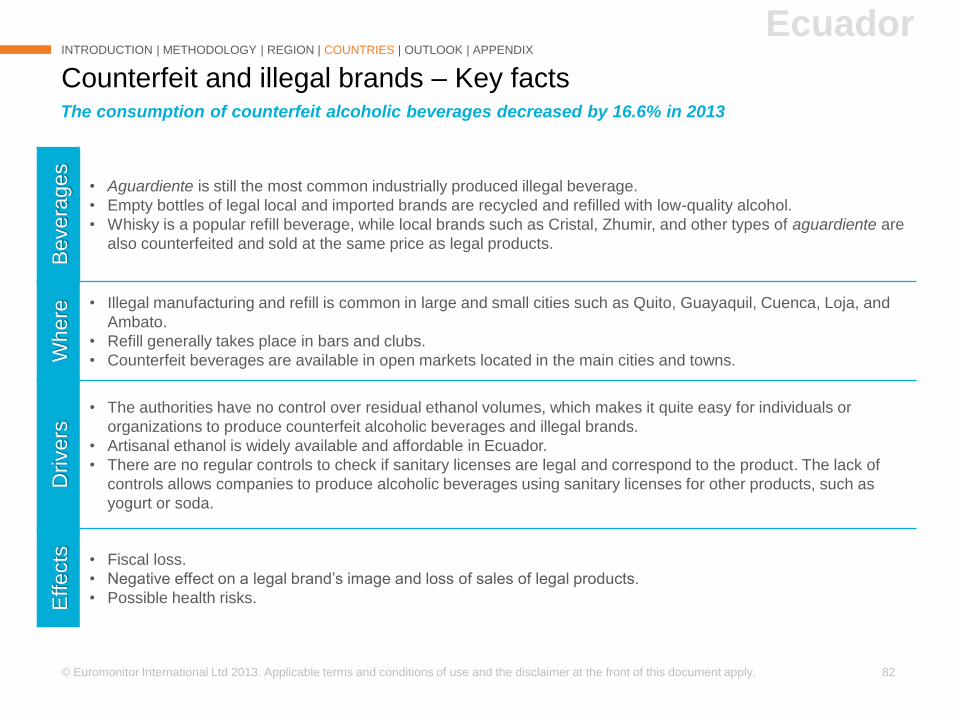
© Euromonitor International Ltd 2013. Applicable terms and conditions of use and the disclaimer at the front of this document apply. 82
Counterfeit and illegal brands – Key facts
INTRODUCTION | METHODOLOGY | REGION | COUNTRIES | OUTLOOK | APPENDIX
The consumption of counterfeit alcoholic beverages decreased by 16.6% in 2013
EcuadorB
evera
ges
• Aguardiente is still the most common industrially produced illegal beverage.
• Empty bottles of legal local and imported brands are recycled and refilled with low-quality alcohol.
• Whisky is a popular refill beverage, while local brands such as Cristal, Zhumir, and other types of aguardiente are
also counterfeited and sold at the same price as legal products.
Where
• Illegal manufacturing and refill is common in large and small cities such as Quito, Guayaquil, Cuenca, Loja, and
Ambato.
• Refill generally takes place in bars and clubs.
• Counterfeit beverages are available in open markets located in the main cities and towns.
Dri
vers
• The authorities have no control over residual ethanol volumes, which makes it quite easy for individuals or
organizations to produce counterfeit alcoholic beverages and illegal brands.
• Artisanal ethanol is widely available and affordable in Ecuador.
• There are no regular controls to check if sanitary licenses are legal and correspond to the product. The lack of
controls allows companies to produce alcoholic beverages using sanitary licenses for other products, such as
yogurt or soda.
Effects • Fiscal loss.
• Negative effect on a legal brand’s image and loss of sales of legal products.
• Possible health risks.
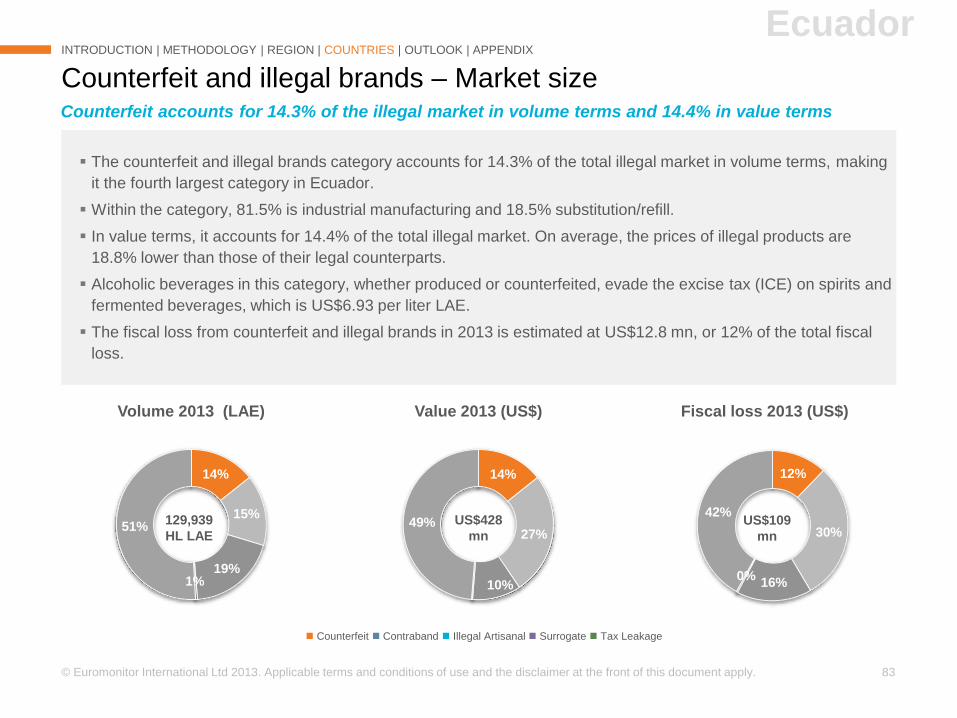
© Euromonitor International Ltd 2013. Applicable terms and conditions of use and the disclaimer at the front of this document apply. 83
The counterfeit and illegal brands category accounts for 14.3% of the total illegal market in volume terms, making
it the fourth largest category in Ecuador.
Within the category, 81.5% is industrial manufacturing and 18.5% substitution/refill.
In value terms, it accounts for 14.4% of the total illegal market. On average, the prices of illegal products are
18.8% lower than those of their legal counterparts.
Alcoholic beverages in this category, whether produced or counterfeited, evade the excise tax (ICE) on spirits and
fermented beverages, which is US$6.93 per liter LAE.
The fiscal loss from counterfeit and illegal brands in 2013 is estimated at US$12.8 mn, or 12% of the total fiscal
loss.
Counterfeit and illegal brands – Market size
INTRODUCTION | METHODOLOGY | REGION | COUNTRIES | OUTLOOK | APPENDIX
Counterfeit accounts for 14.3% of the illegal market in volume terms and 14.4% in value terms
Ecuador
14%
27%
10%
49%
Value 2013 (US$)
14%
15%
19%1%
51%
Volume 2013 (LAE)
Counterfeit Contraband Illegal Artisanal Surrogate Tax Leakage
129,939
HL LAE
US$109
mn
US$428
mn
12%
30%
16%0%
42%
Fiscal loss 2013 (US$)
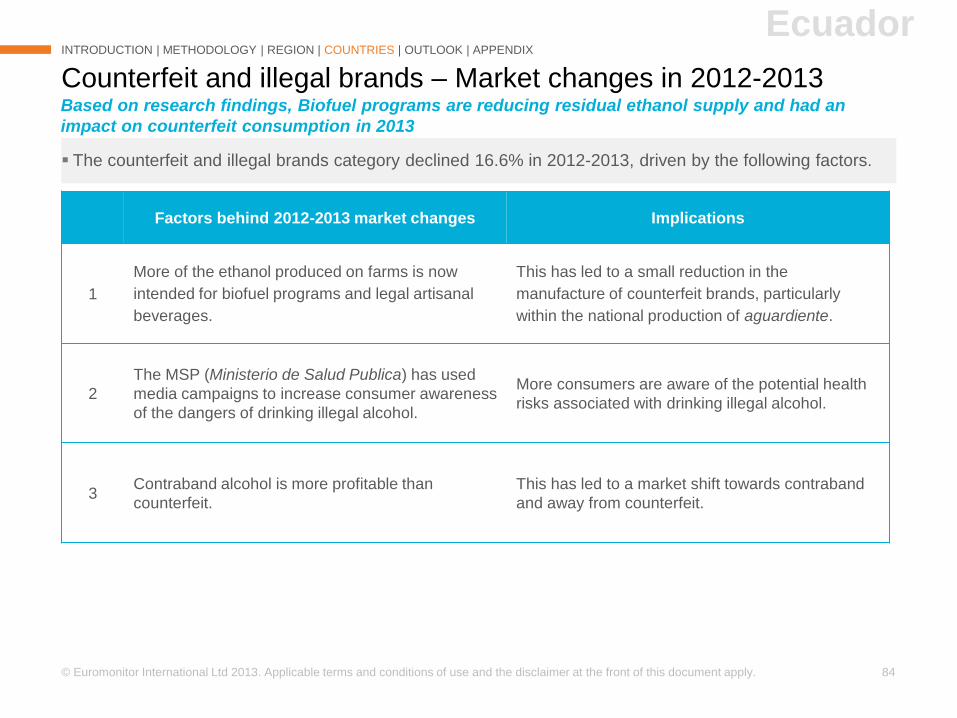
© Euromonitor International Ltd 2013. Applicable terms and conditions of use and the disclaimer at the front of this document apply. 84
The counterfeit and illegal brands category declined 16.6% in 2012-2013, driven by the following factors.
Counterfeit and illegal brands – Market changes in 2012-2013
INTRODUCTION | METHODOLOGY | REGION | COUNTRIES | OUTLOOK | APPENDIX
Factors behind 2012-2013 market changes Implications
1
More of the ethanol produced on farms is now
intended for biofuel programs and legal artisanal
beverages.
This has led to a small reduction in the
manufacture of counterfeit brands, particularly
within the national production of aguardiente.
2
The MSP (Ministerio de Salud Publica) has used
media campaigns to increase consumer awareness
of the dangers of drinking illegal alcohol.
More consumers are aware of the potential health
risks associated with drinking illegal alcohol.
3Contraband alcohol is more profitable than
counterfeit.
This has led to a market shift towards contraband
and away from counterfeit.
Based on research findings, Biofuel programs are reducing residual ethanol supply and had an
impact on counterfeit consumption in 2013
Ecuador
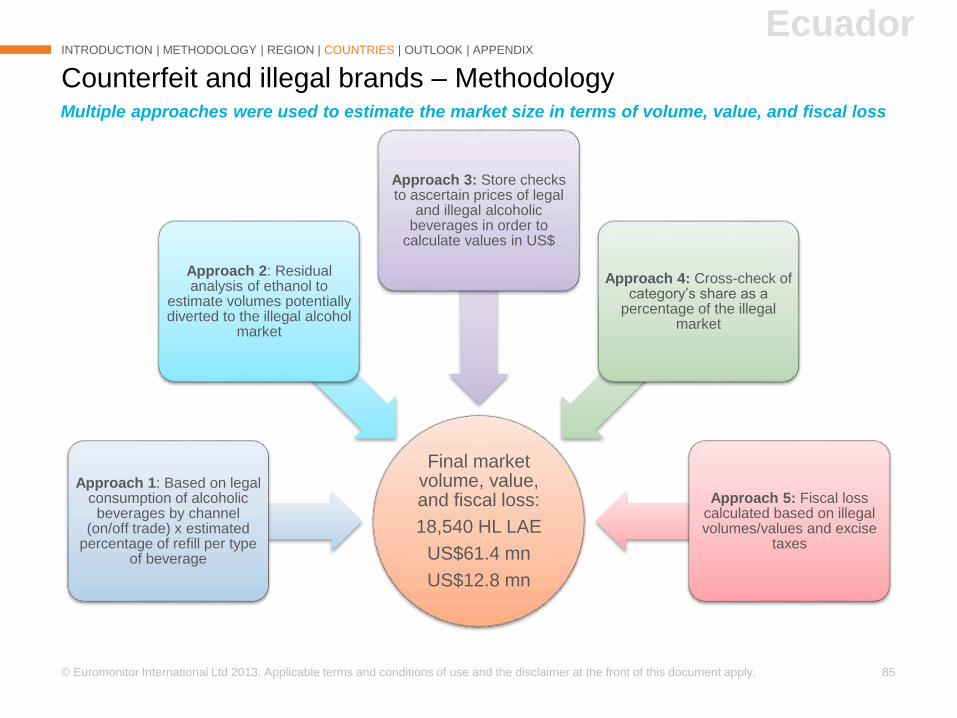
© Euromonitor International Ltd 2013. Applicable terms and conditions of use and the disclaimer at the front of this document apply. 85
Final market volume, value, and fiscal loss:
18,540 HL LAE
US$61.4 mn
US$12.8 mn
Approach 1: Based on legal consumption of alcoholic
beverages by channel (on/off trade) x estimated
percentage of refill per type of beverage
Approach 2: Residual analysis of ethanol to
estimate volumes potentially diverted to the illegal alcohol
market
Approach 3: Store checks to ascertain prices of legal
and illegal alcoholic beverages in order to
calculate values in US$
Approach 4: Cross-check of category’s share as a
percentage of the illegal market
Approach 5: Fiscal loss calculated based on illegal volumes/values and excise
taxes
Counterfeit and illegal brands – Methodology
INTRODUCTION | METHODOLOGY | REGION | COUNTRIES | OUTLOOK | APPENDIX
Multiple approaches were used to estimate the market size in terms of volume, value, and fiscal loss
Ecuador
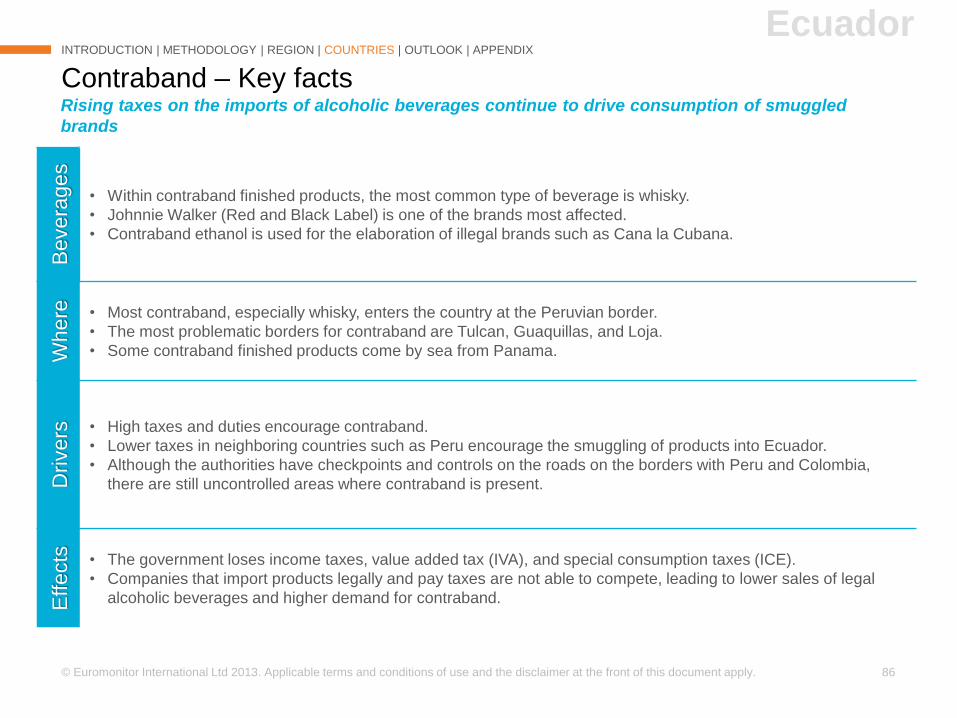
© Euromonitor International Ltd 2013. Applicable terms and conditions of use and the disclaimer at the front of this document apply. 86
Contraband – Key facts
INTRODUCTION | METHODOLOGY | REGION | COUNTRIES | OUTLOOK | APPENDIX
Rising taxes on the imports of alcoholic beverages continue to drive consumption of smuggled
brands
EcuadorB
evera
ges
• Within contraband finished products, the most common type of beverage is whisky.
• Johnnie Walker (Red and Black Label) is one of the brands most affected.
• Contraband ethanol is used for the elaboration of illegal brands such as Cana la Cubana.
Where • Most contraband, especially whisky, enters the country at the Peruvian border.
• The most problematic borders for contraband are Tulcan, Guaquillas, and Loja.
• Some contraband finished products come by sea from Panama.
Dri
vers • High taxes and duties encourage contraband.
• Lower taxes in neighboring countries such as Peru encourage the smuggling of products into Ecuador.
• Although the authorities have checkpoints and controls on the roads on the borders with Peru and Colombia,
there are still uncontrolled areas where contraband is present.
Effects • The government loses income taxes, value added tax (IVA), and special consumption taxes (ICE).
• Companies that import products legally and pay taxes are not able to compete, leading to lower sales of legal
alcoholic beverages and higher demand for contraband.
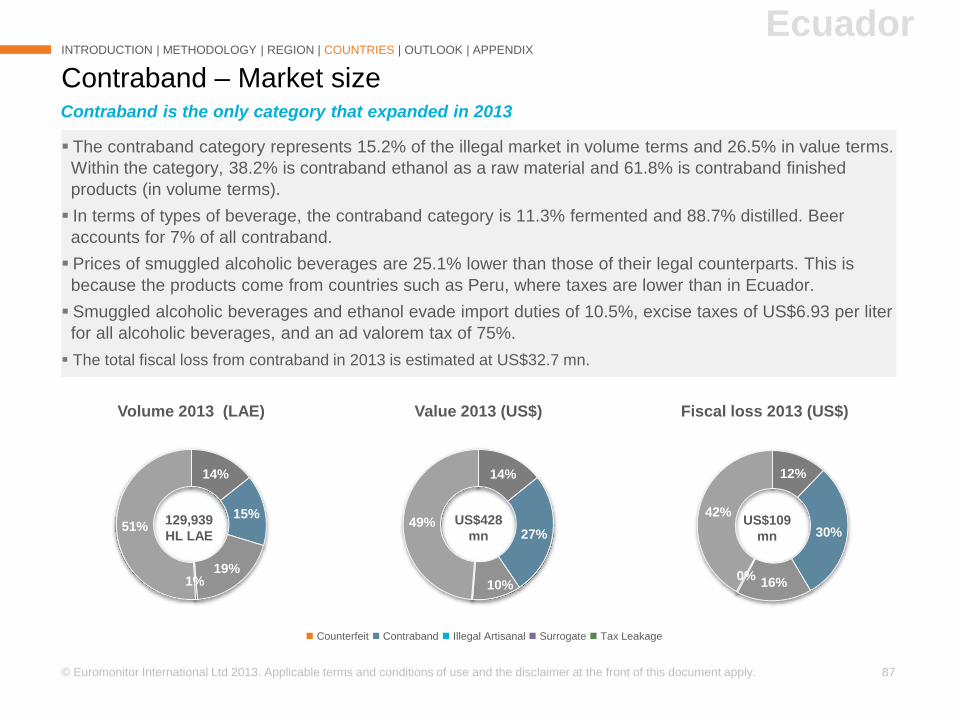
© Euromonitor International Ltd 2013. Applicable terms and conditions of use and the disclaimer at the front of this document apply. 87
The contraband category represents 15.2% of the illegal market in volume terms and 26.5% in value terms.
Within the category, 38.2% is contraband ethanol as a raw material and 61.8% is contraband finished
products (in volume terms).
In terms of types of beverage, the contraband category is 11.3% fermented and 88.7% distilled. Beer
accounts for 7% of all contraband.
Prices of smuggled alcoholic beverages are 25.1% lower than those of their legal counterparts. This is
because the products come from countries such as Peru, where taxes are lower than in Ecuador.
Smuggled alcoholic beverages and ethanol evade import duties of 10.5%, excise taxes of US$6.93 per liter
for all alcoholic beverages, and an ad valorem tax of 75%.
The total fiscal loss from contraband in 2013 is estimated at US$32.7 mn.
Contraband – Market size
INTRODUCTION | METHODOLOGY | REGION | COUNTRIES | OUTLOOK | APPENDIX
Contraband is the only category that expanded in 2013
Ecuador
14%
27%
10%
49%
Value 2013 (US$)
14%
15%
19%1%
51%
Volume 2013 (LAE)
Counterfeit Contraband Illegal Artisanal Surrogate Tax Leakage
129,939
HL LAE
US$109
mn
US$428
mn
12%
30%
16%0%
42%
Fiscal loss 2013 (US$)
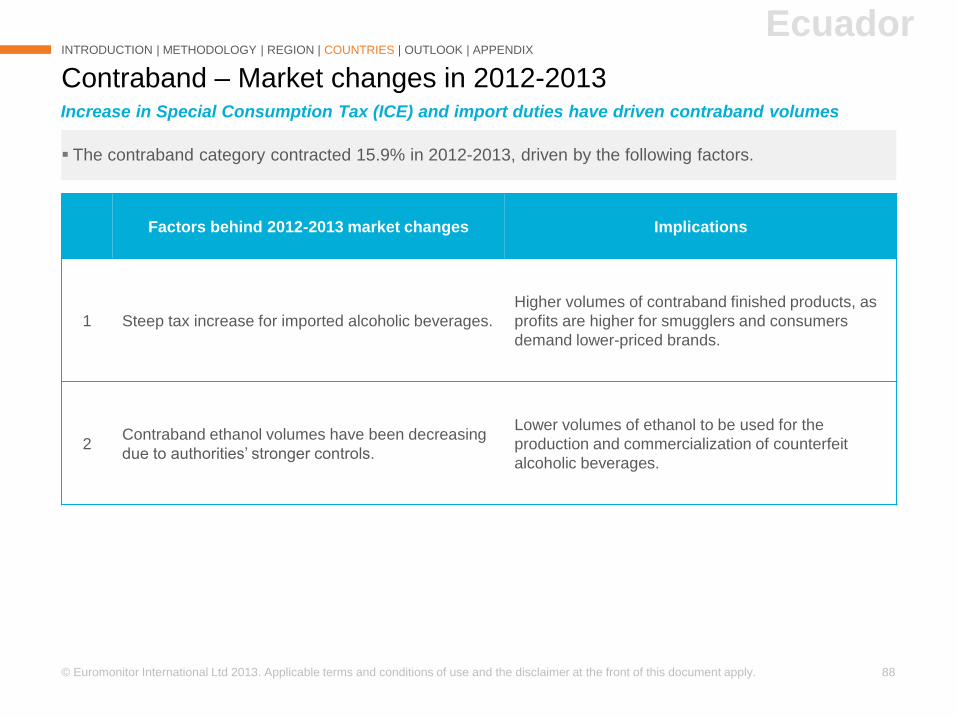
© Euromonitor International Ltd 2013. Applicable terms and conditions of use and the disclaimer at the front of this document apply. 88
The contraband category contracted 15.9% in 2012-2013, driven by the following factors.
Contraband – Market changes in 2012-2013
INTRODUCTION | METHODOLOGY | REGION | COUNTRIES | OUTLOOK | APPENDIX
Factors behind 2012-2013 market changes Implications
1 Steep tax increase for imported alcoholic beverages.
Higher volumes of contraband finished products, as
profits are higher for smugglers and consumers
demand lower-priced brands.
2Contraband ethanol volumes have been decreasing
due to authorities’ stronger controls.
Lower volumes of ethanol to be used for the
production and commercialization of counterfeit
alcoholic beverages.
Increase in Special Consumption Tax (ICE) and import duties have driven contraband volumes
Ecuador
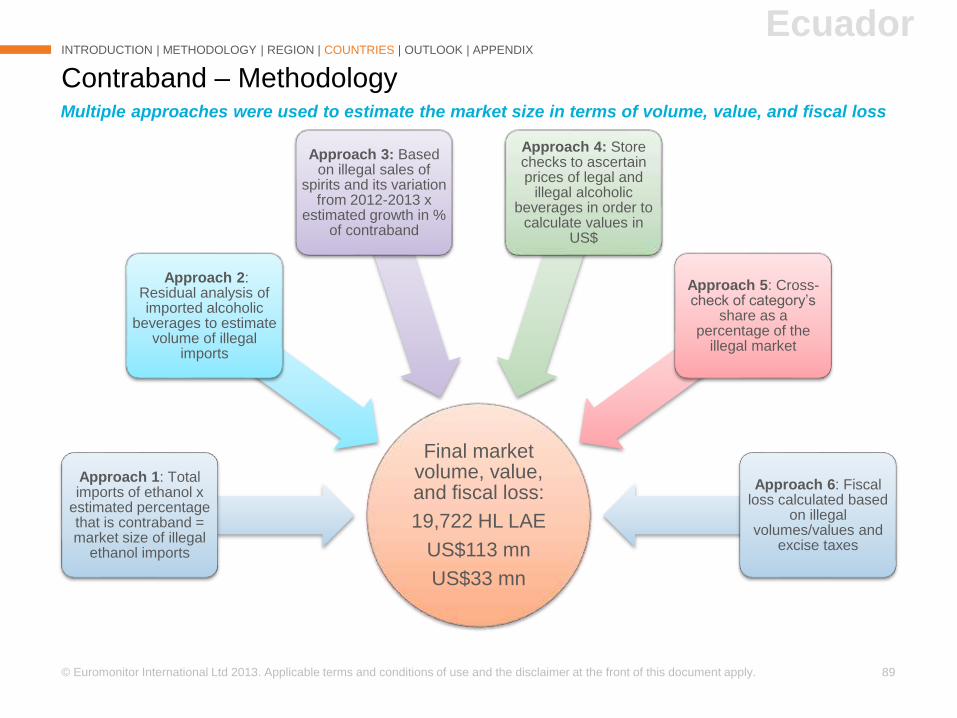
© Euromonitor International Ltd 2013. Applicable terms and conditions of use and the disclaimer at the front of this document apply. 89
Contraband – Methodology
INTRODUCTION | METHODOLOGY | REGION | COUNTRIES | OUTLOOK | APPENDIX
Final market volume, value, and fiscal loss:
19,722 HL LAE
US$113 mn
US$33 mn
Approach 1: Total imports of ethanol x
estimated percentage that is contraband = market size of illegal
ethanol imports
Approach 2: Residual analysis of imported alcoholic
beverages to estimate volume of illegal
imports
Approach 3: Based on illegal sales of
spirits and its variation from 2012-2013 x
estimated growth in % of contraband
Approach 4: Store checks to ascertain prices of legal and
illegal alcoholic beverages in order to
calculate values in US$
Approach 5: Cross-check of category’s
share as a percentage of the
illegal market
Approach 6: Fiscal loss calculated based
on illegal volumes/values and
excise taxes
Multiple approaches were used to estimate the market size in terms of volume, value, and fiscal loss
Ecuador
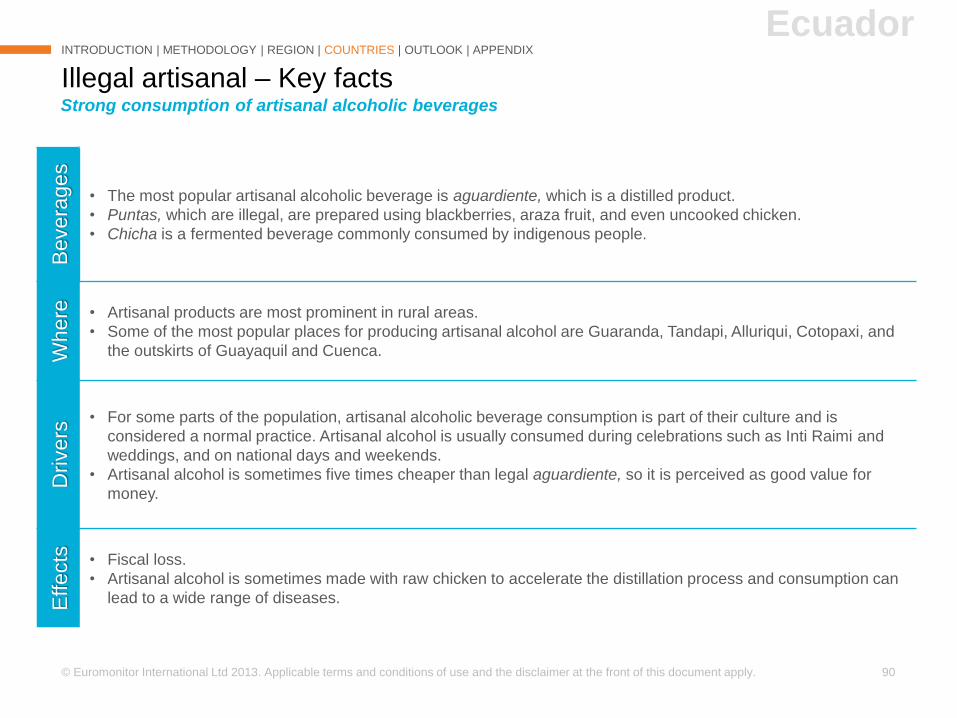
© Euromonitor International Ltd 2013. Applicable terms and conditions of use and the disclaimer at the front of this document apply. 90
Illegal artisanal – Key facts
INTRODUCTION | METHODOLOGY | REGION | COUNTRIES | OUTLOOK | APPENDIX
Strong consumption of artisanal alcoholic beverages
EcuadorB
evera
ges
• The most popular artisanal alcoholic beverage is aguardiente, which is a distilled product.
• Puntas, which are illegal, are prepared using blackberries, araza fruit, and even uncooked chicken.
• Chicha is a fermented beverage commonly consumed by indigenous people.
Where • Artisanal products are most prominent in rural areas.
• Some of the most popular places for producing artisanal alcohol are Guaranda, Tandapi, Alluriqui, Cotopaxi, and
the outskirts of Guayaquil and Cuenca.
Dri
vers
• For some parts of the population, artisanal alcoholic beverage consumption is part of their culture and is
considered a normal practice. Artisanal alcohol is usually consumed during celebrations such as Inti Raimi and
weddings, and on national days and weekends.
• Artisanal alcohol is sometimes five times cheaper than legal aguardiente, so it is perceived as good value for
money.
Effects • Fiscal loss.
• Artisanal alcohol is sometimes made with raw chicken to accelerate the distillation process and consumption can
lead to a wide range of diseases.
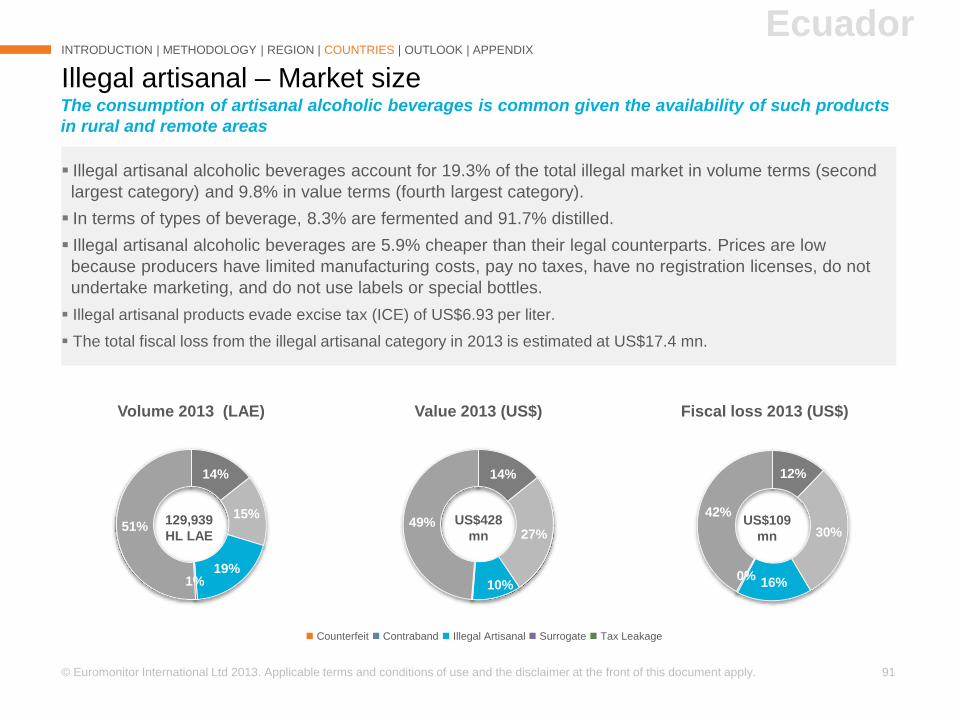
© Euromonitor International Ltd 2013. Applicable terms and conditions of use and the disclaimer at the front of this document apply. 91
Illegal artisanal alcoholic beverages account for 19.3% of the total illegal market in volume terms (second
largest category) and 9.8% in value terms (fourth largest category).
In terms of types of beverage, 8.3% are fermented and 91.7% distilled.
Illegal artisanal alcoholic beverages are 5.9% cheaper than their legal counterparts. Prices are low
because producers have limited manufacturing costs, pay no taxes, have no registration licenses, do not
undertake marketing, and do not use labels or special bottles.
Illegal artisanal products evade excise tax (ICE) of US$6.93 per liter.
The total fiscal loss from the illegal artisanal category in 2013 is estimated at US$17.4 mn.
Illegal artisanal – Market size
INTRODUCTION | METHODOLOGY | REGION | COUNTRIES | OUTLOOK | APPENDIX
The consumption of artisanal alcoholic beverages is common given the availability of such products
in rural and remote areas
Ecuador
14%
27%
10%
49%
Value 2013 (US$)
14%
15%
19%1%
51%
Volume 2013 (LAE)
Counterfeit Contraband Illegal Artisanal Surrogate Tax Leakage
129,939
HL LAE
US$109
mn
US$428
mn
12%
30%
16%0%
42%
Fiscal loss 2013 (US$)
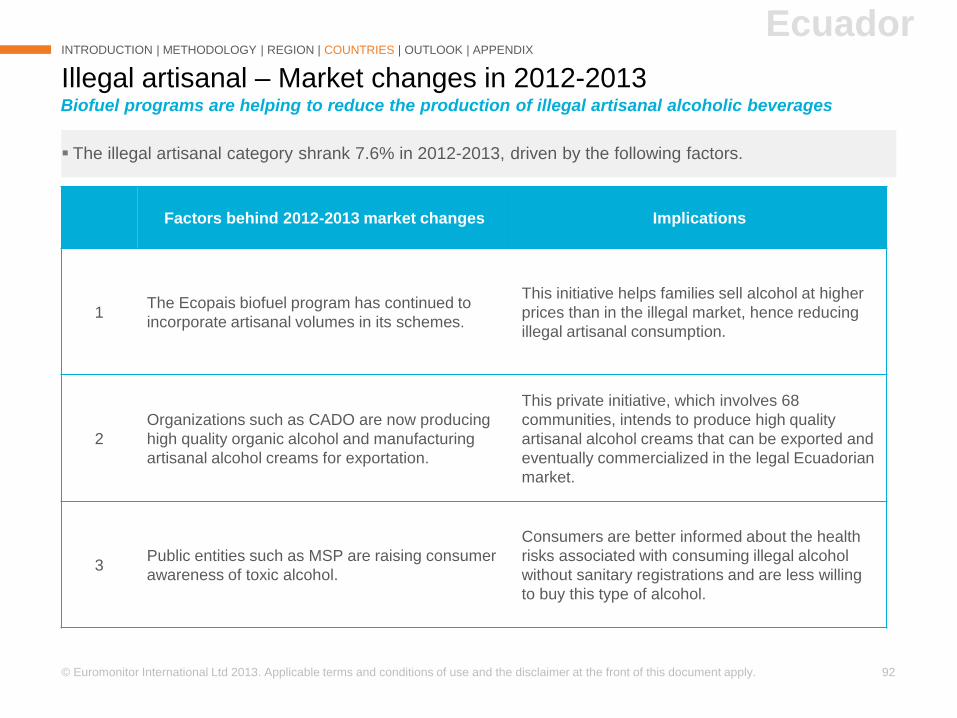
© Euromonitor International Ltd 2013. Applicable terms and conditions of use and the disclaimer at the front of this document apply. 92
The illegal artisanal category shrank 7.6% in 2012-2013, driven by the following factors.
Illegal artisanal – Market changes in 2012-2013
INTRODUCTION | METHODOLOGY | REGION | COUNTRIES | OUTLOOK | APPENDIX
Factors behind 2012-2013 market changes Implications
1The Ecopais biofuel program has continued to
incorporate artisanal volumes in its schemes.
This initiative helps families sell alcohol at higher
prices than in the illegal market, hence reducing
illegal artisanal consumption.
2
Organizations such as CADO are now producing
high quality organic alcohol and manufacturing
artisanal alcohol creams for exportation.
This private initiative, which involves 68
communities, intends to produce high quality
artisanal alcohol creams that can be exported and
eventually commercialized in the legal Ecuadorian
market.
3Public entities such as MSP are raising consumer
awareness of toxic alcohol.
Consumers are better informed about the health
risks associated with consuming illegal alcohol
without sanitary registrations and are less willing
to buy this type of alcohol.
Biofuel programs are helping to reduce the production of illegal artisanal alcoholic beverages
Ecuador

© Euromonitor International Ltd 2013. Applicable terms and conditions of use and the disclaimer at the front of this document apply. 93
Illegal artisanal – Methodology
INTRODUCTION | METHODOLOGY | REGION | COUNTRIES | OUTLOOK | APPENDIX
Final market volume, value, and fiscal loss:
25,063 HL LAE
US$44 mn
US$17 mn
Approach 1: Impact of biofuel programs on artisanal production of alcoholic
beverages based on 2012 production estimates
Approach 2: Store checks to ascertain prices of legal and illegal alcoholic beverages in order to calculate values in
US$
Approach 3: Cross-check of category’s share as a
percentage of the illegal market
Approach 4: Fiscal loss calculated based on illegal volumes/values and excise
taxes
Multiple approaches were used to estimate the market size in terms of volume, value, and fiscal loss
Ecuador
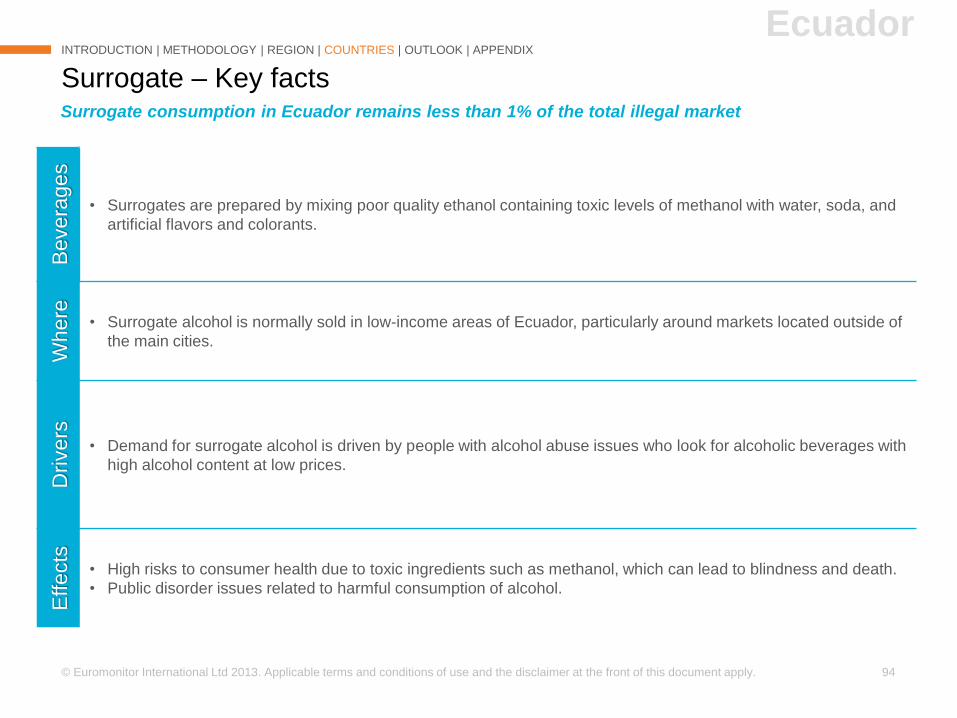
© Euromonitor International Ltd 2013. Applicable terms and conditions of use and the disclaimer at the front of this document apply. 94
Surrogate – Key facts
INTRODUCTION | METHODOLOGY | REGION | COUNTRIES | OUTLOOK | APPENDIX
Surrogate consumption in Ecuador remains less than 1% of the total illegal market
EcuadorB
evera
ges
• Surrogates are prepared by mixing poor quality ethanol containing toxic levels of methanol with water, soda, and
artificial flavors and colorants.
Where
• Surrogate alcohol is normally sold in low-income areas of Ecuador, particularly around markets located outside of
the main cities.
Dri
vers
• Demand for surrogate alcohol is driven by people with alcohol abuse issues who look for alcoholic beverages with
high alcohol content at low prices.
Effects
• High risks to consumer health due to toxic ingredients such as methanol, which can lead to blindness and death.
• Public disorder issues related to harmful consumption of alcohol.
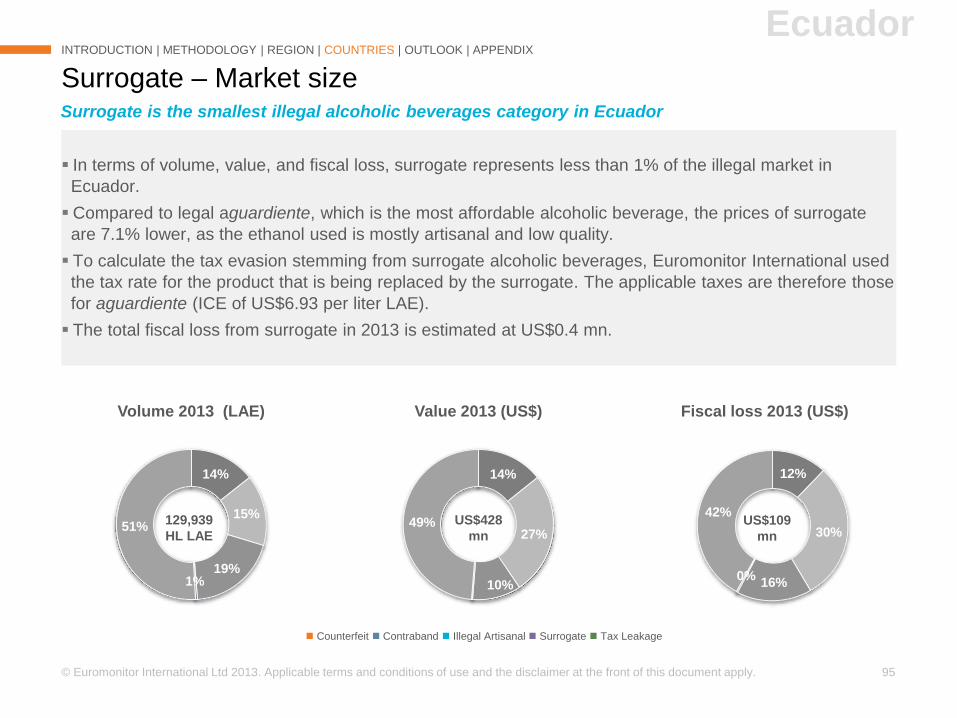
© Euromonitor International Ltd 2013. Applicable terms and conditions of use and the disclaimer at the front of this document apply. 95
In terms of volume, value, and fiscal loss, surrogate represents less than 1% of the illegal market in
Ecuador.
Compared to legal aguardiente, which is the most affordable alcoholic beverage, the prices of surrogate
are 7.1% lower, as the ethanol used is mostly artisanal and low quality.
To calculate the tax evasion stemming from surrogate alcoholic beverages, Euromonitor International used
the tax rate for the product that is being replaced by the surrogate. The applicable taxes are therefore those
for aguardiente (ICE of US$6.93 per liter LAE).
The total fiscal loss from surrogate in 2013 is estimated at US$0.4 mn.
Surrogate – Market size
INTRODUCTION | METHODOLOGY | REGION | COUNTRIES | OUTLOOK | APPENDIX
Surrogate is the smallest illegal alcoholic beverages category in Ecuador
Ecuador
14%
27%
10%
49%
Value 2013 (US$)
14%
15%
19%1%
51%
Volume 2013 (LAE)
Counterfeit Contraband Illegal Artisanal Surrogate Tax Leakage
129,939
HL LAE
US$109
mn
US$428
mn
12%
30%
16%0%
42%
Fiscal loss 2013 (US$)
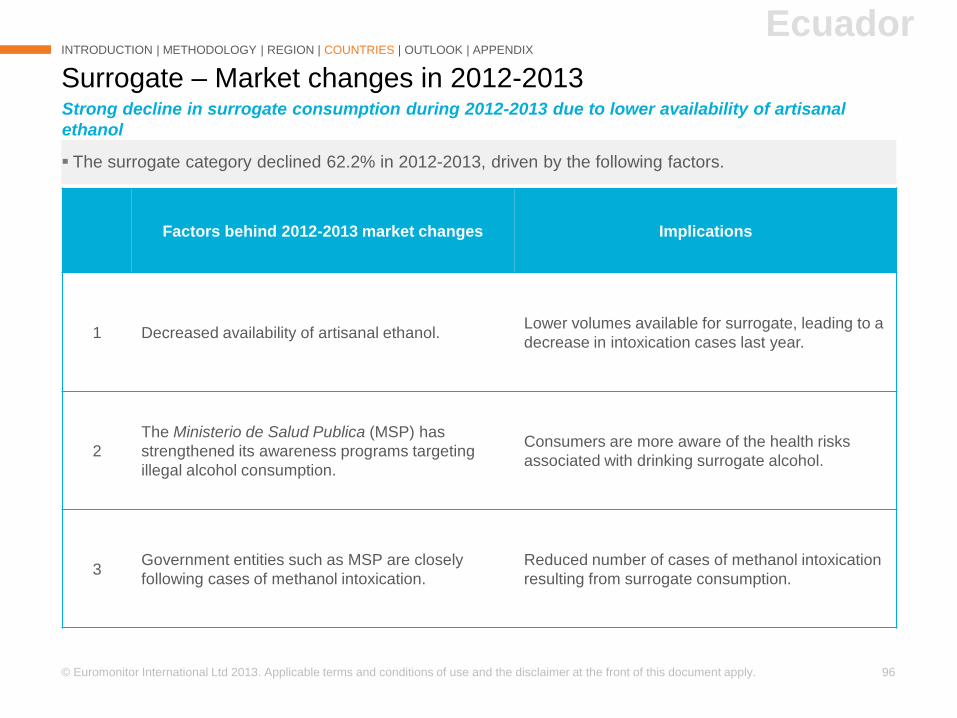
© Euromonitor International Ltd 2013. Applicable terms and conditions of use and the disclaimer at the front of this document apply. 96
The surrogate category declined 62.2% in 2012-2013, driven by the following factors.
Surrogate – Market changes in 2012-2013
INTRODUCTION | METHODOLOGY | REGION | COUNTRIES | OUTLOOK | APPENDIX
Factors behind 2012-2013 market changes Implications
1 Decreased availability of artisanal ethanol.Lower volumes available for surrogate, leading to a
decrease in intoxication cases last year.
2
The Ministerio de Salud Publica (MSP) has
strengthened its awareness programs targeting
illegal alcohol consumption.
Consumers are more aware of the health risks
associated with drinking surrogate alcohol.
3Government entities such as MSP are closely
following cases of methanol intoxication.
Reduced number of cases of methanol intoxication
resulting from surrogate consumption.
Strong decline in surrogate consumption during 2012-2013 due to lower availability of artisanal
ethanol
Ecuador
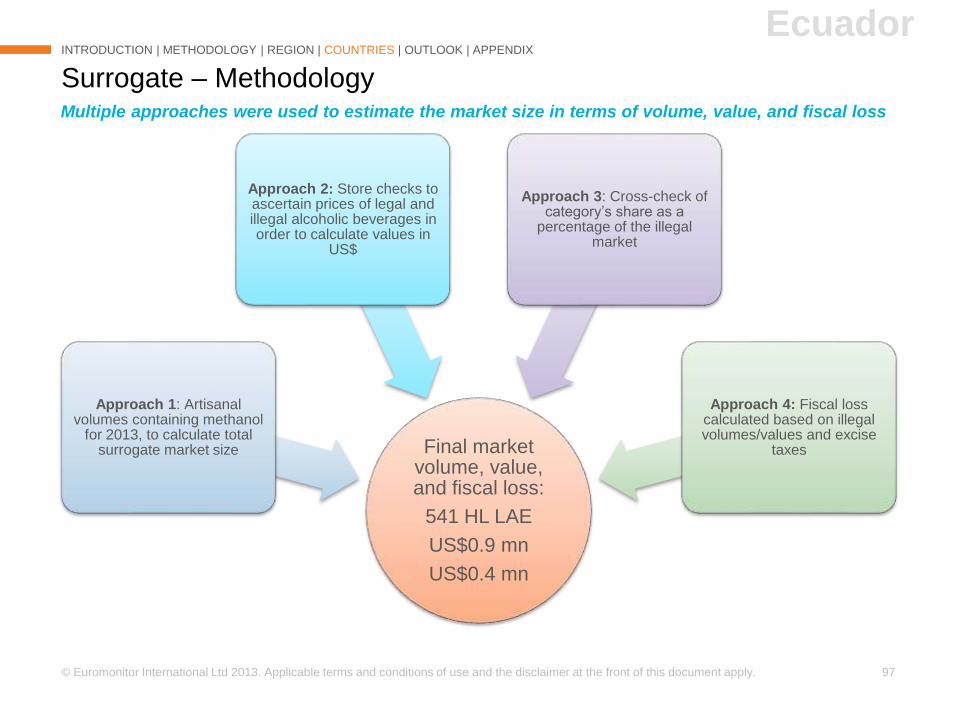
© Euromonitor International Ltd 2013. Applicable terms and conditions of use and the disclaimer at the front of this document apply. 97
Surrogate – Methodology
INTRODUCTION | METHODOLOGY | REGION | COUNTRIES | OUTLOOK | APPENDIX
Final market volume, value, and fiscal loss:
541 HL LAE
US$0.9 mn
US$0.4 mn
Approach 1: Artisanal volumes containing methanol
for 2013, to calculate total surrogate market size
Approach 2: Store checks to ascertain prices of legal and illegal alcoholic beverages in order to calculate values in
US$
Approach 3: Cross-check of category’s share as a
percentage of the illegal market
Approach 4: Fiscal loss calculated based on illegal volumes/values and excise
taxes
Multiple approaches were used to estimate the market size in terms of volume, value, and fiscal loss
Ecuador
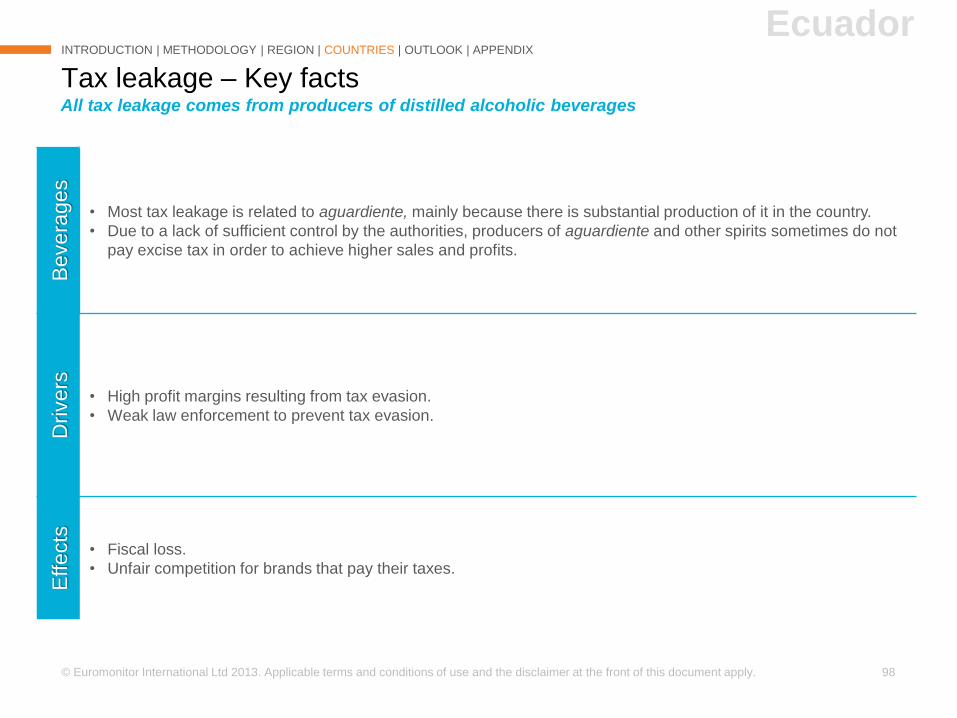
© Euromonitor International Ltd 2013. Applicable terms and conditions of use and the disclaimer at the front of this document apply. 98
Tax leakage – Key facts
INTRODUCTION | METHODOLOGY | REGION | COUNTRIES | OUTLOOK | APPENDIX
All tax leakage comes from producers of distilled alcoholic beverages
EcuadorB
evera
ges
• Most tax leakage is related to aguardiente, mainly because there is substantial production of it in the country.
• Due to a lack of sufficient control by the authorities, producers of aguardiente and other spirits sometimes do not
pay excise tax in order to achieve higher sales and profits.
Drivers
• High profit margins resulting from tax evasion.
• Weak law enforcement to prevent tax evasion.
Effects
• Fiscal loss.
• Unfair competition for brands that pay their taxes.
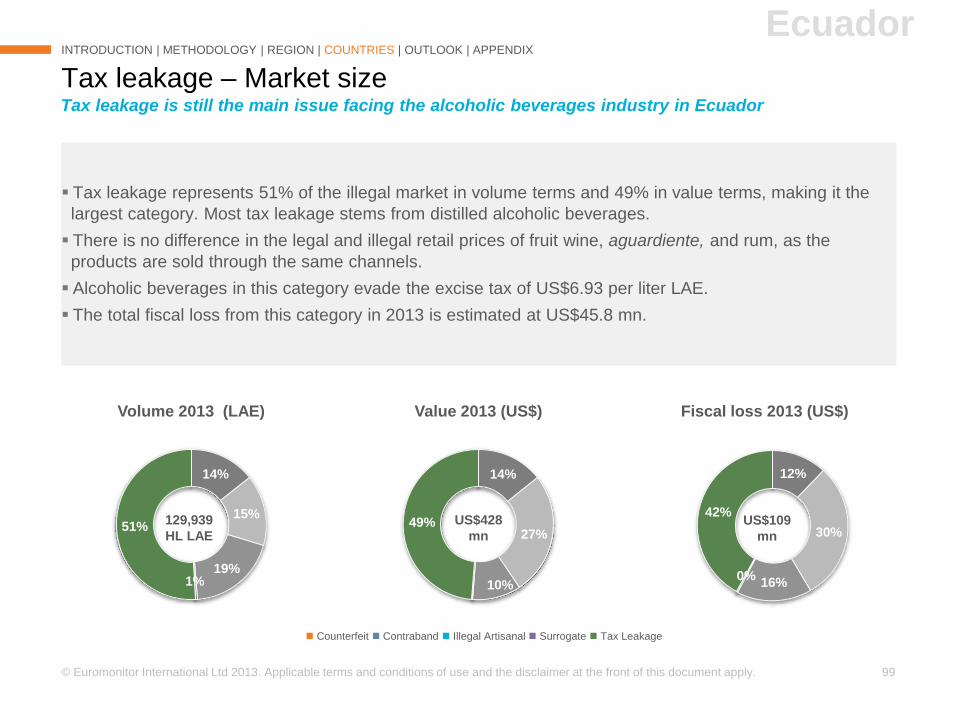
© Euromonitor International Ltd 2013. Applicable terms and conditions of use and the disclaimer at the front of this document apply. 99
Tax leakage represents 51% of the illegal market in volume terms and 49% in value terms, making it the
largest category. Most tax leakage stems from distilled alcoholic beverages.
There is no difference in the legal and illegal retail prices of fruit wine, aguardiente, and rum, as the
products are sold through the same channels.
Alcoholic beverages in this category evade the excise tax of US$6.93 per liter LAE.
The total fiscal loss from this category in 2013 is estimated at US$45.8 mn.
Tax leakage – Market size
INTRODUCTION | METHODOLOGY | REGION | COUNTRIES | OUTLOOK | APPENDIX
Ecuador
14%
27%
10%
49%
Value 2013 (US$)
14%
15%
19%1%
51%
Volume 2013 (LAE)
Counterfeit Contraband Illegal Artisanal Surrogate Tax Leakage
129,939
HL LAE
US$109
mn
US$428
mn
Tax leakage is still the main issue facing the alcoholic beverages industry in Ecuador
12%
30%
16%0%
42%
Fiscal loss 2013 (US$)
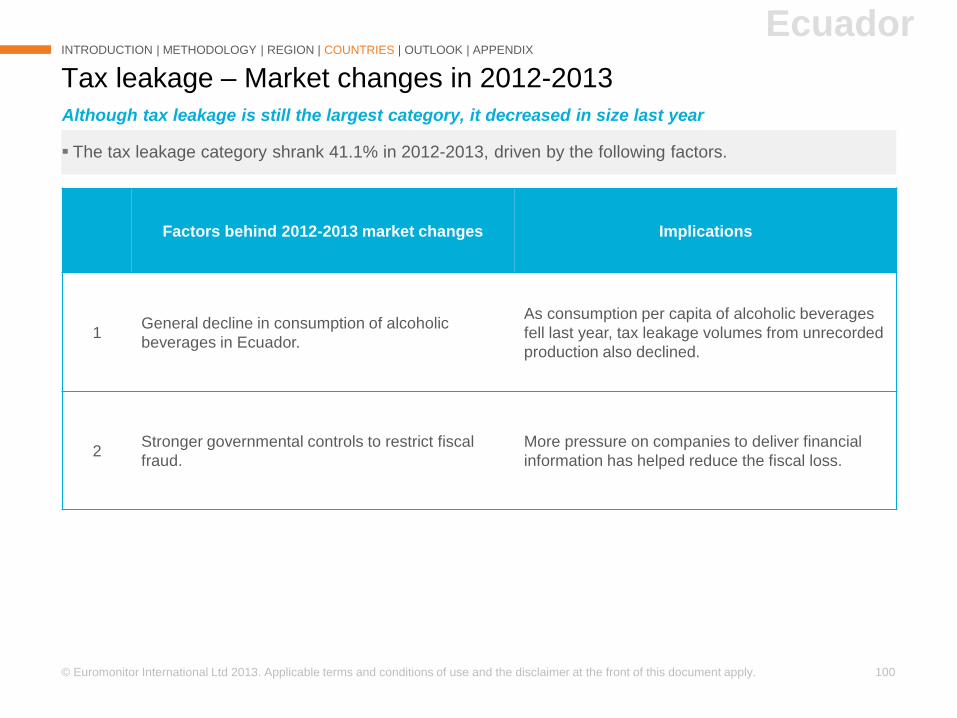
© Euromonitor International Ltd 2013. Applicable terms and conditions of use and the disclaimer at the front of this document apply. 100
The tax leakage category shrank 41.1% in 2012-2013, driven by the following factors.
Tax leakage – Market changes in 2012-2013
INTRODUCTION | METHODOLOGY | REGION | COUNTRIES | OUTLOOK | APPENDIX
Factors behind 2012-2013 market changes Implications
1General decline in consumption of alcoholic
beverages in Ecuador.
As consumption per capita of alcoholic beverages
fell last year, tax leakage volumes from unrecorded
production also declined.
2Stronger governmental controls to restrict fiscal
fraud.
More pressure on companies to deliver financial
information has helped reduce the fiscal loss.
Although tax leakage is still the largest category, it decreased in size last year
Ecuador
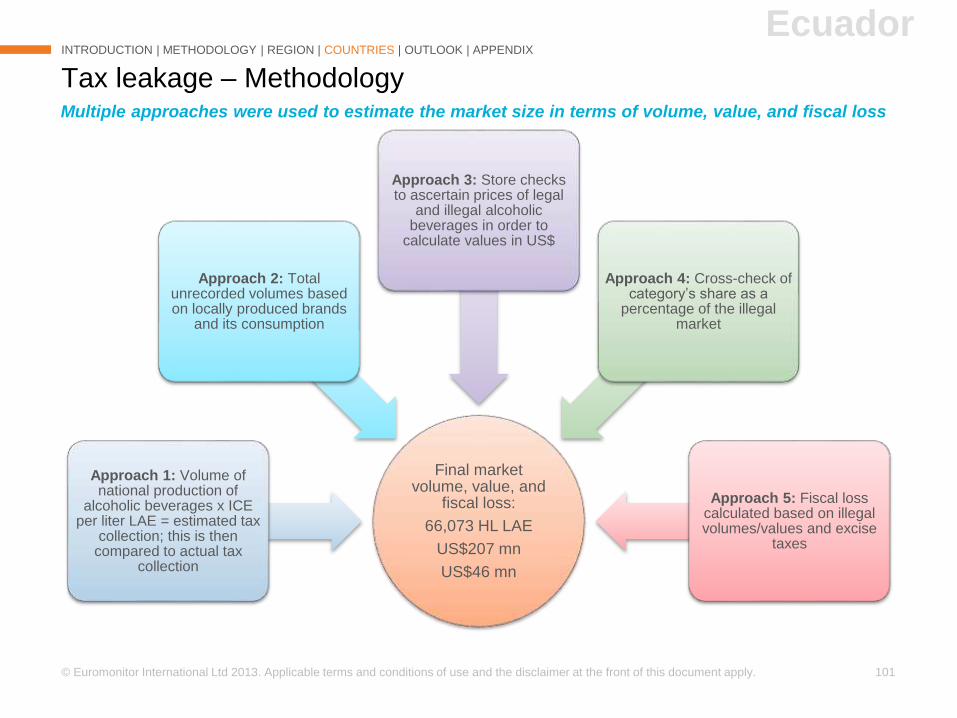
© Euromonitor International Ltd 2013. Applicable terms and conditions of use and the disclaimer at the front of this document apply. 101
Tax leakage – Methodology
INTRODUCTION | METHODOLOGY | REGION | COUNTRIES | OUTLOOK | APPENDIX
Final market volume, value, and
fiscal loss:
66,073 HL LAE
US$207 mn
US$46 mn
Approach 1: Volume of national production of
alcoholic beverages x ICE per liter LAE = estimated tax
collection; this is then compared to actual tax
collection
Approach 2: Total unrecorded volumes based on locally produced brands
and its consumption
Approach 3: Store checks to ascertain prices of legal
and illegal alcoholic beverages in order to
calculate values in US$
Approach 4: Cross-check of category’s share as a
percentage of the illegal market
Approach 5: Fiscal loss calculated based on illegal volumes/values and excise
taxes
Multiple approaches were used to estimate the market size in terms of volume, value, and fiscal loss
Ecuador
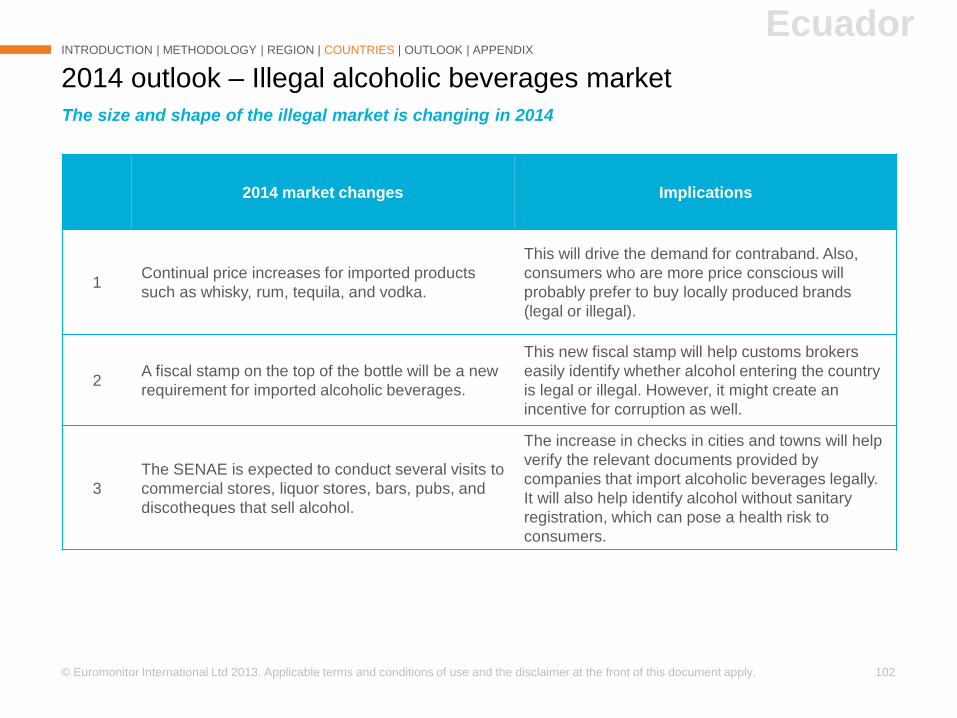
© Euromonitor International Ltd 2013. Applicable terms and conditions of use and the disclaimer at the front of this document apply. 102
2014 outlook – Illegal alcoholic beverages market
INTRODUCTION | METHODOLOGY | REGION | COUNTRIES | OUTLOOK | APPENDIX
2014 market changes Implications
1Continual price increases for imported products
such as whisky, rum, tequila, and vodka.
This will drive the demand for contraband. Also,
consumers who are more price conscious will
probably prefer to buy locally produced brands
(legal or illegal).
2A fiscal stamp on the top of the bottle will be a new
requirement for imported alcoholic beverages.
This new fiscal stamp will help customs brokers
easily identify whether alcohol entering the country
is legal or illegal. However, it might create an
incentive for corruption as well.
3
The SENAE is expected to conduct several visits to
commercial stores, liquor stores, bars, pubs, and
discotheques that sell alcohol.
The increase in checks in cities and towns will help
verify the relevant documents provided by
companies that import alcoholic beverages legally.
It will also help identify alcohol without sanitary
registration, which can pose a health risk to
consumers.
The size and shape of the illegal market is changing in 2014
Ecuador
INTRODUCTION
METHODOLOGY
ANALYSIS - REGION
ANALYSIS – COUNTRIES
2014 OUTLOOK
APPENDIX
►►El Salvador
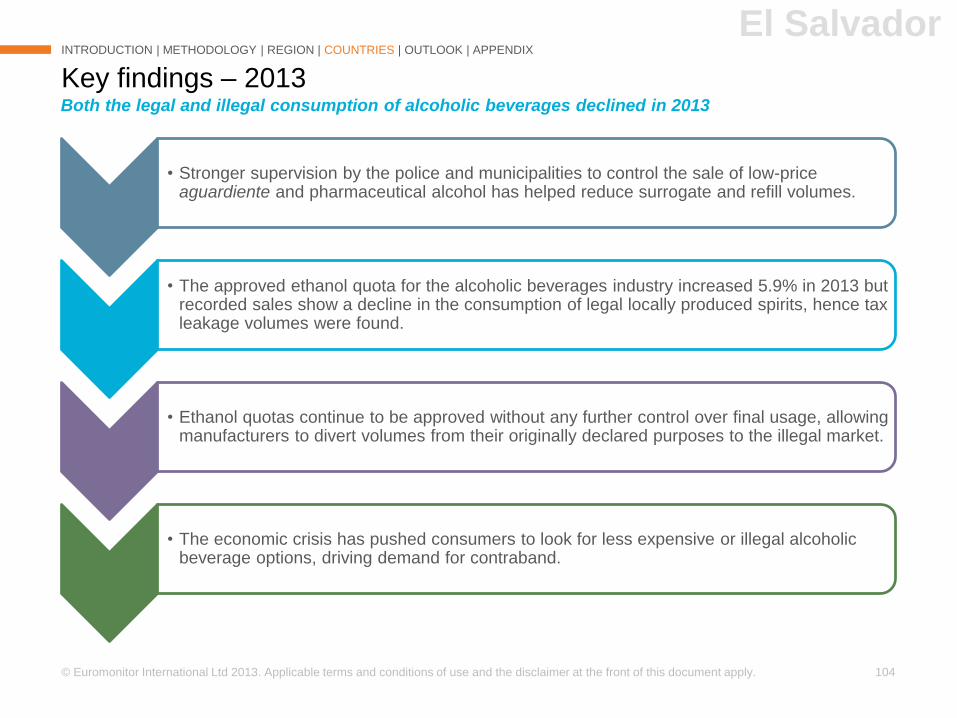
© Euromonitor International Ltd 2013. Applicable terms and conditions of use and the disclaimer at the front of this document apply. 104
• Stronger supervision by the police and municipalities to control the sale of low-price aguardiente and pharmaceutical alcohol has helped reduce surrogate and refill volumes.
• The approved ethanol quota for the alcoholic beverages industry increased 5.9% in 2013 but recorded sales show a decline in the consumption of legal locally produced spirits, hence tax leakage volumes were found.
• Ethanol quotas continue to be approved without any further control over final usage, allowing manufacturers to divert volumes from their originally declared purposes to the illegal market.
• The economic crisis has pushed consumers to look for less expensive or illegal alcoholic beverage options, driving demand for contraband.
Key findings – 2013
INTRODUCTION | METHODOLOGY | REGION | COUNTRIES | OUTLOOK | APPENDIX
Both the legal and illegal consumption of alcoholic beverages declined in 2013
El Salvador
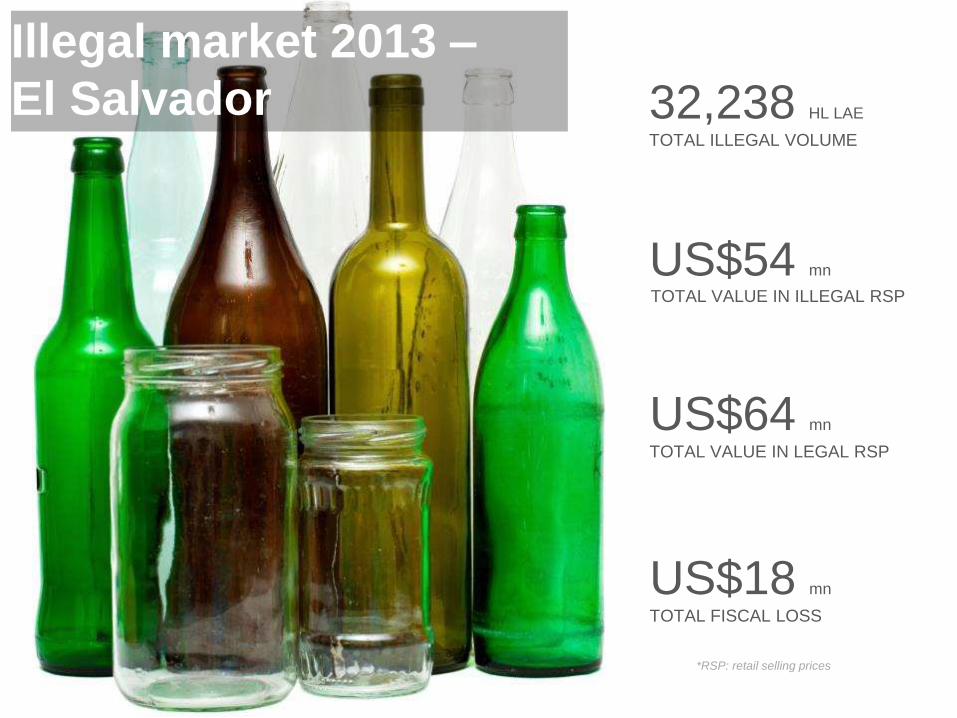
32,238 HL LAE
TOTAL ILLEGAL VOLUME
Illegal market 2013 –
El Salvador
US$54 mn
TOTAL VALUE IN ILLEGAL RSP
US$18 mn
TOTAL FISCAL LOSS
US$64 mn
TOTAL VALUE IN LEGAL RSP
*RSP: retail selling prices
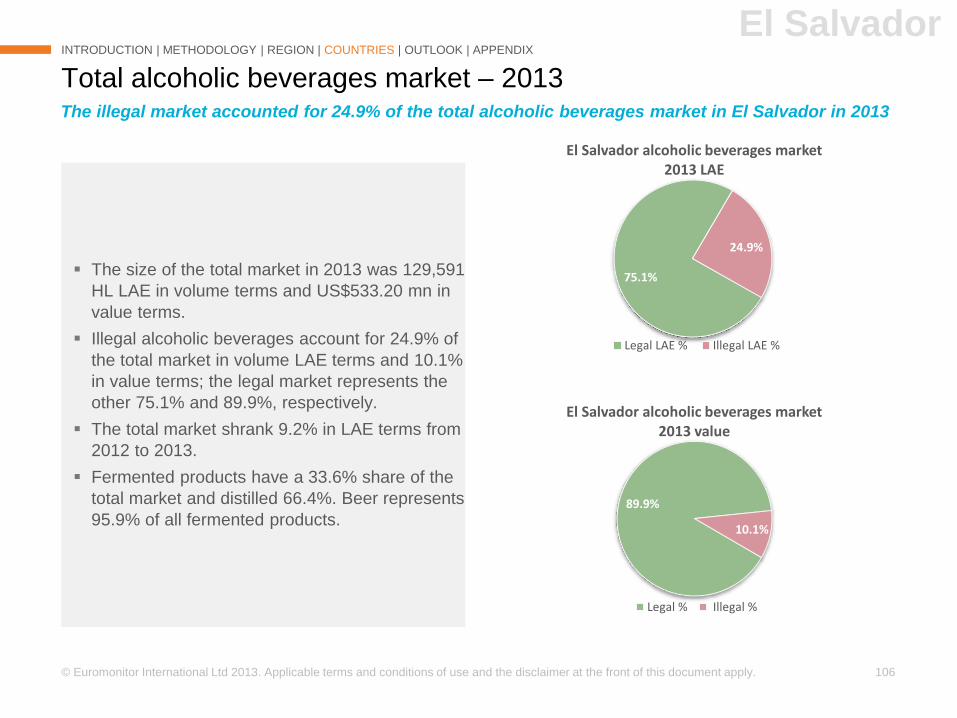
© Euromonitor International Ltd 2013. Applicable terms and conditions of use and the disclaimer at the front of this document apply. 106
Total alcoholic beverages market – 2013
INTRODUCTION | METHODOLOGY | REGION | COUNTRIES | OUTLOOK | APPENDIX
The illegal market accounted for 24.9% of the total alcoholic beverages market in El Salvador in 2013
El Salvador
The size of the total market in 2013 was 129,591
HL LAE in volume terms and US$533.20 mn in
value terms.
Illegal alcoholic beverages account for 24.9% of
the total market in volume LAE terms and 10.1%
in value terms; the legal market represents the
other 75.1% and 89.9%, respectively.
The total market shrank 9.2% in LAE terms from
2012 to 2013.
Fermented products have a 33.6% share of the
total market and distilled 66.4%. Beer represents
95.9% of all fermented products.
75.1%
24.9%
El Salvador alcoholic beverages market 2013 LAE
Legal LAE % Illegal LAE %
89.9%
10.1%
El Salvador alcoholic beverages market 2013 value
Legal % Illegal %
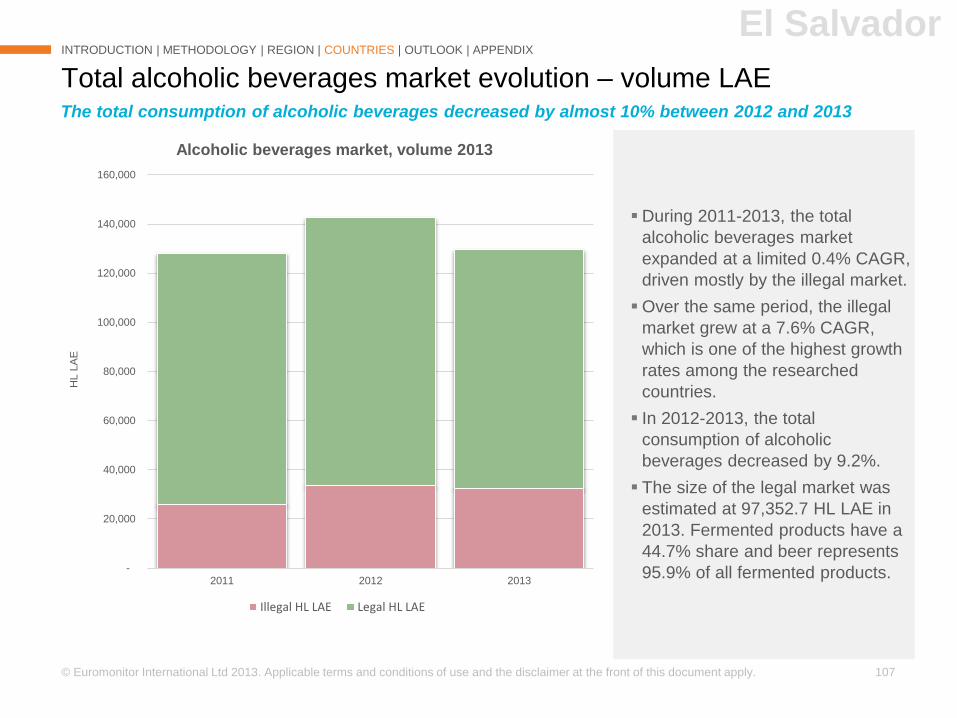
© Euromonitor International Ltd 2013. Applicable terms and conditions of use and the disclaimer at the front of this document apply. 107
During 2011-2013, the total
alcoholic beverages market
expanded at a limited 0.4% CAGR,
driven mostly by the illegal market.
Over the same period, the illegal
market grew at a 7.6% CAGR,
which is one of the highest growth
rates among the researched
countries.
In 2012-2013, the total
consumption of alcoholic
beverages decreased by 9.2%.
The size of the legal market was
estimated at 97,352.7 HL LAE in
2013. Fermented products have a
44.7% share and beer represents
95.9% of all fermented products.
Total alcoholic beverages market evolution – volume LAE
INTRODUCTION | METHODOLOGY | REGION | COUNTRIES | OUTLOOK | APPENDIX
El Salvador
The total consumption of alcoholic beverages decreased by almost 10% between 2012 and 2013
-
20,000
40,000
60,000
80,000
100,000
120,000
140,000
160,000
2011 2012 2013
HL L
AE
Alcoholic beverages market, volume 2013
Illegal HL LAE Legal HL LAE
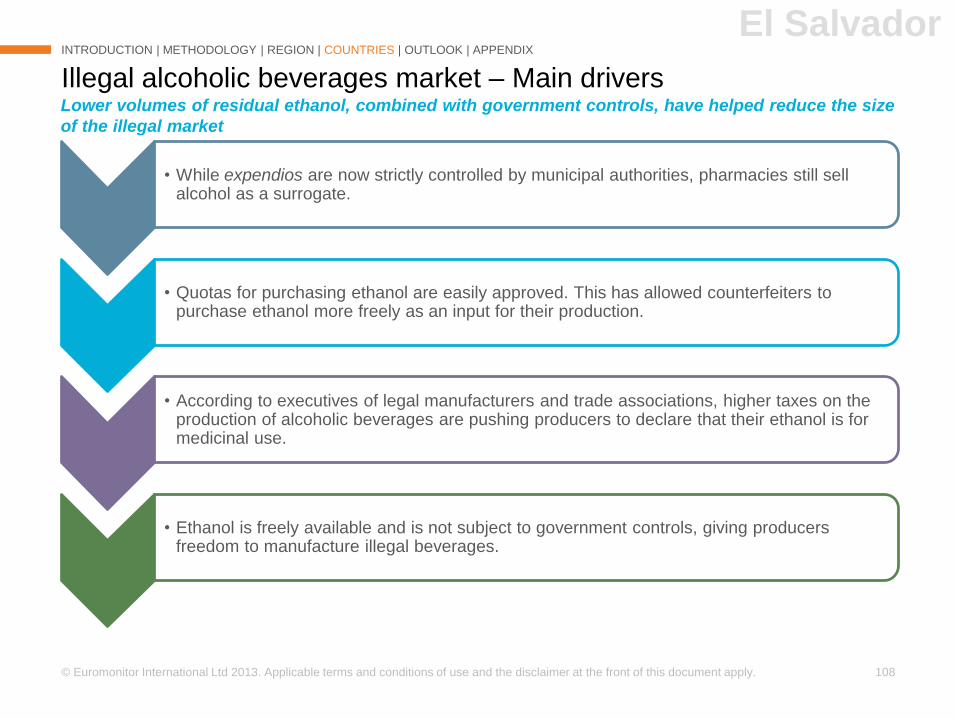
© Euromonitor International Ltd 2013. Applicable terms and conditions of use and the disclaimer at the front of this document apply. 108
Illegal alcoholic beverages market – Main drivers
INTRODUCTION | METHODOLOGY | REGION | COUNTRIES | OUTLOOK | APPENDIX
• While expendios are now strictly controlled by municipal authorities, pharmacies still sell alcohol as a surrogate.
• Quotas for purchasing ethanol are easily approved. This has allowed counterfeiters to purchase ethanol more freely as an input for their production.
• According to executives of legal manufacturers and trade associations, higher taxes on the production of alcoholic beverages are pushing producers to declare that their ethanol is for medicinal use.
• Ethanol is freely available and is not subject to government controls, giving producers freedom to manufacture illegal beverages.
Lower volumes of residual ethanol, combined with government controls, have helped reduce the size
of the illegal market
El Salvador
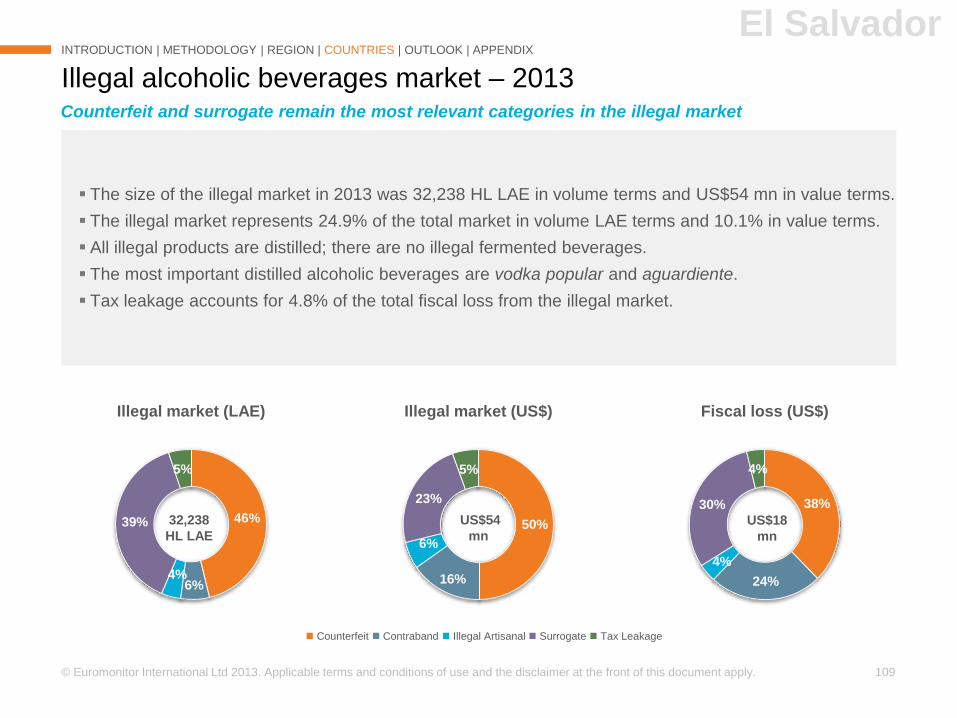
© Euromonitor International Ltd 2013. Applicable terms and conditions of use and the disclaimer at the front of this document apply. 109
38%
24%
4%
30%
4%
Fiscal loss (US$)
50%
16%
6%
23%
5%
Illegal market (US$)
46%
6%4%
39%
5%
Illegal market (LAE)
The size of the illegal market in 2013 was 32,238 HL LAE in volume terms and US$54 mn in value terms.
The illegal market represents 24.9% of the total market in volume LAE terms and 10.1% in value terms.
All illegal products are distilled; there are no illegal fermented beverages.
The most important distilled alcoholic beverages are vodka popular and aguardiente.
Tax leakage accounts for 4.8% of the total fiscal loss from the illegal market.
Illegal alcoholic beverages market – 2013
INTRODUCTION | METHODOLOGY | REGION | COUNTRIES | OUTLOOK | APPENDIX
Counterfeit Contraband Illegal Artisanal Surrogate Tax Leakage
Counterfeit and surrogate remain the most relevant categories in the illegal market
32,238
HL LAE
US$18
mn
El Salvador
US$54
mn
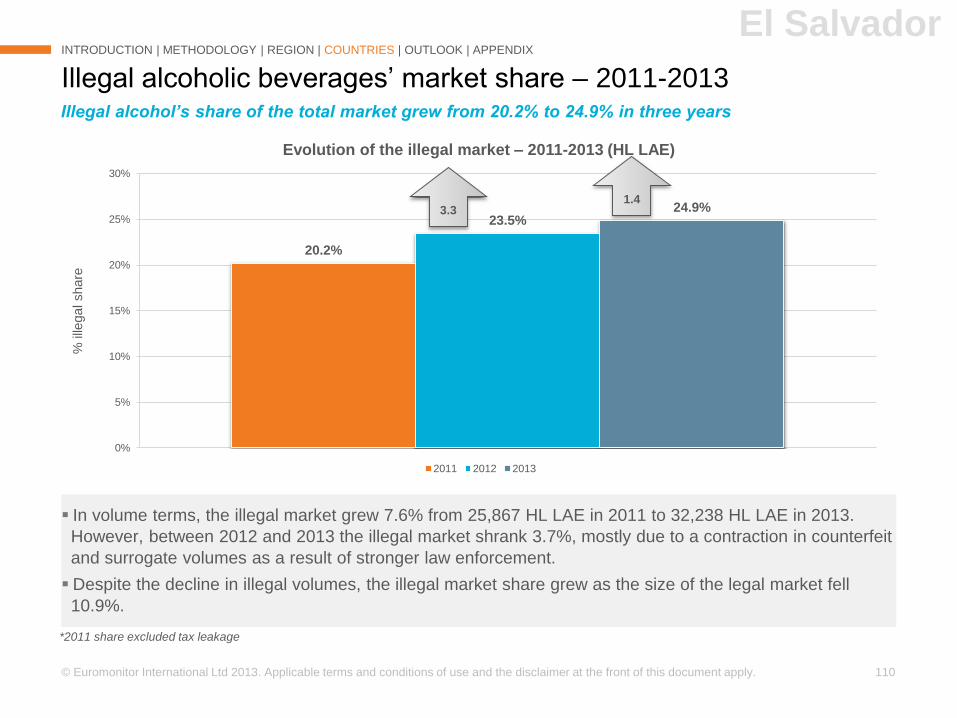
© Euromonitor International Ltd 2013. Applicable terms and conditions of use and the disclaimer at the front of this document apply. 110
20.2%
23.5%24.9%
0%
5%
10%
15%
20%
25%
30%
% ille
gal share
Evolution of the illegal market – 2011-2013 (HL LAE)
2011 2012 2013
In volume terms, the illegal market grew 7.6% from 25,867 HL LAE in 2011 to 32,238 HL LAE in 2013.
However, between 2012 and 2013 the illegal market shrank 3.7%, mostly due to a contraction in counterfeit
and surrogate volumes as a result of stronger law enforcement.
Despite the decline in illegal volumes, the illegal market share grew as the size of the legal market fell
10.9%.
Illegal alcoholic beverages’ market share – 2011-2013
INTRODUCTION | METHODOLOGY | REGION | COUNTRIES | OUTLOOK | APPENDIX
Illegal alcohol’s share of the total market grew from 20.2% to 24.9% in three years
El Salvador
*2011 share excluded tax leakage
3.31.4
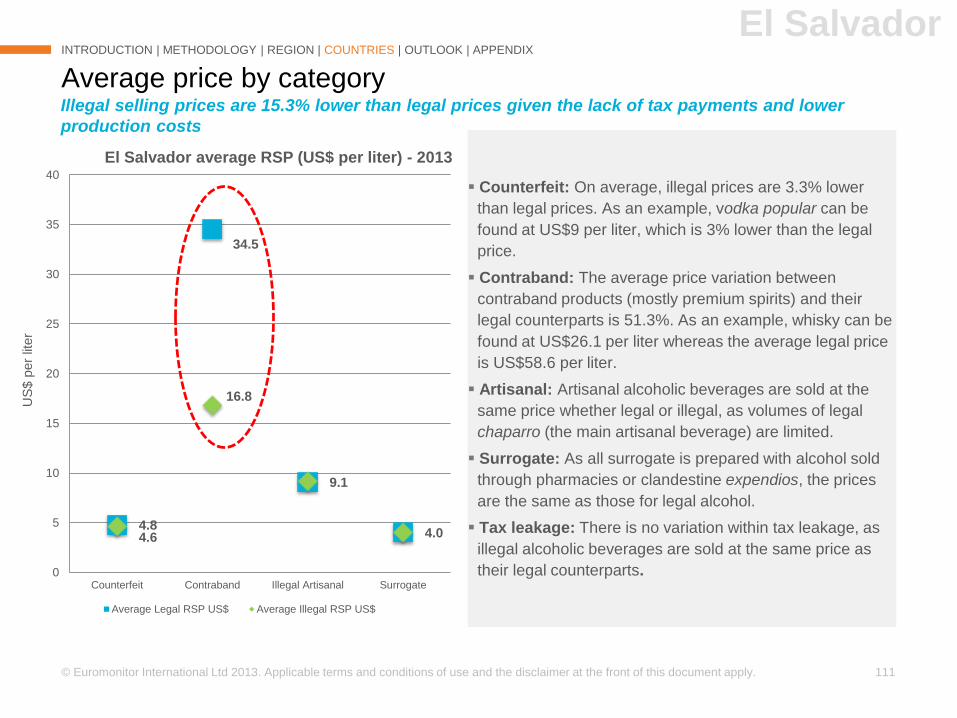
© Euromonitor International Ltd 2013. Applicable terms and conditions of use and the disclaimer at the front of this document apply. 111
4.8
34.5
9.1
4.0 4.6
16.8
0
5
10
15
20
25
30
35
40
Counterfeit Contraband Illegal Artisanal Surrogate
US
$ p
er
liter
El Salvador average RSP (US$ per liter) - 2013
Average Legal RSP US$ Average Illegal RSP US$
Counterfeit: On average, illegal prices are 3.3% lower
than legal prices. As an example, vodka popular can be
found at US$9 per liter, which is 3% lower than the legal
price.
Contraband: The average price variation between
contraband products (mostly premium spirits) and their
legal counterparts is 51.3%. As an example, whisky can be
found at US$26.1 per liter whereas the average legal price
is US$58.6 per liter.
Artisanal: Artisanal alcoholic beverages are sold at the
same price whether legal or illegal, as volumes of legal
chaparro (the main artisanal beverage) are limited.
Surrogate: As all surrogate is prepared with alcohol sold
through pharmacies or clandestine expendios, the prices
are the same as those for legal alcohol.
Tax leakage: There is no variation within tax leakage, as
illegal alcoholic beverages are sold at the same price as
their legal counterparts.
Average price by category
INTRODUCTION | METHODOLOGY | REGION | COUNTRIES | OUTLOOK | APPENDIX
Illegal selling prices are 15.3% lower than legal prices given the lack of tax payments and lower
production costs
El Salvador
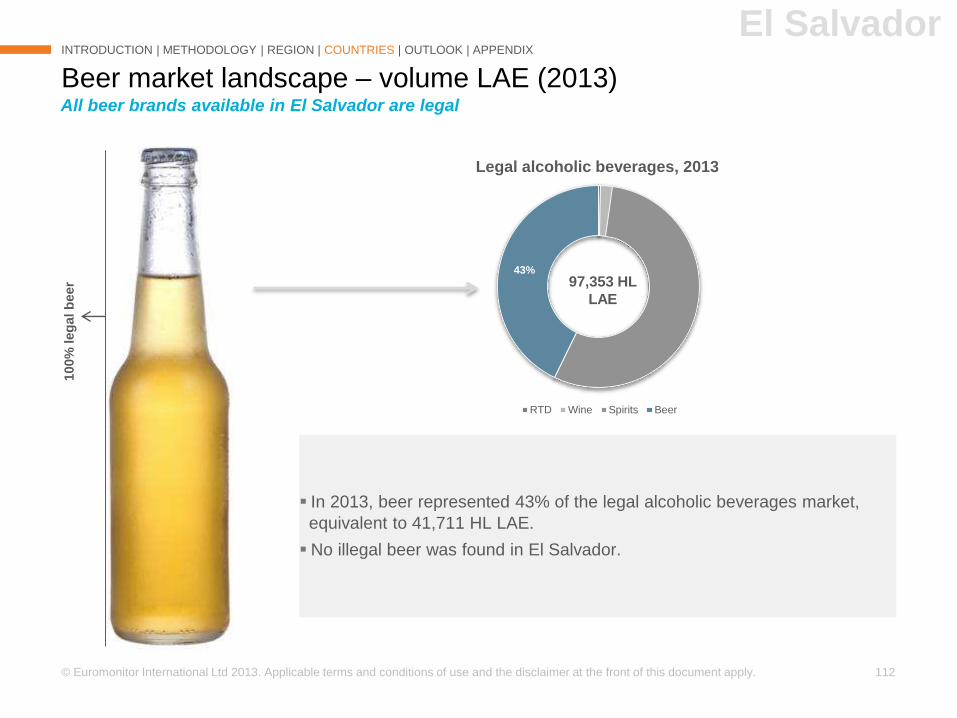
© Euromonitor International Ltd 2013. Applicable terms and conditions of use and the disclaimer at the front of this document apply. 112
43%
Legal alcoholic beverages, 2013
RTD Wine Spirits Beer
Beer market landscape – volume LAE (2013)
INTRODUCTION | METHODOLOGY | REGION | COUNTRIES | OUTLOOK | APPENDIX
All beer brands available in El Salvador are legal
100%
leg
al b
eer
In 2013, beer represented 43% of the legal alcoholic beverages market,
equivalent to 41,711 HL LAE.
No illegal beer was found in El Salvador.
El Salvador
97,353 HL
LAE
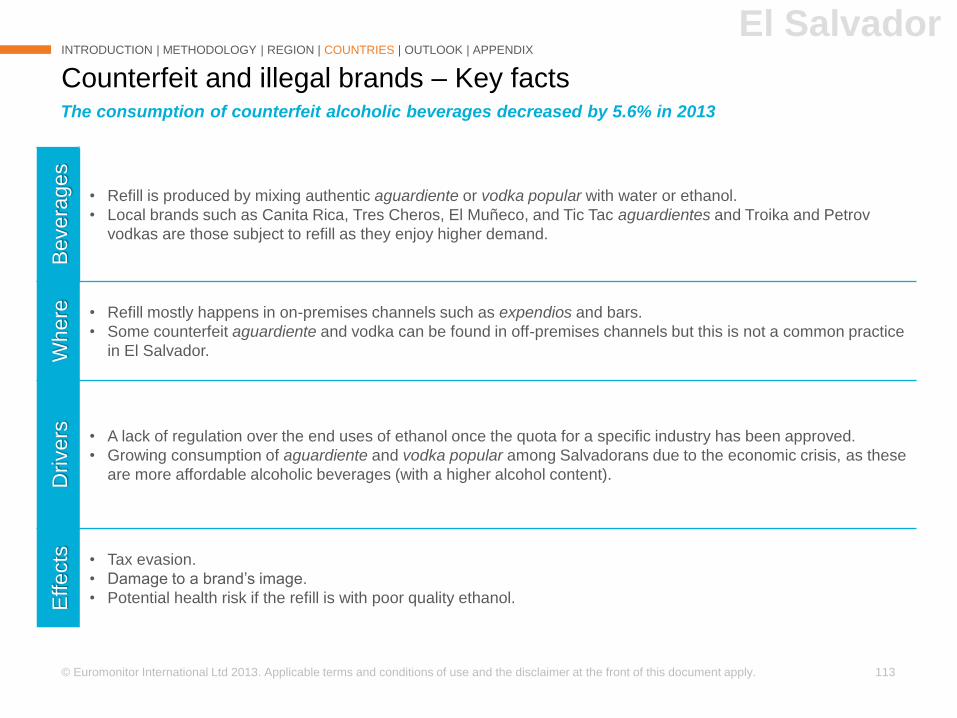
© Euromonitor International Ltd 2013. Applicable terms and conditions of use and the disclaimer at the front of this document apply. 113
Counterfeit and illegal brands – Key facts
INTRODUCTION | METHODOLOGY | REGION | COUNTRIES | OUTLOOK | APPENDIX
The consumption of counterfeit alcoholic beverages decreased by 5.6% in 2013
El SalvadorB
evera
ges
• Refill is produced by mixing authentic aguardiente or vodka popular with water or ethanol.
• Local brands such as Canita Rica, Tres Cheros, El Muñeco, and Tic Tac aguardientes and Troika and Petrov
vodkas are those subject to refill as they enjoy higher demand.
Where • Refill mostly happens in on-premises channels such as expendios and bars.
• Some counterfeit aguardiente and vodka can be found in off-premises channels but this is not a common practice
in El Salvador.
Dri
vers • A lack of regulation over the end uses of ethanol once the quota for a specific industry has been approved.
• Growing consumption of aguardiente and vodka popular among Salvadorans due to the economic crisis, as these
are more affordable alcoholic beverages (with a higher alcohol content).
Effects • Tax evasion.
• Damage to a brand’s image.
• Potential health risk if the refill is with poor quality ethanol.
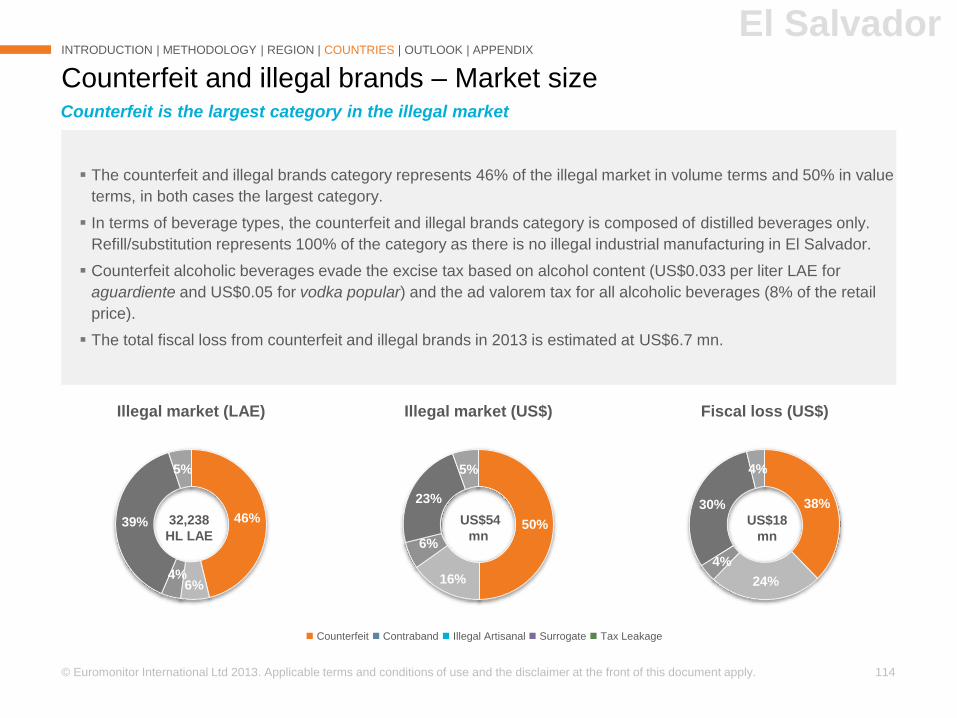
© Euromonitor International Ltd 2013. Applicable terms and conditions of use and the disclaimer at the front of this document apply. 114
The counterfeit and illegal brands category represents 46% of the illegal market in volume terms and 50% in value
terms, in both cases the largest category.
In terms of beverage types, the counterfeit and illegal brands category is composed of distilled beverages only.
Refill/substitution represents 100% of the category as there is no illegal industrial manufacturing in El Salvador.
Counterfeit alcoholic beverages evade the excise tax based on alcohol content (US$0.033 per liter LAE for
aguardiente and US$0.05 for vodka popular) and the ad valorem tax for all alcoholic beverages (8% of the retail
price).
The total fiscal loss from counterfeit and illegal brands in 2013 is estimated at US$6.7 mn.
Counterfeit and illegal brands – Market size
INTRODUCTION | METHODOLOGY | REGION | COUNTRIES | OUTLOOK | APPENDIX
Counterfeit is the largest category in the illegal market
El Salvador
Counterfeit Contraband Illegal Artisanal Surrogate Tax Leakage
38%
24%
4%
30%
4%
Fiscal loss (US$)
50%
16%
6%
23%
5%
Illegal market (US$)
46%
6%4%
39%
5%
Illegal market (LAE)
32,238
HL LAE
US$18
mn
US$54
mn
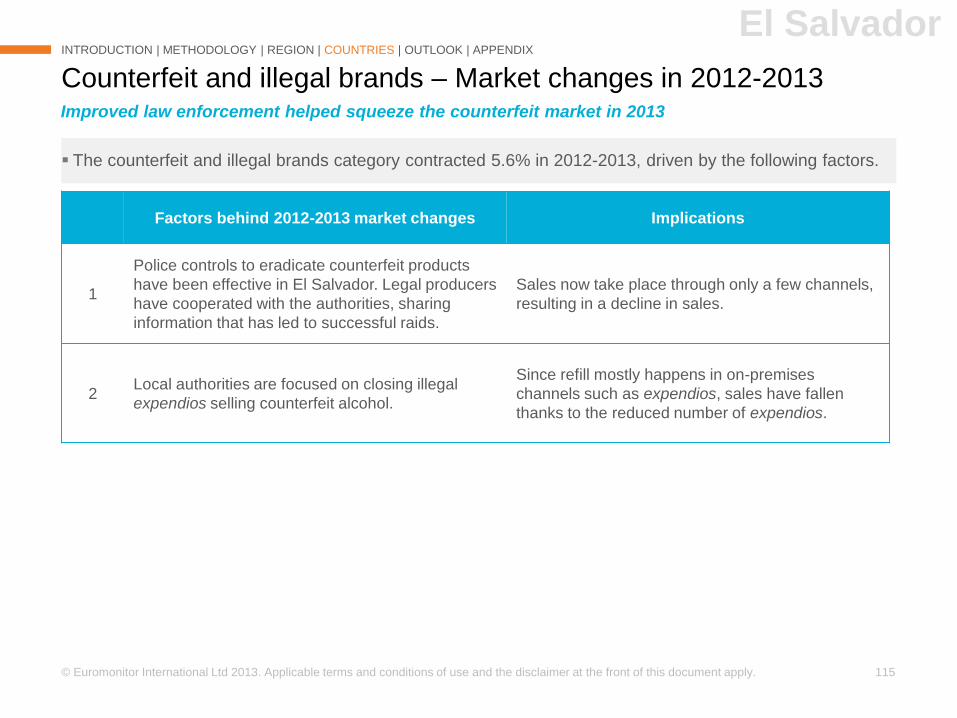
© Euromonitor International Ltd 2013. Applicable terms and conditions of use and the disclaimer at the front of this document apply. 115
The counterfeit and illegal brands category contracted 5.6% in 2012-2013, driven by the following factors.
Counterfeit and illegal brands – Market changes in 2012-2013
INTRODUCTION | METHODOLOGY | REGION | COUNTRIES | OUTLOOK | APPENDIX
Factors behind 2012-2013 market changes Implications
1
Police controls to eradicate counterfeit products
have been effective in El Salvador. Legal producers
have cooperated with the authorities, sharing
information that has led to successful raids.
Sales now take place through only a few channels,
resulting in a decline in sales.
2Local authorities are focused on closing illegal
expendios selling counterfeit alcohol.
Since refill mostly happens in on-premises
channels such as expendios, sales have fallen
thanks to the reduced number of expendios.
Improved law enforcement helped squeeze the counterfeit market in 2013
El Salvador
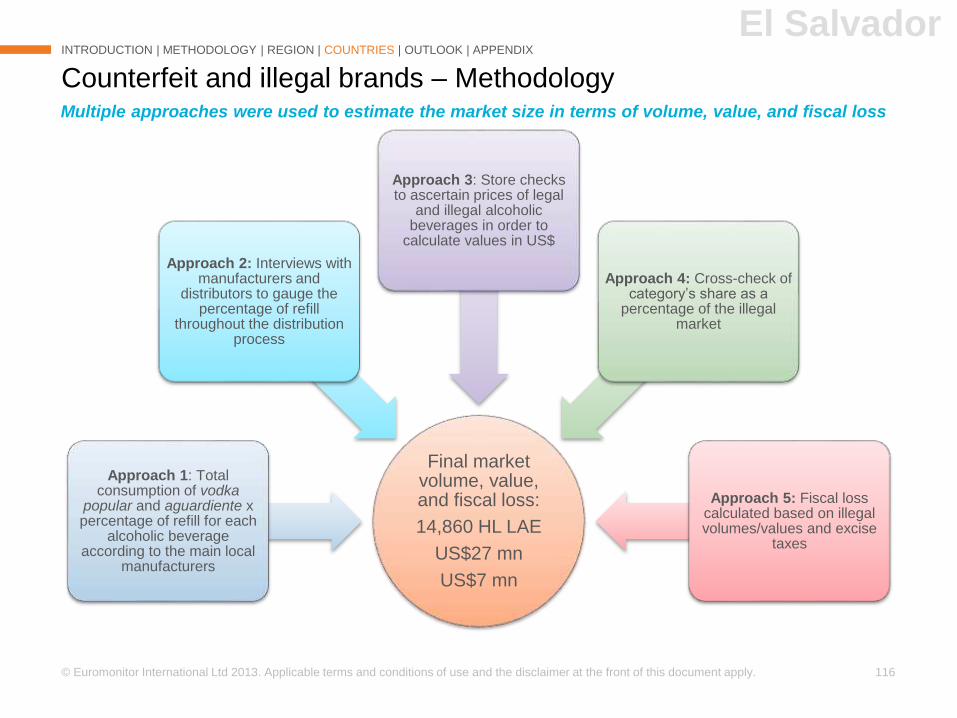
© Euromonitor International Ltd 2013. Applicable terms and conditions of use and the disclaimer at the front of this document apply. 116
Counterfeit and illegal brands – Methodology
INTRODUCTION | METHODOLOGY | REGION | COUNTRIES | OUTLOOK | APPENDIX
Multiple approaches were used to estimate the market size in terms of volume, value, and fiscal loss
El Salvador
Final market volume, value, and fiscal loss:
14,860 HL LAE
US$27 mn
US$7 mn
Approach 1: Total consumption of vodka
popular and aguardiente x percentage of refill for each
alcoholic beverage according to the main local
manufacturers
Approach 2: Interviews with manufacturers and
distributors to gauge the percentage of refill
throughout the distribution process
Approach 3: Store checks to ascertain prices of legal
and illegal alcoholic beverages in order to
calculate values in US$
Approach 4: Cross-check of category’s share as a
percentage of the illegal market
Approach 5: Fiscal loss calculated based on illegal volumes/values and excise
taxes
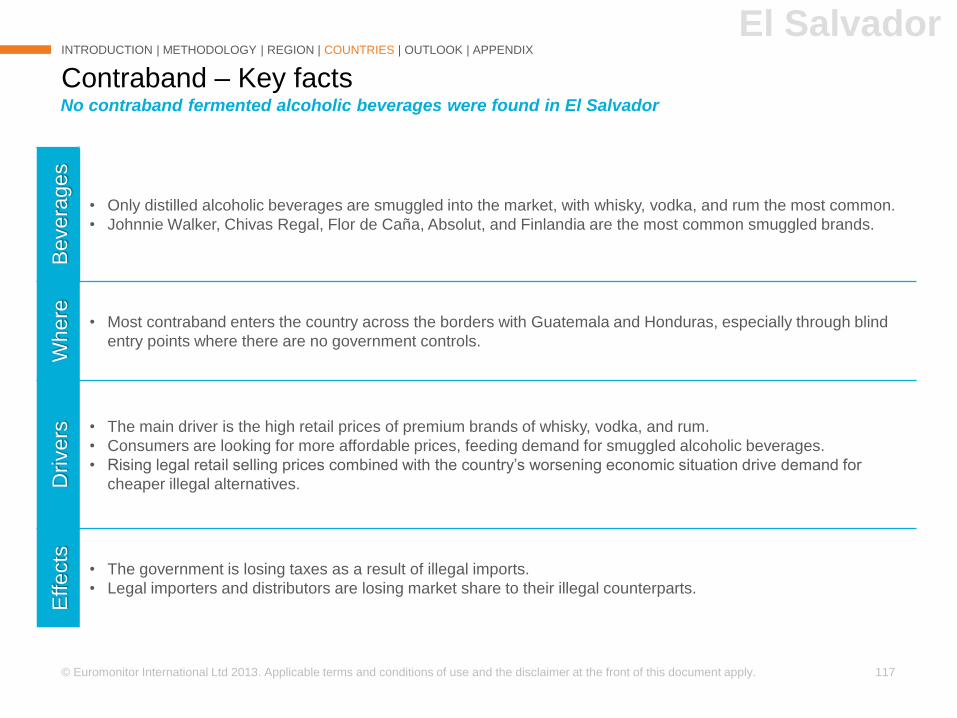
© Euromonitor International Ltd 2013. Applicable terms and conditions of use and the disclaimer at the front of this document apply. 117
Contraband – Key facts
INTRODUCTION | METHODOLOGY | REGION | COUNTRIES | OUTLOOK | APPENDIX
No contraband fermented alcoholic beverages were found in El Salvador
El SalvadorB
evera
ges
• Only distilled alcoholic beverages are smuggled into the market, with whisky, vodka, and rum the most common.
• Johnnie Walker, Chivas Regal, Flor de Caña, Absolut, and Finlandia are the most common smuggled brands.
Where
• Most contraband enters the country across the borders with Guatemala and Honduras, especially through blind
entry points where there are no government controls.
Dri
vers • The main driver is the high retail prices of premium brands of whisky, vodka, and rum.
• Consumers are looking for more affordable prices, feeding demand for smuggled alcoholic beverages.
• Rising legal retail selling prices combined with the country’s worsening economic situation drive demand for
cheaper illegal alternatives.
Effects
• The government is losing taxes as a result of illegal imports.
• Legal importers and distributors are losing market share to their illegal counterparts.
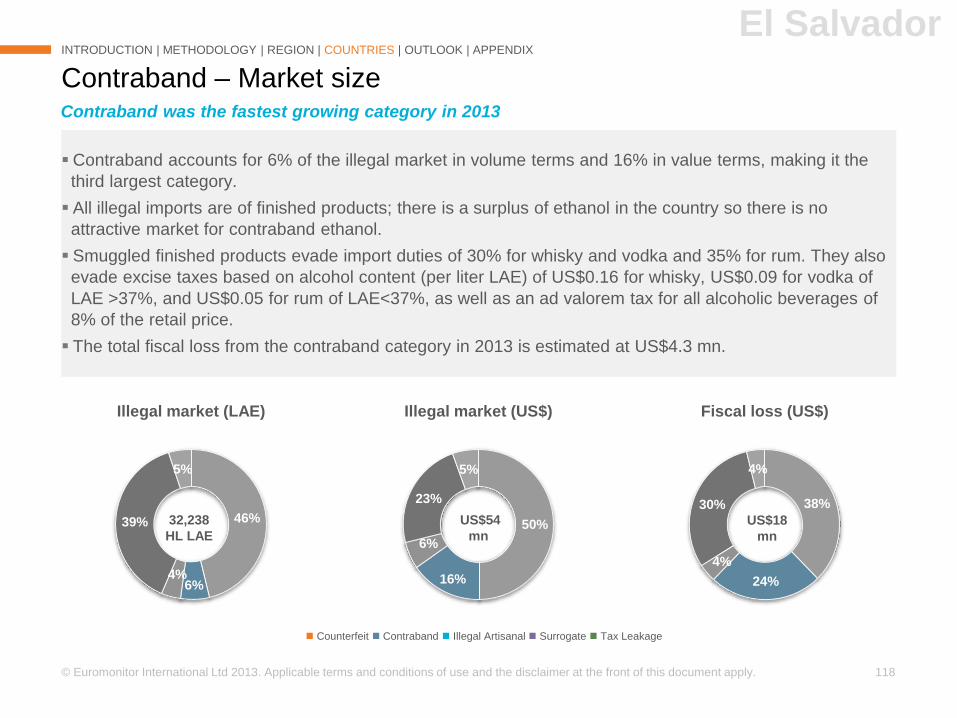
© Euromonitor International Ltd 2013. Applicable terms and conditions of use and the disclaimer at the front of this document apply. 118
Contraband accounts for 6% of the illegal market in volume terms and 16% in value terms, making it the
third largest category.
All illegal imports are of finished products; there is a surplus of ethanol in the country so there is no
attractive market for contraband ethanol.
Smuggled finished products evade import duties of 30% for whisky and vodka and 35% for rum. They also
evade excise taxes based on alcohol content (per liter LAE) of US$0.16 for whisky, US$0.09 for vodka of
LAE >37%, and US$0.05 for rum of LAE<37%, as well as an ad valorem tax for all alcoholic beverages of
8% of the retail price.
The total fiscal loss from the contraband category in 2013 is estimated at US$4.3 mn.
Contraband – Market size
INTRODUCTION | METHODOLOGY | REGION | COUNTRIES | OUTLOOK | APPENDIX
Contraband was the fastest growing category in 2013
El Salvador
Counterfeit Contraband Illegal Artisanal Surrogate Tax Leakage
38%
24%
4%
30%
4%
Fiscal loss (US$)
50%
16%
6%
23%
5%
Illegal market (US$)
46%
6%4%
39%
5%
Illegal market (LAE)
32,238
HL LAE
US$18
mn
US$54
mn
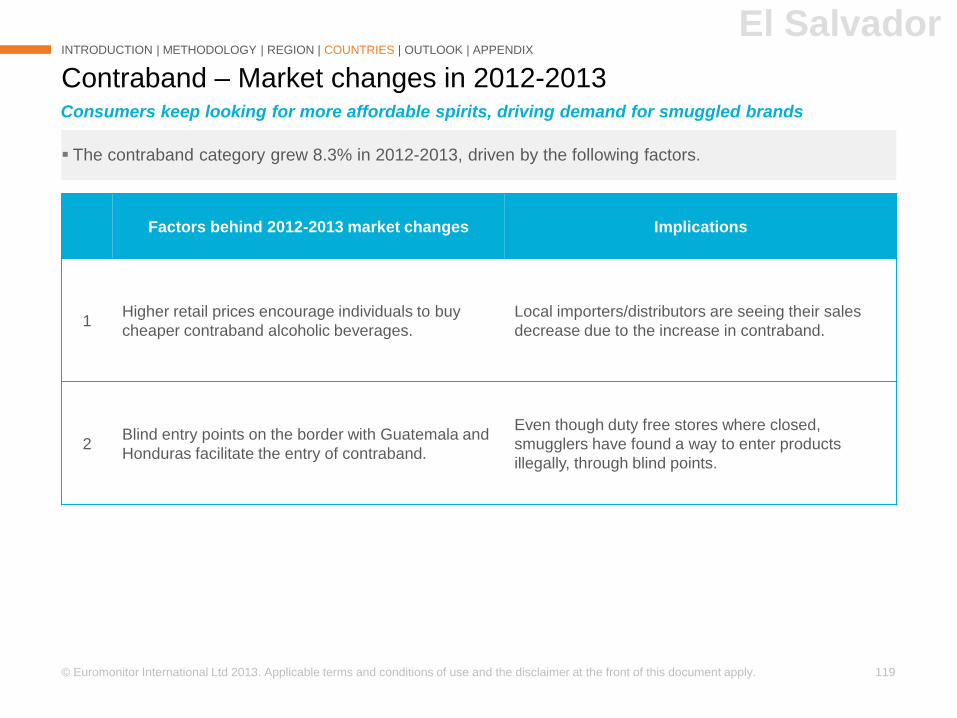
© Euromonitor International Ltd 2013. Applicable terms and conditions of use and the disclaimer at the front of this document apply. 119
The contraband category grew 8.3% in 2012-2013, driven by the following factors.
Contraband – Market changes in 2012-2013
INTRODUCTION | METHODOLOGY | REGION | COUNTRIES | OUTLOOK | APPENDIX
Factors behind 2012-2013 market changes Implications
1Higher retail prices encourage individuals to buy
cheaper contraband alcoholic beverages.
Local importers/distributors are seeing their sales
decrease due to the increase in contraband.
2Blind entry points on the border with Guatemala and
Honduras facilitate the entry of contraband.
Even though duty free stores where closed,
smugglers have found a way to enter products
illegally, through blind points.
Consumers keep looking for more affordable spirits, driving demand for smuggled brands
El Salvador
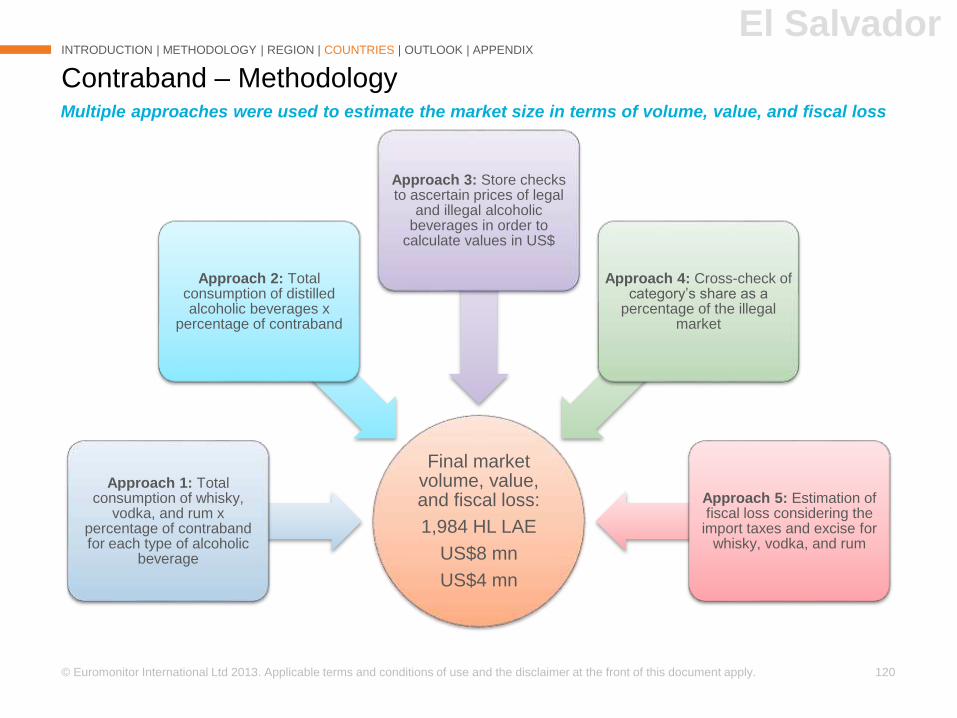
© Euromonitor International Ltd 2013. Applicable terms and conditions of use and the disclaimer at the front of this document apply. 120
Contraband – Methodology
INTRODUCTION | METHODOLOGY | REGION | COUNTRIES | OUTLOOK | APPENDIX
Multiple approaches were used to estimate the market size in terms of volume, value, and fiscal loss
El Salvador
Final market volume, value, and fiscal loss:
1,984 HL LAE
US$8 mn
US$4 mn
Approach 1: Total consumption of whisky,
vodka, and rum x percentage of contraband for each type of alcoholic
beverage
Approach 2: Total consumption of distilled alcoholic beverages x
percentage of contraband
Approach 3: Store checks to ascertain prices of legal
and illegal alcoholic beverages in order to
calculate values in US$
Approach 4: Cross-check of category’s share as a
percentage of the illegal market
Approach 5: Estimation of fiscal loss considering the
import taxes and excise for whisky, vodka, and rum
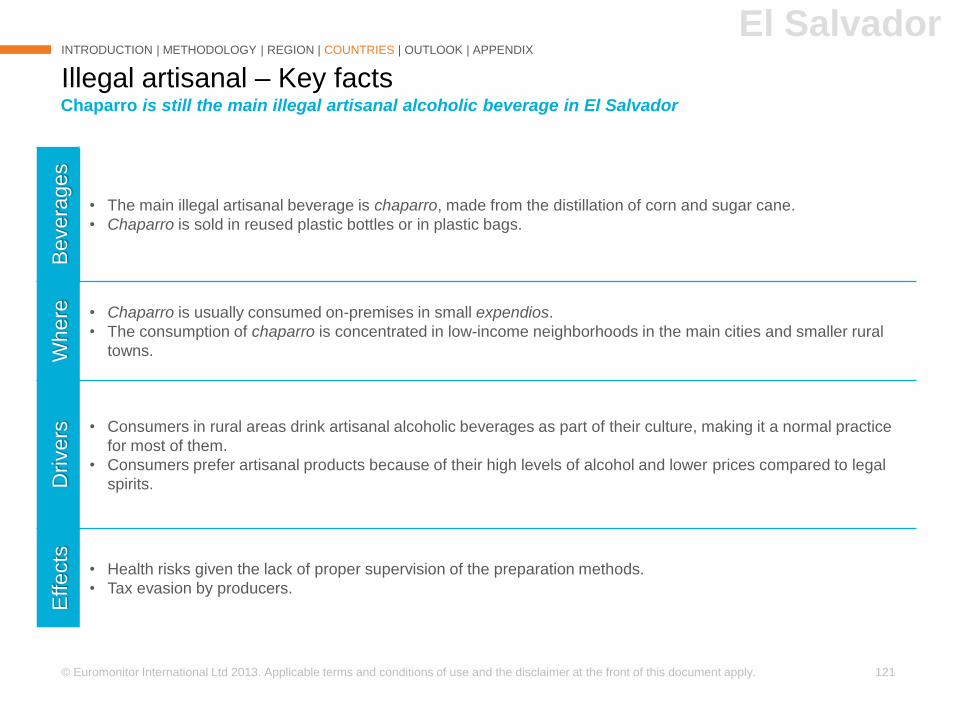
© Euromonitor International Ltd 2013. Applicable terms and conditions of use and the disclaimer at the front of this document apply. 121
Illegal artisanal – Key facts
INTRODUCTION | METHODOLOGY | REGION | COUNTRIES | OUTLOOK | APPENDIX
Chaparro is still the main illegal artisanal alcoholic beverage in El Salvador
El SalvadorB
evera
ges
• The main illegal artisanal beverage is chaparro, made from the distillation of corn and sugar cane.
• Chaparro is sold in reused plastic bottles or in plastic bags.
Where • Chaparro is usually consumed on-premises in small expendios.
• The consumption of chaparro is concentrated in low-income neighborhoods in the main cities and smaller rural
towns.
Dri
vers • Consumers in rural areas drink artisanal alcoholic beverages as part of their culture, making it a normal practice
for most of them.
• Consumers prefer artisanal products because of their high levels of alcohol and lower prices compared to legal
spirits.
Effects
• Health risks given the lack of proper supervision of the preparation methods.
• Tax evasion by producers.
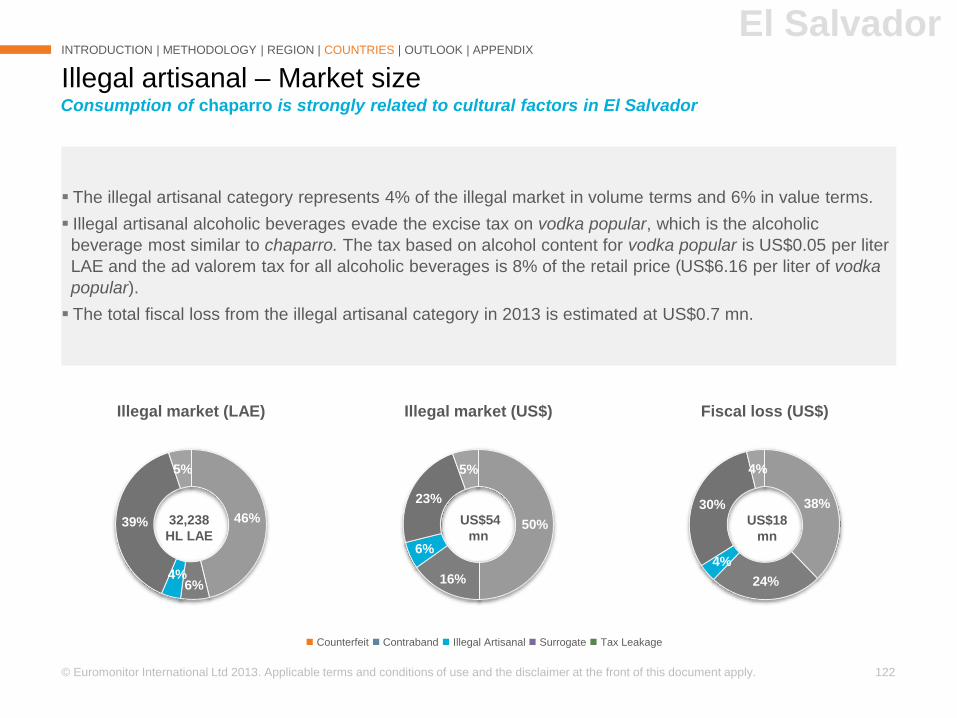
© Euromonitor International Ltd 2013. Applicable terms and conditions of use and the disclaimer at the front of this document apply. 122
The illegal artisanal category represents 4% of the illegal market in volume terms and 6% in value terms.
Illegal artisanal alcoholic beverages evade the excise tax on vodka popular, which is the alcoholic
beverage most similar to chaparro. The tax based on alcohol content for vodka popular is US$0.05 per liter
LAE and the ad valorem tax for all alcoholic beverages is 8% of the retail price (US$6.16 per liter of vodka
popular).
The total fiscal loss from the illegal artisanal category in 2013 is estimated at US$0.7 mn.
Illegal artisanal – Market size
INTRODUCTION | METHODOLOGY | REGION | COUNTRIES | OUTLOOK | APPENDIX
Consumption of chaparro is strongly related to cultural factors in El Salvador
El Salvador
Counterfeit Contraband Illegal Artisanal Surrogate Tax Leakage
38%
24%
4%
30%
4%
Fiscal loss (US$)
50%
16%
6%
23%
5%
Illegal market (US$)
46%
6%4%
39%
5%
Illegal market (LAE)
32,238
HL LAE
US$18
mn
US$54
mn
© Euromonitor International Ltd 2013. Applicable terms and conditions of use and the disclaimer at the front of this document apply. 123
The illegal artisanal category grew 6% in 2012-2013, driven by the following factors.
Illegal artisanal – Market changes in 2012-2013
INTRODUCTION | METHODOLOGY | REGION | COUNTRIES | OUTLOOK | APPENDIX
Factors behind 2012-2013 market changes Implications
1Per capita consumption of chaparro is increasing
due to the higher retail prices of legal aguardiente.
Larger volumes of chaparro were produced to
satisfy low income consumers’ demand for
alcoholic beverages.
2 Larger population within drinking age.Production of chaparro has increased to satisfy
demand.
Growing demand for chaparro as local spirits are becoming more expensive for low income
consumers
El Salvador
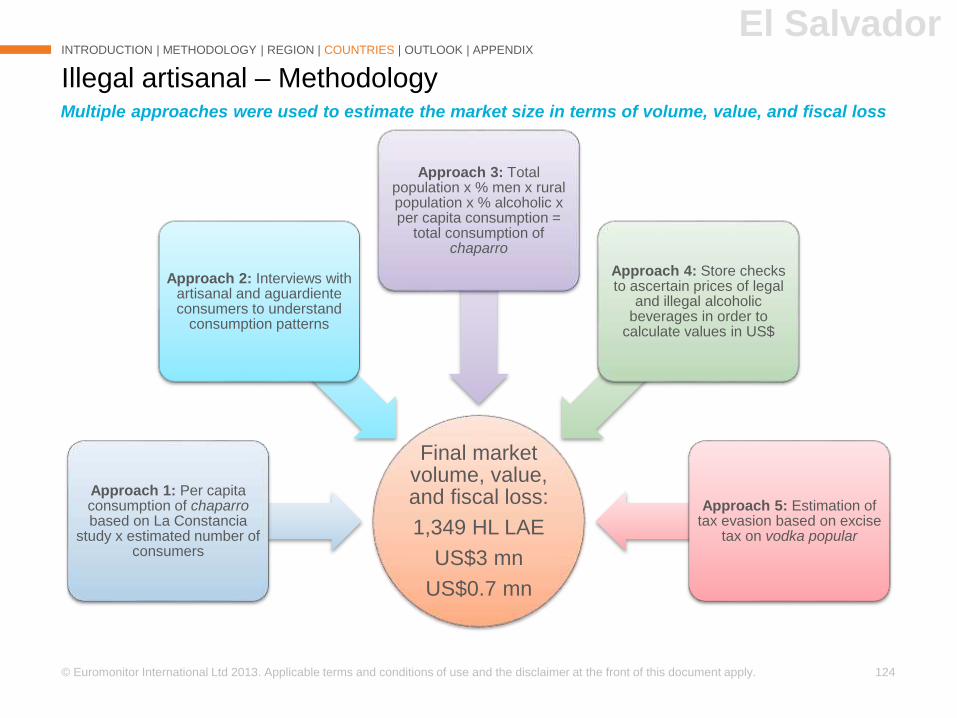
© Euromonitor International Ltd 2013. Applicable terms and conditions of use and the disclaimer at the front of this document apply. 124
Illegal artisanal – Methodology
INTRODUCTION | METHODOLOGY | REGION | COUNTRIES | OUTLOOK | APPENDIX
Multiple approaches were used to estimate the market size in terms of volume, value, and fiscal loss
El Salvador
Final market volume, value, and fiscal loss:
1,349 HL LAE
US$3 mn
US$0.7 mn
Approach 1: Per capita consumption of chaparrobased on La Constancia
study x estimated number of consumers
Approach 2: Interviews with artisanal and aguardiente consumers to understand
consumption patterns
Approach 3: Total population x % men x rural population x % alcoholic x per capita consumption =
total consumption of chaparro
Approach 4: Store checks to ascertain prices of legal
and illegal alcoholic beverages in order to
calculate values in US$
Approach 5: Estimation of tax evasion based on excise
tax on vodka popular
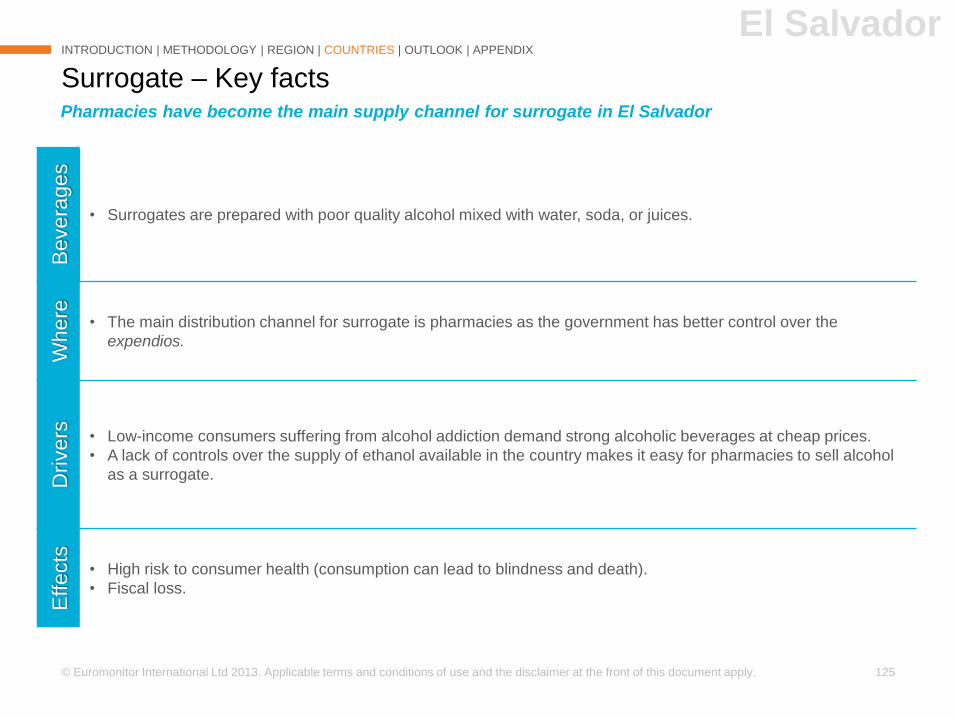
© Euromonitor International Ltd 2013. Applicable terms and conditions of use and the disclaimer at the front of this document apply. 125
Surrogate – Key facts
INTRODUCTION | METHODOLOGY | REGION | COUNTRIES | OUTLOOK | APPENDIX
Pharmacies have become the main supply channel for surrogate in El Salvador
El SalvadorB
evera
ges
• Surrogates are prepared with poor quality alcohol mixed with water, soda, or juices.
Where
• The main distribution channel for surrogate is pharmacies as the government has better control over the
expendios.
Dri
vers • Low-income consumers suffering from alcohol addiction demand strong alcoholic beverages at cheap prices.
• A lack of controls over the supply of ethanol available in the country makes it easy for pharmacies to sell alcohol
as a surrogate.
Effects
• High risk to consumer health (consumption can lead to blindness and death).
• Fiscal loss.
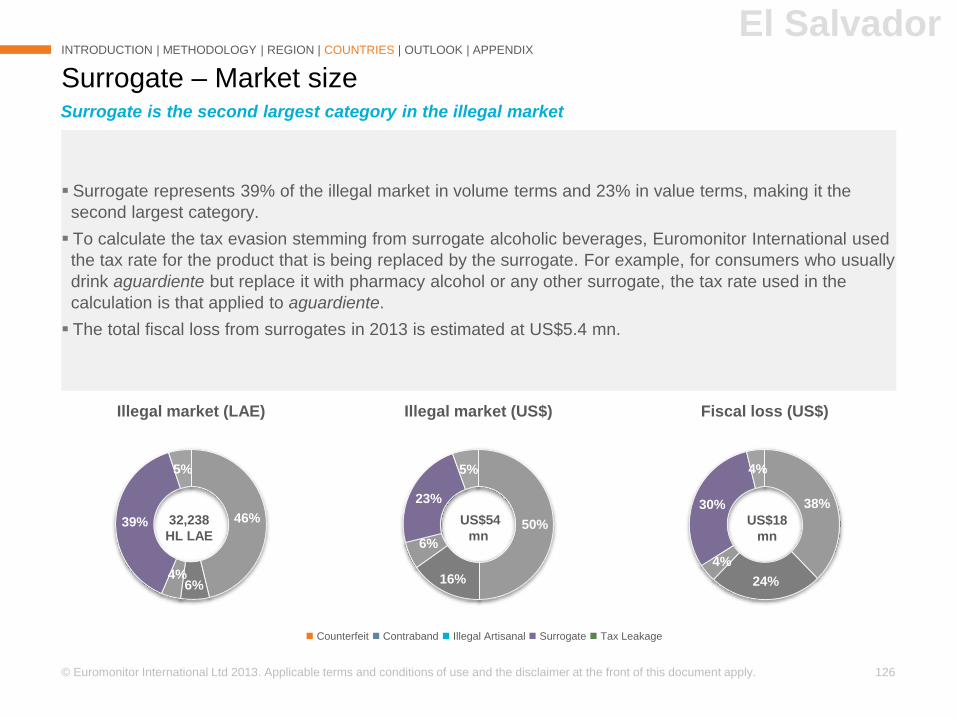
© Euromonitor International Ltd 2013. Applicable terms and conditions of use and the disclaimer at the front of this document apply. 126
Surrogate represents 39% of the illegal market in volume terms and 23% in value terms, making it the
second largest category.
To calculate the tax evasion stemming from surrogate alcoholic beverages, Euromonitor International used
the tax rate for the product that is being replaced by the surrogate. For example, for consumers who usually
drink aguardiente but replace it with pharmacy alcohol or any other surrogate, the tax rate used in the
calculation is that applied to aguardiente.
The total fiscal loss from surrogates in 2013 is estimated at US$5.4 mn.
Surrogate – Market size
INTRODUCTION | METHODOLOGY | REGION | COUNTRIES | OUTLOOK | APPENDIX
Surrogate is the second largest category in the illegal market
El Salvador
Counterfeit Contraband Illegal Artisanal Surrogate Tax Leakage
38%
24%
4%
30%
4%
Fiscal loss (US$)
50%
16%
6%
23%
5%
Illegal market (US$)
46%
6%4%
39%
5%
Illegal market (LAE)
32,238
HL LAE
US$18
mn
US$54
mn
© Euromonitor International Ltd 2013. Applicable terms and conditions of use and the disclaimer at the front of this document apply. 127
The surrogate category shrank 14.5% in 2012-2013, driven by the following factors.
Surrogate – Market changes in 2012-2013
INTRODUCTION | METHODOLOGY | REGION | COUNTRIES | OUTLOOK | APPENDIX
Factors behind 2012-2013 market changes Implications
1
Government control over the ethanol supply chain
and distributors has increased, in cooperation with
the National Civil Police and other agencies.
Decreased supply of alcohol sold through
Pharmacies due to law enforcement.
2
Legal action taken by distilleries against illegal
distribution and supply has been effective in terms
of controlling the supply chain.
Illegal chains of distributors are reducing their offer
due to fear of legal action.
Strong decline in surrogate consumption during 2012-2013 due to improved law enforcement by the
government
El Salvador
© Euromonitor International Ltd 2013. Applicable terms and conditions of use and the disclaimer at the front of this document apply. 128
Surrogate – Methodology
INTRODUCTION | METHODOLOGY | REGION | COUNTRIES | OUTLOOK | APPENDIX
Multiple approaches were used to estimate the market size in terms of volume, value, and fiscal loss
El Salvador
Final market volume, value, and
fiscal loss:
12,511 HL LAE
US$13 mn
US$5 mn
Approach 1: Based on interviews with key players in the industry, surrogate volume
was estimated as a percentage of the legal
consumption of aguardiente
Approach 2: Based on the supply of ethanol outside the
approved quota for the alcoholic beverages industry and the percentage used for
surrogate consumption
Approach 3: Store checks to ascertain prices of legal and illegal alcoholic beverages in order to calculate values in
US$
Approach 4: Fiscal loss calculated by applying the
excise on vodka popular and aguardiente
© Euromonitor International Ltd 2013. Applicable terms and conditions of use and the disclaimer at the front of this document apply. 129
Tax leakage – Key facts
INTRODUCTION | METHODOLOGY | REGION | COUNTRIES | OUTLOOK | APPENDIX
Unrecorded volumes of spirits were found in El Salvador in 2013
El SalvadorB
evera
ges
• All tax leakage volumes are distilled beverages.
• Tax leakage is most common for aguardiente.
Drivers • Weak law enforcement.
• High profit margins due to tax evasion.
• Undeclared products are sold at the same price as their legal counterparts and the difference in costs is
pocketed.
Effects
• Fiscal loss.
• Unfair competition for brands that pay their production taxes.
© Euromonitor International Ltd 2013. Applicable terms and conditions of use and the disclaimer at the front of this document apply. 130
The tax leakage category represents 5% of the illegal market in volume and value terms.
All tax leakage comes from distilled alcoholic beverages.
Alcoholic beverages in this category evade the excise tax for aguardiente (US$0.033 per liter LAE).
The total fiscal loss from this category in 2013 is estimated at US$0.7 mn.
Tax leakage – Market size
INTRODUCTION | METHODOLOGY | REGION | COUNTRIES | OUTLOOK | APPENDIX
El Salvador
Counterfeit Contraband Illegal Artisanal Surrogate Tax Leakage
Unrecorded volumes were found in 2013, in contrast to in previous years
38%
24%
4%
30%
4%
Fiscal loss (US$)
50%
16%
6%
23%
5%
Illegal market (US$)
46%
6%4%
39%
5%
Illegal market (LAE)
32,238
HL LAE
US$18
mn
US$54
mn
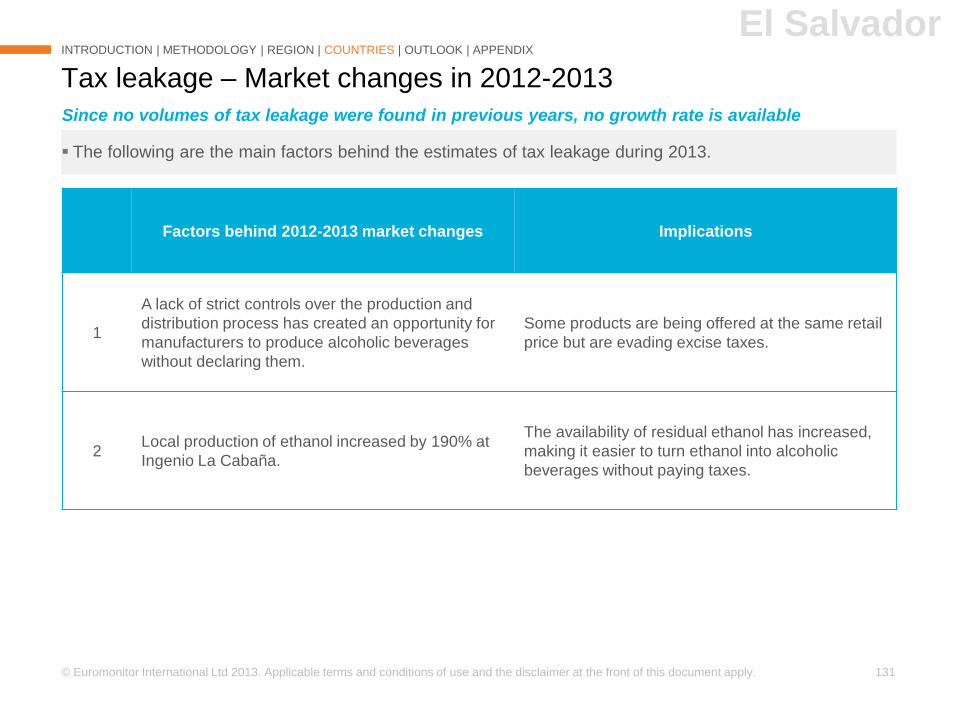
© Euromonitor International Ltd 2013. Applicable terms and conditions of use and the disclaimer at the front of this document apply. 131
The following are the main factors behind the estimates of tax leakage during 2013.
Tax leakage – Market changes in 2012-2013
INTRODUCTION | METHODOLOGY | REGION | COUNTRIES | OUTLOOK | APPENDIX
Factors behind 2012-2013 market changes Implications
1
A lack of strict controls over the production and
distribution process has created an opportunity for
manufacturers to produce alcoholic beverages
without declaring them.
Some products are being offered at the same retail
price but are evading excise taxes.
2Local production of ethanol increased by 190% at
Ingenio La Cabaña.
The availability of residual ethanol has increased,
making it easier to turn ethanol into alcoholic
beverages without paying taxes.
Since no volumes of tax leakage were found in previous years, no growth rate is available
El Salvador
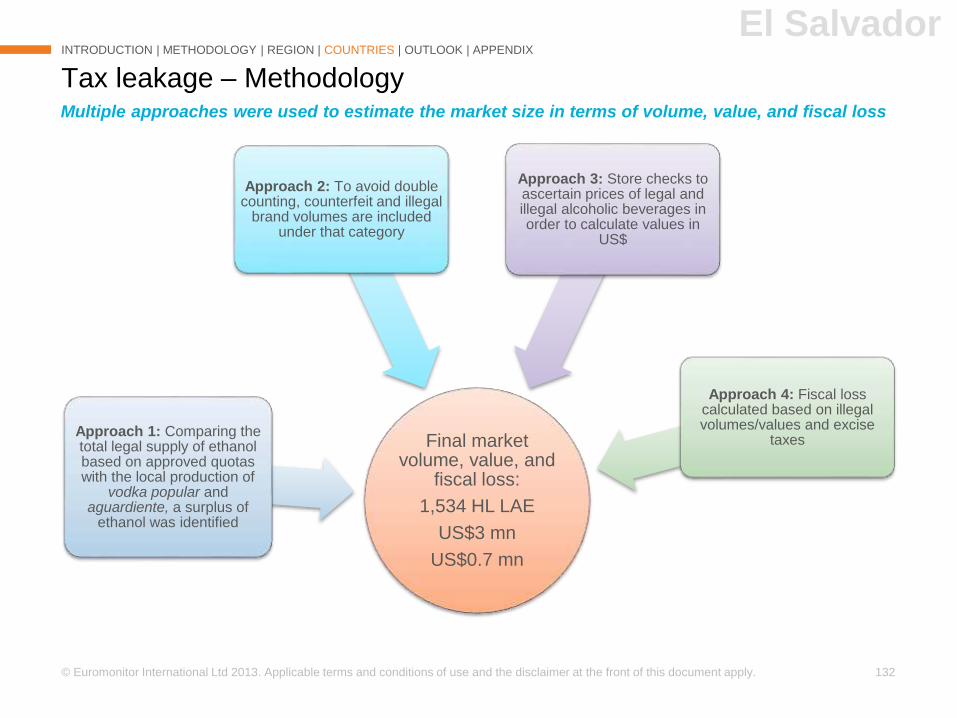
© Euromonitor International Ltd 2013. Applicable terms and conditions of use and the disclaimer at the front of this document apply. 132
Tax leakage – Methodology
INTRODUCTION | METHODOLOGY | REGION | COUNTRIES | OUTLOOK | APPENDIX
Multiple approaches were used to estimate the market size in terms of volume, value, and fiscal loss
El Salvador
Final market volume, value, and
fiscal loss:
1,534 HL LAE
US$3 mn
US$0.7 mn
Approach 1: Comparing the total legal supply of ethanol based on approved quotas with the local production of
vodka popular and aguardiente, a surplus of
ethanol was identified
Approach 2: To avoid double counting, counterfeit and illegal
brand volumes are included under that category
Approach 3: Store checks to ascertain prices of legal and illegal alcoholic beverages in order to calculate values in
US$
Approach 4: Fiscal loss calculated based on illegal volumes/values and excise
taxes
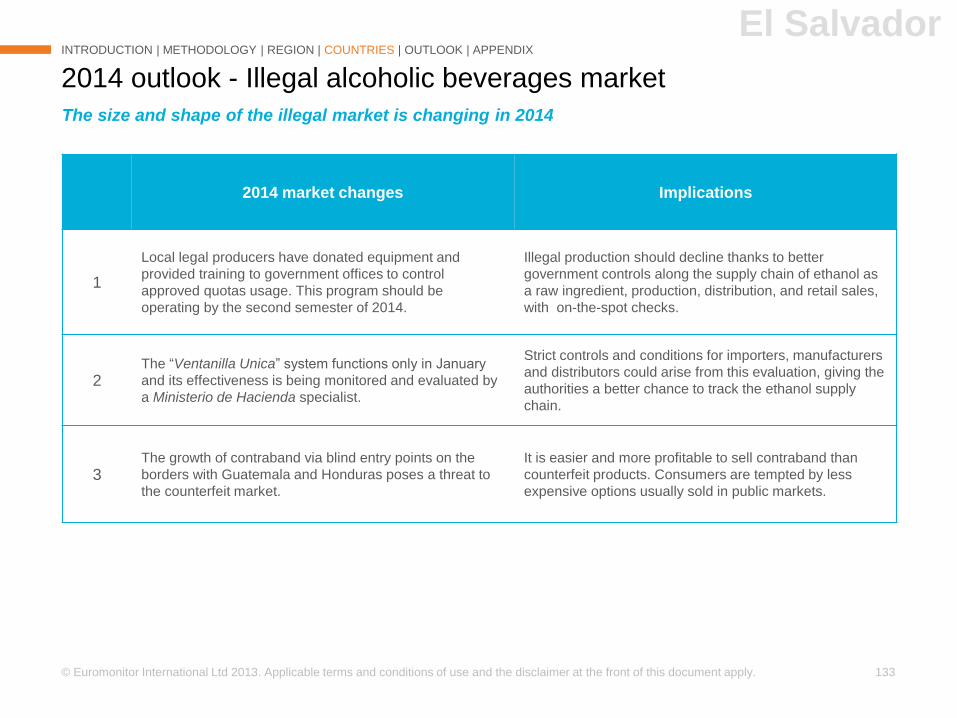
© Euromonitor International Ltd 2013. Applicable terms and conditions of use and the disclaimer at the front of this document apply. 133
2014 outlook - Illegal alcoholic beverages market
INTRODUCTION | METHODOLOGY | REGION | COUNTRIES | OUTLOOK | APPENDIX
2014 market changes Implications
1
Local legal producers have donated equipment and
provided training to government offices to control
approved quotas usage. This program should be
operating by the second semester of 2014.
Illegal production should decline thanks to better
government controls along the supply chain of ethanol as
a raw ingredient, production, distribution, and retail sales,
with on-the-spot checks.
2The “Ventanilla Unica” system functions only in January
and its effectiveness is being monitored and evaluated by
a Ministerio de Hacienda specialist.
Strict controls and conditions for importers, manufacturers
and distributors could arise from this evaluation, giving the
authorities a better chance to track the ethanol supply
chain.
3The growth of contraband via blind entry points on the
borders with Guatemala and Honduras poses a threat to
the counterfeit market.
It is easier and more profitable to sell contraband than
counterfeit products. Consumers are tempted by less
expensive options usually sold in public markets.
The size and shape of the illegal market is changing in 2014
El Salvador

INTRODUCTION
METHODOLOGY
ANALYSIS - REGION
ANALYSIS – COUNTRIES
2014 OUTLOOK
APPENDIX
►►Honduras
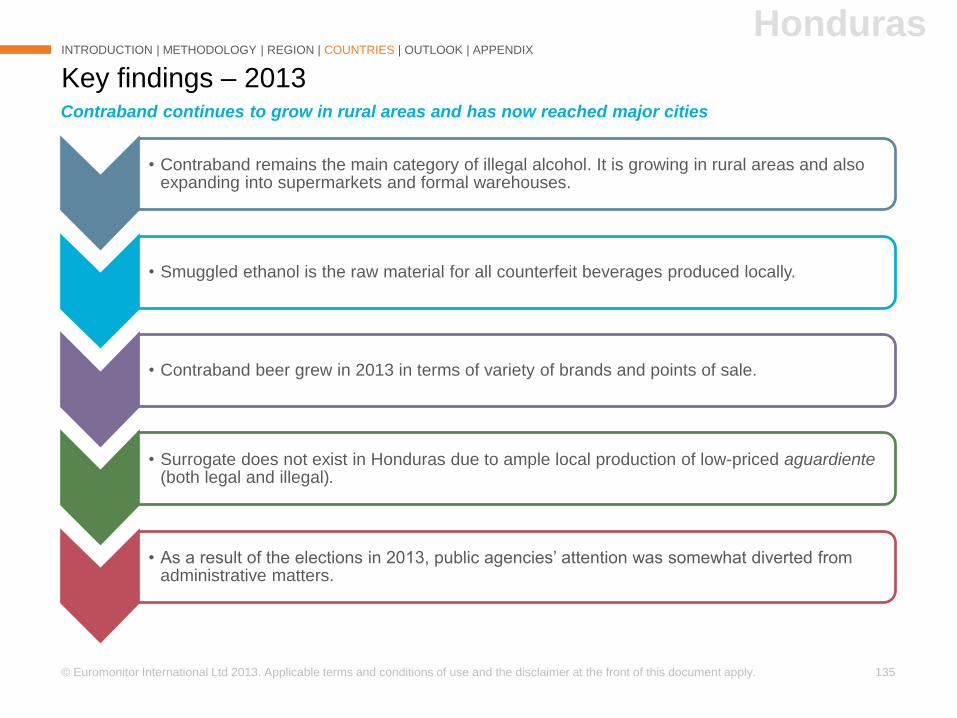
© Euromonitor International Ltd 2013. Applicable terms and conditions of use and the disclaimer at the front of this document apply. 135
• Contraband remains the main category of illegal alcohol. It is growing in rural areas and also expanding into supermarkets and formal warehouses.
• Smuggled ethanol is the raw material for all counterfeit beverages produced locally.
• Contraband beer grew in 2013 in terms of variety of brands and points of sale.
• Surrogate does not exist in Honduras due to ample local production of low-priced aguardiente (both legal and illegal).
• As a result of the elections in 2013, public agencies’ attention was somewhat diverted from administrative matters.
Key findings – 2013
INTRODUCTION | METHODOLOGY | REGION | COUNTRIES | OUTLOOK | APPENDIX
Contraband continues to grow in rural areas and has now reached major cities
Honduras
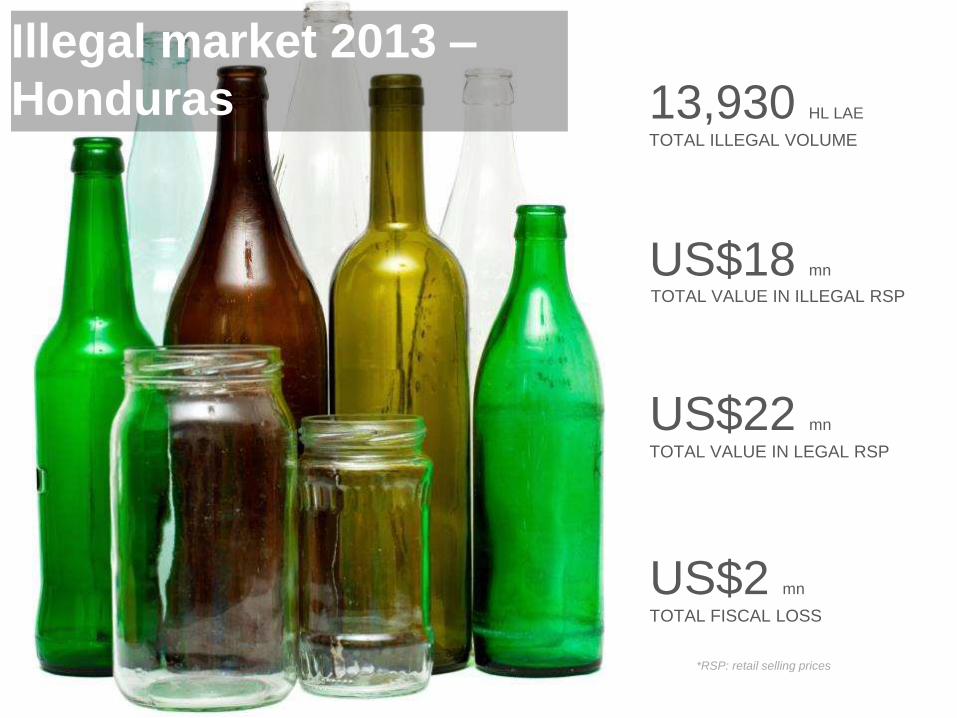
13,930 HL LAE
TOTAL ILLEGAL VOLUME
Illegal market 2013 –
Honduras
US$18 mn
TOTAL VALUE IN ILLEGAL RSP
US$2 mn
TOTAL FISCAL LOSS
US$22 mn
TOTAL VALUE IN LEGAL RSP
*RSP: retail selling prices
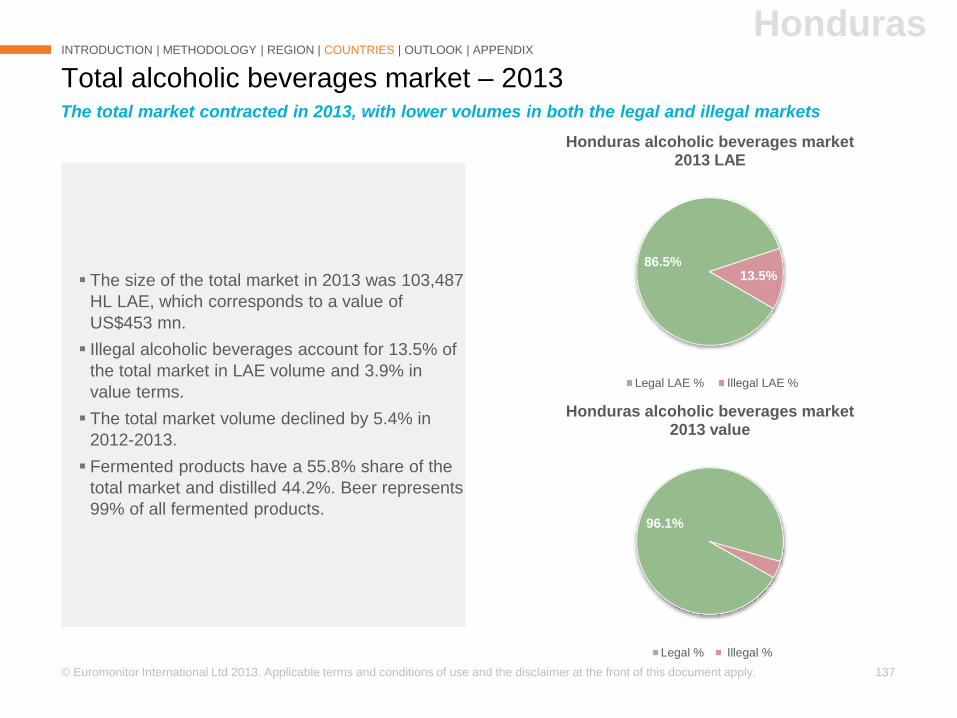
© Euromonitor International Ltd 2013. Applicable terms and conditions of use and the disclaimer at the front of this document apply. 137
Total alcoholic beverages market – 2013
INTRODUCTION | METHODOLOGY | REGION | COUNTRIES | OUTLOOK | APPENDIX
The total market contracted in 2013, with lower volumes in both the legal and illegal markets
Honduras
The size of the total market in 2013 was 103,487
HL LAE, which corresponds to a value of
US$453 mn.
Illegal alcoholic beverages account for 13.5% of
the total market in LAE volume and 3.9% in
value terms.
The total market volume declined by 5.4% in
2012-2013.
Fermented products have a 55.8% share of the
total market and distilled 44.2%. Beer represents
99% of all fermented products.
86.5%13.5%
Honduras alcoholic beverages market 2013 LAE
Legal LAE % Illegal LAE %
96.1%
3.9%
Honduras alcoholic beverages market 2013 value
Legal % Illegal %
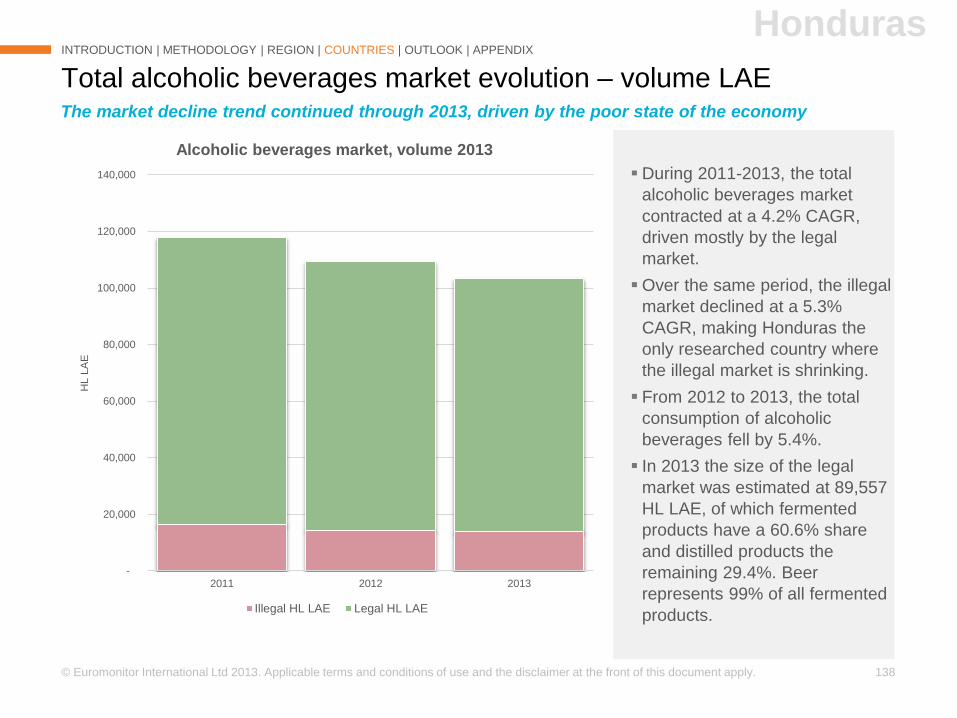
© Euromonitor International Ltd 2013. Applicable terms and conditions of use and the disclaimer at the front of this document apply. 138
During 2011-2013, the total
alcoholic beverages market
contracted at a 4.2% CAGR,
driven mostly by the legal
market.
Over the same period, the illegal
market declined at a 5.3%
CAGR, making Honduras the
only researched country where
the illegal market is shrinking.
From 2012 to 2013, the total
consumption of alcoholic
beverages fell by 5.4%.
In 2013 the size of the legal
market was estimated at 89,557
HL LAE, of which fermented
products have a 60.6% share
and distilled products the
remaining 29.4%. Beer
represents 99% of all fermented
products.
Total alcoholic beverages market evolution – volume LAE
INTRODUCTION | METHODOLOGY | REGION | COUNTRIES | OUTLOOK | APPENDIX
Honduras
The market decline trend continued through 2013, driven by the poor state of the economy
-
20,000
40,000
60,000
80,000
100,000
120,000
140,000
2011 2012 2013
HL L
AE
Alcoholic beverages market, volume 2013
Illegal HL LAE Legal HL LAE
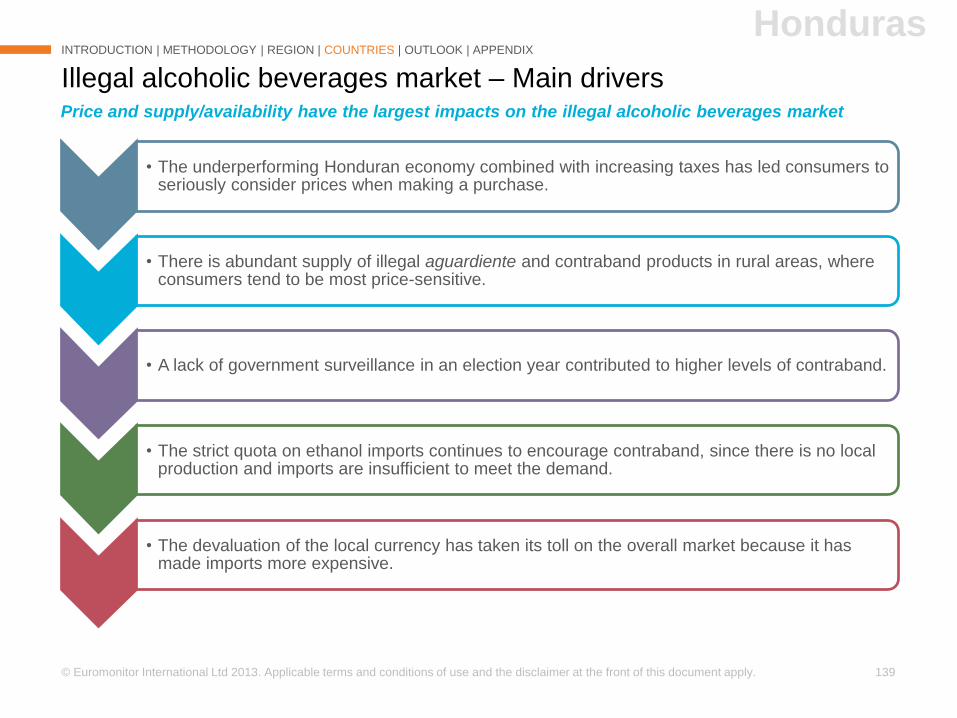
© Euromonitor International Ltd 2013. Applicable terms and conditions of use and the disclaimer at the front of this document apply. 139
Illegal alcoholic beverages market – Main drivers
INTRODUCTION | METHODOLOGY | REGION | COUNTRIES | OUTLOOK | APPENDIX
• The underperforming Honduran economy combined with increasing taxes has led consumers to seriously consider prices when making a purchase.
• There is abundant supply of illegal aguardiente and contraband products in rural areas, where consumers tend to be most price-sensitive.
• A lack of government surveillance in an election year contributed to higher levels of contraband.
• The strict quota on ethanol imports continues to encourage contraband, since there is no local production and imports are insufficient to meet the demand.
• The devaluation of the local currency has taken its toll on the overall market because it has made imports more expensive.
Price and supply/availability have the largest impacts on the illegal alcoholic beverages market
Honduras
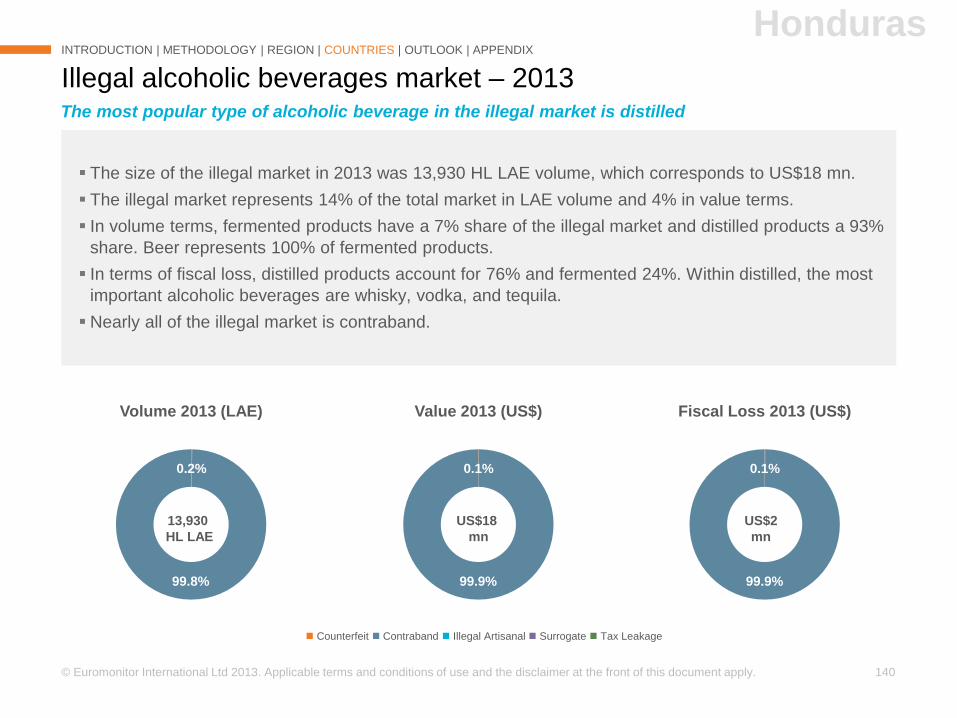
© Euromonitor International Ltd 2013. Applicable terms and conditions of use and the disclaimer at the front of this document apply. 140
0.1%
99.9%
Fiscal Loss 2013 (US$)
0.1%
99.9%
Value 2013 (US$)
0.2%
99.8%
Volume 2013 (LAE)
The size of the illegal market in 2013 was 13,930 HL LAE volume, which corresponds to US$18 mn.
The illegal market represents 14% of the total market in LAE volume and 4% in value terms.
In volume terms, fermented products have a 7% share of the illegal market and distilled products a 93%
share. Beer represents 100% of fermented products.
In terms of fiscal loss, distilled products account for 76% and fermented 24%. Within distilled, the most
important alcoholic beverages are whisky, vodka, and tequila.
Nearly all of the illegal market is contraband.
Illegal alcoholic beverages market – 2013
INTRODUCTION | METHODOLOGY | REGION | COUNTRIES | OUTLOOK | APPENDIX
Counterfeit Contraband Illegal Artisanal Surrogate Tax Leakage
The most popular type of alcoholic beverage in the illegal market is distilled
Honduras
13,930
HL LAE
US$18
mn
US$2
mn
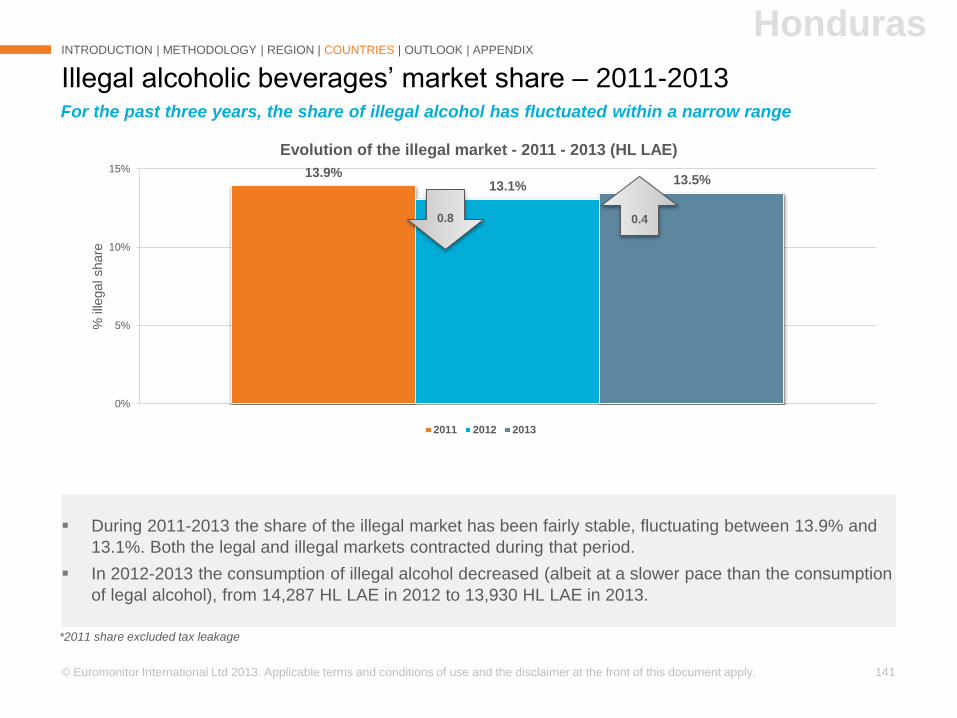
© Euromonitor International Ltd 2013. Applicable terms and conditions of use and the disclaimer at the front of this document apply. 141
13.9%13.1%
13.5%
0%
5%
10%
15%
% ille
gal share
Evolution of the illegal market - 2011 - 2013 (HL LAE)
2011 2012 2013
During 2011-2013 the share of the illegal market has been fairly stable, fluctuating between 13.9% and
13.1%. Both the legal and illegal markets contracted during that period.
In 2012-2013 the consumption of illegal alcohol decreased (albeit at a slower pace than the consumption
of legal alcohol), from 14,287 HL LAE in 2012 to 13,930 HL LAE in 2013.
Illegal alcoholic beverages’ market share – 2011-2013
INTRODUCTION | METHODOLOGY | REGION | COUNTRIES | OUTLOOK | APPENDIX
For the past three years, the share of illegal alcohol has fluctuated within a narrow range
Honduras
*2011 share excluded tax leakage
0.8 0.4
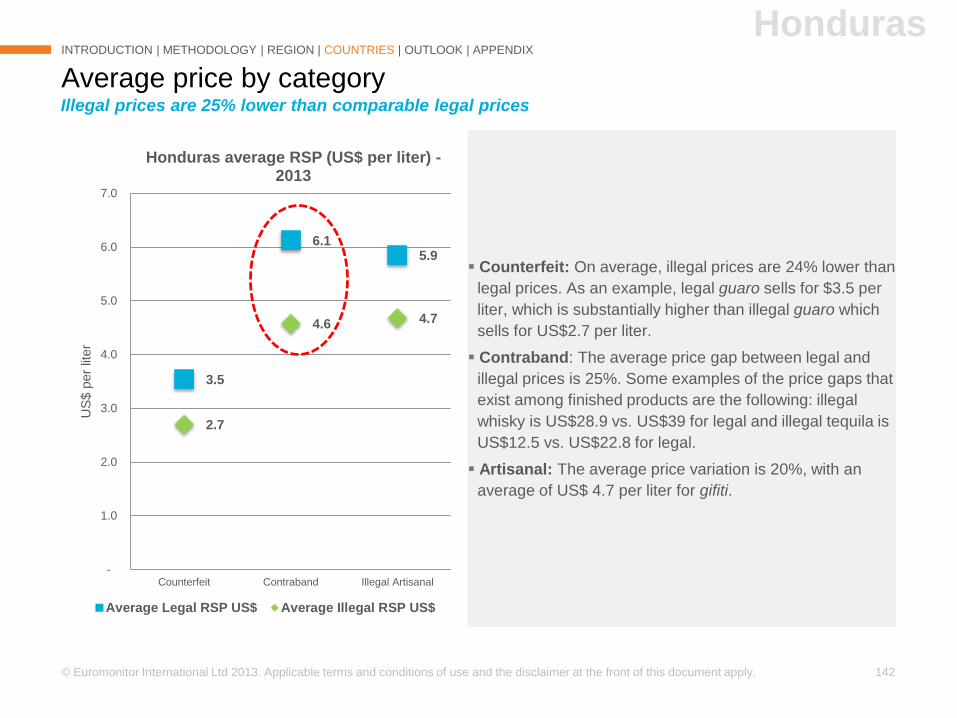
© Euromonitor International Ltd 2013. Applicable terms and conditions of use and the disclaimer at the front of this document apply. 142
Counterfeit: On average, illegal prices are 24% lower than
legal prices. As an example, legal guaro sells for $3.5 per
liter, which is substantially higher than illegal guaro which
sells for US$2.7 per liter.
Contraband: The average price gap between legal and
illegal prices is 25%. Some examples of the price gaps that
exist among finished products are the following: illegal
whisky is US$28.9 vs. US$39 for legal and illegal tequila is
US$12.5 vs. US$22.8 for legal.
Artisanal: The average price variation is 20%, with an
average of US$ 4.7 per liter for gifiti.
Average price by category
INTRODUCTION | METHODOLOGY | REGION | COUNTRIES | OUTLOOK | APPENDIX
Illegal prices are 25% lower than comparable legal prices
Honduras
3.5
6.1 5.9
2.7
4.6 4.7
-
1.0
2.0
3.0
4.0
5.0
6.0
7.0
Counterfeit Contraband Illegal Artisanal
US
$ p
er
liter
Honduras average RSP (US$ per liter) -2013
Average Legal RSP US$ Average Illegal RSP US$
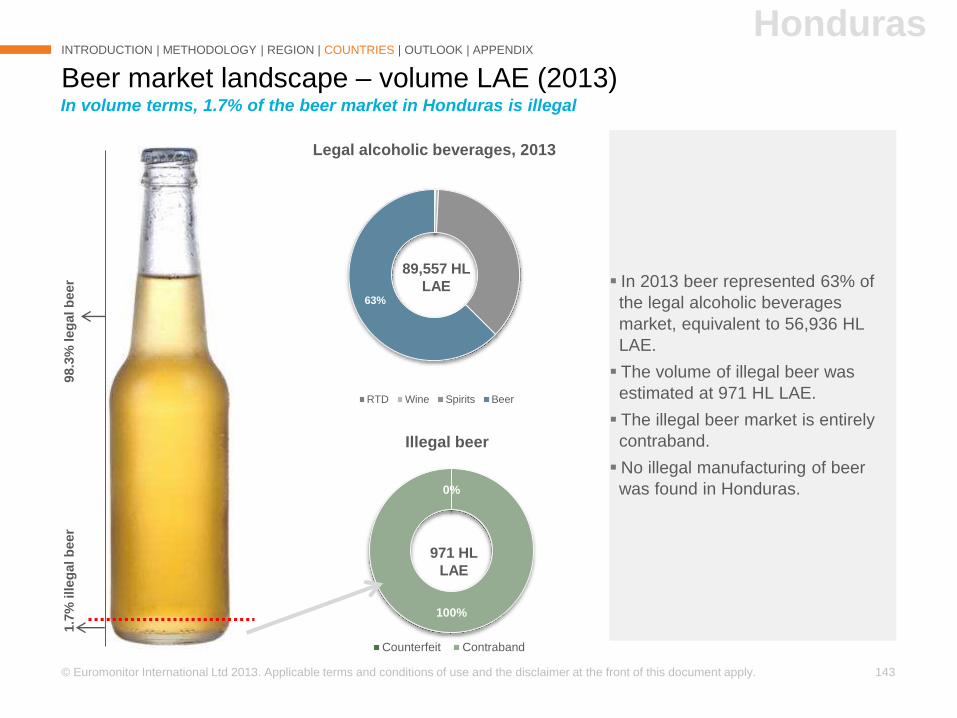
© Euromonitor International Ltd 2013. Applicable terms and conditions of use and the disclaimer at the front of this document apply. 143
63%
Legal alcoholic beverages, 2013
RTD Wine Spirits Beer
0%
100%
Illegal beer
Counterfeit Contraband
Beer market landscape – volume LAE (2013)
INTRODUCTION | METHODOLOGY | REGION | COUNTRIES | OUTLOOK | APPENDIX
In volume terms, 1.7% of the beer market in Honduras is illegal
98.3
% leg
al b
eer
1.7
% illeg
al b
eer
In 2013 beer represented 63% of
the legal alcoholic beverages
market, equivalent to 56,936 HL
LAE.
The volume of illegal beer was
estimated at 971 HL LAE.
The illegal beer market is entirely
contraband.
No illegal manufacturing of beer
was found in Honduras.
Honduras
971 HL
LAE
89,557 HL
LAE
© Euromonitor International Ltd 2013. Applicable terms and conditions of use and the disclaimer at the front of this document apply. 144
Counterfeit and illegal brands – Key facts
INTRODUCTION | METHODOLOGY | REGION | COUNTRIES | OUTLOOK | APPENDIX
Second most important category in Honduran market
HondurasB
evera
ges
• All illegal production is of aguardiente.
• The most commonly counterfeited products are locally produced aguardiente brands such as Catrachito, Golazo,
and Bambu.
• There is no counterfeit or illegal production of fermented beverages in Honduras.
Where
• Illegal production takes place mostly in rural areas, close to sugar cane crops. The products are usually
consumed near the areas of production.
• Large cities such as Tegucigalpa and San Pedro Sula are the main sources of bottles used for counterfeit
products. The final product is sold mostly in rural areas or smaller cities where there is very little government
control.
Drivers • Since aguardiente is the most common alcoholic beverage in the country, it is the most counterfeited product.
• Aguardiente bottles and labels are easy to obtain because they are locally produced and aguardiente is highly
consumed by Hondurans.
Effects • Fiscal loss.
• Illegally produced aguardiente is cheaper than the legal versions, affecting the sales of legal products.
• Due to the price difference between legal and illegal aguardiente, legal producers cannot increase their prices
every year in line with inflation or to pass on increases in production costs.
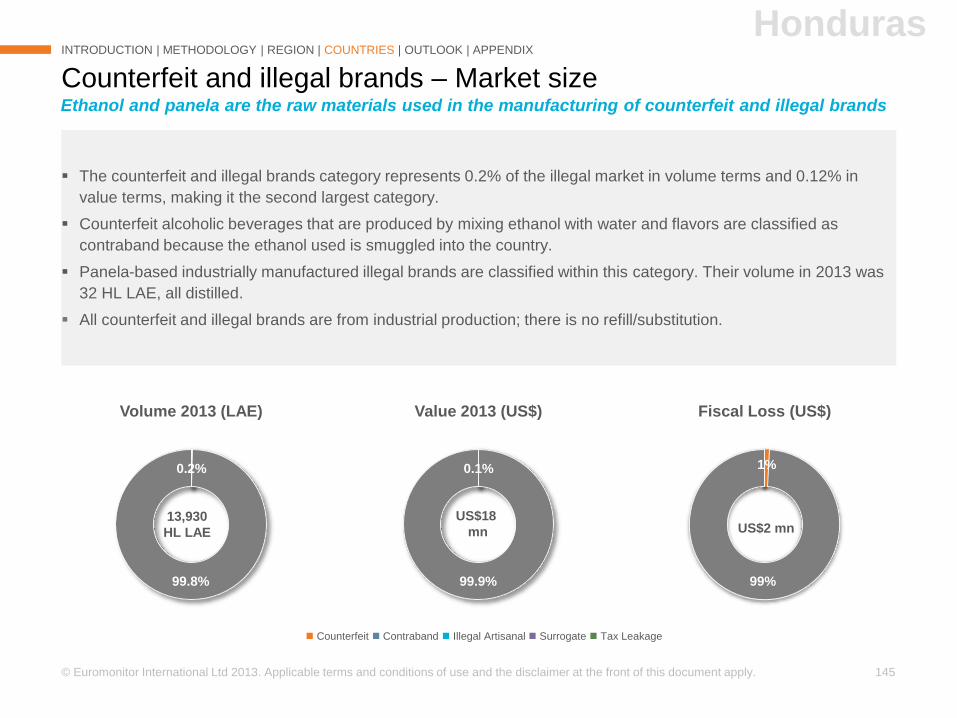
© Euromonitor International Ltd 2013. Applicable terms and conditions of use and the disclaimer at the front of this document apply. 145
1%
99%
Fiscal Loss (US$)
0.1%
99.9%
Value 2013 (US$)
US$18
mn
0.2%
99.8%
Volume 2013 (LAE)
Counterfeit and illegal brands – Market size
INTRODUCTION | METHODOLOGY | REGION | COUNTRIES | OUTLOOK | APPENDIX
Ethanol and panela are the raw materials used in the manufacturing of counterfeit and illegal brands
Honduras
Counterfeit Contraband Illegal Artisanal Surrogate Tax Leakage
US$2 mn 13,930
HL LAE
The counterfeit and illegal brands category represents 0.2% of the illegal market in volume terms and 0.12% in
value terms, making it the second largest category.
Counterfeit alcoholic beverages that are produced by mixing ethanol with water and flavors are classified as
contraband because the ethanol used is smuggled into the country.
Panela-based industrially manufactured illegal brands are classified within this category. Their volume in 2013 was
32 HL LAE, all distilled.
All counterfeit and illegal brands are from industrial production; there is no refill/substitution.
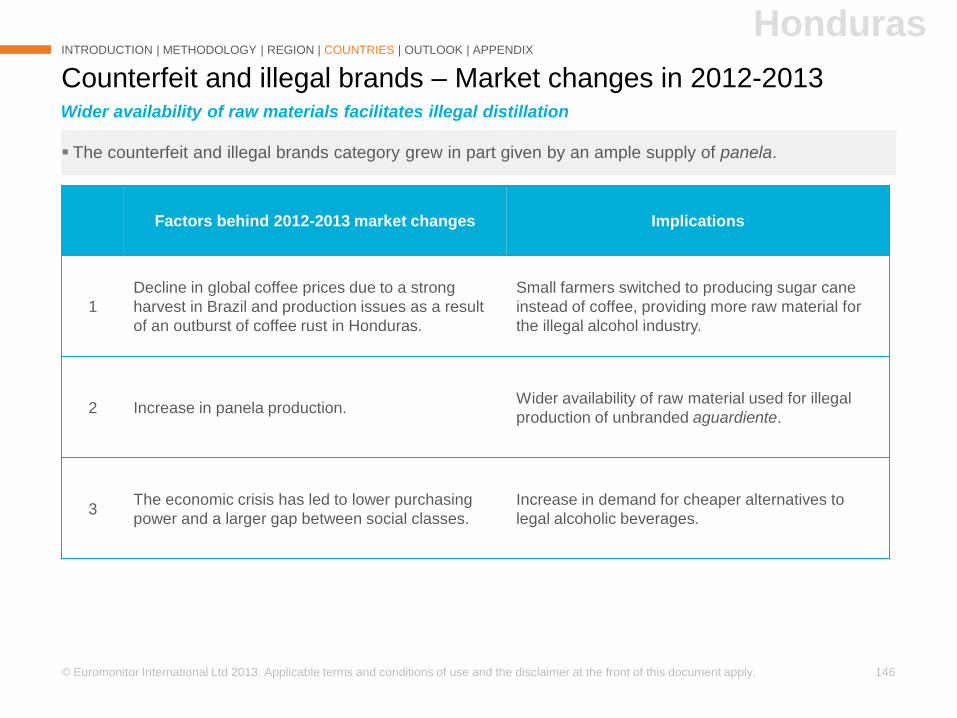
© Euromonitor International Ltd 2013. Applicable terms and conditions of use and the disclaimer at the front of this document apply. 146
The counterfeit and illegal brands category grew in part given by an ample supply of panela.
Counterfeit and illegal brands – Market changes in 2012-2013
Factors behind 2012-2013 market changes Implications
1
Decline in global coffee prices due to a strong
harvest in Brazil and production issues as a result
of an outburst of coffee rust in Honduras.
Small farmers switched to producing sugar cane
instead of coffee, providing more raw material for
the illegal alcohol industry.
2 Increase in panela production. Wider availability of raw material used for illegal
production of unbranded aguardiente.
3The economic crisis has led to lower purchasing
power and a larger gap between social classes.
Increase in demand for cheaper alternatives to
legal alcoholic beverages.
INTRODUCTION | METHODOLOGY | REGION | COUNTRIES | OUTLOOK | APPENDIX
Honduras
Wider availability of raw materials facilitates illegal distillation
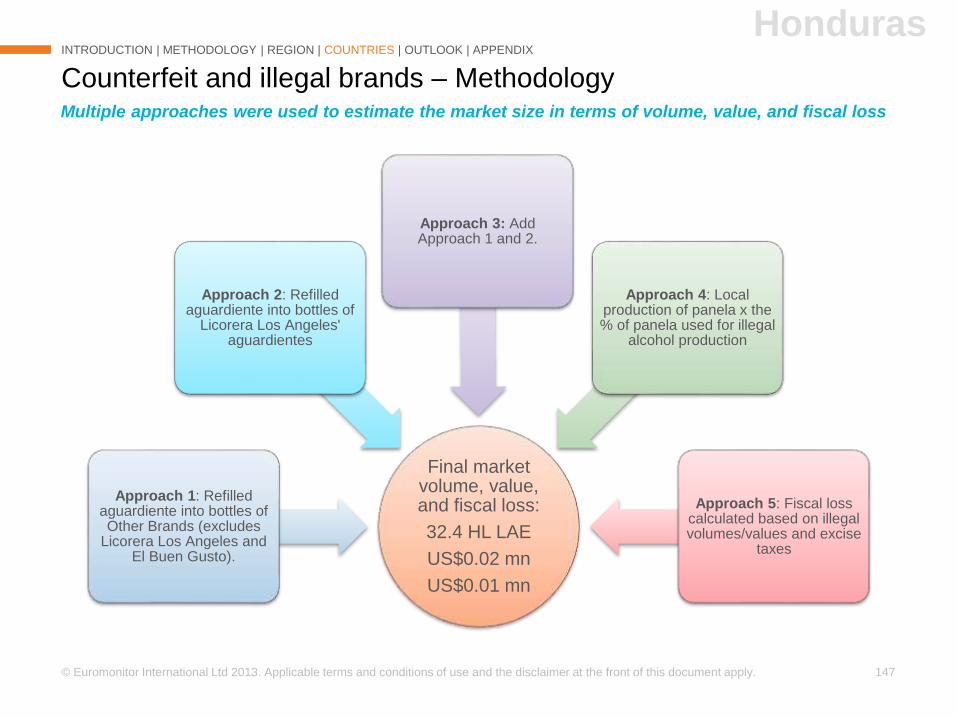
© Euromonitor International Ltd 2013. Applicable terms and conditions of use and the disclaimer at the front of this document apply. 147
Counterfeit and illegal brands – Methodology
INTRODUCTION | METHODOLOGY | REGION | COUNTRIES | OUTLOOK | APPENDIX
Final market volume, value, and fiscal loss:
32.4 HL LAE
US$0.02 mn
US$0.01 mn
Approach 1: Refilledaguardiente into bottles of Other Brands (excludes
Licorera Los Angeles and El Buen Gusto).
Approach 2: Refilledaguardiente into bottles of
Licorera Los Angeles' aguardientes
Approach 3: Add Approach 1 and 2.
Approach 4: Local production of panela x the % of panela used for illegal
alcohol production
Approach 5: Fiscal loss calculated based on illegal volumes/values and excise
taxes
Honduras
Multiple approaches were used to estimate the market size in terms of volume, value, and fiscal loss
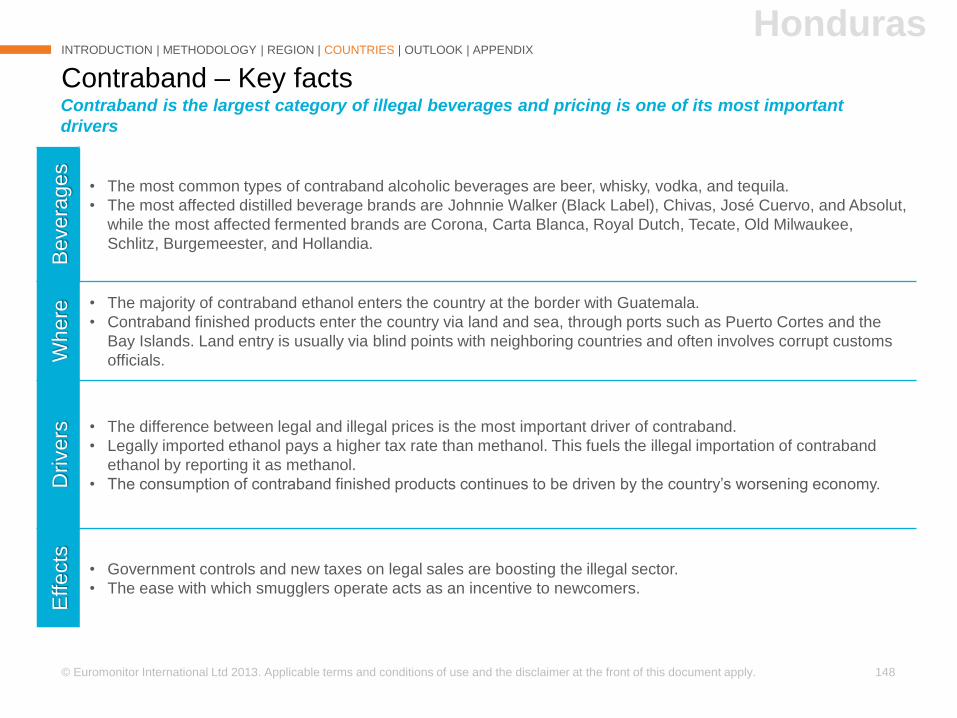
© Euromonitor International Ltd 2013. Applicable terms and conditions of use and the disclaimer at the front of this document apply. 148
Contraband – Key facts
INTRODUCTION | METHODOLOGY | REGION | COUNTRIES | OUTLOOK | APPENDIX
Contraband is the largest category of illegal beverages and pricing is one of its most important
drivers
HondurasB
evera
ges
• The most common types of contraband alcoholic beverages are beer, whisky, vodka, and tequila.
• The most affected distilled beverage brands are Johnnie Walker (Black Label), Chivas, José Cuervo, and Absolut,
while the most affected fermented brands are Corona, Carta Blanca, Royal Dutch, Tecate, Old Milwaukee,
Schlitz, Burgemeester, and Hollandia.
Where
• The majority of contraband ethanol enters the country at the border with Guatemala.
• Contraband finished products enter the country via land and sea, through ports such as Puerto Cortes and the
Bay Islands. Land entry is usually via blind points with neighboring countries and often involves corrupt customs
officials.
Dri
vers • The difference between legal and illegal prices is the most important driver of contraband.
• Legally imported ethanol pays a higher tax rate than methanol. This fuels the illegal importation of contraband
ethanol by reporting it as methanol.
• The consumption of contraband finished products continues to be driven by the country’s worsening economy.
Effects
• Government controls and new taxes on legal sales are boosting the illegal sector.
• The ease with which smugglers operate acts as an incentive to newcomers.
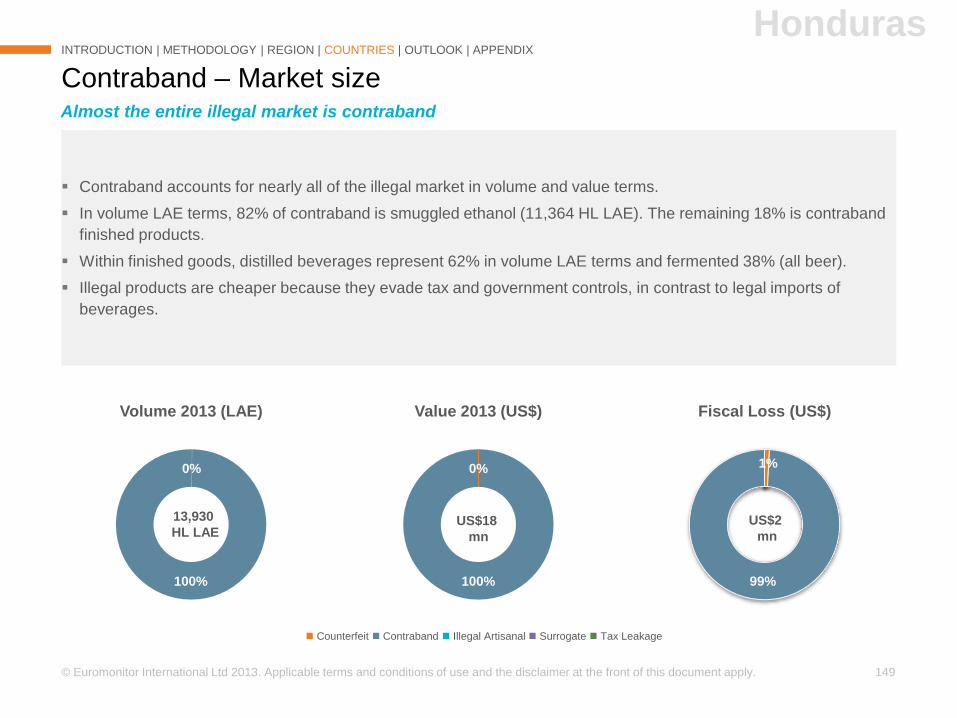
© Euromonitor International Ltd 2013. Applicable terms and conditions of use and the disclaimer at the front of this document apply. 149
1%
99%
Fiscal Loss (US$)
100%
0%
Value 2013 (US$)
0%
100%
Volume 2013 (LAE)
Contraband accounts for nearly all of the illegal market in volume and value terms.
In volume LAE terms, 82% of contraband is smuggled ethanol (11,364 HL LAE). The remaining 18% is contraband
finished products.
Within finished goods, distilled beverages represent 62% in volume LAE terms and fermented 38% (all beer).
Illegal products are cheaper because they evade tax and government controls, in contrast to legal imports of
beverages.
Contraband – Market size
INTRODUCTION | METHODOLOGY | REGION | COUNTRIES | OUTLOOK | APPENDIX
Almost the entire illegal market is contraband
Honduras
Counterfeit Contraband Illegal Artisanal Surrogate Tax Leakage
US$2
mn
13,930
HL LAEUS$18
mn
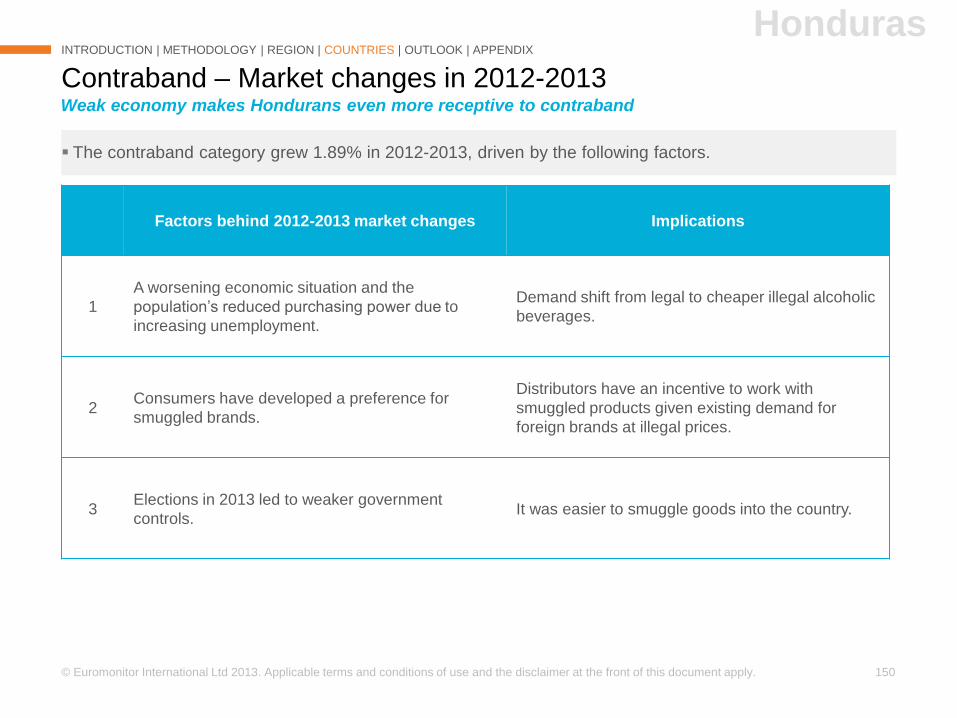
© Euromonitor International Ltd 2013. Applicable terms and conditions of use and the disclaimer at the front of this document apply. 150
The contraband category grew 1.89% in 2012-2013, driven by the following factors.
Contraband – Market changes in 2012-2013
Factors behind 2012-2013 market changes Implications
1
A worsening economic situation and the
population’s reduced purchasing power due to
increasing unemployment.
Demand shift from legal to cheaper illegal alcoholic
beverages.
2Consumers have developed a preference for
smuggled brands.
Distributors have an incentive to work with
smuggled products given existing demand for
foreign brands at illegal prices.
3Elections in 2013 led to weaker government
controls.It was easier to smuggle goods into the country.
INTRODUCTION | METHODOLOGY | REGION | COUNTRIES | OUTLOOK | APPENDIX
Honduras
Weak economy makes Hondurans even more receptive to contraband
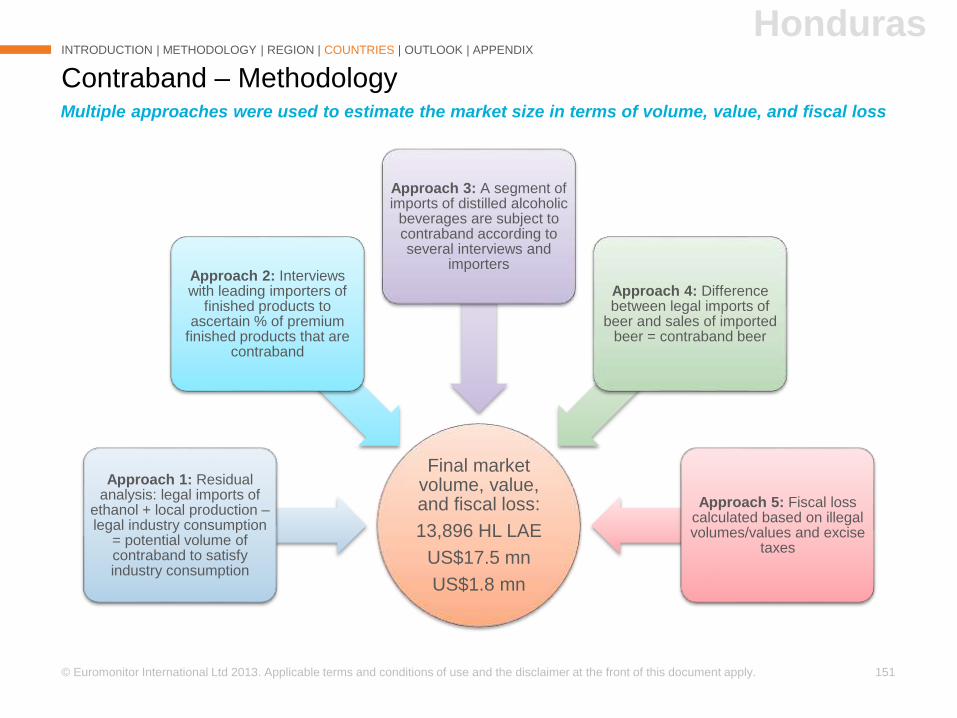
© Euromonitor International Ltd 2013. Applicable terms and conditions of use and the disclaimer at the front of this document apply. 151
Contraband – Methodology
INTRODUCTION | METHODOLOGY | REGION | COUNTRIES | OUTLOOK | APPENDIX
Final market volume, value, and fiscal loss:
13,896 HL LAE
US$17.5 mn
US$1.8 mn
Approach 1: Residual analysis: legal imports of
ethanol + local production –legal industry consumption
= potential volume of contraband to satisfy industry consumption
Approach 2: Interviews with leading importers of
finished products to ascertain % of premium
finished products that are contraband
Approach 3: A segment of imports of distilled alcoholic
beverages are subject to contraband according to several interviews and
importers
Approach 4: Difference between legal imports of
beer and sales of imported beer = contraband beer
Approach 5: Fiscal loss calculated based on illegal volumes/values and excise
taxes
Multiple approaches were used to estimate the market size in terms of volume, value, and fiscal loss
Honduras
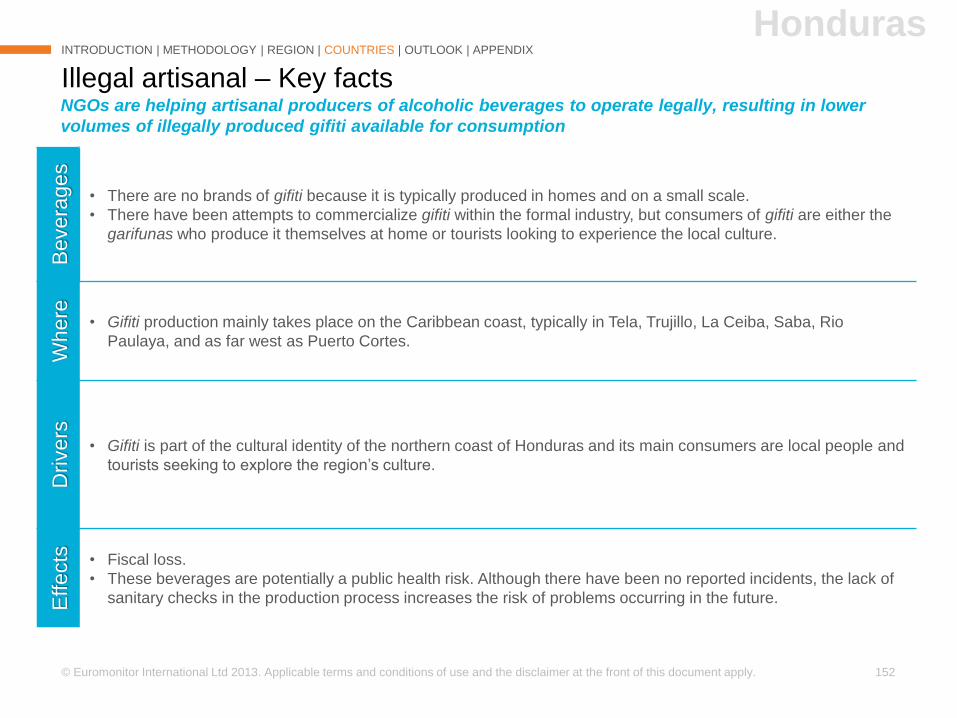
© Euromonitor International Ltd 2013. Applicable terms and conditions of use and the disclaimer at the front of this document apply. 152
Illegal artisanal – Key facts
INTRODUCTION | METHODOLOGY | REGION | COUNTRIES | OUTLOOK | APPENDIX
NGOs are helping artisanal producers of alcoholic beverages to operate legally, resulting in lower
volumes of illegally produced gifiti available for consumption
HondurasB
evera
ges
• There are no brands of gifiti because it is typically produced in homes and on a small scale.
• There have been attempts to commercialize gifiti within the formal industry, but consumers of gifiti are either the
garifunas who produce it themselves at home or tourists looking to experience the local culture.
Where
• Gifiti production mainly takes place on the Caribbean coast, typically in Tela, Trujillo, La Ceiba, Saba, Rio
Paulaya, and as far west as Puerto Cortes.
Dri
vers
• Gifiti is part of the cultural identity of the northern coast of Honduras and its main consumers are local people and
tourists seeking to explore the region’s culture.
Effects • Fiscal loss.
• These beverages are potentially a public health risk. Although there have been no reported incidents, the lack of
sanitary checks in the production process increases the risk of problems occurring in the future.
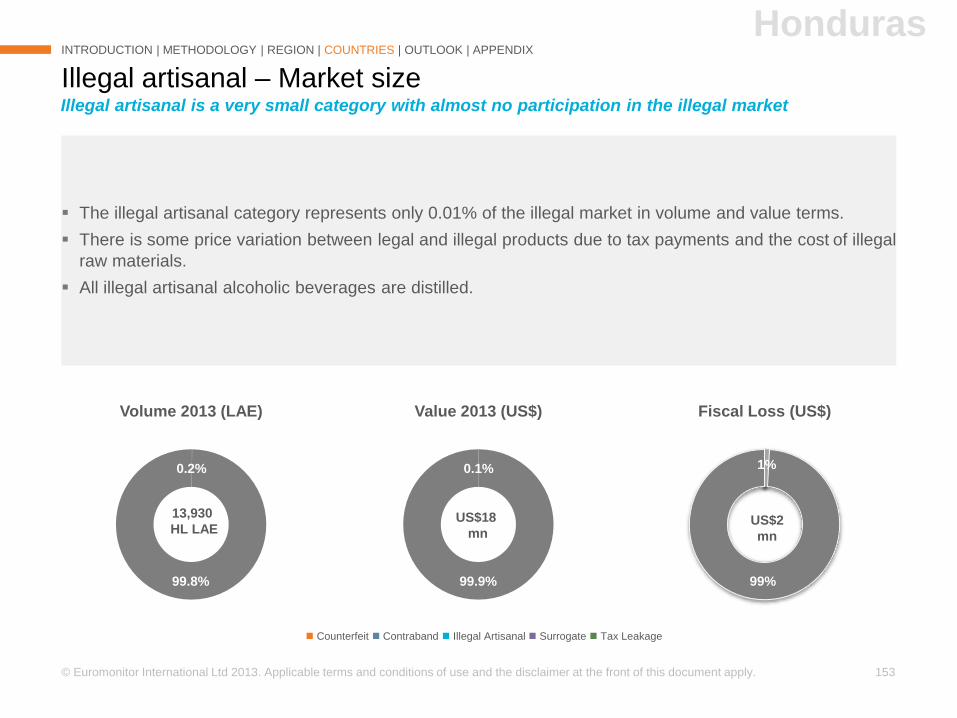
© Euromonitor International Ltd 2013. Applicable terms and conditions of use and the disclaimer at the front of this document apply. 153
1%
99%
Fiscal Loss (US$)
0.1%
99.9%
Value 2013 (US$)
US$18
mn
0.2%
99.8%
Volume 2013 (LAE)
Illegal artisanal – Market size
INTRODUCTION | METHODOLOGY | REGION | COUNTRIES | OUTLOOK | APPENDIX
Illegal artisanal is a very small category with almost no participation in the illegal market
Honduras
Counterfeit Contraband Illegal Artisanal Surrogate Tax Leakage
US$2
mn
The illegal artisanal category represents only 0.01% of the illegal market in volume and value terms.
There is some price variation between legal and illegal products due to tax payments and the cost of illegal
raw materials.
All illegal artisanal alcoholic beverages are distilled.
13,930
HL LAE
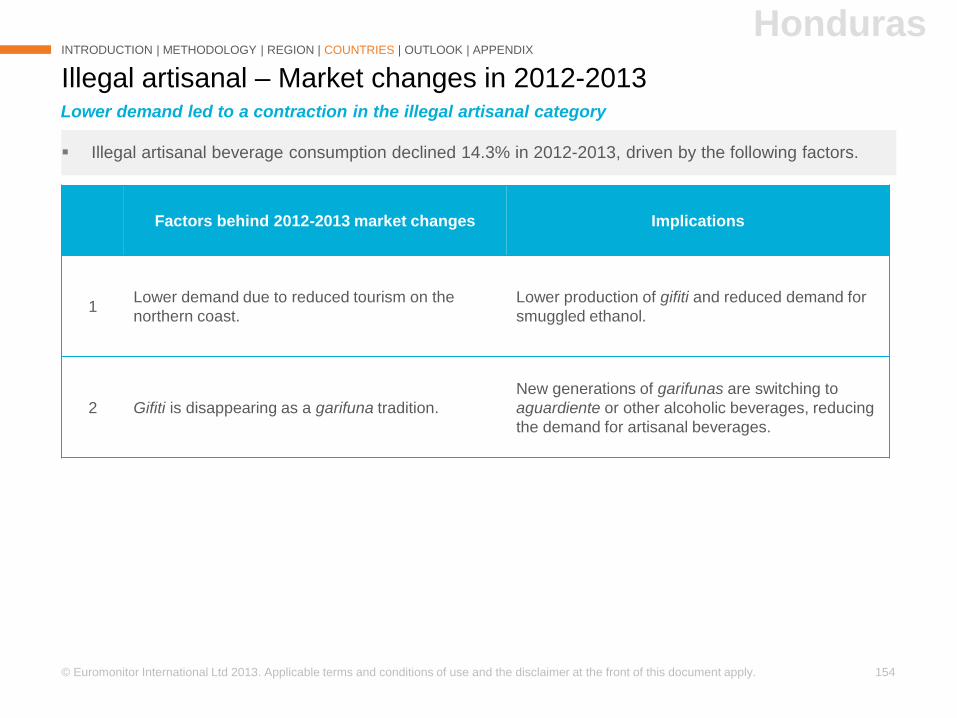
© Euromonitor International Ltd 2013. Applicable terms and conditions of use and the disclaimer at the front of this document apply. 154
Illegal artisanal beverage consumption declined 14.3% in 2012-2013, driven by the following factors.
Illegal artisanal – Market changes in 2012-2013
Factors behind 2012-2013 market changes Implications
1Lower demand due to reduced tourism on the
northern coast.
Lower production of gifiti and reduced demand for
smuggled ethanol.
2 Gifiti is disappearing as a garifuna tradition.
New generations of garifunas are switching to
aguardiente or other alcoholic beverages, reducing
the demand for artisanal beverages.
INTRODUCTION | METHODOLOGY | REGION | COUNTRIES | OUTLOOK | APPENDIX
Honduras
Lower demand led to a contraction in the illegal artisanal category
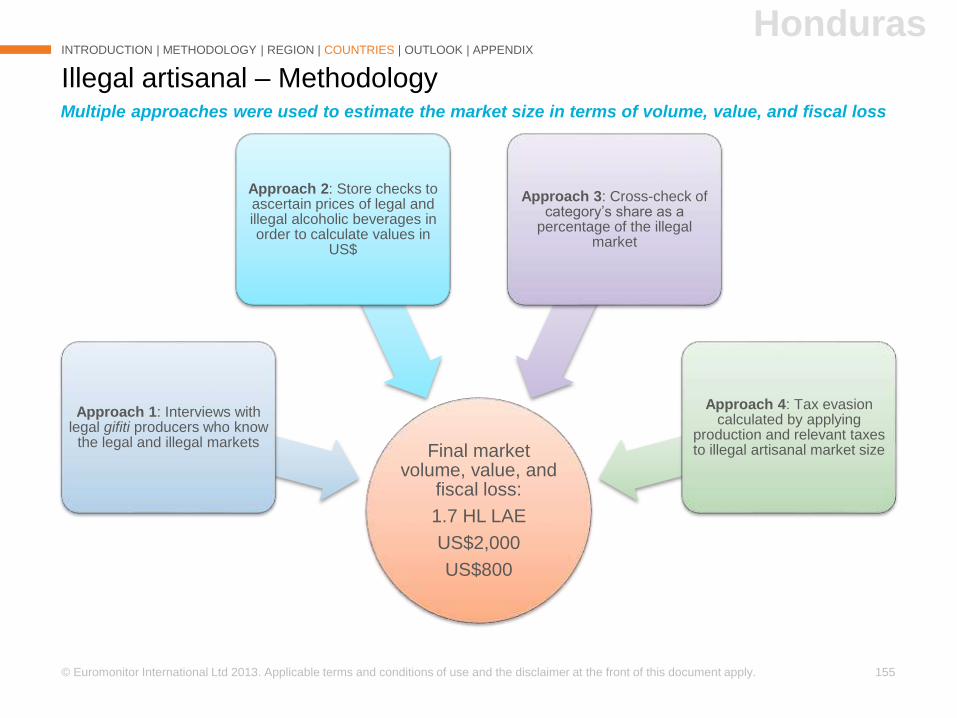
© Euromonitor International Ltd 2013. Applicable terms and conditions of use and the disclaimer at the front of this document apply. 155
Illegal artisanal – Methodology
INTRODUCTION | METHODOLOGY | REGION | COUNTRIES | OUTLOOK | APPENDIX
Final market volume, value, and
fiscal loss:
1.7 HL LAE
US$2,000
US$800
Approach 1: Interviews with legal gifiti producers who know
the legal and illegal markets
Approach 2: Store checks to ascertain prices of legal and illegal alcoholic beverages in order to calculate values in
US$
Approach 3: Cross-check of category’s share as a
percentage of the illegal market
Approach 4: Tax evasion calculated by applying
production and relevant taxes to illegal artisanal market size
Multiple approaches were used to estimate the market size in terms of volume, value, and fiscal loss
Honduras
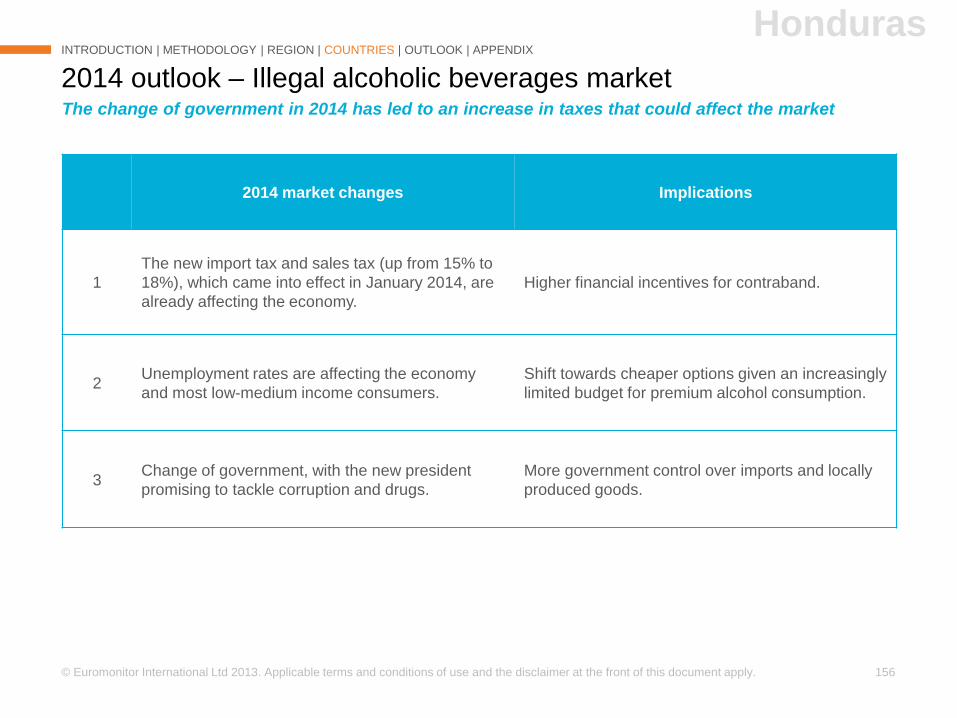
© Euromonitor International Ltd 2013. Applicable terms and conditions of use and the disclaimer at the front of this document apply. 156
2014 outlook – Illegal alcoholic beverages market
INTRODUCTION | METHODOLOGY | REGION | COUNTRIES | OUTLOOK | APPENDIX
2014 market changes Implications
1
The new import tax and sales tax (up from 15% to
18%), which came into effect in January 2014, are
already affecting the economy.
Higher financial incentives for contraband.
2Unemployment rates are affecting the economy
and most low-medium income consumers.
Shift towards cheaper options given an increasingly
limited budget for premium alcohol consumption.
3Change of government, with the new president
promising to tackle corruption and drugs.
More government control over imports and locally
produced goods.
The change of government in 2014 has led to an increase in taxes that could affect the market
Honduras
INTRODUCTION
METHODOLOGY
ANALYSIS - REGION
ANALYSIS – COUNTRIES
2014 OUTLOOK
APPENDIX
►►Peru
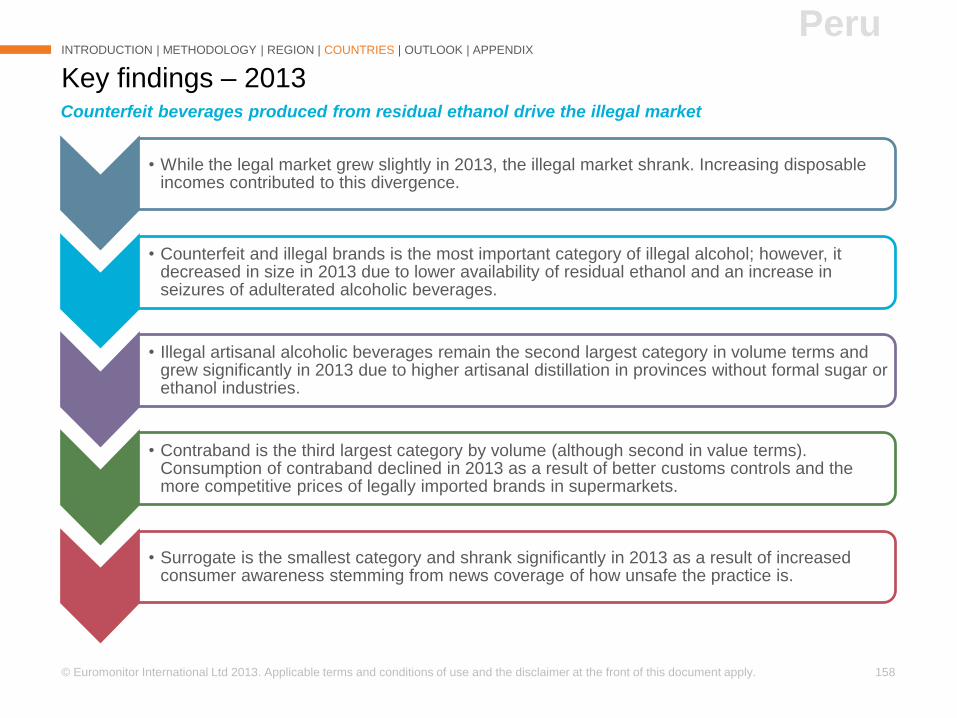
© Euromonitor International Ltd 2013. Applicable terms and conditions of use and the disclaimer at the front of this document apply. 158
• While the legal market grew slightly in 2013, the illegal market shrank. Increasing disposable incomes contributed to this divergence.
• Counterfeit and illegal brands is the most important category of illegal alcohol; however, it decreased in size in 2013 due to lower availability of residual ethanol and an increase in seizures of adulterated alcoholic beverages.
• Illegal artisanal alcoholic beverages remain the second largest category in volume terms and grew significantly in 2013 due to higher artisanal distillation in provinces without formal sugar or ethanol industries.
• Contraband is the third largest category by volume (although second in value terms). Consumption of contraband declined in 2013 as a result of better customs controls and the more competitive prices of legally imported brands in supermarkets.
• Surrogate is the smallest category and shrank significantly in 2013 as a result of increased consumer awareness stemming from news coverage of how unsafe the practice is.
Key findings – 2013
INTRODUCTION | METHODOLOGY | REGION | COUNTRIES | OUTLOOK | APPENDIX
Counterfeit beverages produced from residual ethanol drive the illegal market
Peru
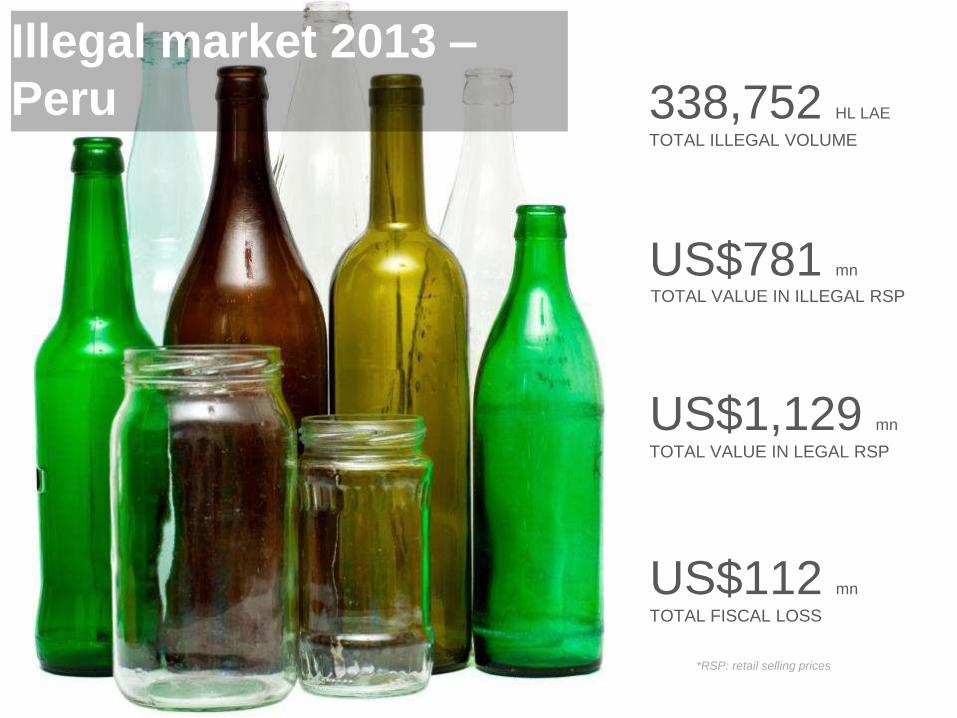
338,752 HL LAE
TOTAL ILLEGAL VOLUME
Illegal market 2013 –
Peru
US$781 mn
TOTAL VALUE IN ILLEGAL RSP
US$112 mn
TOTAL FISCAL LOSS
US$1,129 mn
TOTAL VALUE IN LEGAL RSP
*RSP: retail selling prices
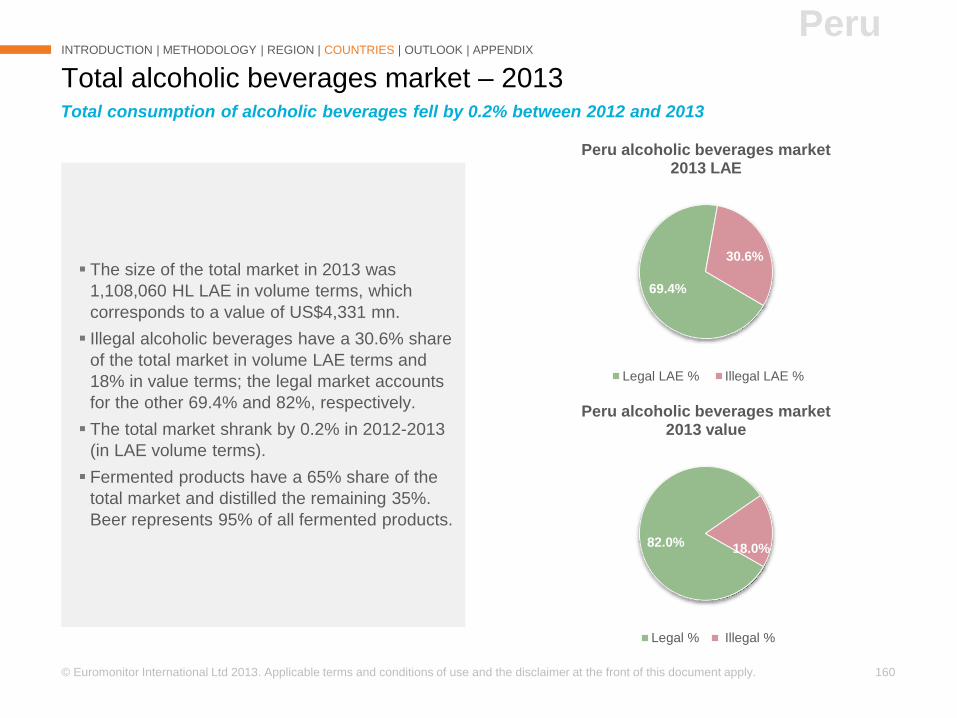
© Euromonitor International Ltd 2013. Applicable terms and conditions of use and the disclaimer at the front of this document apply. 160
Total alcoholic beverages market – 2013
INTRODUCTION | METHODOLOGY | REGION | COUNTRIES | OUTLOOK | APPENDIX
Total consumption of alcoholic beverages fell by 0.2% between 2012 and 2013
Peru
The size of the total market in 2013 was
1,108,060 HL LAE in volume terms, which
corresponds to a value of US$4,331 mn.
Illegal alcoholic beverages have a 30.6% share
of the total market in volume LAE terms and
18% in value terms; the legal market accounts
for the other 69.4% and 82%, respectively.
The total market shrank by 0.2% in 2012-2013
(in LAE volume terms).
Fermented products have a 65% share of the
total market and distilled the remaining 35%.
Beer represents 95% of all fermented products.
69.4%
30.6%
Peru alcoholic beverages market 2013 LAE
Legal LAE % Illegal LAE %
82.0% 18.0%
Peru alcoholic beverages market 2013 value
Legal % Illegal %
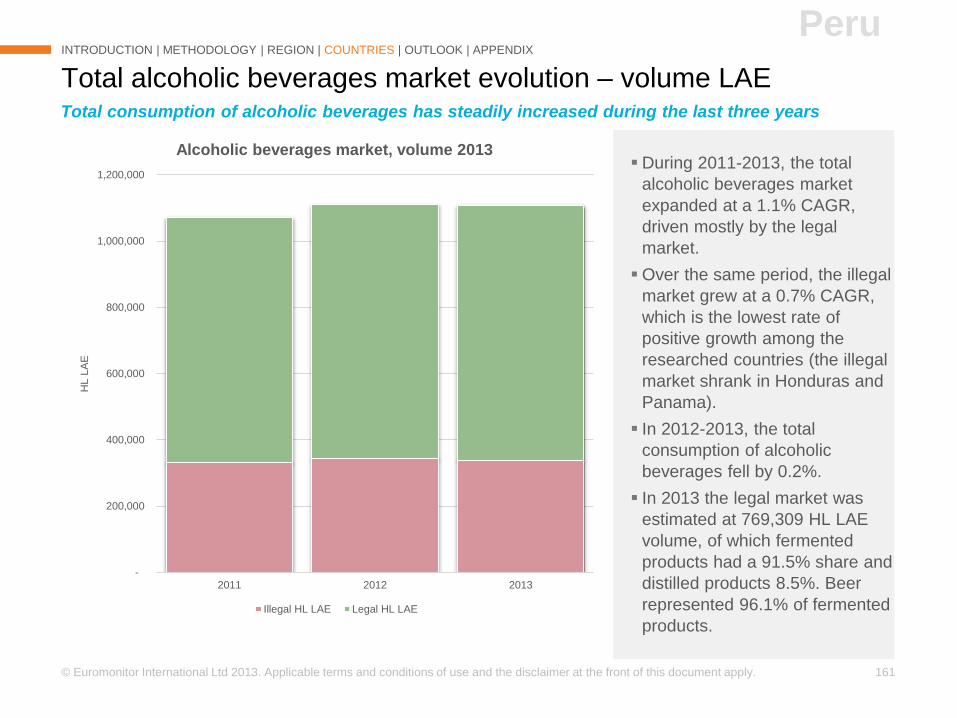
© Euromonitor International Ltd 2013. Applicable terms and conditions of use and the disclaimer at the front of this document apply. 161
During 2011-2013, the total
alcoholic beverages market
expanded at a 1.1% CAGR,
driven mostly by the legal
market.
Over the same period, the illegal
market grew at a 0.7% CAGR,
which is the lowest rate of
positive growth among the
researched countries (the illegal
market shrank in Honduras and
Panama).
In 2012-2013, the total
consumption of alcoholic
beverages fell by 0.2%.
In 2013 the legal market was
estimated at 769,309 HL LAE
volume, of which fermented
products had a 91.5% share and
distilled products 8.5%. Beer
represented 96.1% of fermented
products.
Total alcoholic beverages market evolution – volume LAE
INTRODUCTION | METHODOLOGY | REGION | COUNTRIES | OUTLOOK | APPENDIX
Peru
Total consumption of alcoholic beverages has steadily increased during the last three years
-
200,000
400,000
600,000
800,000
1,000,000
1,200,000
2011 2012 2013
HL L
AE
Alcoholic beverages market, volume 2013
Illegal HL LAE Legal HL LAE
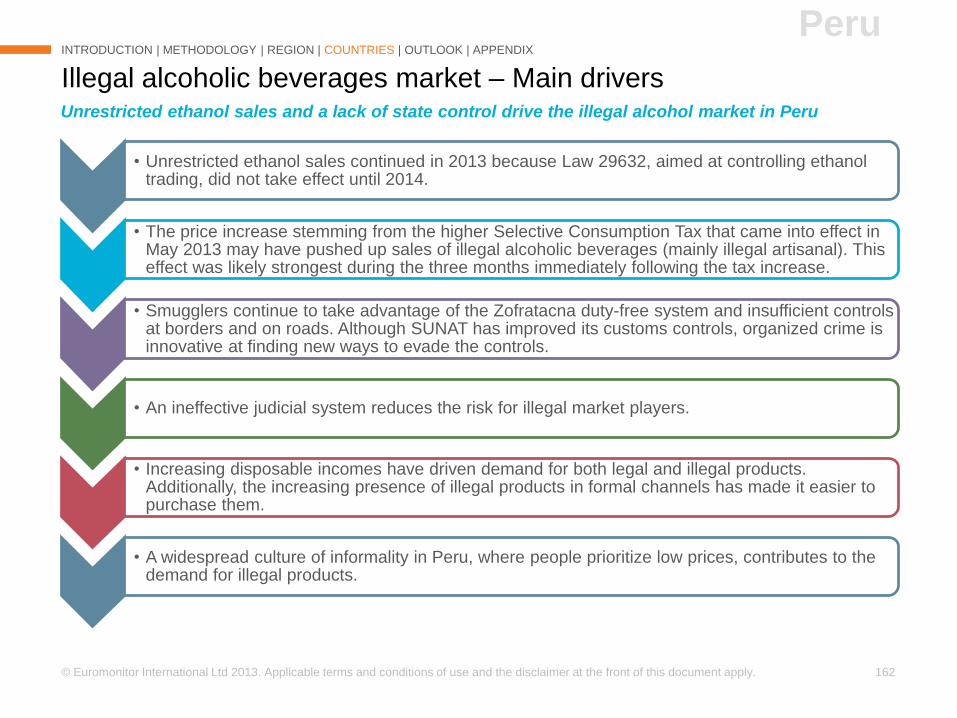
© Euromonitor International Ltd 2013. Applicable terms and conditions of use and the disclaimer at the front of this document apply. 162
Illegal alcoholic beverages market – Main drivers
INTRODUCTION | METHODOLOGY | REGION | COUNTRIES | OUTLOOK | APPENDIX
• Unrestricted ethanol sales continued in 2013 because Law 29632, aimed at controlling ethanol trading, did not take effect until 2014.
• The price increase stemming from the higher Selective Consumption Tax that came into effect in May 2013 may have pushed up sales of illegal alcoholic beverages (mainly illegal artisanal). This effect was likely strongest during the three months immediately following the tax increase.
• Smugglers continue to take advantage of the Zofratacna duty-free system and insufficient controls at borders and on roads. Although SUNAT has improved its customs controls, organized crime is innovative at finding new ways to evade the controls.
• An ineffective judicial system reduces the risk for illegal market players.
• Increasing disposable incomes have driven demand for both legal and illegal products. Additionally, the increasing presence of illegal products in formal channels has made it easier to purchase them.
• A widespread culture of informality in Peru, where people prioritize low prices, contributes to the demand for illegal products.
Unrestricted ethanol sales and a lack of state control drive the illegal alcohol market in Peru
Peru
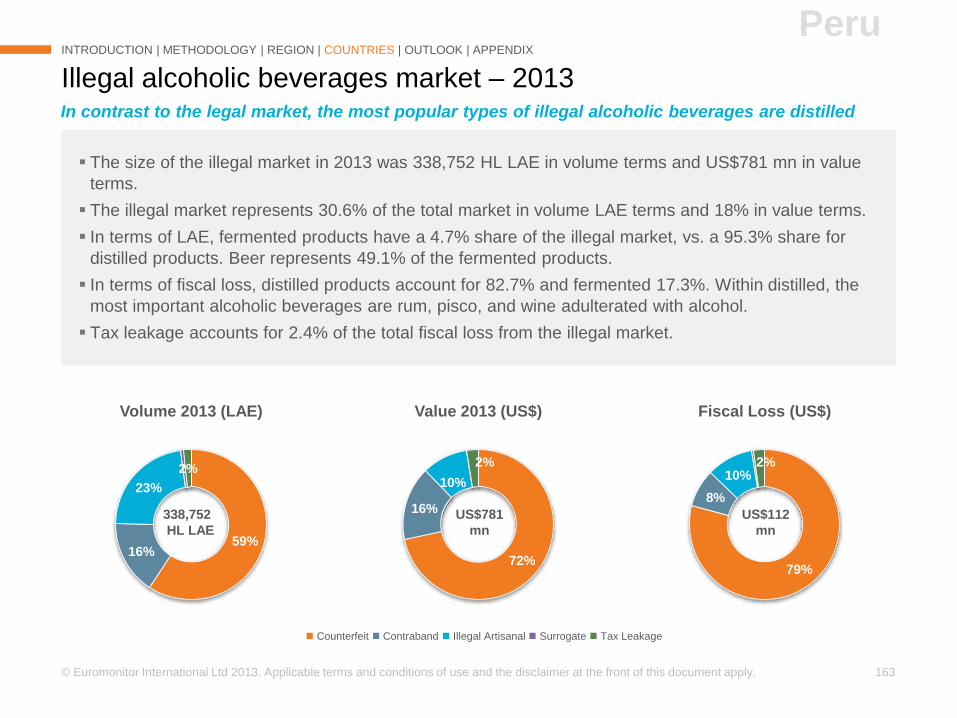
© Euromonitor International Ltd 2013. Applicable terms and conditions of use and the disclaimer at the front of this document apply. 163
79%
8%
10%2%
Fiscal Loss (US$)
72%
16%
10%
2%
Value 2013 (US$)
59%16%
23%
2%
Volume 2013 (LAE)
The size of the illegal market in 2013 was 338,752 HL LAE in volume terms and US$781 mn in value
terms.
The illegal market represents 30.6% of the total market in volume LAE terms and 18% in value terms.
In terms of LAE, fermented products have a 4.7% share of the illegal market, vs. a 95.3% share for
distilled products. Beer represents 49.1% of the fermented products.
In terms of fiscal loss, distilled products account for 82.7% and fermented 17.3%. Within distilled, the
most important alcoholic beverages are rum, pisco, and wine adulterated with alcohol.
Tax leakage accounts for 2.4% of the total fiscal loss from the illegal market.
Illegal alcoholic beverages market – 2013
INTRODUCTION | METHODOLOGY | REGION | COUNTRIES | OUTLOOK | APPENDIX
Counterfeit Contraband Illegal Artisanal Surrogate Tax Leakage
In contrast to the legal market, the most popular types of illegal alcoholic beverages are distilled
Peru
338,752
HL LAE
US$781
mn
US$112
mn
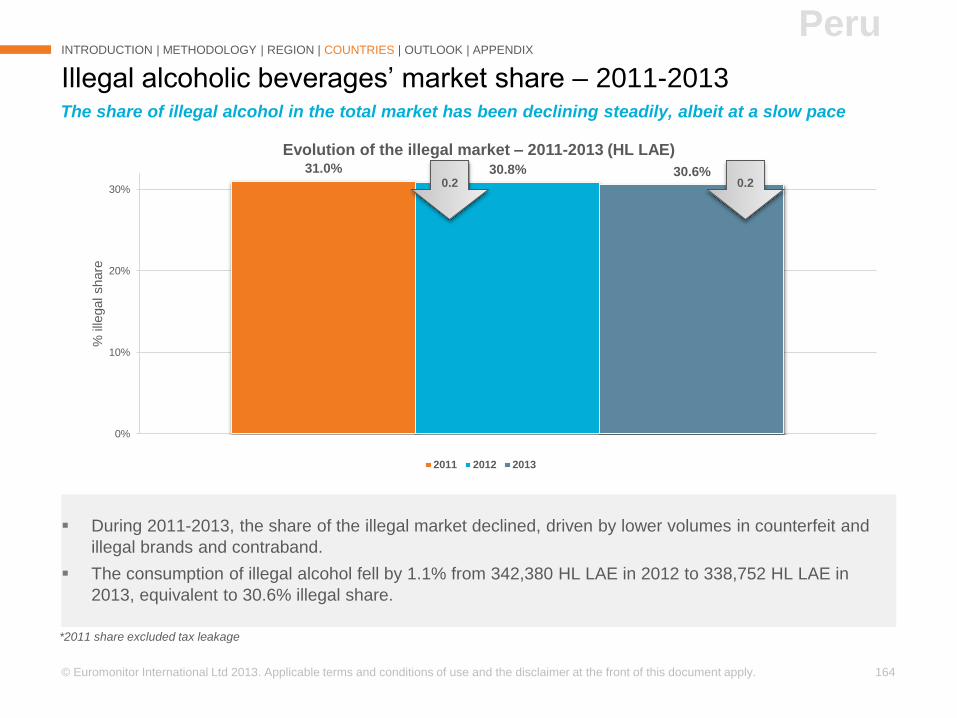
© Euromonitor International Ltd 2013. Applicable terms and conditions of use and the disclaimer at the front of this document apply. 164
31.0% 30.8% 30.6%
0%
10%
20%
30%
% ille
gal share
Evolution of the illegal market – 2011-2013 (HL LAE)
2011 2012 2013
During 2011-2013, the share of the illegal market declined, driven by lower volumes in counterfeit and
illegal brands and contraband.
The consumption of illegal alcohol fell by 1.1% from 342,380 HL LAE in 2012 to 338,752 HL LAE in
2013, equivalent to 30.6% illegal share.
Illegal alcoholic beverages’ market share – 2011-2013
INTRODUCTION | METHODOLOGY | REGION | COUNTRIES | OUTLOOK | APPENDIX
The share of illegal alcohol in the total market has been declining steadily, albeit at a slow pace
Peru
*2011 share excluded tax leakage
0.2 0.2
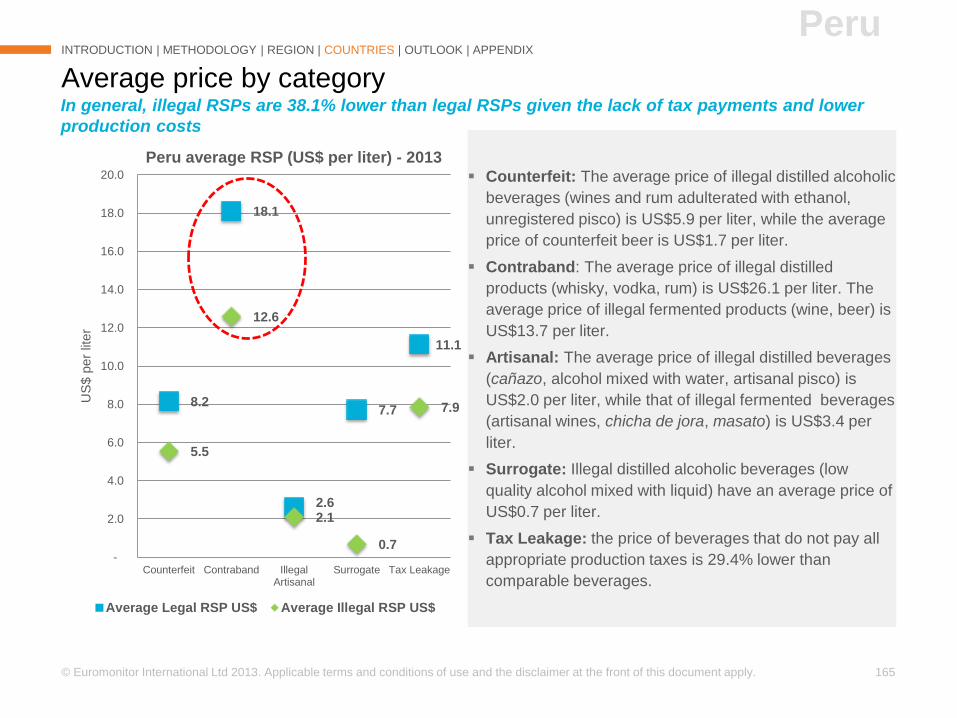
© Euromonitor International Ltd 2013. Applicable terms and conditions of use and the disclaimer at the front of this document apply. 165
8.2
18.1
2.6
7.7
11.1
5.5
12.6
2.1
0.7
7.9
-
2.0
4.0
6.0
8.0
10.0
12.0
14.0
16.0
18.0
20.0
Counterfeit Contraband IllegalArtisanal
Surrogate Tax Leakage
US
$ p
er
liter
Peru average RSP (US$ per liter) - 2013
Average Legal RSP US$ Average Illegal RSP US$
Counterfeit: The average price of illegal distilled alcoholic
beverages (wines and rum adulterated with ethanol,
unregistered pisco) is US$5.9 per liter, while the average
price of counterfeit beer is US$1.7 per liter.
Contraband: The average price of illegal distilled
products (whisky, vodka, rum) is US$26.1 per liter. The
average price of illegal fermented products (wine, beer) is
US$13.7 per liter.
Artisanal: The average price of illegal distilled beverages
(cañazo, alcohol mixed with water, artisanal pisco) is
US$2.0 per liter, while that of illegal fermented beverages
(artisanal wines, chicha de jora, masato) is US$3.4 per
liter.
Surrogate: Illegal distilled alcoholic beverages (low
quality alcohol mixed with liquid) have an average price of
US$0.7 per liter.
Tax Leakage: the price of beverages that do not pay all
appropriate production taxes is 29.4% lower than
comparable beverages.
Average price by category
INTRODUCTION | METHODOLOGY | REGION | COUNTRIES | OUTLOOK | APPENDIX
In general, illegal RSPs are 38.1% lower than legal RSPs given the lack of tax payments and lower
production costs
Peru
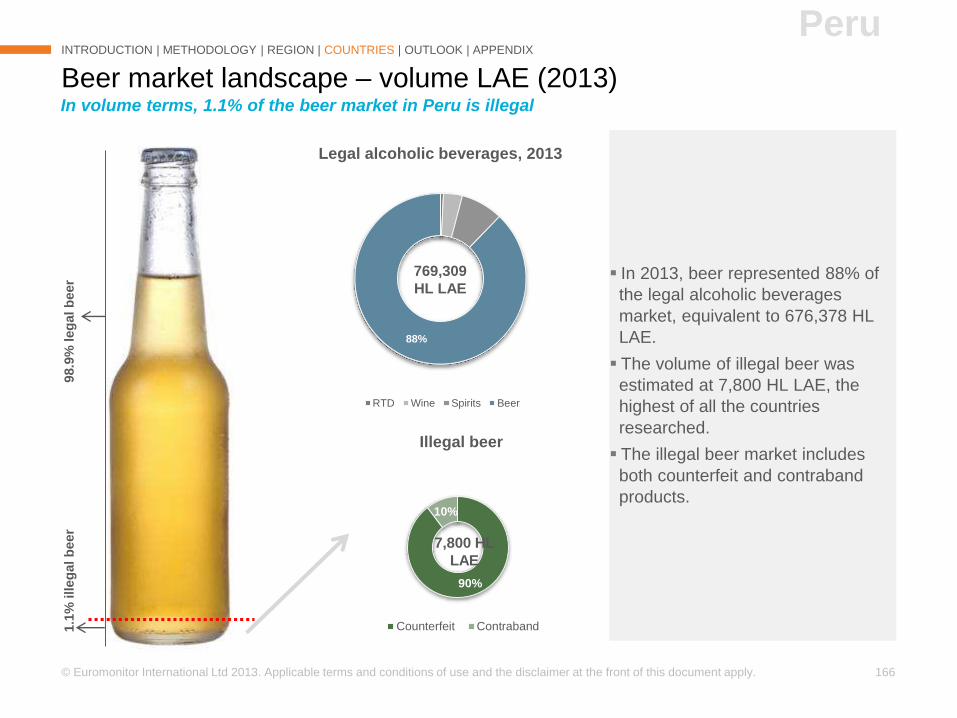
© Euromonitor International Ltd 2013. Applicable terms and conditions of use and the disclaimer at the front of this document apply. 166
88%
Legal alcoholic beverages, 2013
RTD Wine Spirits Beer
90%
10%
Illegal beer
Counterfeit Contraband
Beer market landscape – volume LAE (2013)
INTRODUCTION | METHODOLOGY | REGION | COUNTRIES | OUTLOOK | APPENDIX
In volume terms, 1.1% of the beer market in Peru is illegal
98.9
% leg
al b
eer
1.1
% illeg
al b
eer
In 2013, beer represented 88% of
the legal alcoholic beverages
market, equivalent to 676,378 HL
LAE.
The volume of illegal beer was
estimated at 7,800 HL LAE, the
highest of all the countries
researched.
The illegal beer market includes
both counterfeit and contraband
products.
Peru
7,800 HL
LAE
769,309
HL LAE
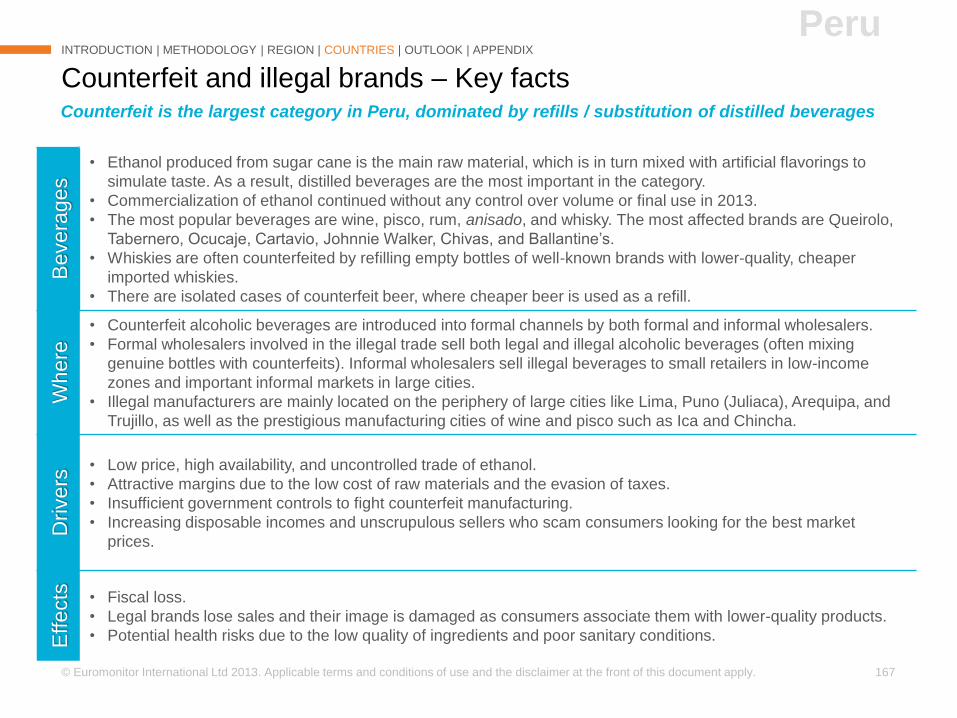
© Euromonitor International Ltd 2013. Applicable terms and conditions of use and the disclaimer at the front of this document apply. 167
Counterfeit and illegal brands – Key facts
INTRODUCTION | METHODOLOGY | REGION | COUNTRIES | OUTLOOK | APPENDIX
Counterfeit is the largest category in Peru, dominated by refills / substitution of distilled beverages
PeruB
evera
ge
s
• Ethanol produced from sugar cane is the main raw material, which is in turn mixed with artificial flavorings to
simulate taste. As a result, distilled beverages are the most important in the category.
• Commercialization of ethanol continued without any control over volume or final use in 2013.
• The most popular beverages are wine, pisco, rum, anisado, and whisky. The most affected brands are Queirolo,
Tabernero, Ocucaje, Cartavio, Johnnie Walker, Chivas, and Ballantine’s.
• Whiskies are often counterfeited by refilling empty bottles of well-known brands with lower-quality, cheaper
imported whiskies.
• There are isolated cases of counterfeit beer, where cheaper beer is used as a refill.
Where
• Counterfeit alcoholic beverages are introduced into formal channels by both formal and informal wholesalers.
• Formal wholesalers involved in the illegal trade sell both legal and illegal alcoholic beverages (often mixing
genuine bottles with counterfeits). Informal wholesalers sell illegal beverages to small retailers in low-income
zones and important informal markets in large cities.
• Illegal manufacturers are mainly located on the periphery of large cities like Lima, Puno (Juliaca), Arequipa, and
Trujillo, as well as the prestigious manufacturing cities of wine and pisco such as Ica and Chincha.
Drivers
• Low price, high availability, and uncontrolled trade of ethanol.
• Attractive margins due to the low cost of raw materials and the evasion of taxes.
• Insufficient government controls to fight counterfeit manufacturing.
• Increasing disposable incomes and unscrupulous sellers who scam consumers looking for the best market
prices.
Effects • Fiscal loss.
• Legal brands lose sales and their image is damaged as consumers associate them with lower-quality products.
• Potential health risks due to the low quality of ingredients and poor sanitary conditions.
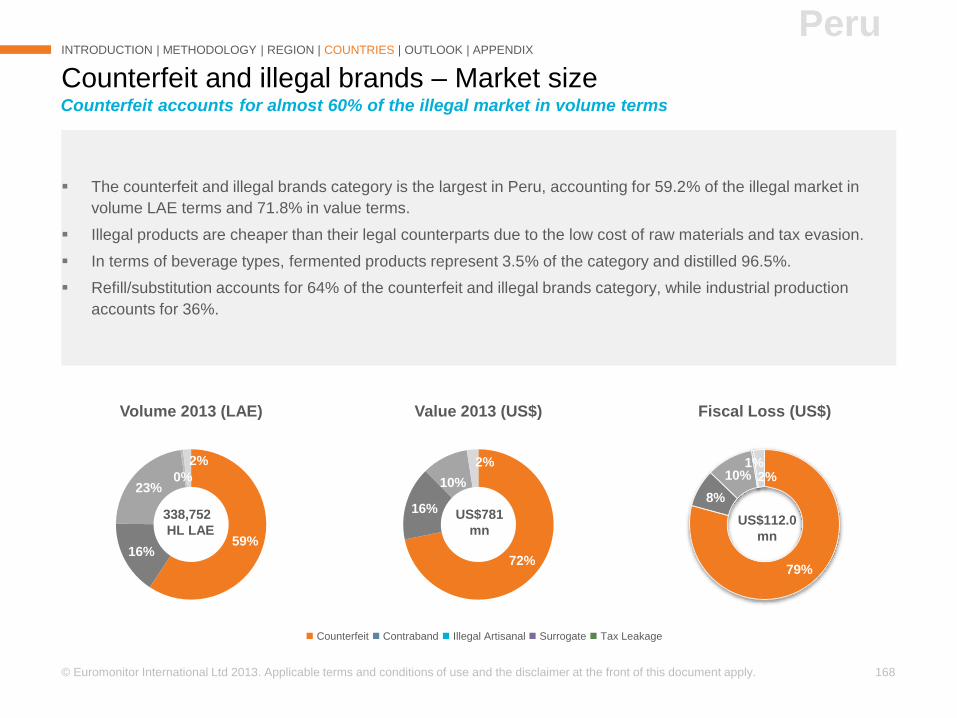
© Euromonitor International Ltd 2013. Applicable terms and conditions of use and the disclaimer at the front of this document apply. 168
79%
8%
10%1%
2%
Fiscal Loss (US$)
72%
16%
10%
2%
Value 2013 (US$)
59%16%
23%0%
2%
Volume 2013 (LAE)
Counterfeit and illegal brands – Market size
INTRODUCTION | METHODOLOGY | REGION | COUNTRIES | OUTLOOK | APPENDIX
Counterfeit accounts for almost 60% of the illegal market in volume terms
Peru
Counterfeit Contraband Illegal Artisanal Surrogate Tax Leakage
US$112.0
mn
The counterfeit and illegal brands category is the largest in Peru, accounting for 59.2% of the illegal market in
volume LAE terms and 71.8% in value terms.
Illegal products are cheaper than their legal counterparts due to the low cost of raw materials and tax evasion.
In terms of beverage types, fermented products represent 3.5% of the category and distilled 96.5%.
Refill/substitution accounts for 64% of the counterfeit and illegal brands category, while industrial production
accounts for 36%.
338,752
HL LAE
US$781
mn
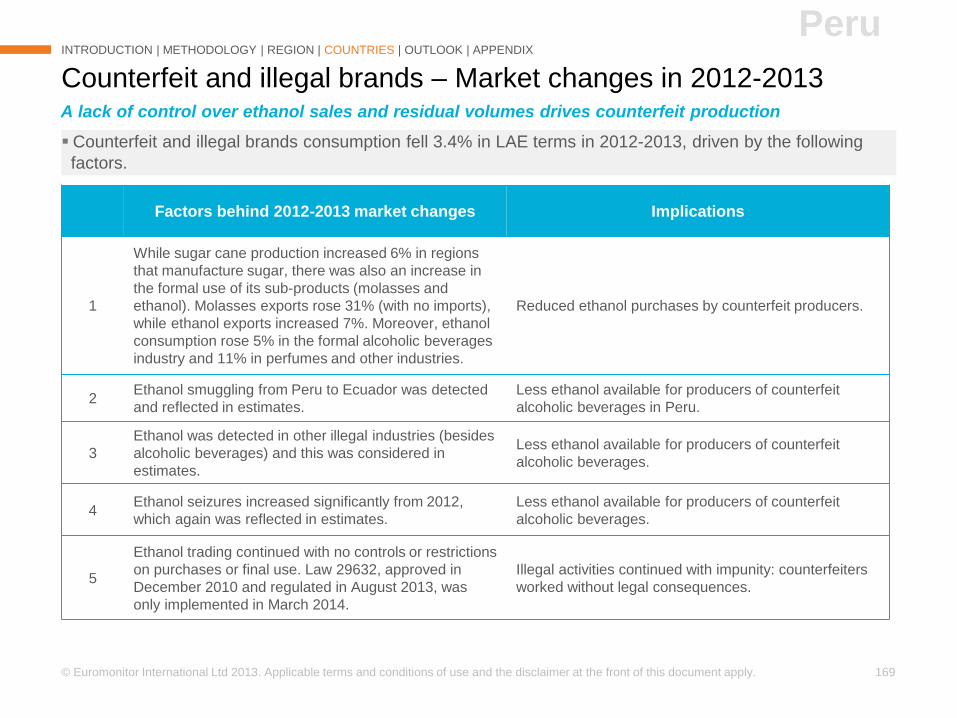
© Euromonitor International Ltd 2013. Applicable terms and conditions of use and the disclaimer at the front of this document apply. 169
Counterfeit and illegal brands consumption fell 3.4% in LAE terms in 2012-2013, driven by the following
factors.
Counterfeit and illegal brands – Market changes in 2012-2013
Factors behind 2012-2013 market changes Implications
1
While sugar cane production increased 6% in regions
that manufacture sugar, there was also an increase in
the formal use of its sub-products (molasses and
ethanol). Molasses exports rose 31% (with no imports),
while ethanol exports increased 7%. Moreover, ethanol
consumption rose 5% in the formal alcoholic beverages
industry and 11% in perfumes and other industries.
Reduced ethanol purchases by counterfeit producers.
2Ethanol smuggling from Peru to Ecuador was detected
and reflected in estimates.
Less ethanol available for producers of counterfeit
alcoholic beverages in Peru.
3
Ethanol was detected in other illegal industries (besides
alcoholic beverages) and this was considered in
estimates.
Less ethanol available for producers of counterfeit
alcoholic beverages.
4Ethanol seizures increased significantly from 2012,
which again was reflected in estimates.
Less ethanol available for producers of counterfeit
alcoholic beverages.
5
Ethanol trading continued with no controls or restrictions
on purchases or final use. Law 29632, approved in
December 2010 and regulated in August 2013, was
only implemented in March 2014.
Illegal activities continued with impunity: counterfeiters
worked without legal consequences.
INTRODUCTION | METHODOLOGY | REGION | COUNTRIES | OUTLOOK | APPENDIX
Peru
A lack of control over ethanol sales and residual volumes drives counterfeit production
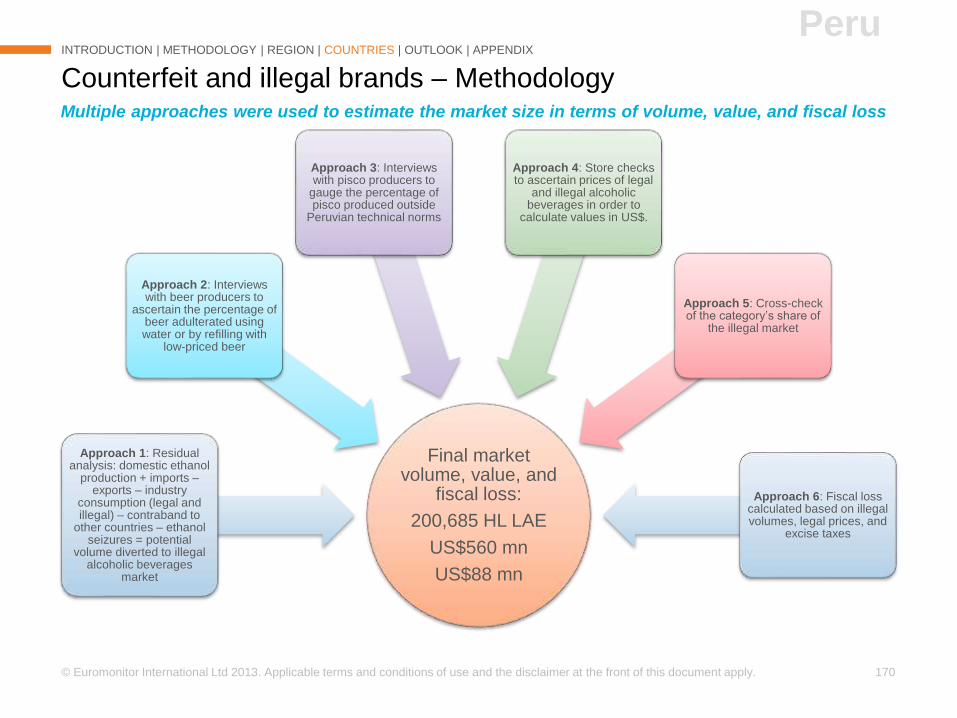
© Euromonitor International Ltd 2013. Applicable terms and conditions of use and the disclaimer at the front of this document apply. 170
Counterfeit and illegal brands – Methodology
INTRODUCTION | METHODOLOGY | REGION | COUNTRIES | OUTLOOK | APPENDIX
Final market volume, value, and
fiscal loss:
200,685 HL LAE
US$560 mn
US$88 mn
Approach 1: Residual analysis: domestic ethanol
production + imports –exports – industry
consumption (legal and illegal) – contraband to
other countries – ethanol seizures = potential
volume diverted to illegal alcoholic beverages
market
Approach 2: Interviews with beer producers to
ascertain the percentage of beer adulterated using water or by refilling with
low-priced beer
Approach 3: Interviews with pisco producers to
gauge the percentage of pisco produced outside
Peruvian technical norms
Approach 4: Store checks to ascertain prices of legal
and illegal alcoholic beverages in order to
calculate values in US$.
Approach 5: Cross-check of the category’s share of
the illegal market
Approach 6: Fiscal loss calculated based on illegal volumes, legal prices, and
excise taxes
Peru
Multiple approaches were used to estimate the market size in terms of volume, value, and fiscal loss
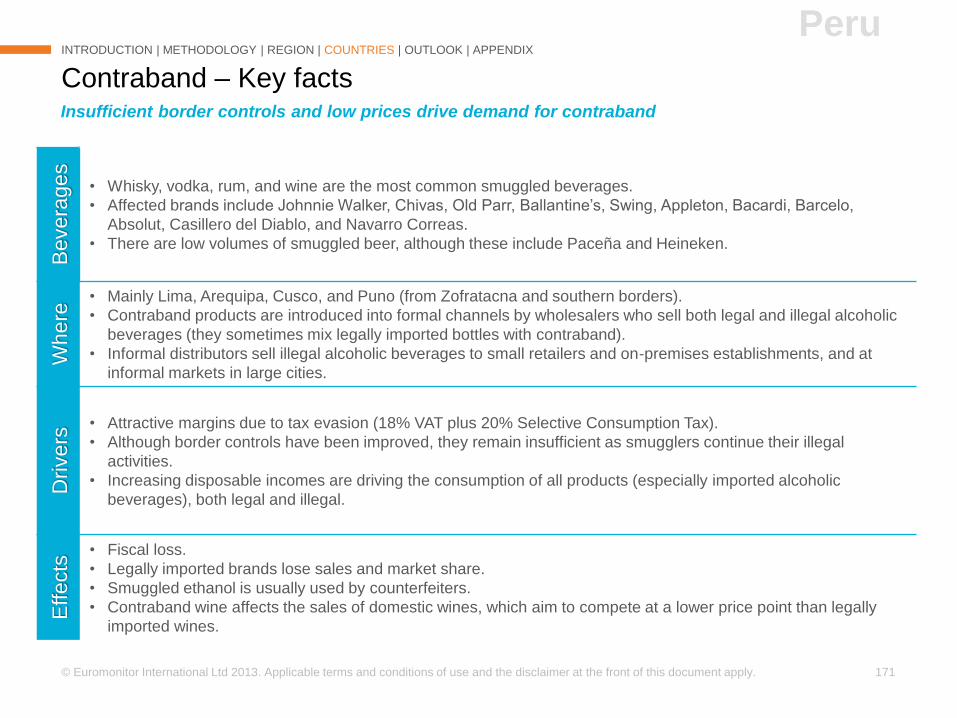
© Euromonitor International Ltd 2013. Applicable terms and conditions of use and the disclaimer at the front of this document apply. 171
Contraband – Key facts
INTRODUCTION | METHODOLOGY | REGION | COUNTRIES | OUTLOOK | APPENDIX
Insufficient border controls and low prices drive demand for contraband
PeruB
evera
ges
• Whisky, vodka, rum, and wine are the most common smuggled beverages.
• Affected brands include Johnnie Walker, Chivas, Old Parr, Ballantine’s, Swing, Appleton, Bacardi, Barcelo,
Absolut, Casillero del Diablo, and Navarro Correas.
• There are low volumes of smuggled beer, although these include Paceña and Heineken.
Where
• Mainly Lima, Arequipa, Cusco, and Puno (from Zofratacna and southern borders).
• Contraband products are introduced into formal channels by wholesalers who sell both legal and illegal alcoholic
beverages (they sometimes mix legally imported bottles with contraband).
• Informal distributors sell illegal alcoholic beverages to small retailers and on-premises establishments, and at
informal markets in large cities.
Drivers
• Attractive margins due to tax evasion (18% VAT plus 20% Selective Consumption Tax).
• Although border controls have been improved, they remain insufficient as smugglers continue their illegal
activities.
• Increasing disposable incomes are driving the consumption of all products (especially imported alcoholic
beverages), both legal and illegal.
Effects
• Fiscal loss.
• Legally imported brands lose sales and market share.
• Smuggled ethanol is usually used by counterfeiters.
• Contraband wine affects the sales of domestic wines, which aim to compete at a lower price point than legally
imported wines.
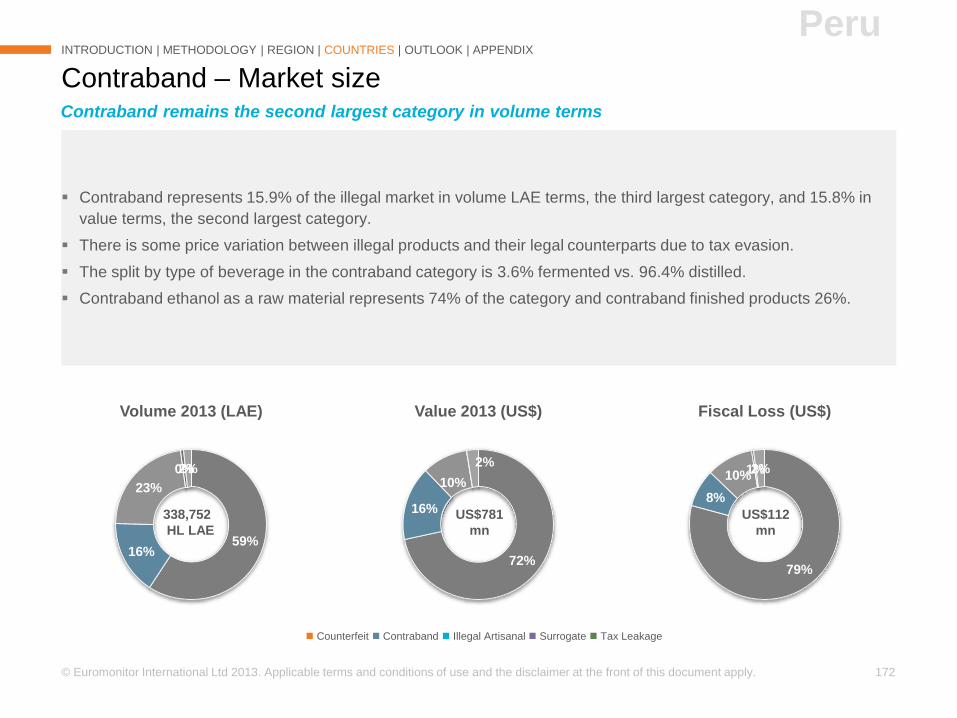
© Euromonitor International Ltd 2013. Applicable terms and conditions of use and the disclaimer at the front of this document apply. 172
79%
8%
10%1%2%
Fiscal Loss (US$)
72%
16%
10%
2%
Value 2013 (US$)
59%16%
23%
0%2%
Volume 2013 (LAE)
Contraband represents 15.9% of the illegal market in volume LAE terms, the third largest category, and 15.8% in
value terms, the second largest category.
There is some price variation between illegal products and their legal counterparts due to tax evasion.
The split by type of beverage in the contraband category is 3.6% fermented vs. 96.4% distilled.
Contraband ethanol as a raw material represents 74% of the category and contraband finished products 26%.
Contraband – Market size
INTRODUCTION | METHODOLOGY | REGION | COUNTRIES | OUTLOOK | APPENDIX
Counterfeit Contraband Illegal Artisanal Surrogate Tax Leakage
Contraband remains the second largest category in volume terms
Peru
338,752
HL LAE
US$781
mn
US$112
mn
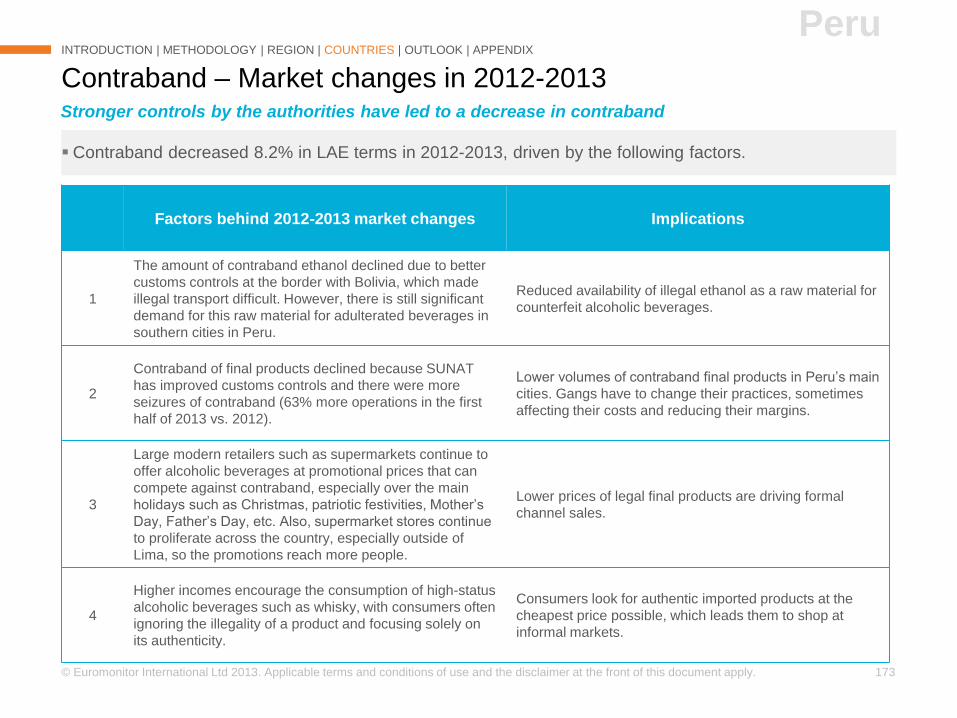
© Euromonitor International Ltd 2013. Applicable terms and conditions of use and the disclaimer at the front of this document apply. 173
Contraband decreased 8.2% in LAE terms in 2012-2013, driven by the following factors.
Contraband – Market changes in 2012-2013
Factors behind 2012-2013 market changes Implications
1
The amount of contraband ethanol declined due to better
customs controls at the border with Bolivia, which made
illegal transport difficult. However, there is still significant
demand for this raw material for adulterated beverages in
southern cities in Peru.
Reduced availability of illegal ethanol as a raw material for
counterfeit alcoholic beverages.
2
Contraband of final products declined because SUNAT
has improved customs controls and there were more
seizures of contraband (63% more operations in the first
half of 2013 vs. 2012).
Lower volumes of contraband final products in Peru’s main
cities. Gangs have to change their practices, sometimes
affecting their costs and reducing their margins.
3
Large modern retailers such as supermarkets continue to
offer alcoholic beverages at promotional prices that can
compete against contraband, especially over the main
holidays such as Christmas, patriotic festivities, Mother’s
Day, Father’s Day, etc. Also, supermarket stores continue
to proliferate across the country, especially outside of
Lima, so the promotions reach more people.
Lower prices of legal final products are driving formal
channel sales.
4
Higher incomes encourage the consumption of high-status
alcoholic beverages such as whisky, with consumers often
ignoring the illegality of a product and focusing solely on
its authenticity.
Consumers look for authentic imported products at the
cheapest price possible, which leads them to shop at
informal markets.
INTRODUCTION | METHODOLOGY | REGION | COUNTRIES | OUTLOOK | APPENDIX
Peru
Stronger controls by the authorities have led to a decrease in contraband
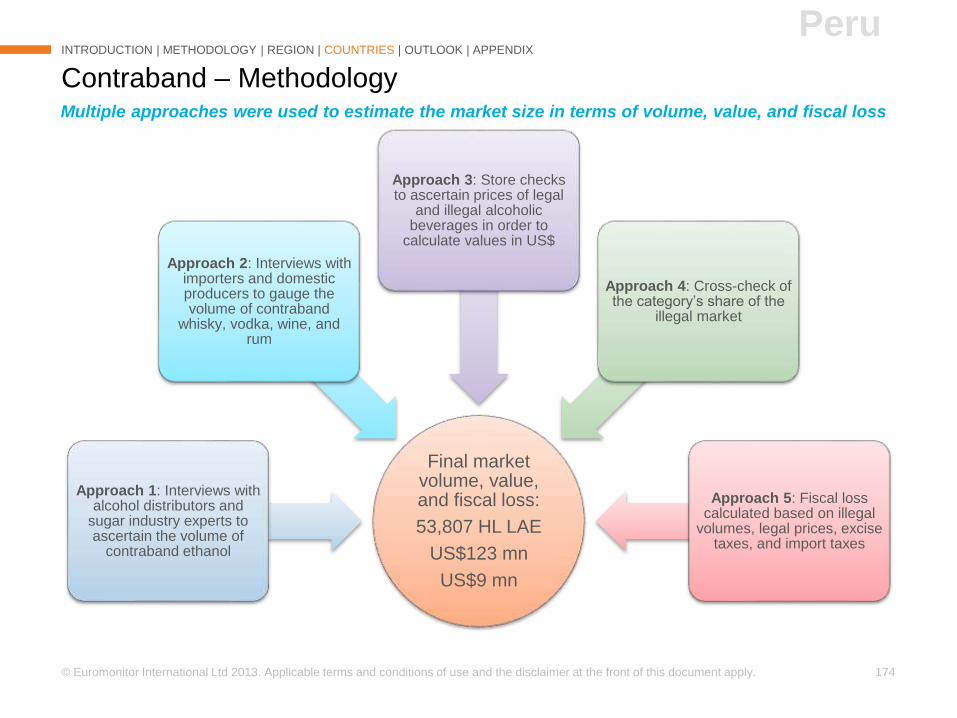
© Euromonitor International Ltd 2013. Applicable terms and conditions of use and the disclaimer at the front of this document apply. 174
Contraband – Methodology
INTRODUCTION | METHODOLOGY | REGION | COUNTRIES | OUTLOOK | APPENDIX
Final market volume, value, and fiscal loss:
53,807 HL LAE
US$123 mn
US$9 mn
Approach 1: Interviews with alcohol distributors and
sugar industry experts to ascertain the volume of
contraband ethanol
Approach 2: Interviews with importers and domestic producers to gauge the volume of contraband
whisky, vodka, wine, and rum
Approach 3: Store checks to ascertain prices of legal
and illegal alcoholic beverages in order to
calculate values in US$
Approach 4: Cross-check of the category’s share of the
illegal market
Approach 5: Fiscal loss calculated based on illegal
volumes, legal prices, excise taxes, and import taxes
Multiple approaches were used to estimate the market size in terms of volume, value, and fiscal loss
Peru
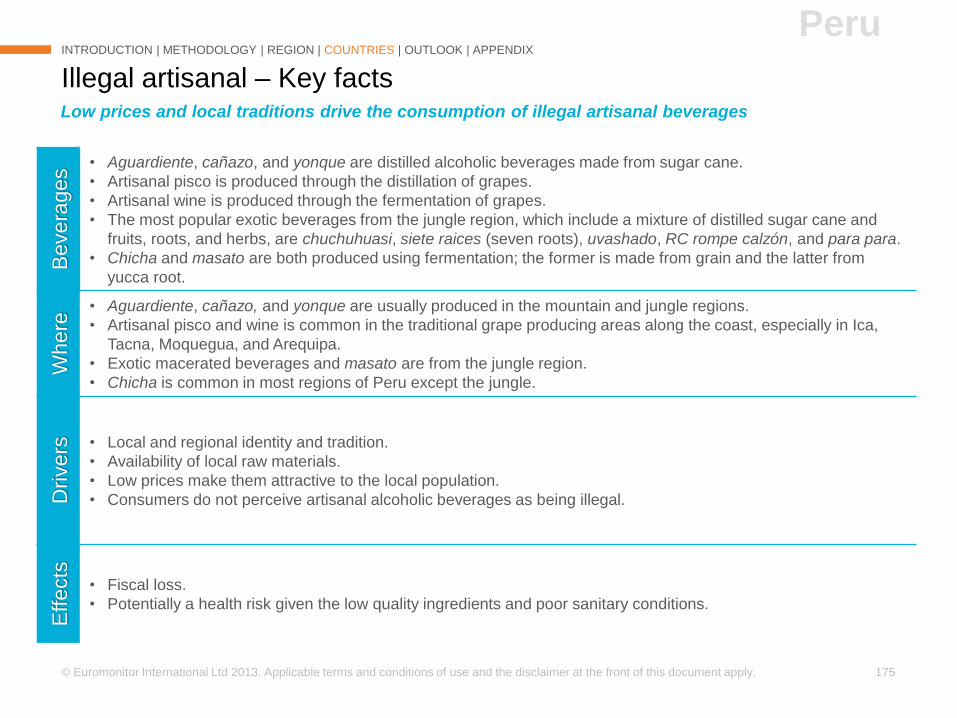
© Euromonitor International Ltd 2013. Applicable terms and conditions of use and the disclaimer at the front of this document apply. 175
Illegal artisanal – Key facts
INTRODUCTION | METHODOLOGY | REGION | COUNTRIES | OUTLOOK | APPENDIX
Low prices and local traditions drive the consumption of illegal artisanal beverages
PeruB
evera
ges
• Aguardiente, cañazo, and yonque are distilled alcoholic beverages made from sugar cane.
• Artisanal pisco is produced through the distillation of grapes.
• Artisanal wine is produced through the fermentation of grapes.
• The most popular exotic beverages from the jungle region, which include a mixture of distilled sugar cane and
fruits, roots, and herbs, are chuchuhuasi, siete raices (seven roots), uvashado, RC rompe calzón, and para para.
• Chicha and masato are both produced using fermentation; the former is made from grain and the latter from
yucca root.
Where
• Aguardiente, cañazo, and yonque are usually produced in the mountain and jungle regions.
• Artisanal pisco and wine is common in the traditional grape producing areas along the coast, especially in Ica,
Tacna, Moquegua, and Arequipa.
• Exotic macerated beverages and masato are from the jungle region.
• Chicha is common in most regions of Peru except the jungle.
Dri
vers • Local and regional identity and tradition.
• Availability of local raw materials.
• Low prices make them attractive to the local population.
• Consumers do not perceive artisanal alcoholic beverages as being illegal.
Effects
• Fiscal loss.
• Potentially a health risk given the low quality ingredients and poor sanitary conditions.
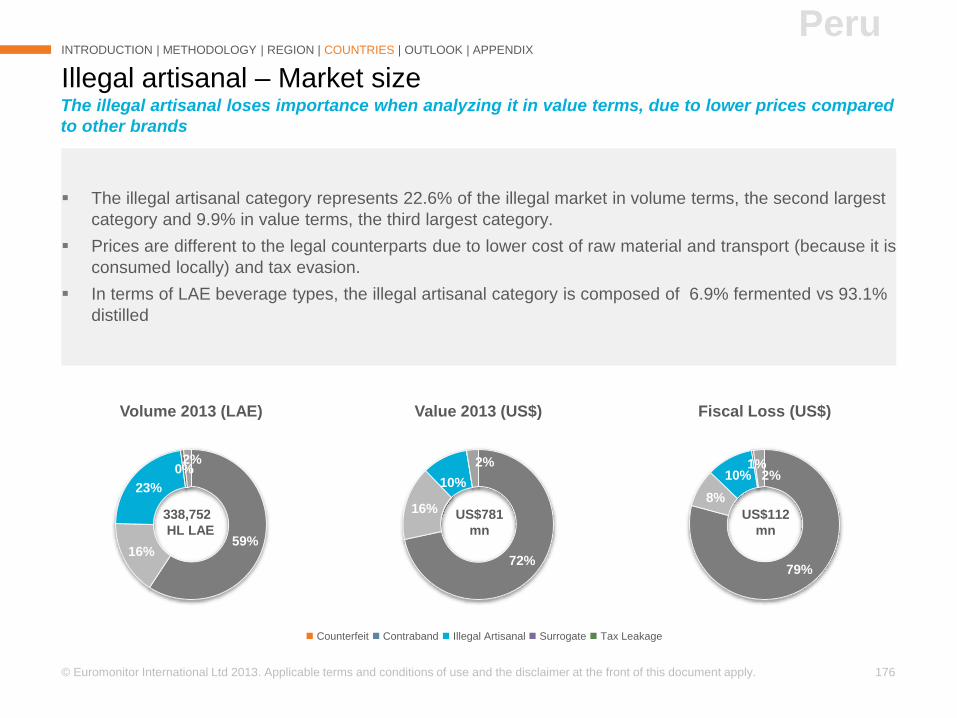
© Euromonitor International Ltd 2013. Applicable terms and conditions of use and the disclaimer at the front of this document apply. 176
79%
8%
10%1%
2%
Fiscal Loss (US$)
72%
16%
10%
2%
Value 2013 (US$)
59%16%
23%
0%2%
Volume 2013 (LAE)
The illegal artisanal category represents 22.6% of the illegal market in volume terms, the second largest
category and 9.9% in value terms, the third largest category.
Prices are different to the legal counterparts due to lower cost of raw material and transport (because it is
consumed locally) and tax evasion.
In terms of LAE beverage types, the illegal artisanal category is composed of 6.9% fermented vs 93.1%
distilled
Illegal artisanal – Market size
INTRODUCTION | METHODOLOGY | REGION | COUNTRIES | OUTLOOK | APPENDIX
Counterfeit Contraband Illegal Artisanal Surrogate Tax Leakage
The illegal artisanal loses importance when analyzing it in value terms, due to lower prices compared
to other brands
Peru
338,752
HL LAE
US$781
mn
US$112
mn
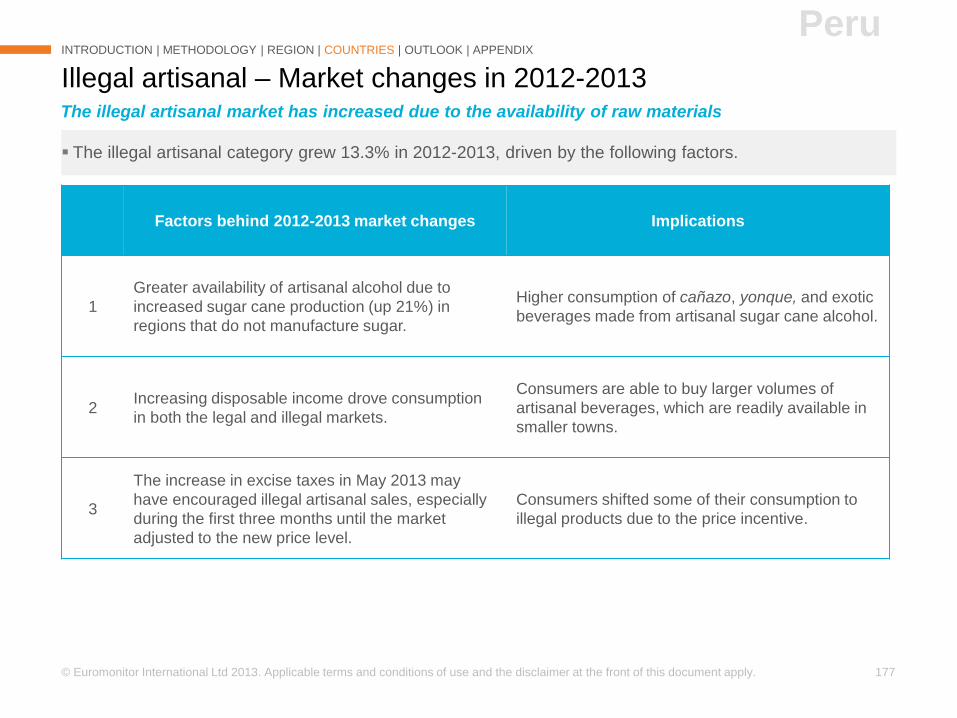
© Euromonitor International Ltd 2013. Applicable terms and conditions of use and the disclaimer at the front of this document apply. 177
The illegal artisanal category grew 13.3% in 2012-2013, driven by the following factors.
Illegal artisanal – Market changes in 2012-2013
Factors behind 2012-2013 market changes Implications
1
Greater availability of artisanal alcohol due to
increased sugar cane production (up 21%) in
regions that do not manufacture sugar.
Higher consumption of cañazo, yonque, and exotic
beverages made from artisanal sugar cane alcohol.
2Increasing disposable income drove consumption
in both the legal and illegal markets.
Consumers are able to buy larger volumes of
artisanal beverages, which are readily available in
smaller towns.
3
The increase in excise taxes in May 2013 may
have encouraged illegal artisanal sales, especially
during the first three months until the market
adjusted to the new price level.
Consumers shifted some of their consumption to
illegal products due to the price incentive.
INTRODUCTION | METHODOLOGY | REGION | COUNTRIES | OUTLOOK | APPENDIX
Peru
The illegal artisanal market has increased due to the availability of raw materials
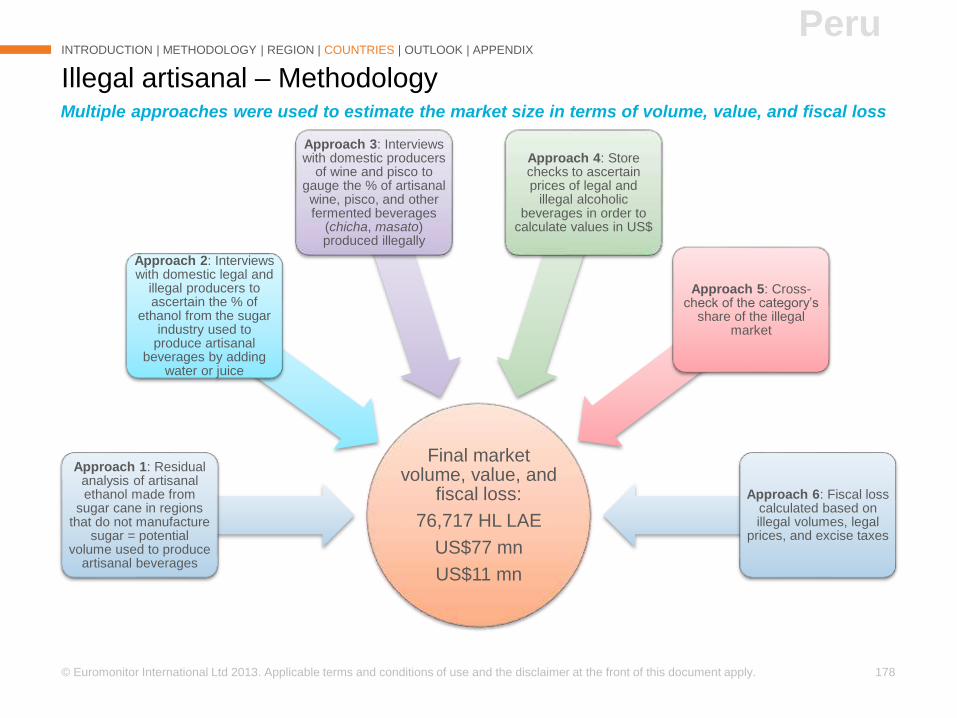
© Euromonitor International Ltd 2013. Applicable terms and conditions of use and the disclaimer at the front of this document apply. 178
Illegal artisanal – Methodology
INTRODUCTION | METHODOLOGY | REGION | COUNTRIES | OUTLOOK | APPENDIX
Final market volume, value, and
fiscal loss:
76,717 HL LAE
US$77 mn
US$11 mn
Approach 1: Residual analysis of artisanal ethanol made from
sugar cane in regions that do not manufacture
sugar = potential volume used to produce
artisanal beverages
Approach 2: Interviews with domestic legal and
illegal producers to ascertain the % of
ethanol from the sugar industry used to
produce artisanal beverages by adding
water or juice
Approach 3: Interviews with domestic producers
of wine and pisco to gauge the % of artisanal wine, pisco, and other fermented beverages
(chicha, masato) produced illegally
Approach 4: Store checks to ascertain prices of legal and
illegal alcoholic beverages in order to
calculate values in US$
Approach 5: Cross-check of the category’s
share of the illegal market
Approach 6: Fiscal loss calculated based on illegal volumes, legal
prices, and excise taxes
Multiple approaches were used to estimate the market size in terms of volume, value, and fiscal loss
Peru
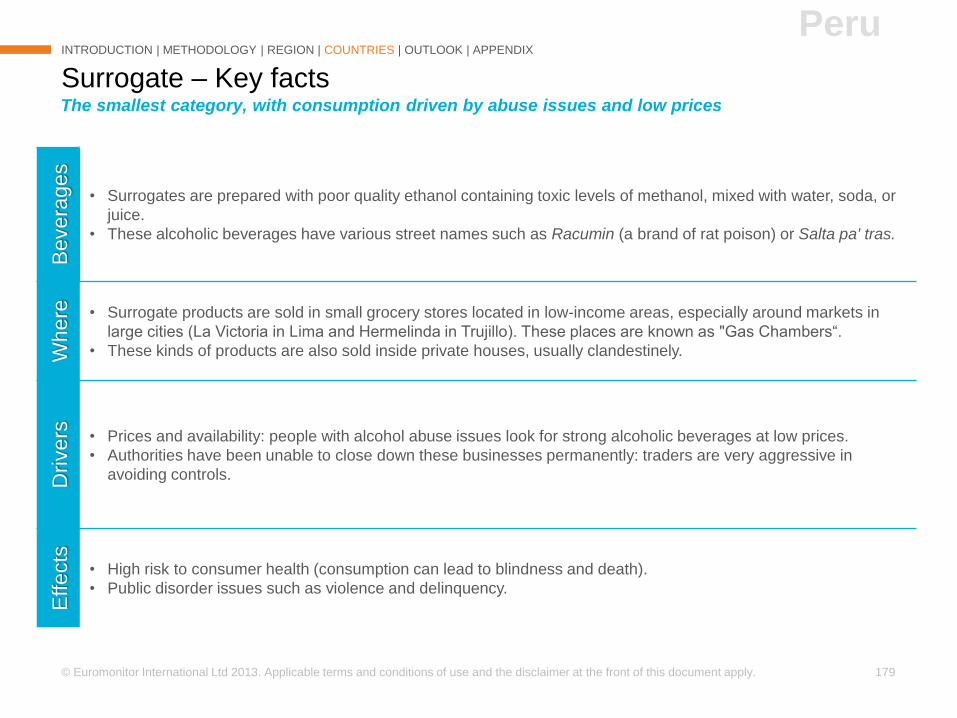
© Euromonitor International Ltd 2013. Applicable terms and conditions of use and the disclaimer at the front of this document apply. 179
Surrogate – Key facts
INTRODUCTION | METHODOLOGY | REGION | COUNTRIES | OUTLOOK | APPENDIX
The smallest category, with consumption driven by abuse issues and low prices
PeruB
evera
ges
• Surrogates are prepared with poor quality ethanol containing toxic levels of methanol, mixed with water, soda, or
juice.
• These alcoholic beverages have various street names such as Racumin (a brand of rat poison) or Salta pa' tras.
Where • Surrogate products are sold in small grocery stores located in low-income areas, especially around markets in
large cities (La Victoria in Lima and Hermelinda in Trujillo). These places are known as "Gas Chambers“.
• These kinds of products are also sold inside private houses, usually clandestinely.
Dri
vers • Prices and availability: people with alcohol abuse issues look for strong alcoholic beverages at low prices.
• Authorities have been unable to close down these businesses permanently: traders are very aggressive in
avoiding controls.
Effects
• High risk to consumer health (consumption can lead to blindness and death).
• Public disorder issues such as violence and delinquency.
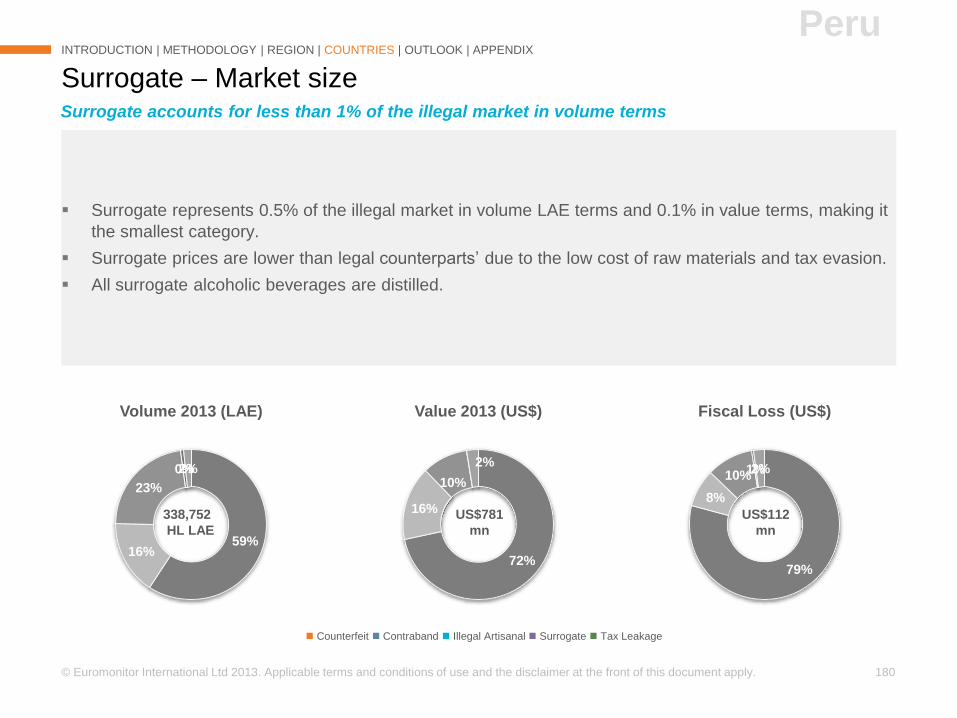
© Euromonitor International Ltd 2013. Applicable terms and conditions of use and the disclaimer at the front of this document apply. 180
79%
8%
10%1%2%
Fiscal Loss (US$)
72%
16%
10%
2%
Value 2013 (US$)
59%16%
23%
0%2%
Volume 2013 (LAE)
Surrogate represents 0.5% of the illegal market in volume LAE terms and 0.1% in value terms, making it
the smallest category.
Surrogate prices are lower than legal counterparts’ due to the low cost of raw materials and tax evasion.
All surrogate alcoholic beverages are distilled.
Surrogate – Market size
INTRODUCTION | METHODOLOGY | REGION | COUNTRIES | OUTLOOK | APPENDIX
Counterfeit Contraband Illegal Artisanal Surrogate Tax Leakage
Surrogate accounts for less than 1% of the illegal market in volume terms
Peru
338,752
HL LAE
US$781
mn
US$112
mn
© Euromonitor International Ltd 2013. Applicable terms and conditions of use and the disclaimer at the front of this document apply. 181
The surrogate category shrank 30.8% in 2012-2013, driven by the following factors.
Surrogate – Market changes in 2012-2013
Factors behind 2012-2013 market changes Implications
1
News about dangerous health consequences has
discouraged new consumers from buying surrogate
beverages; instead, they prefer other low-price
options such as counterfeit or artisanal beverages.
The user population (and consumed volume) is
shrinking over time as long-term consumers die
from health complications and new potential
consumers seek less harmful alternatives.
INTRODUCTION | METHODOLOGY | REGION | COUNTRIES | OUTLOOK | APPENDIX
Peru
Higher awareness of the danger associated with surrogate consumption has led this category to fall
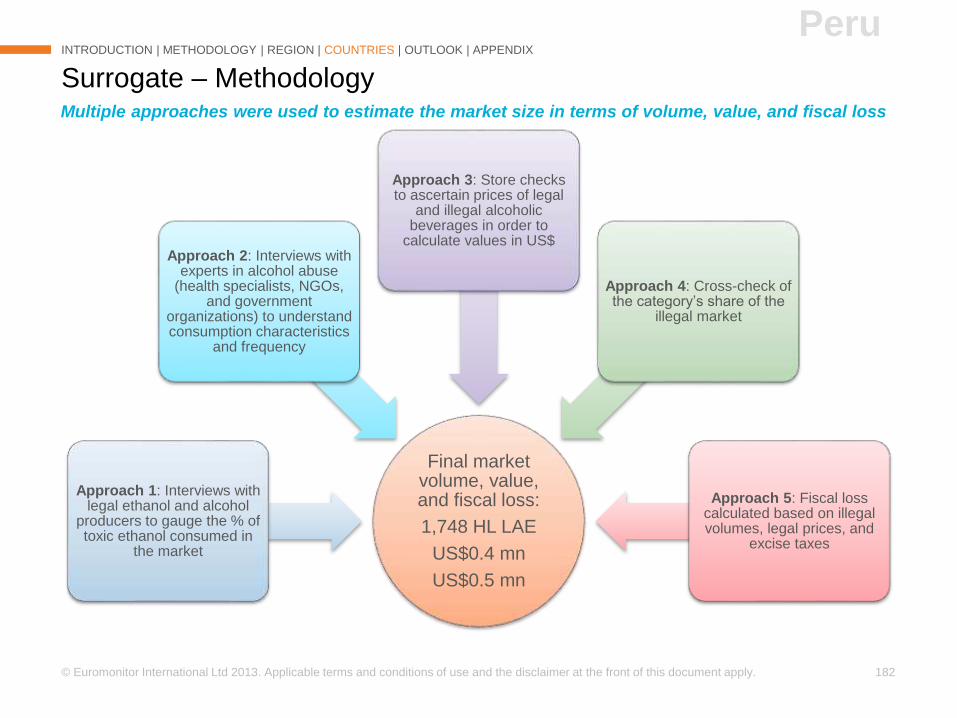
© Euromonitor International Ltd 2013. Applicable terms and conditions of use and the disclaimer at the front of this document apply. 182
Surrogate – Methodology
INTRODUCTION | METHODOLOGY | REGION | COUNTRIES | OUTLOOK | APPENDIX
Final market volume, value, and fiscal loss:
1,748 HL LAE
US$0.4 mn
US$0.5 mn
Approach 1: Interviews with legal ethanol and alcohol
producers to gauge the % of toxic ethanol consumed in
the market
Approach 2: Interviews with experts in alcohol abuse
(health specialists, NGOs, and government
organizations) to understand consumption characteristics
and frequency
Approach 3: Store checks to ascertain prices of legal
and illegal alcoholic beverages in order to
calculate values in US$
Approach 4: Cross-check of the category’s share of the
illegal market
Approach 5: Fiscal loss calculated based on illegal volumes, legal prices, and
excise taxes
Multiple approaches were used to estimate the market size in terms of volume, value, and fiscal loss
Peru
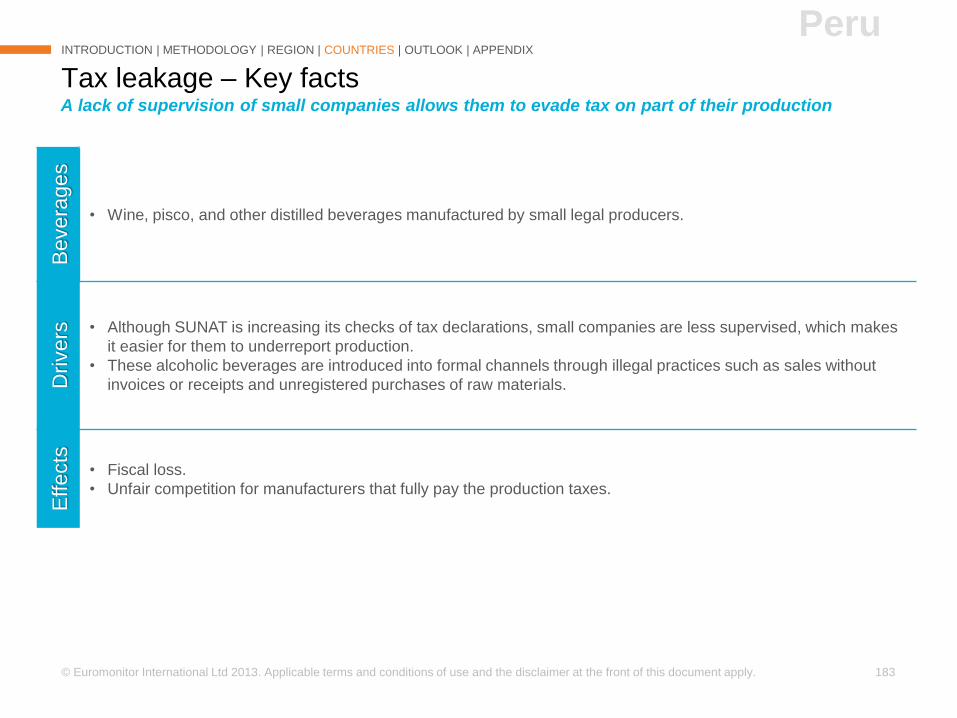
© Euromonitor International Ltd 2013. Applicable terms and conditions of use and the disclaimer at the front of this document apply. 183
Tax leakage – Key facts
INTRODUCTION | METHODOLOGY | REGION | COUNTRIES | OUTLOOK | APPENDIX
A lack of supervision of small companies allows them to evade tax on part of their production
PeruB
evera
ges
• Wine, pisco, and other distilled beverages manufactured by small legal producers.
Drivers • Although SUNAT is increasing its checks of tax declarations, small companies are less supervised, which makes
it easier for them to underreport production.
• These alcoholic beverages are introduced into formal channels through illegal practices such as sales without
invoices or receipts and unregistered purchases of raw materials.
Effects
• Fiscal loss.
• Unfair competition for manufacturers that fully pay the production taxes.
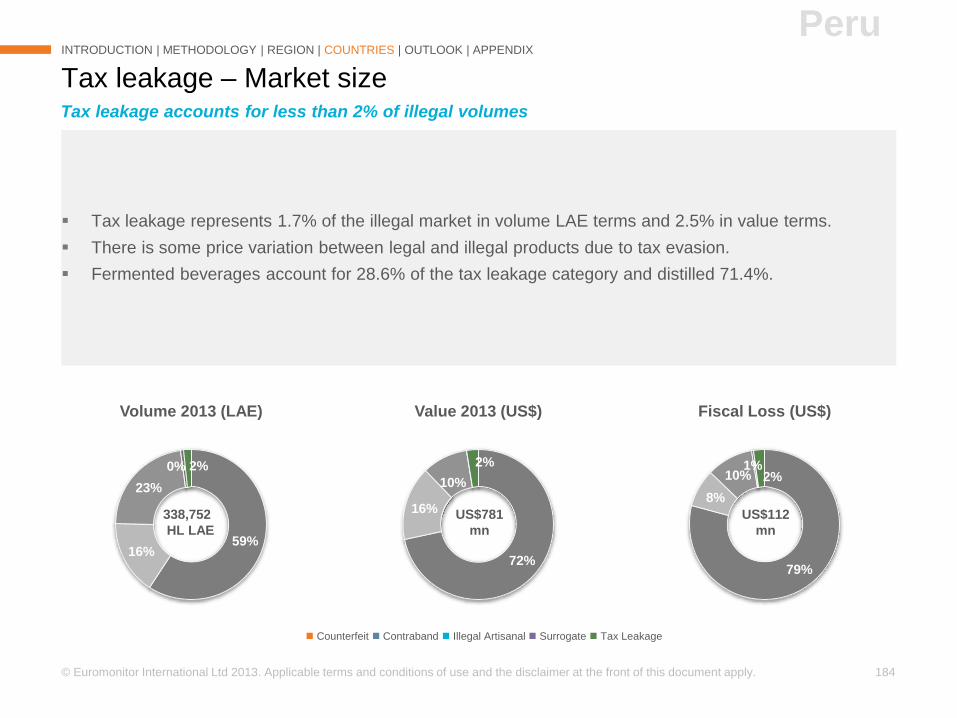
© Euromonitor International Ltd 2013. Applicable terms and conditions of use and the disclaimer at the front of this document apply. 184
79%
8%
10%1%
2%
Fiscal Loss (US$)
72%
16%
10%
2%
Value 2013 (US$)
59%16%
23%
0% 2%
Volume 2013 (LAE)
Tax leakage represents 1.7% of the illegal market in volume LAE terms and 2.5% in value terms.
There is some price variation between legal and illegal products due to tax evasion.
Fermented beverages account for 28.6% of the tax leakage category and distilled 71.4%.
Tax leakage – Market size
INTRODUCTION | METHODOLOGY | REGION | COUNTRIES | OUTLOOK | APPENDIX
Counterfeit Contraband Illegal Artisanal Surrogate Tax Leakage
Tax leakage accounts for less than 2% of illegal volumes
Peru
338,752
HL LAE
US$781
mn
US$112
mn
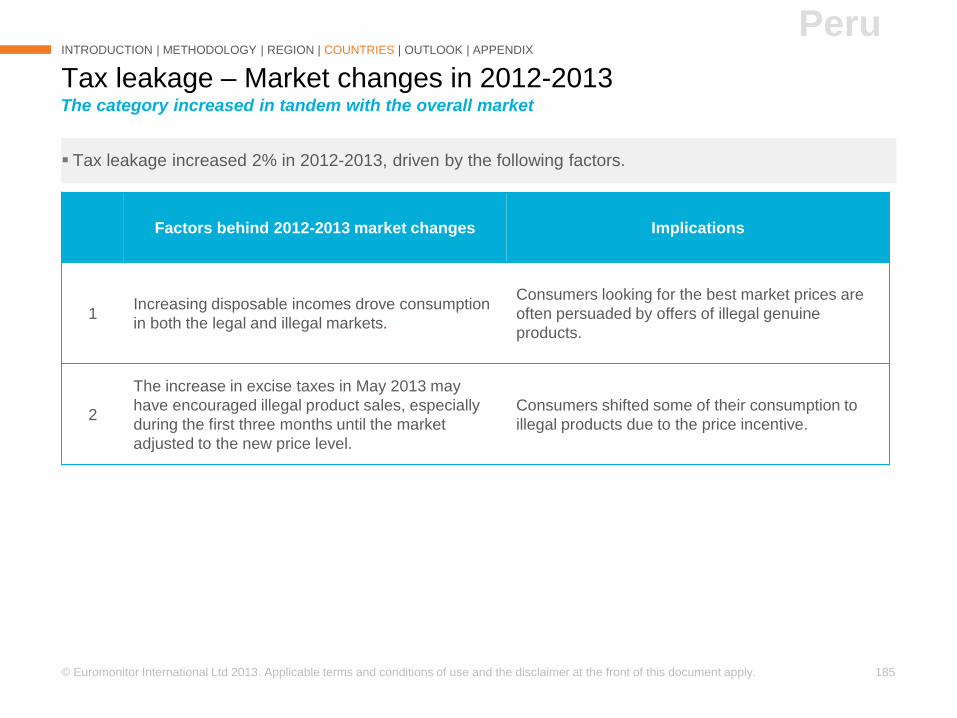
© Euromonitor International Ltd 2013. Applicable terms and conditions of use and the disclaimer at the front of this document apply. 185
Tax leakage increased 2% in 2012-2013, driven by the following factors.
Tax leakage – Market changes in 2012-2013
Factors behind 2012-2013 market changes Implications
1Increasing disposable incomes drove consumption
in both the legal and illegal markets.
Consumers looking for the best market prices are
often persuaded by offers of illegal genuine
products.
2
The increase in excise taxes in May 2013 may
have encouraged illegal product sales, especially
during the first three months until the market
adjusted to the new price level.
Consumers shifted some of their consumption to
illegal products due to the price incentive.
INTRODUCTION | METHODOLOGY | REGION | COUNTRIES | OUTLOOK | APPENDIX
Peru
The category increased in tandem with the overall market
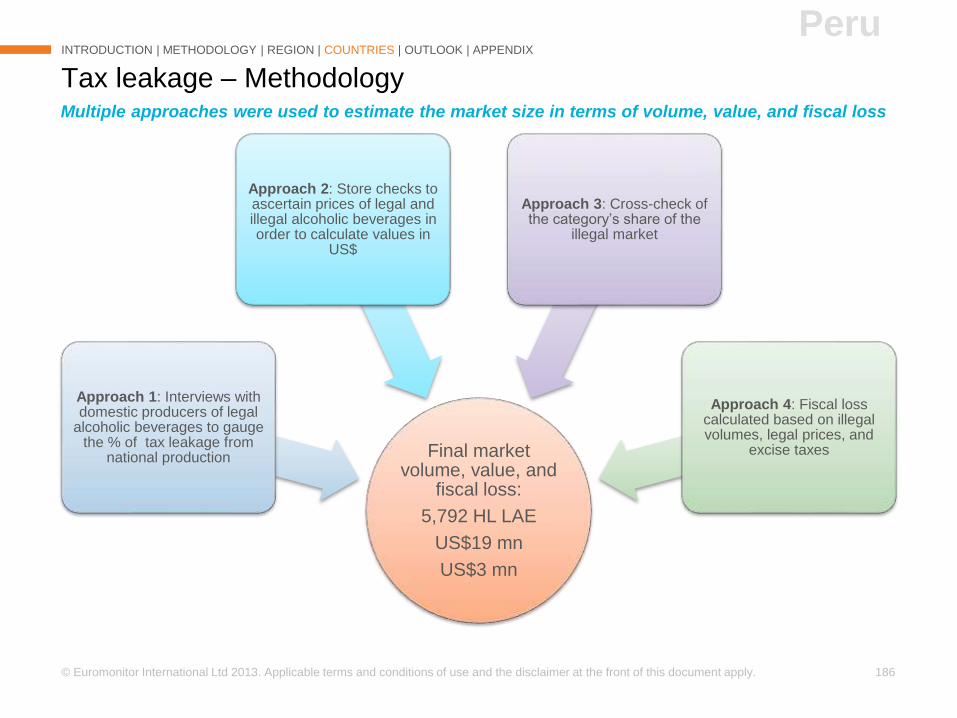
© Euromonitor International Ltd 2013. Applicable terms and conditions of use and the disclaimer at the front of this document apply. 186
Tax leakage – Methodology
INTRODUCTION | METHODOLOGY | REGION | COUNTRIES | OUTLOOK | APPENDIX
Final market volume, value, and
fiscal loss:
5,792 HL LAE
US$19 mn
US$3 mn
Approach 1: Interviews with domestic producers of legal
alcoholic beverages to gauge the % of tax leakage from
national production
Approach 2: Store checks to ascertain prices of legal and illegal alcoholic beverages in order to calculate values in
US$
Approach 3: Cross-check of the category’s share of the
illegal market
Approach 4: Fiscal loss calculated based on illegal volumes, legal prices, and
excise taxes
Multiple approaches were used to estimate the market size in terms of volume, value, and fiscal loss
Peru
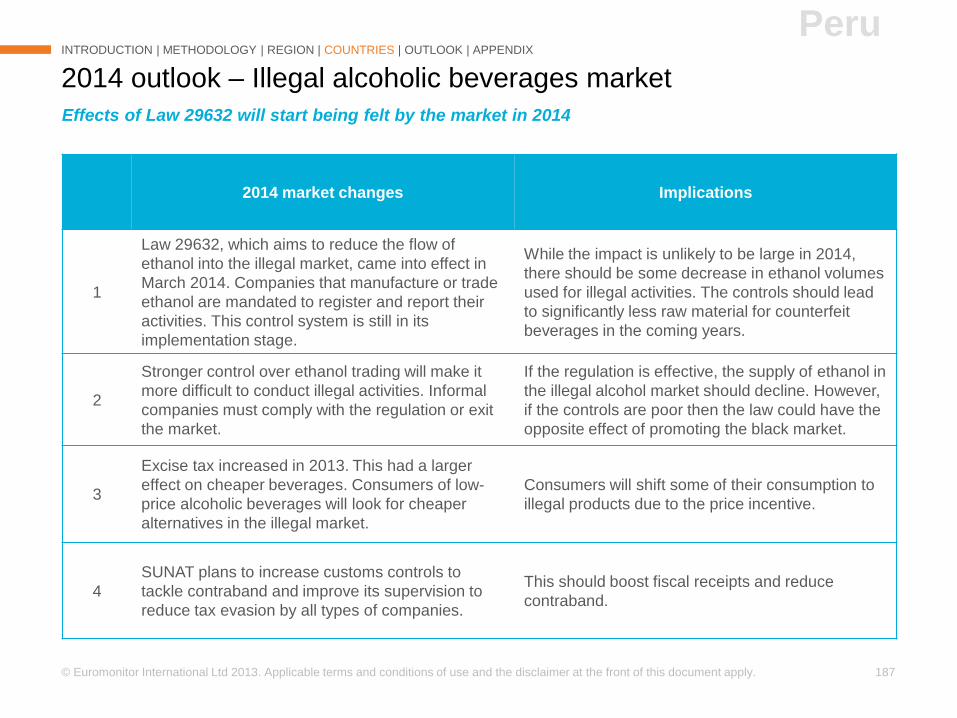
© Euromonitor International Ltd 2013. Applicable terms and conditions of use and the disclaimer at the front of this document apply. 187
2014 outlook – Illegal alcoholic beverages market
INTRODUCTION | METHODOLOGY | REGION | COUNTRIES | OUTLOOK | APPENDIX
2014 market changes Implications
1
Law 29632, which aims to reduce the flow of
ethanol into the illegal market, came into effect in
March 2014. Companies that manufacture or trade
ethanol are mandated to register and report their
activities. This control system is still in its
implementation stage.
While the impact is unlikely to be large in 2014,
there should be some decrease in ethanol volumes
used for illegal activities. The controls should lead
to significantly less raw material for counterfeit
beverages in the coming years.
2
Stronger control over ethanol trading will make it
more difficult to conduct illegal activities. Informal
companies must comply with the regulation or exit
the market.
If the regulation is effective, the supply of ethanol in
the illegal alcohol market should decline. However,
if the controls are poor then the law could have the
opposite effect of promoting the black market.
3
Excise tax increased in 2013. This had a larger
effect on cheaper beverages. Consumers of low-
price alcoholic beverages will look for cheaper
alternatives in the illegal market.
Consumers will shift some of their consumption to
illegal products due to the price incentive.
4
SUNAT plans to increase customs controls to
tackle contraband and improve its supervision to
reduce tax evasion by all types of companies.
This should boost fiscal receipts and reduce
contraband.
Effects of Law 29632 will start being felt by the market in 2014
Peru
INTRODUCTION
METHODOLOGY
ANALYSIS - REGION
ANALYSIS - COUNTRIES
2014 OUTLOOK
APPENDIX
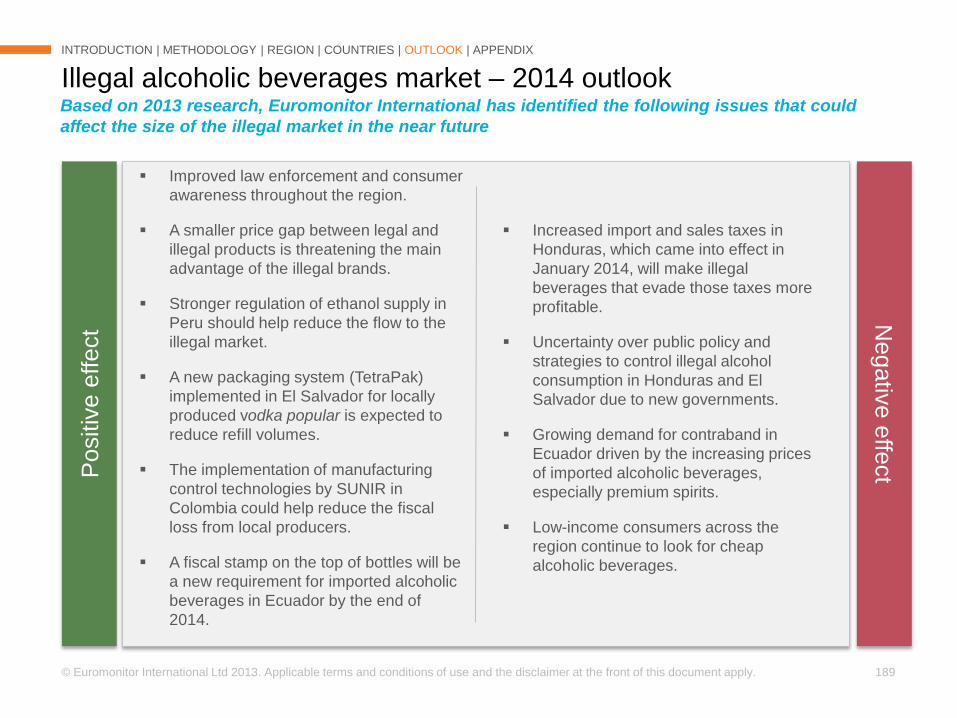
© Euromonitor International Ltd 2013. Applicable terms and conditions of use and the disclaimer at the front of this document apply. 189
Illegal alcoholic beverages market – 2014 outlook
INTRODUCTION | METHODOLOGY | REGION | COUNTRIES | OUTLOOK | APPENDIX
Improved law enforcement and consumer
awareness throughout the region.
A smaller price gap between legal and
illegal products is threatening the main
advantage of the illegal brands.
Stronger regulation of ethanol supply in
Peru should help reduce the flow to the
illegal market.
A new packaging system (TetraPak)
implemented in El Salvador for locally
produced vodka popular is expected to
reduce refill volumes.
The implementation of manufacturing
control technologies by SUNIR in
Colombia could help reduce the fiscal
loss from local producers.
A fiscal stamp on the top of bottles will be
a new requirement for imported alcoholic
beverages in Ecuador by the end of
2014.
Increased import and sales taxes in
Honduras, which came into effect in
January 2014, will make illegal
beverages that evade those taxes more
profitable.
Uncertainty over public policy and
strategies to control illegal alcohol
consumption in Honduras and El
Salvador due to new governments.
Growing demand for contraband in
Ecuador driven by the increasing prices
of imported alcoholic beverages,
especially premium spirits.
Low-income consumers across the
region continue to look for cheap
alcoholic beverages.
Based on 2013 research, Euromonitor International has identified the following issues that could
affect the size of the illegal market in the near future
Positiv
e e
ffe
ct
Negativ
e e
ffect
INTRODUCTION
METHODOLOGY
ANALYSIS - REGION
ANALYSIS - COUNTRIES
2014 OUTLOOK
APPENDIX
APPENDIX
• ILLEGAL MARKET SIZE IN TERMS OF
VALUE (LEGAL RSP)
• METHODOLOGY NOTES – 2013
• PICTURES
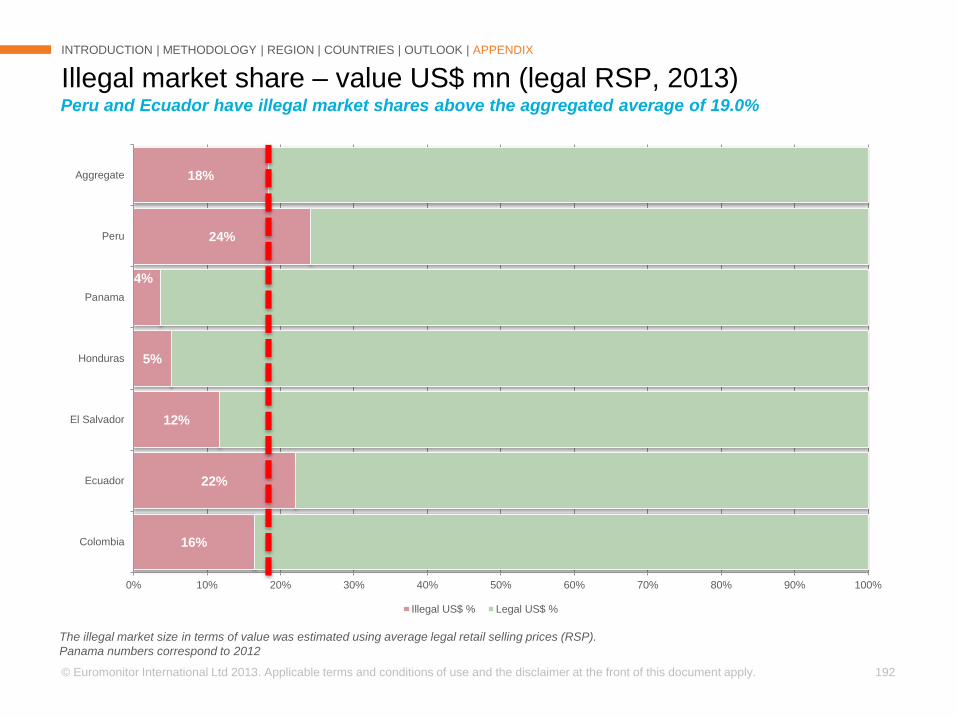
© Euromonitor International Ltd 2013. Applicable terms and conditions of use and the disclaimer at the front of this document apply. 192
16%
22%
12%
5%
4%
24%
18%
0% 10% 20% 30% 40% 50% 60% 70% 80% 90% 100%
Colombia
Ecuador
El Salvador
Honduras
Panama
Peru
Aggregate
Illegal US$ % Legal US$ %
Illegal market share – value US$ mn (legal RSP, 2013)
INTRODUCTION | METHODOLOGY | REGION | COUNTRIES | OUTLOOK | APPENDIX
Peru and Ecuador have illegal market shares above the aggregated average of 19.0%
The illegal market size in terms of value was estimated using average legal retail selling prices (RSP).
Panama numbers correspond to 2012
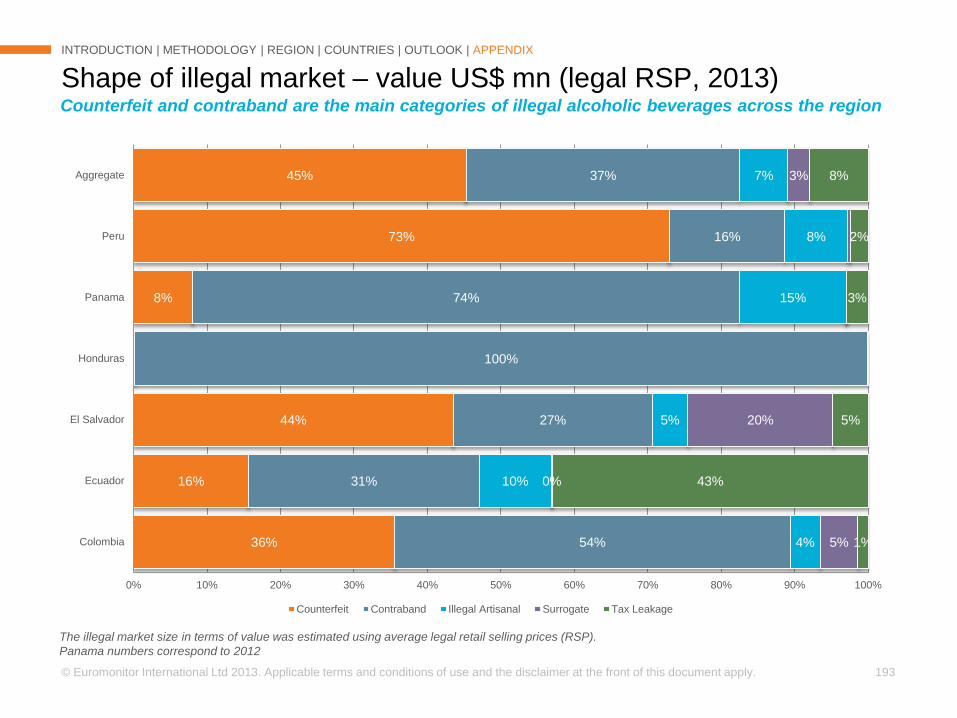
© Euromonitor International Ltd 2013. Applicable terms and conditions of use and the disclaimer at the front of this document apply. 193
Shape of illegal market – value US$ mn (legal RSP, 2013)
INTRODUCTION | METHODOLOGY | REGION | COUNTRIES | OUTLOOK | APPENDIX
Counterfeit and contraband are the main categories of illegal alcoholic beverages across the region
36%
16%
44%
8%
73%
45%
54%
31%
27%
100%
74%
16%
37%
4%
10%
5%
15%
8%
7%
5%
0%
20%
3%
1%
43%
5%
3%
2%
8%
0% 10% 20% 30% 40% 50% 60% 70% 80% 90% 100%
Colombia
Ecuador
El Salvador
Honduras
Panama
Peru
Aggregate
Counterfeit Contraband Illegal Artisanal Surrogate Tax Leakage
The illegal market size in terms of value was estimated using average legal retail selling prices (RSP).
Panama numbers correspond to 2012

APPENDIX
• ILLEGAL MARKET SIZE IN TERMS OF
VALUE (LEGAL RSP)
• METHODOLOGY NOTES – 2013
• PICTURES
323INTERVIEWS AND STORE
VISITS
14WEEKS OF RESEARCH
Field research
1.3xMORE STORE VISITS THAN
IN PREVIOUS STUDY
(158 THIS TIME VS. 121
PREVIOUSLY)
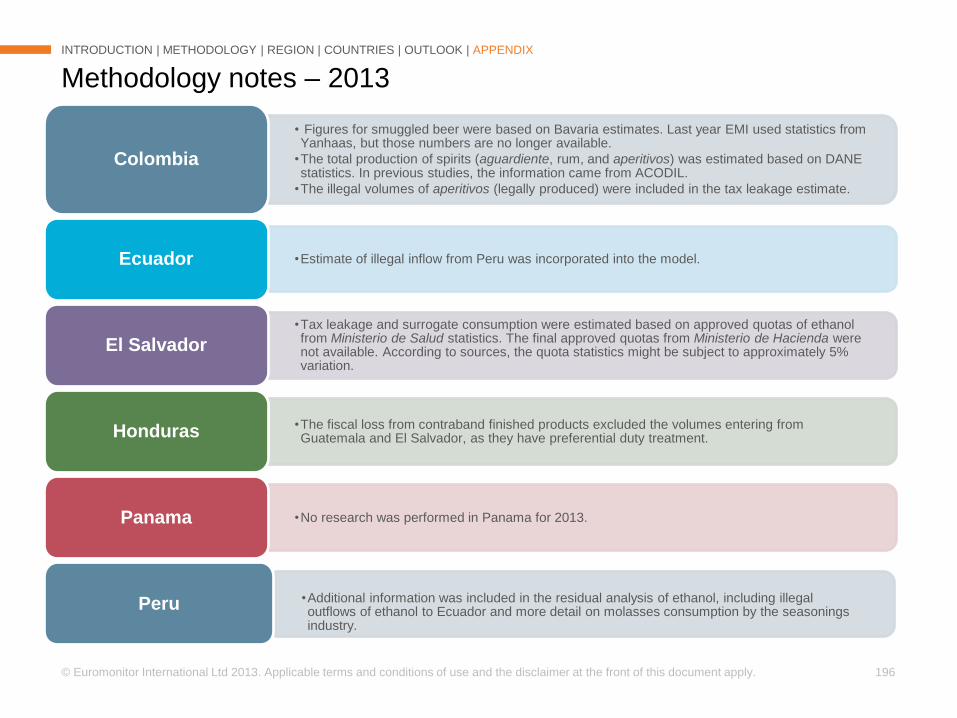
© Euromonitor International Ltd 2013. Applicable terms and conditions of use and the disclaimer at the front of this document apply. 196
Methodology notes – 2013
INTRODUCTION | METHODOLOGY | REGION | COUNTRIES | OUTLOOK | APPENDIX
• Figures for smuggled beer were based on Bavaria estimates. Last year EMI used statistics from Yanhaas, but those numbers are no longer available.
•The total production of spirits (aguardiente, rum, and aperitivos) was estimated based on DANE statistics. In previous studies, the information came from ACODIL.
•The illegal volumes of aperitivos (legally produced) were included in the tax leakage estimate.
Colombia
•Estimate of illegal inflow from Peru was incorporated into the model.Ecuador
•Tax leakage and surrogate consumption were estimated based on approved quotas of ethanol from Ministerio de Salud statistics. The final approved quotas from Ministerio de Hacienda were not available. According to sources, the quota statistics might be subject to approximately 5% variation.
El Salvador
•The fiscal loss from contraband finished products excluded the volumes entering from Guatemala and El Salvador, as they have preferential duty treatment.Honduras
•No research was performed in Panama for 2013.Panama
•Additional information was included in the residual analysis of ethanol, including illegal outflows of ethanol to Ecuador and more detail on molasses consumption by the seasonings industry.
Peru
APPENDIX
• ILLEGAL MARKET SIZE IN TERMS OF
VALUE (LEGAL RSP)
• METHODOLOGY NOTES – 2013
• PICTURES
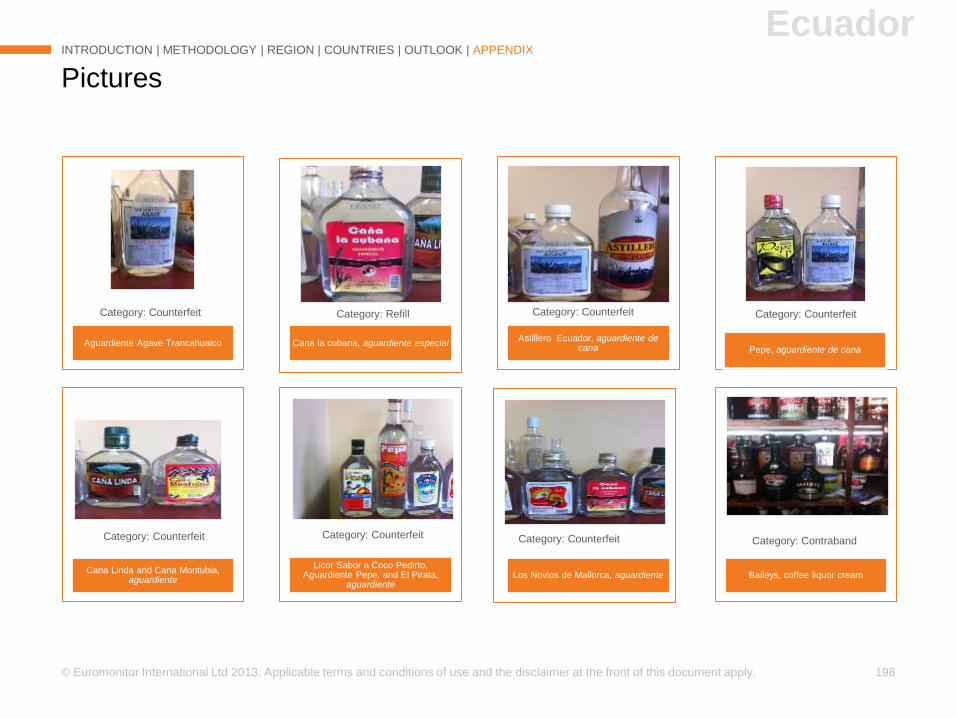
© Euromonitor International Ltd 2013. Applicable terms and conditions of use and the disclaimer at the front of this document apply. 198
Pictures
INTRODUCTION | METHODOLOGY | REGION | COUNTRIES | OUTLOOK | APPENDIX
Aguardiente Agave Trancahuaico
Category: Counterfeit
Cana la cubana, aguardiente especialAstillero Ecuador, aguardiente de
cana Pepe, aguardiente de cana
Category: Counterfeit
Cana Linda and Cana Montubia, aguardiente
Licor Sabor a Coco Pedirto, Aguardiente Pepe, and El Pirata,
aguardienteLos Novios de Mallorca, aguardiente Baileys, coffee liquor cream
Category: Contraband
Category: Refill Category: Counterfeit
Category: Counterfeit Category: CounterfeitCategory: Counterfeit
Ecuador
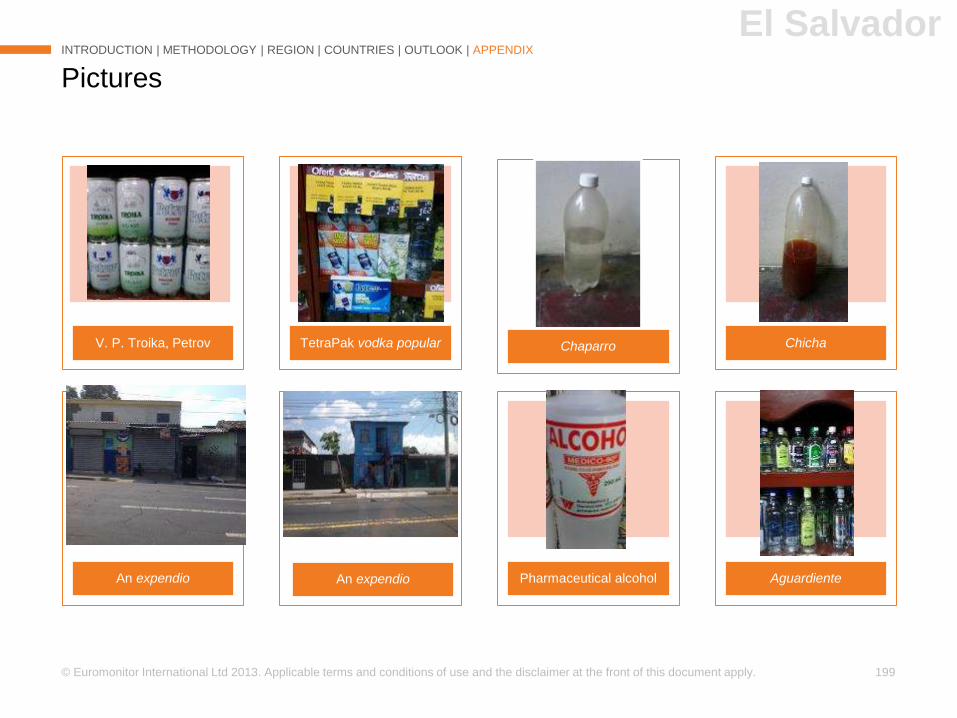
© Euromonitor International Ltd 2013. Applicable terms and conditions of use and the disclaimer at the front of this document apply. 199
Pictures
INTRODUCTION | METHODOLOGY | REGION | COUNTRIES | OUTLOOK | APPENDIX
V. P. Troika, Petrov TetraPak vodka popular Chaparro Chicha
An expendio An expendio Pharmaceutical alcohol Aguardiente
El Salvador
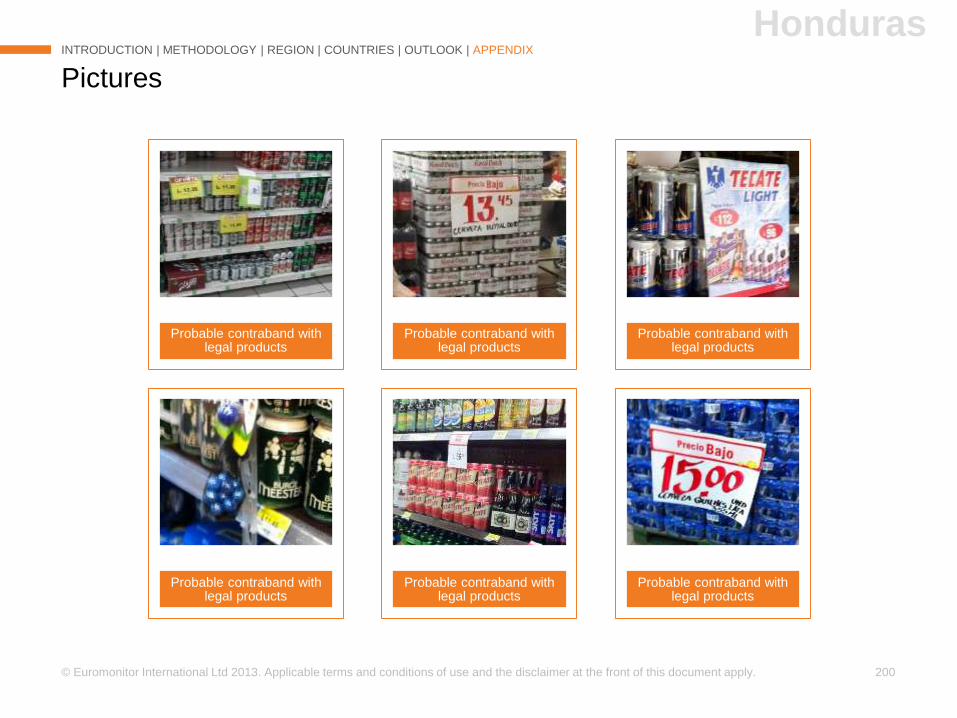
© Euromonitor International Ltd 2013. Applicable terms and conditions of use and the disclaimer at the front of this document apply. 200
Pictures
INTRODUCTION | METHODOLOGY | REGION | COUNTRIES | OUTLOOK | APPENDIX
Probable contraband with legal products
Probable contraband with legal products
Probable contraband with legal products
Probable contraband with legal products
Probable contraband with legal products
Probable contraband with legal products
Honduras
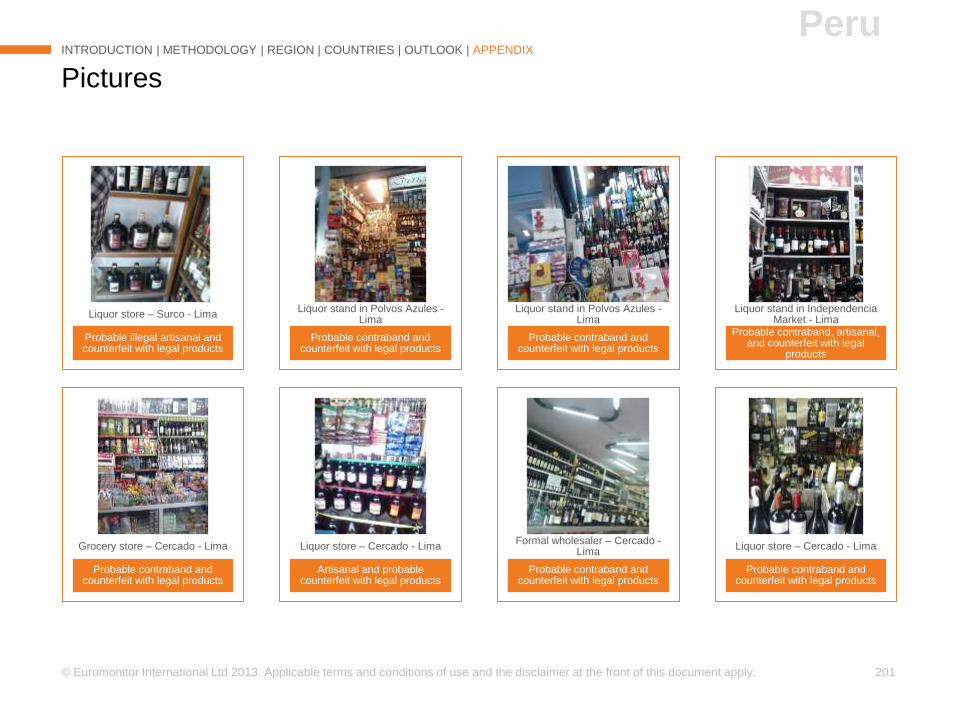
© Euromonitor International Ltd 2013. Applicable terms and conditions of use and the disclaimer at the front of this document apply. 201
Pictures
INTRODUCTION | METHODOLOGY | REGION | COUNTRIES | OUTLOOK | APPENDIX
Probable illegal artisanal and counterfeit with legal products
Liquor store – Surco - Lima
Probable contraband and counterfeit with legal products
Liquor stand in Polvos Azules -Lima
Probable contraband and counterfeit with legal products
Liquor stand in Polvos Azules -Lima
Probable contraband, artisanal, and counterfeit with legal
products
Liquor stand in IndependenciaMarket - Lima
Probable contraband and counterfeit with legal products
Grocery store – Cercado - Lima
Artisanal and probable counterfeit with legal products
Liquor store – Cercado - Lima
Probable contraband and counterfeit with legal products
Formal wholesaler – Cercado -Lima
Probable contraband and counterfeit with legal products
Liquor store – Cercado - Lima
Peru
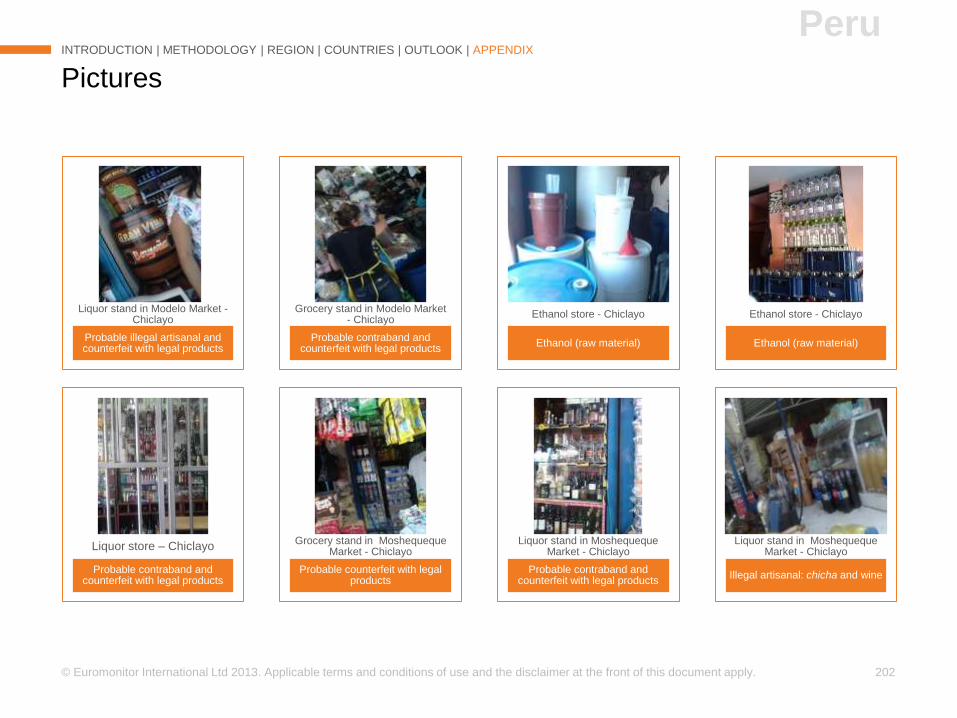
© Euromonitor International Ltd 2013. Applicable terms and conditions of use and the disclaimer at the front of this document apply. 202
Pictures
INTRODUCTION | METHODOLOGY | REGION | COUNTRIES | OUTLOOK | APPENDIX
Probable illegal artisanal and counterfeit with legal products
Liquor stand in Modelo Market -Chiclayo
Probable contraband and counterfeit with legal products
Grocery stand in Modelo Market - Chiclayo
Ethanol (raw material)
Ethanol store - Chiclayo
Ethanol (raw material)
Ethanol store - Chiclayo
Probable contraband and counterfeit with legal products
Liquor store – Chiclayo
Probable counterfeit with legal products
Grocery stand in MoshequequeMarket - Chiclayo
Probable contraband and counterfeit with legal products
Liquor stand in MoshequequeMarket - Chiclayo
Illegal artisanal: chicha and wine
Liquor stand in MoshequequeMarket - Chiclayo
Peru

CONTACT DETAILSLearn more about Euromonitor International’s custom research offerings