Embed Size (px)
DESCRIPTION
2008-10-22
Citation preview

INVESTOR DAYOctober 22nd, 2008
2INVESTOR DAY October 2008
Important Disclaimer
Veolia Environnement is a corporation listed on the NYSE and Euronext Paris. This document contains “forward-looking statements” within the meaning of the provisions of the U.S. Private Securities Litigation Reform Act of 1995. Such forward-looking statements are not guarantees of future performance. Actual results may differ materially from the forward-looking statements as a result of a number of risks and uncertainties, many of which are outside our control, including but not limited to: the risk of suffering reduced profits or losses as a result of intense competition, the risk that changes in energy prices and taxes may reduce Veolia Environnement’s profits, the risk that governmental authorities could terminate or modify some of Veolia Environnement’s contracts, the risk that acquisitions may not provide the benefits that Veolia Environnement hopes to achieve, the risk that Veolia Environnement’s compliance with environmental laws may become more costly in the future, the risk that currency exchange rate fluctuations may negatively affect Veolia Environnement’s financial results and the price of its shares, the risk that Veolia Environnement may incur environmental liability in connection with its past, present and future operations, as well as the risks described in the documents Veolia Environnement has filed with the U.S. Securities and Exchange Commission. Veolia Environnement does not undertake, nor does it have, any obligation to provide updates or to revise any forward-looking statements. Investors and security holders may obtain a free copy of documents filed by Veolia Environnement with the U.S. Securities and Exchange Commission from Veolia Environnement.
3INVESTOR DAY October 2008
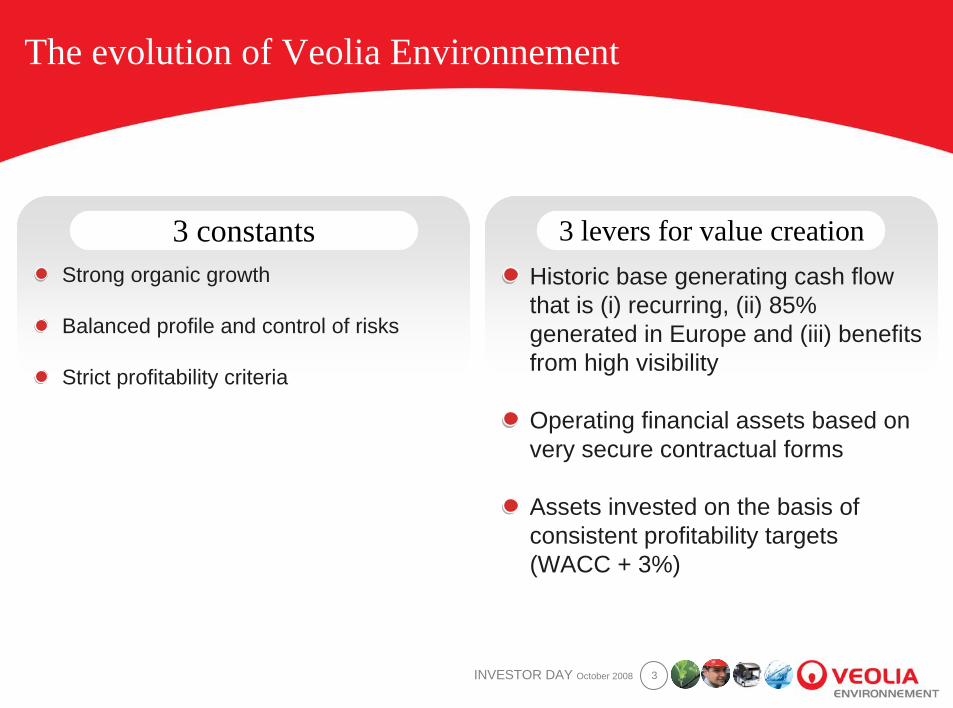
3 constants
The evolution of Veolia Environnement
Strong organic growth
Balanced profile and control of risks
Strict profitability criteria
3 levers for value creationHistoric base generating cash flow that is (i) recurring, (ii) 85% generated in Europe and (iii) benefits from high visibility
Operating financial assets based on very secure contractual forms
Assets invested on the basis of consistent profitability targets(WACC + 3%)
INVESTOR DAYOctober 22nd, 2008
Review of the evolution of the Group1
5INVESTOR DAY October 2008
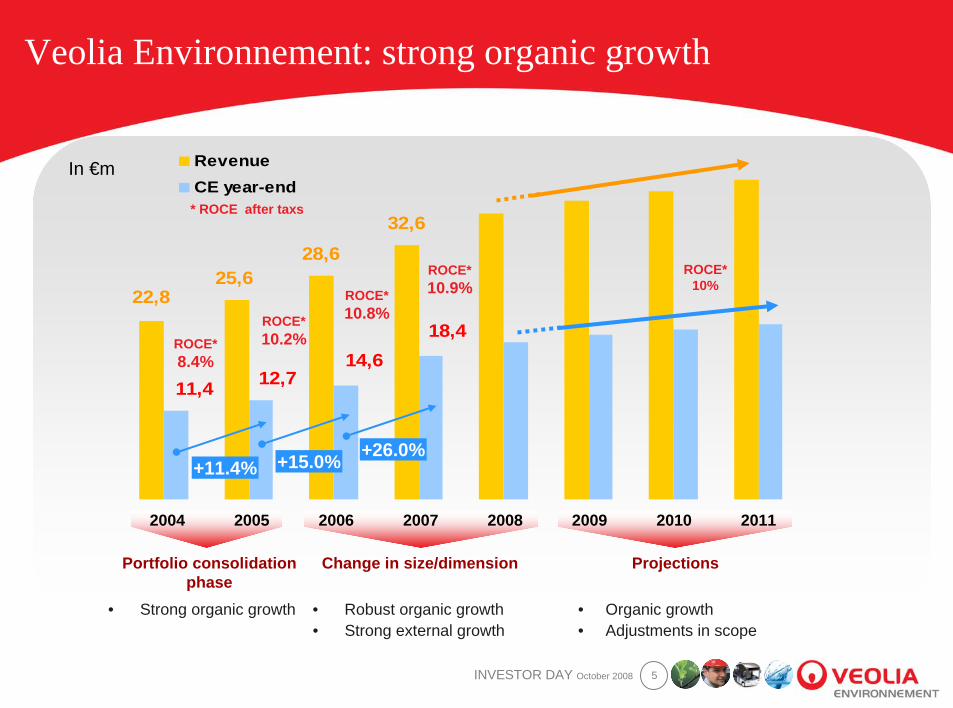
Veolia Environnement: strong organic growth
32,628,6
25,622,8
18,414,6
12,711,4
RevenueCE year-end
2004 2005 2006 2007 2008 2009 2010 2011
ROCE*8.4%
ROCE*10.2%
ROCE*10.8%
ROCE*10.9%
Portfolio consolidation phase
Change in size/dimension Projections
• Strong organic growth • Robust organic growth• Strong external growth
• Organic growth• Adjustments in scope
* ROCE after taxs
ROCE*10%
+11.4% +15.0% +26.0%
In €m
6INVESTOR DAY October 2008
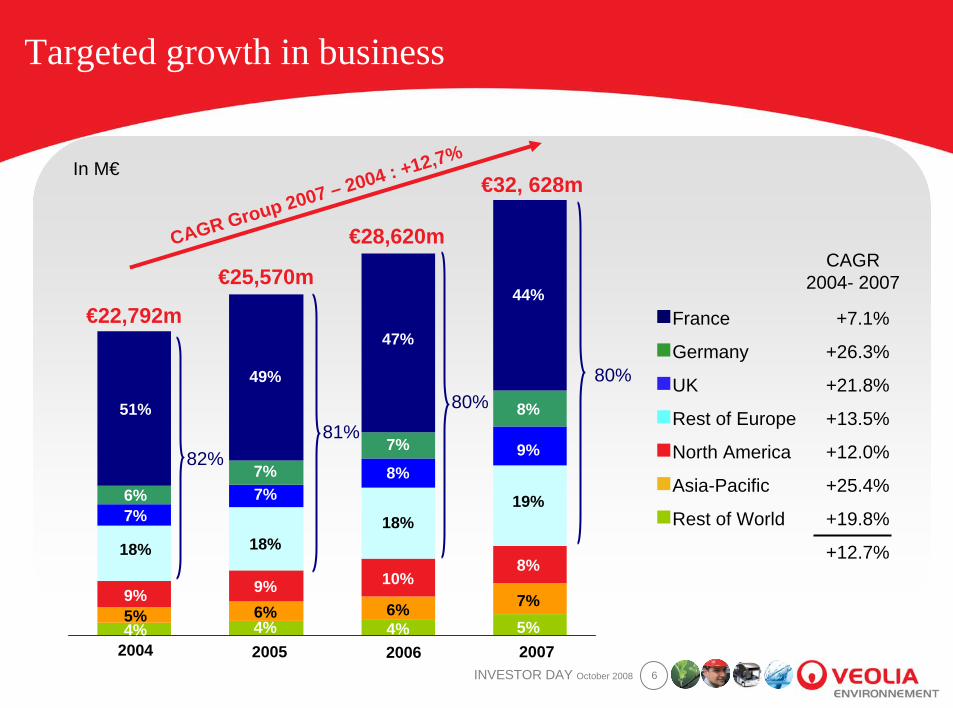
Targeted growth in business
In M€
France
Germany
UK
Rest of Europe
North America
Asia-Pacific
Rest of World
2004 2005 2006 2007
€22,792m
€25,570m
€28,620m
€32, 628m
CAGR Group 2007 – 2004 : +12,7%
51%
6%7%
18%
9%5%4%
49%
7%7%
18%
9%6%4%
47%
7%
8%
18%
10%
6%4%
44%
8%
9%
19%
8%
7%5%
80%80%
81%82%
CAGR2004- 2007
+7.1%
+26.3%
+21.8%
+13.5%
+12.0%
+25.4%
+19.8%
+12.7%
7INVESTOR DAY October 2008
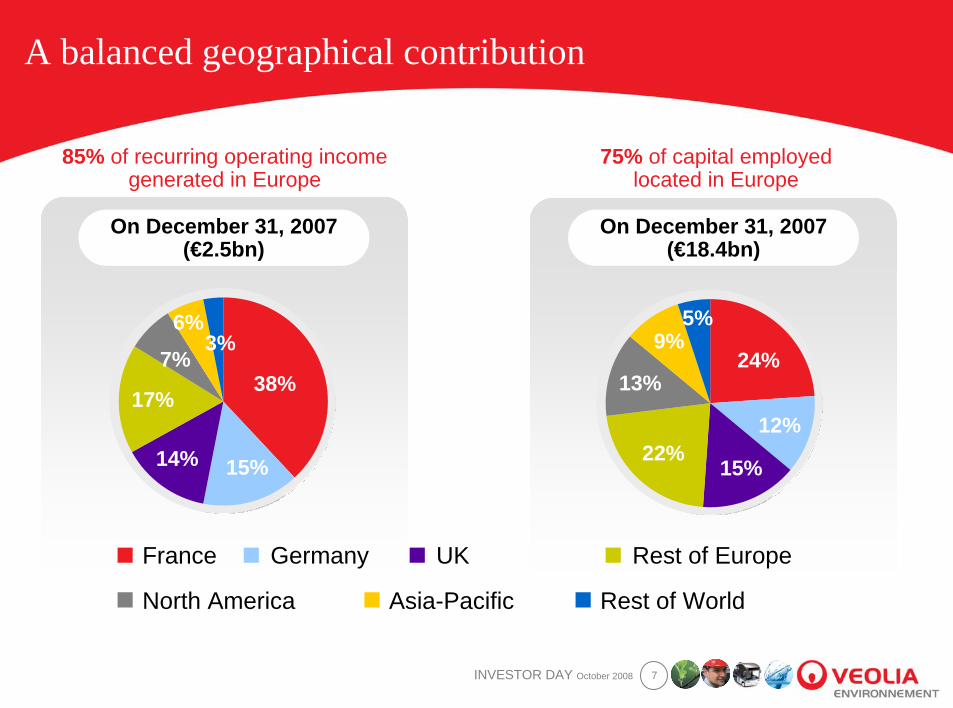
A balanced geographical contribution
On December 31, 2007(€2.5bn)
France Germany UK Rest of Europe
North America Asia-Pacific Rest of World
85% of recurring operating income generated in Europe
75% of capital employedlocated in Europe
On December 31, 2007(€18.4bn)
38%
15%14%
17%
7%
6%3%
24%
12%
15%22%
13%
9%5%
8INVESTOR DAY October 2008
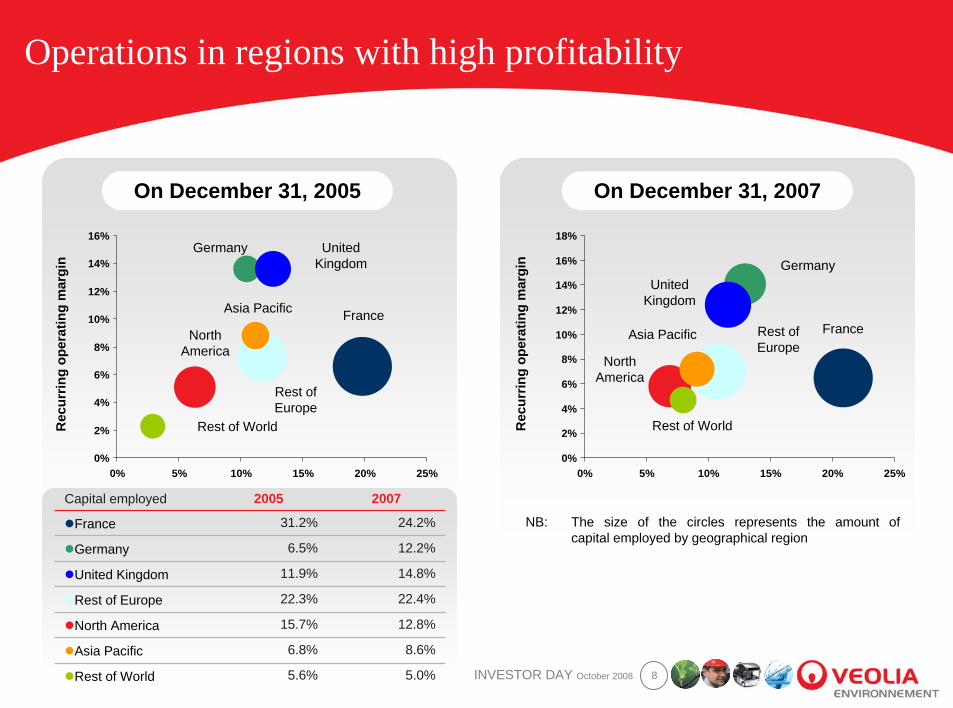
Operations in regions with high profitability
On December 31, 2005
0%
2%
4%
6%
8%
10%
12%
14%
16%
0% 5% 10% 15% 20% 25%
Rec
urrin
gop
erat
ing
mar
gin
On December 31, 2007
0%
2%
4%
6%
8%
10%
12%
14%
16%
18%
0% 5% 10% 15% 20% 25%
Rec
urrin
gop
erat
ing
mar
gin
United Kingdom
Germany
France
Rest of Europe
Asia Pacific
NorthAmerica
Rest of World
United Kingdom
Germany
FranceRest of Europe
Asia Pacific
NorthAmerica
Rest of World
5.0%5.6%Rest of World
8.6%6.8%Asia Pacific
12.8%15.7%North America
22.4%22.3%Rest of Europe
14.8%11.9%United Kingdom
12.2%6.5%Germany
24.2%31.2%France
20072005Capital employed
NB: The size of the circles represents the amount ofcapital employed by geographical region

INVESTOR DAYOctober 22nd, 2008
Levers for value creation2
10INVESTOR DAY October 2008
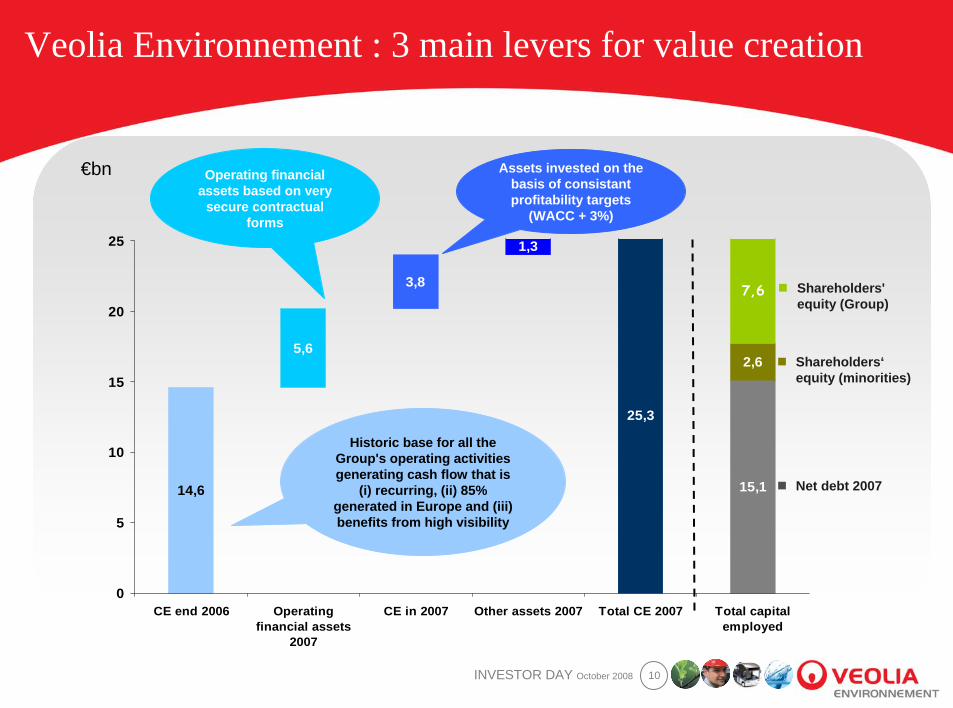
Veolia Environnement : 3 main levers for value creation
15,1
25,3
14,6
2,6
1,3
3,8
5,6
7,6
0
5
10
15
20
25
CE end 2006 Operatingfinancial assets
2007
CE in 2007 Other assets 2007 Total CE 2007 Total capitalemployed
Shareholders' equity (Group)
Historic base for all the Group's operating activities generating cash flow that is
(i) recurring, (ii) 85% generated in Europe and (iii) benefits from high visibility
Operating financial assets based on very
secure contractual forms
Assets invested on the basis of consistantprofitability targets
(WACC + 3%)
€bn
Net debt 2007
Shareholders‘equity (minorities)
11INVESTOR DAY October 2008
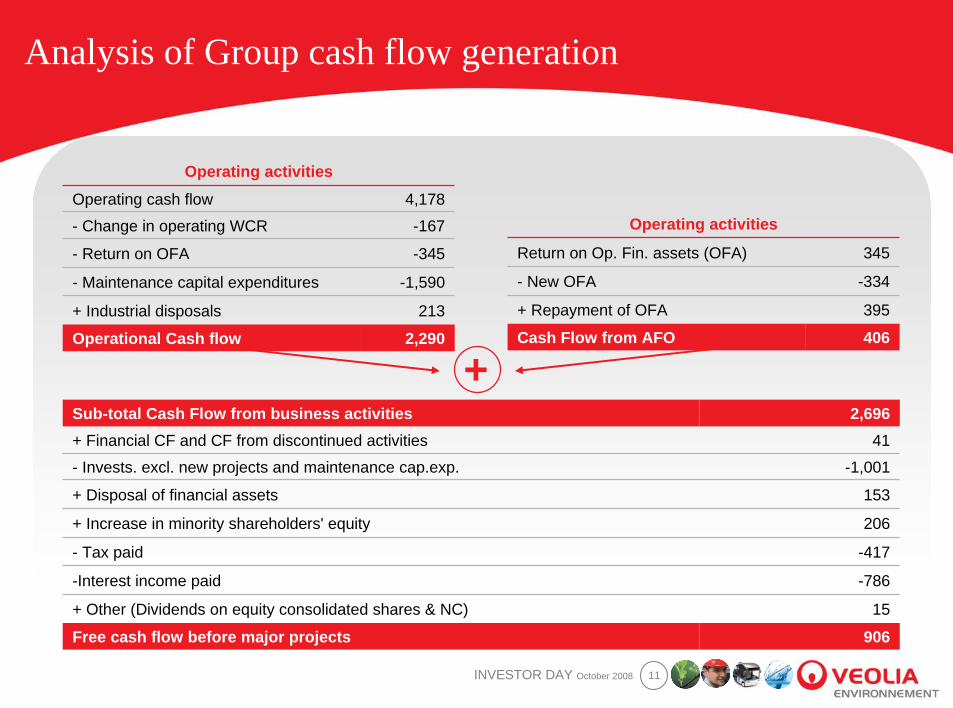
Analysis of Group cash flow generation
2,290Operational Cash flow213+ Industrial disposals
-1,590- Maintenance capital expenditures
-345- Return on OFA
-167- Change in operating WCR
4,178Operating cash flow
Operating activities
406Cash Flow from AFO395+ Repayment of OFA
-334- New OFA
345Return on Op. Fin. assets (OFA)
Operating activities
906Free cash flow before major projects
2,696Sub-total Cash Flow from business activities
-417- Tax paid
-786-Interest income paid
15+ Other (Dividends on equity consolidated shares & NC)
206+ Increase in minority shareholders' equity
153+ Disposal of financial assets
-1,001- Invests. excl. new projects and maintenance cap.exp.
41+ Financial CF and CF from discontinued activities
+
12INVESTOR DAY October 2008
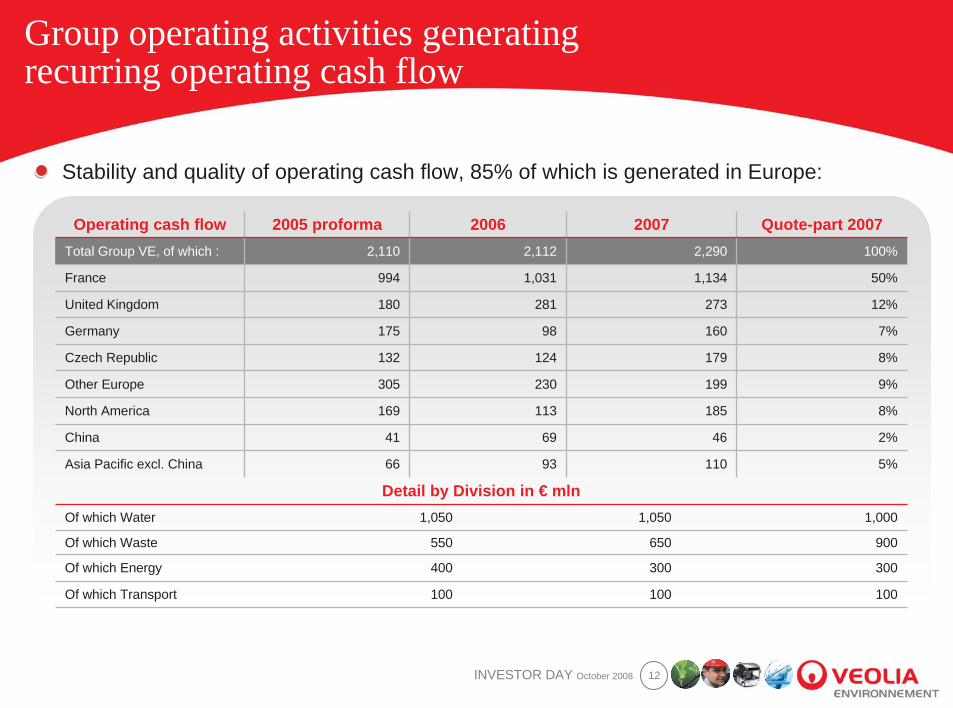
Group operating activities generatingrecurring operating cash flow
Stability and quality of operating cash flow, 85% of which is generated in Europe:
100100100Of which Transport
300300400Of which Energy
900650550Of which Waste
1,0001,0501,050Of which Water
Detail by Division in € mln
5%1109366Asia Pacific excl. China
2%466941China
8%185113169North America
9%199230305Other Europe
8%179124132Czech Republic
7%16098175Germany
12%273281180United Kingdom
50%1,1341,031994France
100%2,2902,1122,110Total Group VE, of which :
Quote-part 2007200720062005 proformaOperating cash flow
13INVESTOR DAY October 2008
Operating cash flow benefits from high visibility
Length of contracts
Weight of concession activities not very sensitive to economic conditions
High rate of contract renewal
Ability to generate productivity allowing us to maintain returns in mature zones over the longer term
14INVESTOR DAY October 2008
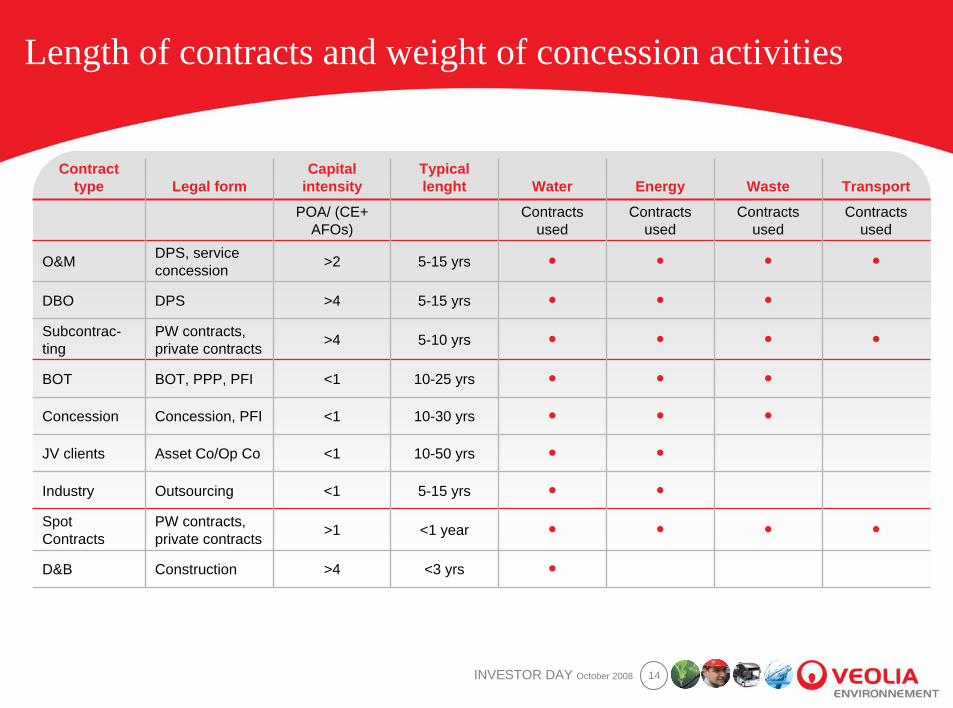
Length of contracts and weight of concession activities
●<3 yrs>4ConstructionD&B
●●●●<1 year>1PW contracts,private contracts
Spot Contracts
●●5-15 yrs<1OutsourcingIndustry
●●10-50 yrs<1Asset Co/Op CoJV clients
●●●10-30 yrs<1Concession, PFIConcession
●●●10-25 yrs<1BOT, PPP, PFIBOT
●●●●5-10 yrs>4PW contracts,private contracts
Subcontrac-ting
●●●5-15 yrs>4DPSDBO
●●●●5-15 yrs>2DPS, service concessionO&M
Contractsused
Contractsused
Contractsused
Contractsused
POA/ (CE+ AFOs)
TransportWasteEnergyWaterTypicallenght
Capital intensityLegal form
Contracttype
15INVESTOR DAY October 2008
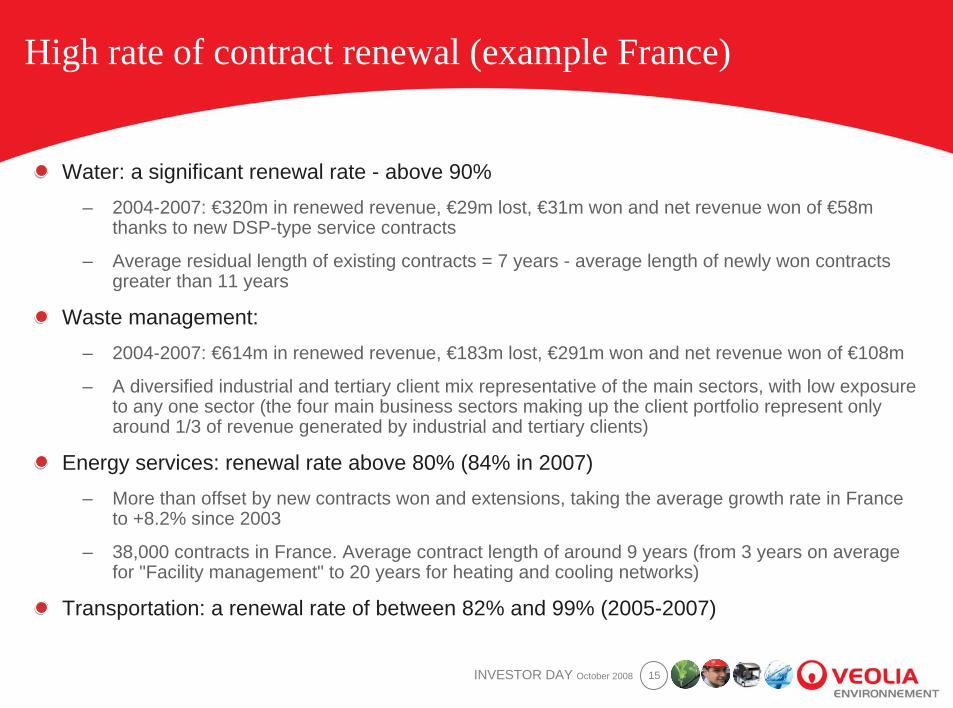
High rate of contract renewal (example France)
Water: a significant renewal rate - above 90%– 2004-2007: €320m in renewed revenue, €29m lost, €31m won and net revenue won of €58m
thanks to new DSP-type service contracts
– Average residual length of existing contracts = 7 years - average length of newly won contracts greater than 11 years
Waste management:– 2004-2007: €614m in renewed revenue, €183m lost, €291m won and net revenue won of €108m
– A diversified industrial and tertiary client mix representative of the main sectors, with low exposure to any one sector (the four main business sectors making up the client portfolio represent only around 1/3 of revenue generated by industrial and tertiary clients)
Energy services: renewal rate above 80% (84% in 2007)– More than offset by new contracts won and extensions, taking the average growth rate in France
to +8.2% since 2003
– 38,000 contracts in France. Average contract length of around 9 years (from 3 years on average for "Facility management" to 20 years for heating and cooling networks)
Transportation: a renewal rate of between 82% and 99% (2005-2007)
16INVESTOR DAY October 2008
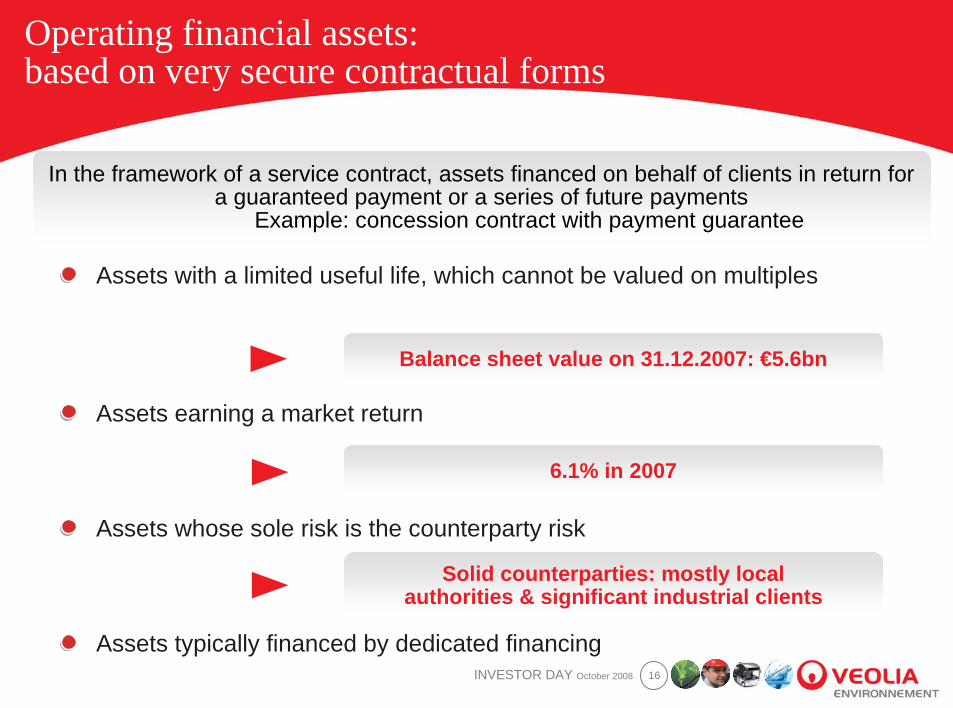
Operating financial assets:based on very secure contractual forms
In the framework of a service contract, assets financed on behalf of clients in return for a guaranteed payment or a series of future payments
Example: concession contract with payment guarantee
Assets with a limited useful life, which cannot be valued on multiples
Assets earning a market return
Assets whose sole risk is the counterparty risk
Assets typically financed by dedicated financing
Balance sheet value on 31.12.2007: €5.6bn
6.1% in 2007
Solid counterparties: mostly localauthorities & significant industrial clients
17INVESTOR DAY October 2008
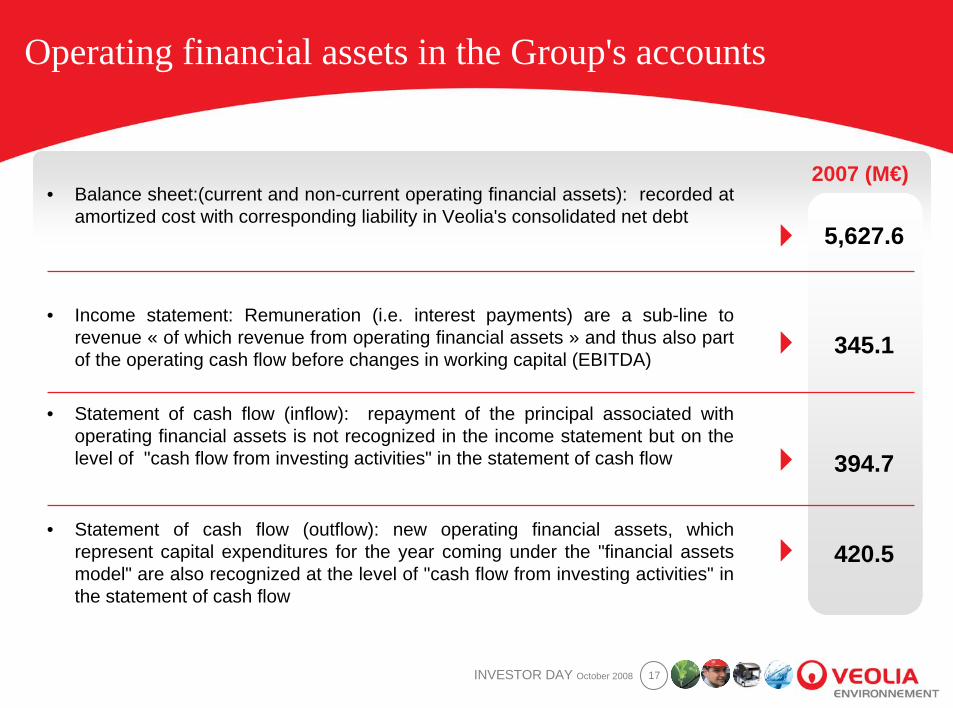
Operating financial assets in the Group's accounts
• Statement of cash flow (outflow): new operating financial assets, whichrepresent capital expenditures for the year coming under the "financial assetsmodel" are also recognized at the level of "cash flow from investing activities" in the statement of cash flow
• Statement of cash flow (inflow): repayment of the principal associated withoperating financial assets is not recognized in the income statement but on the level of "cash flow from investing activities" in the statement of cash flow
• Income statement: Remuneration (i.e. interest payments) are a sub-line to revenue « of which revenue from operating financial assets » and thus also part of the operating cash flow before changes in working capital (EBITDA)
• Balance sheet:(current and non-current operating financial assets): recorded atamortized cost with corresponding liability in Veolia's consolidated net debt
2007 (M€)
5,627.6
345.1
394.7
420.5
18INVESTOR DAY October 2008
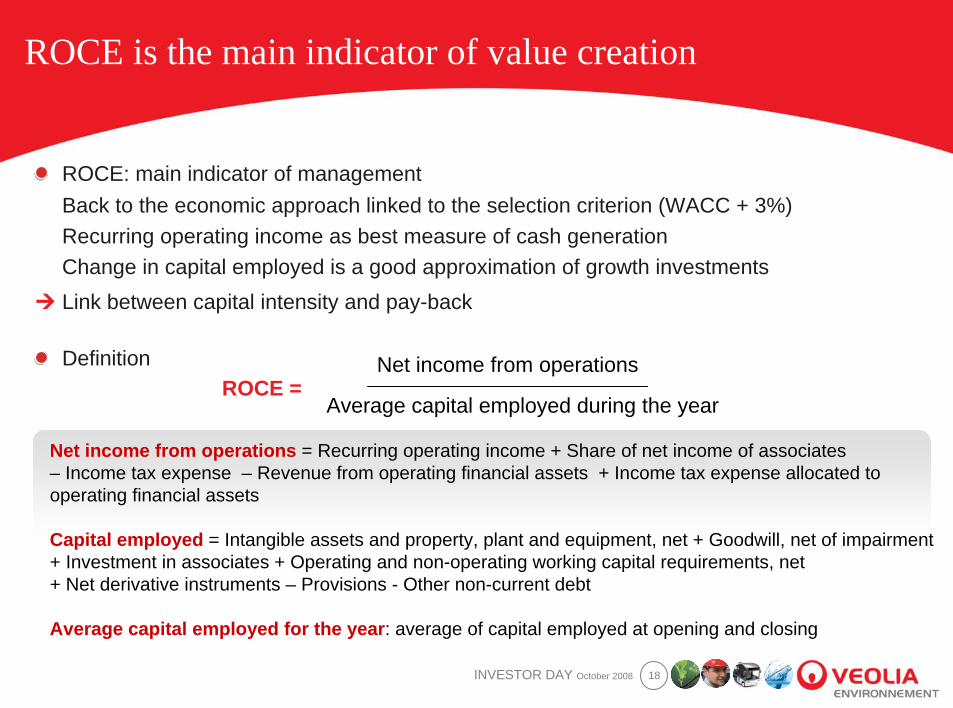
ROCE is the main indicator of value creation
ROCE: main indicator of managementBack to the economic approach linked to the selection criterion (WACC + 3%)Recurring operating income as best measure of cash generationChange in capital employed is a good approximation of growth investmentsLink between capital intensity and pay-back
DefinitionROCE =
Average capital employed during the year
Net income from operations
Net income from operations = Recurring operating income + Share of net income of associates– Income tax expense – Revenue from operating financial assets + Income tax expense allocated to operating financial assets
Capital employed = Intangible assets and property, plant and equipment, net + Goodwill, net of impairment + Investment in associates + Operating and non-operating working capital requirements, net + Net derivative instruments – Provisions - Other non-current debt
Average capital employed for the year: average of capital employed at opening and closing
19INVESTOR DAY October 2008
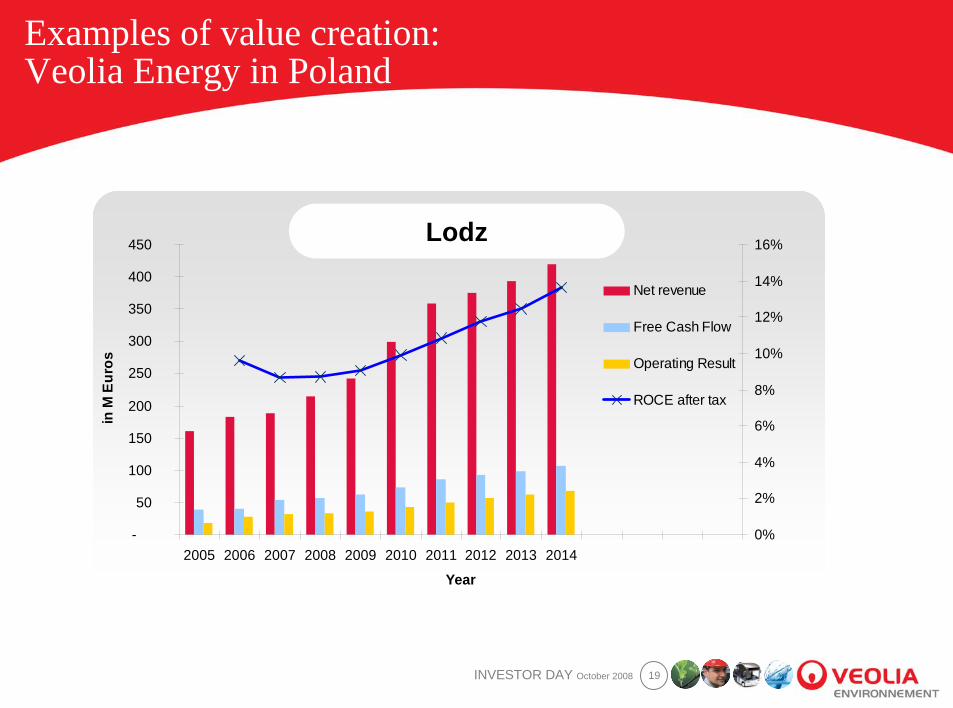
Examples of value creation:Veolia Energy in Poland
-
50
100
150
200
250
300
350
400
450
2005 2006 2007 2008 2009 2010 2011 2012 2013 2014
Year
in M
Eur
os
0%
2%
4%
6%
8%
10%
12%
14%
16%
Net revenue
Free Cash Flow
Operating Result
ROCE after tax
Lodz
20INVESTOR DAY October 2008
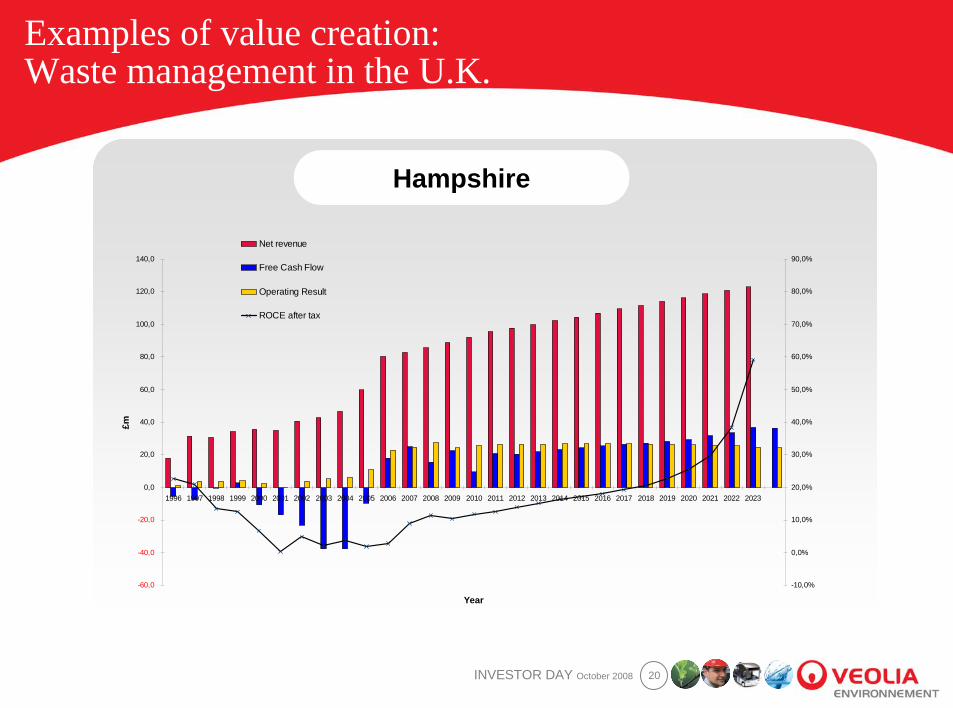
Examples of value creation:Waste management in the U.K.
Hampshire
-60,0
-40,0
-20,0
0,0
20,0
40,0
60,0
80,0
100,0
120,0
140,0
1996 1997 1998 1999 2000 2001 2002 2003 2004 2005 2006 2007 2008 2009 2010 2011 2012 2013 2014 2015 2016 2017 2018 2019 2020 2021 2022 2023
Year
£m
-10,0%
0,0%
10,0%
20,0%
30,0%
40,0%
50,0%
60,0%
70,0%
80,0%
90,0%
Net revenue
Free Cash Flow
Operating Result
ROCE after tax
21INVESTOR DAY October 2008
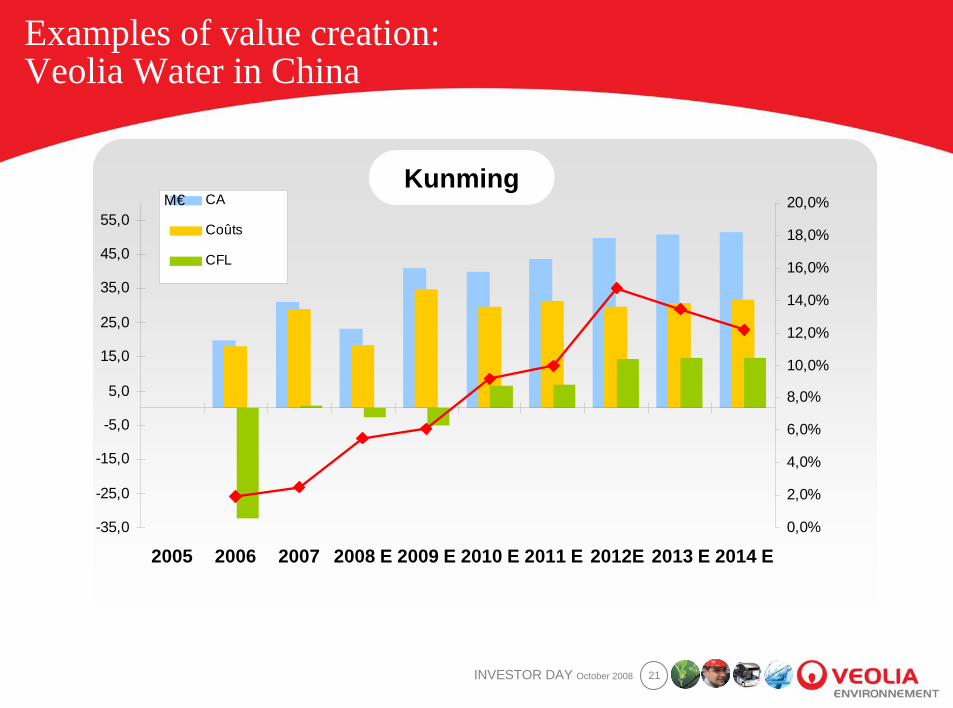
Examples of value creation:Veolia Water in China
-35,0
-25,0
-15,0
-5,0
5,0
15,0
25,0
35,0
45,0
55,0
2005 2006 2007 2008 E 2009 E 2010 E 2011 E 2012E 2013 E 2014 E0,0%
2,0%
4,0%
6,0%
8,0%
10,0%
12,0%
14,0%
16,0%
18,0%
20,0%CA
Coûts
CFL
M€Kunming
22INVESTOR DAY October 2008
These major projects represent almost one third of Group capital employed at end 2007
Impact of recent acquisitions on Group profitability
Our portfolio of activities includes large assets that are not yet atmaturity:
– Major projects 2006: €1.4bn• Acquisition of Cleanaway in the UK notably
– Major projects 2007: €4bn, including €900 mln in organic growth• Acquisitions of Sulo in Germany, of the leading private heating and cooling
network in North America (TNAi), of TMT in Italy and of non-regulated water activities in the United Kingdom primarily
The 2007 assets today have a dilutive impact on the Group ROCE.
Our goal: to increase FCF and the profitability of these new projectsthrough the Efficiency Plan 2010 and specific action plans (e.g. Sulo).
23INVESTOR DAY October 2008
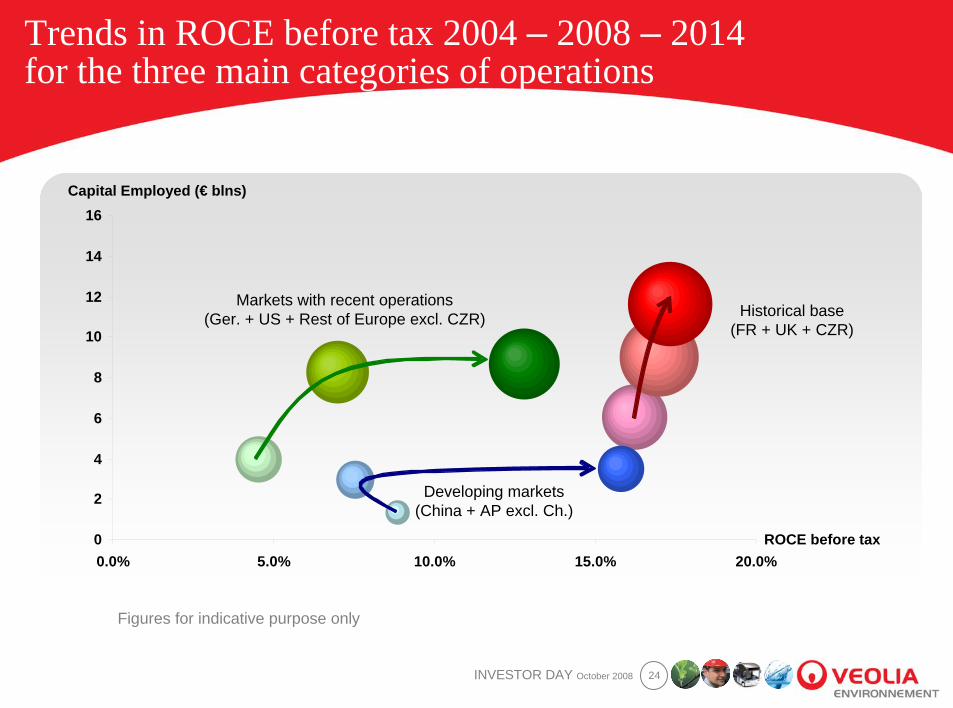
Target medium-term ROCE before tax3 main categories of operations
Historic base in all the Group's business linesMaintaining high levels of ROCE over the 2008-2014 period
– France: maintaining a ROCE of around 18%-20%
– Czech Republic: maintaining a ROCE of around 16%-18%
– United Kingdom: increase of around 1% to 12%-14%
Mature markets with recent operations for one or several Group business linesGain of 2% looking to 2011 and an additional 2% looking to 2014
– North America
– Germany
– Rest of Europe
Developing marketsGain of at least 3% looking to 2011 and an additional 3% looking to 2014.
– Asia Pacific
– Rest of World
24INVESTOR DAY October 2008
Trends in ROCE before tax 2004 – 2008 – 2014for the three main categories of operations
0
2
4
6
8
10
12
14
16
0.0% 5.0% 10.0% 15.0% 20.0%ROCE before tax
Capital Employed (€ blns)
Markets with recent operations(Ger. + US + Rest of Europe excl. CZR) Historical base
(FR + UK + CZR)
Developing markets(China + AP excl. Ch.)
Figures for indicative purpose only
25INVESTOR DAY October 2008
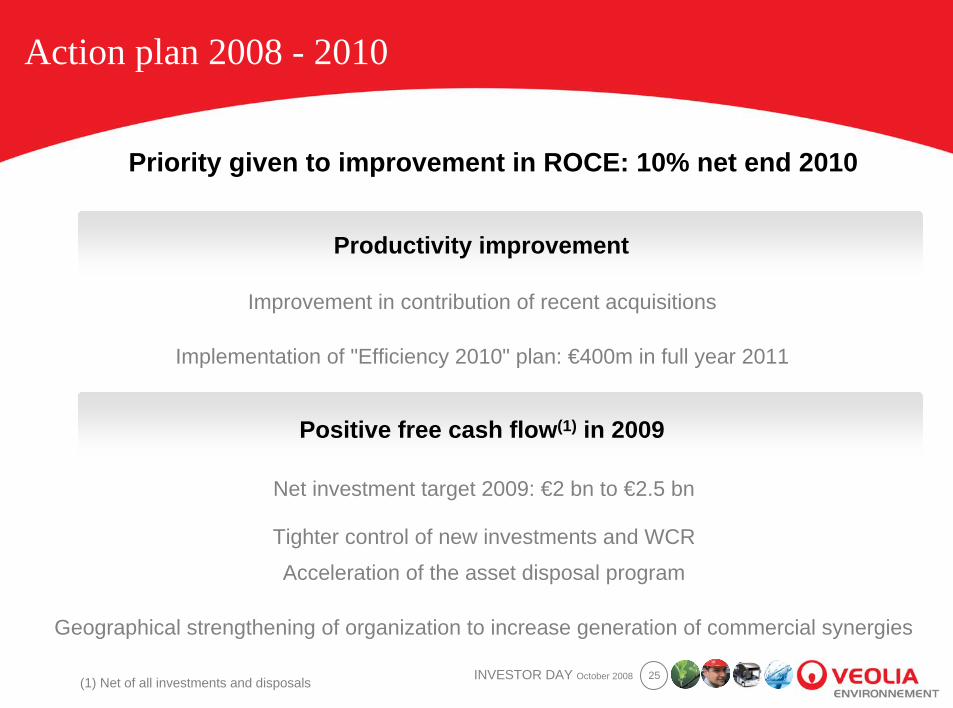
Productivity improvement
Action plan 2008 - 2010
Priority given to improvement in ROCE: 10% net end 2010
Implementation of "Efficiency 2010" plan: €400m in full year 2011
Net investment target 2009: €2 bn to €2.5 bn
Tighter control of new investments and WCR
Acceleration of the asset disposal program
Geographical strengthening of organization to increase generation of commercial synergies
Improvement in contribution of recent acquisitions
Positive free cash flow(1) in 2009
(1) Net of all investments and disposals
Appendices
27INVESTOR DAY October 2008
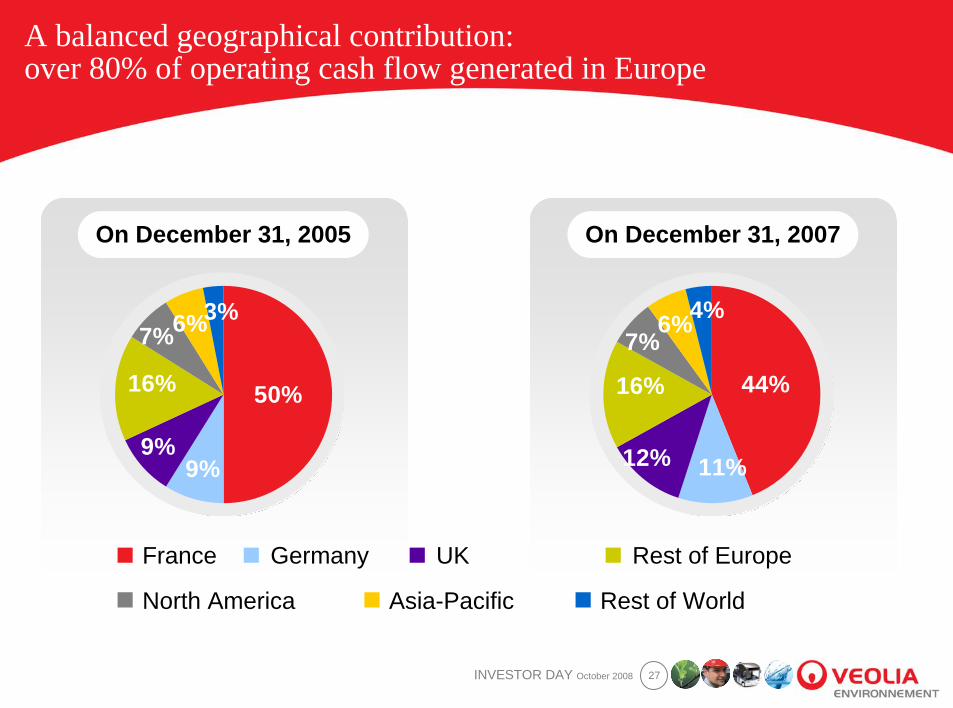
A balanced geographical contribution:over 80% of operating cash flow generated in Europe
On December 31, 2005
50%
3%6%7%
9%9%
16%
On December 31, 2007
44%
4%6%7%
11%12%
16%
France Germany UK Rest of Europe
North America Asia-Pacific Rest of World
28INVESTOR DAY October 2008
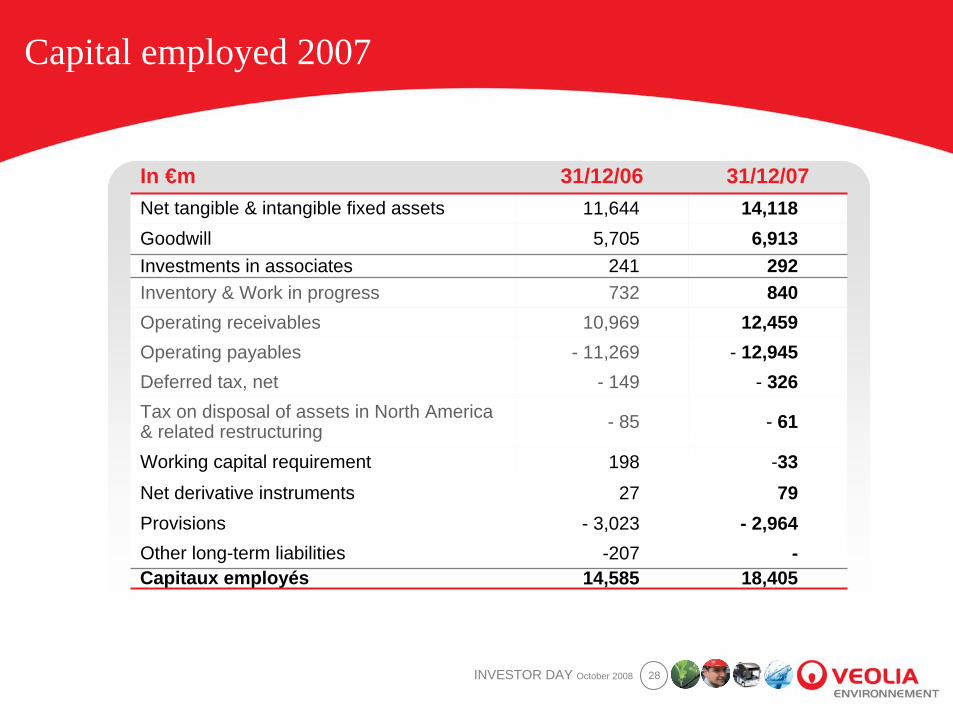
Capital employed 2007
- 326- 149Deferred tax, net
- 61- 85Tax on disposal of assets in North America & related restructuring
-33198Working capital requirement
7927Net derivative instruments- 2,964- 3,023Provisions
14,585-207
- 11,26910,969
732241
5,70511,644
31/12/0614,118Net tangible & intangible fixed assets
18,405Capitaux employés-Other long-term liabilities
- 12,945Operating payables12,459Operating receivables
840Inventory & Work in progress292Investments in associates
6,913Goodwill
31/12/07In €m
29INVESTOR DAY October 2008
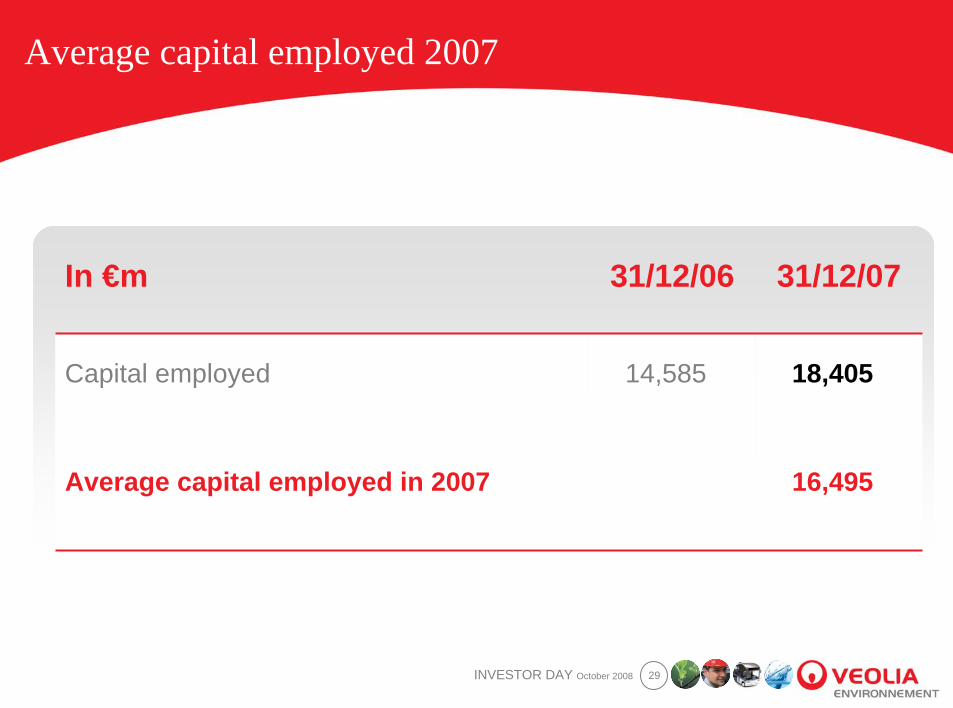
Average capital employed 2007
14,585
31/12/06
16,495
18,405
31/12/07
Average capital employed in 2007
Capital employed
In €m
30INVESTOR DAY October 2008
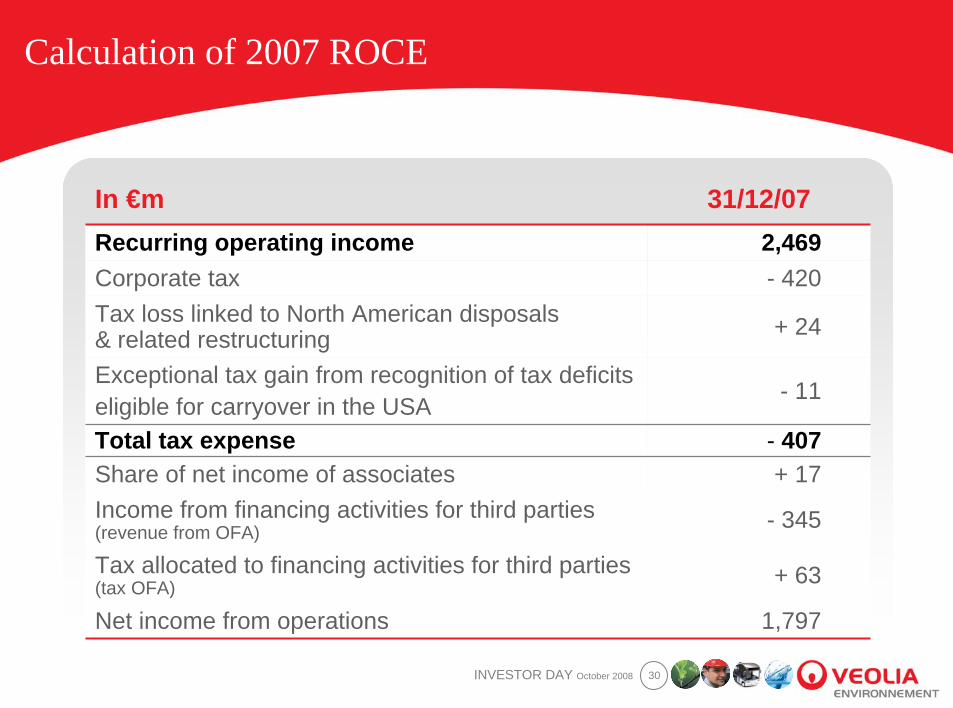
Calculation of 2007 ROCE
+ 24Tax loss linked to North American disposals & related restructuring
- 11Exceptional tax gain from recognition of tax deficitseligible for carryover in the USA
- 407Total tax expense+ 17Share of net income of associates
- 345Income from financing activities for third parties (revenue from OFA)
+ 63Tax allocated to financing activities for third parties (tax OFA)
1,797Net income from operations
- 4202,469
31/12/07
Corporate taxRecurring operating income
In €m
31INVESTOR DAY October 2008
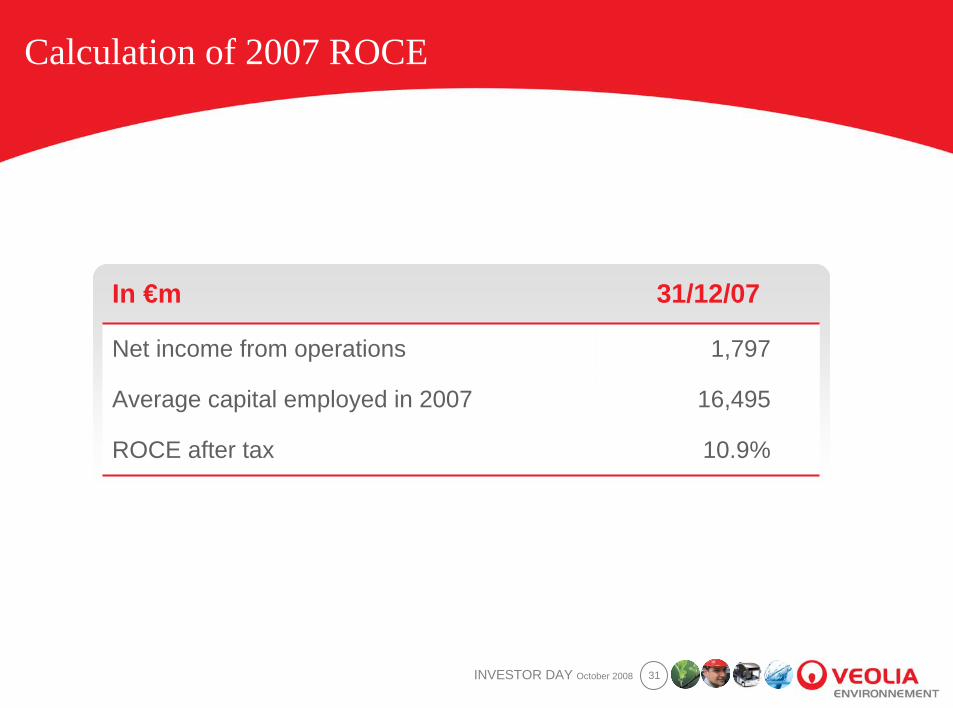
Calculation of 2007 ROCE
10.9%
16,495
1,797
31/12/07
ROCE after tax
Average capital employed in 2007
Net income from operations
In €m
32INVESTOR DAY October 2008
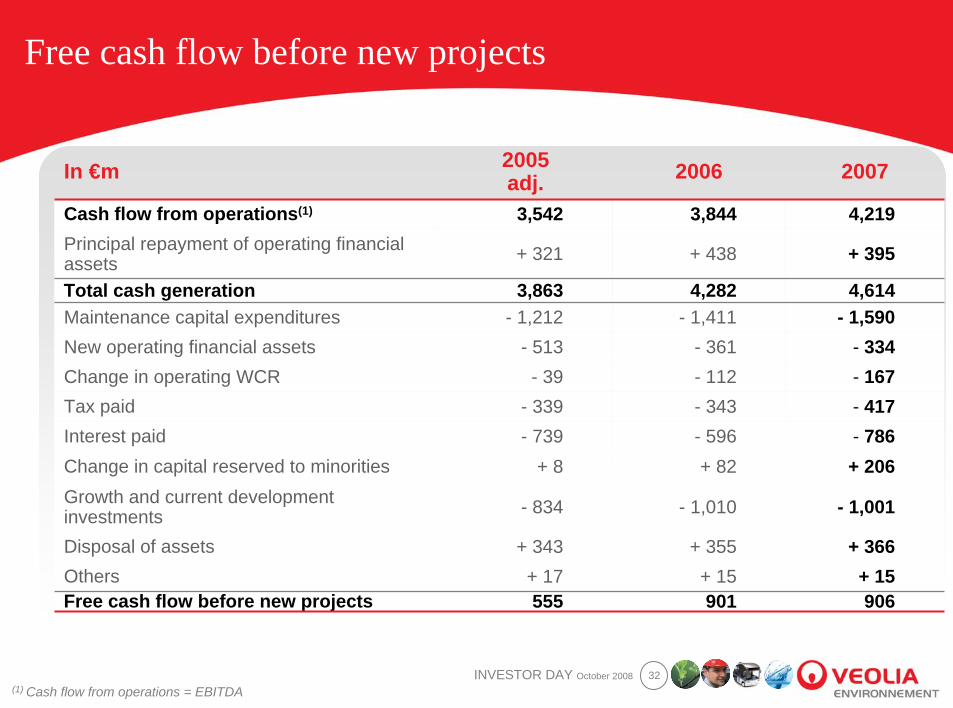
Free cash flow before new projects
(1) Cash flow from operations = EBITDA
- 417- 343- 339Tax paid- 786- 596- 739Interest paid+ 206+ 82+ 8Change in capital reserved to minorities
- 1,001- 1,010- 834Growth and current development investments
+ 366+ 355+ 343Disposal of assets
555+ 17
- 39- 513
- 1,2123,863
+ 321
3,542
2005adj.
4,2193,844Cash flow from operations(1)
906901Free cash flow before new projects+ 15+ 15Others
- 167- 112Change in operating WCR- 334- 361New operating financial assets
- 1,590- 1,411Maintenance capital expenditures4,6144,282Total cash generation
+ 395+ 438Principal repayment of operating financial assets
20072006In €m
33INVESTOR DAY October 2008
Investor Relations contact information
Nathalie PINON, Head of Investor Relationsand Financial Communication
38 Avenue Kléber – 75116 Paris - FranceTelephone +33 1 71 75 01 67
Fax +33 1 71 75 10 12e-mail [email protected]
Brian SULLIVAN, Vice President, US Investor Relations200 East Randolph Drive, Suite 7900
Chicago, IL 60601 - USATelephone +1 (630) 371 2847
Fax +1 (630) 282 0423e-mail [email protected]
Web sitehttp://veolia-finance.com