Embed Size (px)
Citation preview


All rights reserved
INFORMATION TO ALL USERSThe quality of this reproduction is dependent upon the quality of the copy submitted.
In the unlikely event that the author did not send a complete manuscriptand there are missing pages, these will be noted. Also, if material had to be removed,
a note will indicate the deletion.
Microform Edition © ProQuest LLC.All rights reserved. This work is protected against
unauthorized copying under Title 17, United States Code
ProQuest LLC.789 East Eisenhower Parkway
P.O. Box 1346Ann Arbor, MI 48106 - 1346
UMI 3633162
Published by ProQuest LLC (2014). Copyright in the Dissertation held by the Author.
UMI Number: 3633162

Health Care Criteria and Organizational Performance
ii
Abstract
This study investigated the impact of the Malcolm Baldrige Health Care Criteria for Performance
Excellence (HCPE) on effectiveness in health care organizational performance. The quality of
health care has tremendous social and economic consequences for the United States (U.S.),
including lost wages, reduced productivity, higher legal expenses, and lower confidence in the
health care system. Increasing health care productivity, efficiency, effectiveness, and quality
offers critical means to reducing cost and improving U.S. economic performance, which is an
objective of the Affordable Care Act enacted by Congress in 2010. This study compared
Malcolm Baldrige National Quality Award recipients to competitors in their geographic markets
using Centers for Medicare & Medicaid Services (CMS) performance measures to determine if
there was a relationship between the use of the HCPE as a business model and the performance
of health care organizations. This study included an analysis comparing 34 hospitals using the
HCPE as an organizational business model to 153 hospitals in their geographic markets not using
the HCPE. There were 42 CMS measures classified into 2 major categories focused on (1)
patient experience measures and (2) clinical processes and outcome measures. The results
showed that the study-identified hospitals that used the HCPE had values representing higher
performance on all 10 patient experience measures than the non-HCPE hospitals, and that 9 of
the 10 measures were statistically significant. Although the group mean differences were not
statistically significant, the study results showed that HCPE hospitals had performance outcomes
with mean values representing higher performance than the non-HCPE hospitals in 38 of the 42
(90%) of the study measures. These results should provide leadership with confidence that the
HCPE serve as a valid model to align organizational design, strategy, systems, and human capital
to create long-term effectiveness in an institutionalized high performance culture.

Health Care Criteria and Organizational Performance
iii
Table of Contents
CHAPTER 1. INTRODUCTION ................................................................................... 1
Introduction to the Problem ................................................................................. 2
Statement of the Problem...................................................................................... 3
Purpose of the Study............................................................................................. 3
Rationale .............................................................................................................. 4
Significance of the Study for Health Care............................................................ 5
Significance of the Study to Leadership………….…………………………….. 6
CHAPTER 2. LITERATURE REVIEW......................................................................... 9
Overview of Chapter............................................................................................. 9
Introduction to the History of Quality and the Development of the Baldrige
Award Program..................................................................................................... 10
History of Quality........................................................................................ 10
Development of Baldrige Award Program................................................. 23
The CPE/HCPE as a High Performance Model…………….….……...…….. 25
The CPE/HCPE Model .……………………………………………….. 27
The Design of the HCPE…………….……………………….…………… 32
The HCPE High-Performance Business Model………………………… 38
The Process for Achieving the Baldrige Award……………...…………. 45
Role of Systems Theory, Systems Thinking —Moving Beyond Linear
Thinking ……………………………………………………………………… 47

Health Care Criteria and Organizational Performance
iv
Evaluation of Quality Improvement Strategies and Programs ……..………….. 55
Lean and Six Sigma Methodologies ……………………………………. 58
Constraints Management ……………………………………………….… 60
The HCPE and the Balanced Scorecard …………………………………. 61
The Baldrige Health Care Award Recipients from 2002 through 2011 ………. 62
The Application of Quality in Health Care …………………………………….. 66
Programs to Improve Health Care Quality ……………………………………. 71
The Joint Commission …………………………………………………… 71
The HCPE and ISO 9001 Standard ……………………………………… 72
Other Independent Quality Improvement Programs …………………….. 73
Institute for Healthcare Improvement, the Physician Consortium
for Performance Improvement, Leapfrog Group, the National
Quality Forum, and the Health Care Cost and the Patient Protection
and Affordable Care Act (ACA)
The Gaps in Knowledge Including the HCPE in Literature …………………... 81
CMS Measures and the Hospital Compare Database in Literature …………… 88
Closing Observations ………………………………………………………… 90
CHAPTER 3.RESEARCH QUESTION and HYPOTHESIS......................................... 93
CHAPTER 4. METHODOLOGY .................................................................................. 94
Review of the Purpose of the Study...................................................................... 94
Conceptual Framework ………………………………………………………… 95
General Research Design ..................................................................................... 95

Health Care Criteria and Organizational Performance
v
HCPE Construct Validity ..................................................................................... 96
Research Question……...................................................................................... 96
Independent and Dependent Variables ................................................................ 97
Research Approach …......................................................................................... 97
Data Overview …................................................................................................. 98
Subjects…………………………………………………………………………. 99
Missing Data ………………………………………………………….. 103
Data for the Analysis ............................................................................................ 106
HCAHPS ……………………………………………………………… 106
Outpatient Imaging Efficiency ……………………………………….. 107
Process of Care ………………………………………………………. 108
Surgical Care Improvement Project …………………………………... 109
Outcome of Care ……………………………………………………… 110
Power and Sample Size Analysis.......................................................................... 111
Statistical Analysis Plan........................................................................................ 112
CHAPTER 5. SPECIFIC FINDINGS AND RESULTS................................................. 114
Evaluation of the Relationship Between HCPE and Organizational
Characteristics …………………………………………………………………
122
Organizational Characteristics’ Effect on HCAHPS Hospital Experience
Patient Survey ………………………………………………………………….
124
Organizational Characteristics’ Effect on Outpatient Imaging Efficiency
Results …………………………………………………………………………
126

Health Care Criteria and Organizational Performance
vi
Organizational Characteristics’ Effect on Process of Care: Heart Attack
Results………………………………………………………………………….
128
Organizational Characteristics’ Effect on Process of Care: Heart Failure
Results …………………………………………………………………………
129
Organizational Characteristics’ Effect on Process of Care: Pneumonia Results 131
Organizational Characteristics’ Effect on Process of Care: Surgical Results … 133
Organizational Characteristics’ Effect on Outcome of Care Results …………. 135
Summary ……………………………………………………………………… 139
CHAPTER 6. DISCUSSION ......................................................................................... 141
Summary of the Problem, Purpose, and Research Question................................ 141
Summary of Main Findings…………..………………………………………… 142
The Bottom Line ….............................................................................................. 147
Significance of the Study Results to Health Care Organizations......................... 152
Significance of the Study Results to Leadership ………………………………. 155
Limitations……………...…………………………………………………...….. 158
Implications for the Literature …………………………………………………. 160
CHAPTER 7. CONCLUSIONS AND RECOMMENDATIONS................................... 161
REFERENCES………………………………………………………………………… 167
APPENDIX ……………………………………………………………………..……. 187

Health Care Criteria and Organizational Performance
vii
List of Tables
Table 1 The Deming Wheel vs. the Japanese PDCA Cycle Depiction…………….. 18
Table 2.
Brief description of 2011-2012 Health Care Criteria for Performance
Excellence …………………………………………………………………..
30
Table 3 Baldrige CEO Attitudes and Motivation Depiction …………………. …. 43
Table 4. Health Care Recipients of the Performance Excellence Award …………… 65
Table 5. National Health Expenditures (NHE) and Selected Economic Indicators,
Levels, and Annual Percent Change: Calendar Years 2005-2020 (Projected
at 2009) ……………………………………………………………………..
80
Table 6. Baseline Comparison of Hospital Characteristics………………………… 100
Table 7. Characteristics (Control Variables) and Definitions of All HCPE and Non-
HCPE Hospitals…………………………………………………………….
102
Table 8 Health Care Recipients of the Performance Excellence Award with ≥ 100
Beds ………………………………………………………………..…….
104
Table 9 Characteristics of Medium and Large Bed Size HCPE and Non-HCPE
Hospitals……………………………………………………………………
105
Table 10. HCAHPS Hospital Experience Patient Survey Measures ………….……… 107
Table 11. Outpatient Imaging Efficiency .…………………………………………….. 108
Table 12. Process of Care: Heart Attack ….…………………………………………... 108
Table 13. Process of Care: Heart Failure……………………………………………… 109
Table 14. Process of Care: Pneumonia ……………………………………………….. 109

Health Care Criteria and Organizational Performance
viii
Table 15. Process of Care: Surgical Care Improvement Project Measures…………... 110
Table 16. Outcome of Care Measures…...…………………………………………... 110
Table 17. Power- Sensitivity Analysis….…………………………………………….. 112
Table 18. HCAHPS Hospital Experience Patient Survey Measures Results………….. 115
Table 19. Outpatient Imaging Efficiency Results……………………………………... 116
Table 20. Process of Care: Heart Attack Results……………………………………… 117
Table 21. Process of Care: Heart Failure Results …...……………………………….. 118 Table 22. Process of Care: Pneumonia Results ….…………………………………… 119
Table 23. Process of Care: Surgical Results ………………………………………….. 120 Table 24. Outcome of Care Results…...………………………………………...…….. 122
Table 25. Organizational Characteristics’ Effect on HCAHPS Hospital Experience
Patient Survey Measures Results………..…………………………….…...
125
Table 26. Organizational Characteristics’ Effect on Outpatient Imaging Efficiency
Results………………………………………………………………………
127
Table 27. Organizational Characteristics’ Effect on Process of Care: Heart Attack
Results….……………………………….…………………………………..
128
Table 28. Organizational Characteristics’ Effect on Process of Care: Heart Failure
Results…………………….…………………………………………………
130
Table 29. Organizational Characteristics’ Effect on Process of Care: Pneumonia Results ………………….…………………………………………………
133
Table 30. Organizational Characteristics’ Effect on Process of Care: Surgical
Results………………….…………………………………………………
135
Table 31. Organizational Characteristics’ Effect on Outcome of Care Results………………….…………………………………………………
139

Health Care Criteria and Organizational Performance
ix
Table 32. HCAHPS Hospital Experience Patient Survey Statistically Significant
Measures Results……………………………………………………………
144
Table 33. Summary of the 42 CMS Measures’ Mean Values………………………… 145
Table 34. Value-Based Purchasing Program Domain Overview……………………… 150

Health Care Criteria and Organizational Performance
x
List of Figures
Figure 1. Evolution of the Scientific Method and PDSA Cycle Depiction …………. 15
Figure 2. Shewhart Cycle – 1939 Depiction ………………………………………... 16
Figure 3. Deming Wheel – 1950 Depiction ………………………………………... 17
Figure 4. Japanese Plan–Do–Check–Act (PDCA) Cycle – 1951 Depiction …………. 18
Figure 5. Shewhart Cycle: Deming – 1986 Depiction ………………………………. 19
Figure 6. PDSA Cycle: Deming – 1993 ……………………………………………. 20
Figure 7. FOCUS-PDCA Methodology ……………………………………………… 22
Figure 8. HCPE Category Framework Depiction ………………………………….... 29
Figure 9. Deming’s Chain Reaction Model Depiction…………………………….... 35
Figure 10. Holistic Health Care Systems Relationship Model Depiction …………… 53
Figure 11. Evolution of Quality and Performance Excellence ………………........... 55
Figure 12. Conceptual Framework ………………………….......................................... 95
Figure 13. Operational Framework ...……………………….......................................... 98
Figure 14. Mean Score for “Patients Would Definitely Recommend Hospital”............. 126
Figure 15. Conceptual Framework of the Research Results with HCPE and Non-
HCPE Hospitals………………………………………....…..........................
147

Health Care Criteria and Organizational Performance 1
Chapter 1: Introduction
The quality of health care has tremendous social and economic consequences for the
United States (U.S.), including lost wages, reduced productivity, higher legal expenses, and lower
confidence in the health care system (Shalala, 2007). This study explores the performance of
recipients of the Malcolm Baldrige National Quality Award for Performance Excellence (Baldrige
Award) and of competing hospitals in Baldrige recipients’ geographic markets, using Centers for
Medicare & Medicaid Services (CMS) performance measures. The Baldrige Award is based on
the Baldrige Criteria for Performance Excellence (CPE) model for improving organizational
performance, with specific criteria for health care, business, education, and non-profit
organizations (National Institute of Standards and Technology [NIST], 2011-2012). The use of the
Baldrige Health Care Criteria for Performance Excellence (HCPE) was the focus of this study’s
analysis. The CPE business model and the HCPE health care model contain similar criteria; the
next chapter addresses both models.
The President of the U.S. presents the Baldrige Award to businesses (manufacturing and
service, small and large) and educational, health care, and non-profit organizations that
demonstrate world-class quality and organizational performance excellence. Award applicants are
judged on the basis of their performance in seven areas: (1) leadership; (2) strategic planning; (3)
customer and market focus; (4) measurement, analysis, and knowledge management; (5)
workforce focus; (6) operations focus; and (7) results (NIST, 2011-2012). Specifically, health care
systems using the HCPE have achieved and sustained the highest national levels in patient safety
and patient loyalty; health care outcomes; physician, nurse, and staff satisfaction and engagement;
revenue and market share; and community services (NIST, 2010a). Well-known health care
systems using HCPE to improve organizational performance include Baylor Health Care System,

Health Care Criteria and Organizational Performance 2
the Hospital Corporation of America, Kaiser Permanente, Mayo Clinic, M.D. Anderson Cancer
Center, St. Jude Medical, Inc., and the Cleveland Clinic (Foundation for the Malcolm Baldrige
National Quality Award, 2011).
Introduction to the Problem
Increasing health care productivity, efficiency, effectiveness, and quality as a means of
reducing cost is critical for U.S. economic performance improvement. By 2020, national health
spending is expected to reach “$4.6 trillion and comprise 19.8% of GDP” and government-
sponsored share of health spending is expected to increase from “45% in 2010 to about 50% by
2020,” driven by expected robust Medicare enrollment growth, Medicaid coverage expansions,
and exchange plan premium and cost-sharing subsidies (Centers for Medicare & Medicaid
Services, 2010, p. 1). “American health care is the envy of the world,” but the challenges of
addressing rising health care costs while improving quality are present; reforms are needed to
ensure health care becomes more widely available and affordable (U.S. Department of Health and
Human Services, Office of Assistant Secretary for Planning and Evaluation, 2002, p. 1). The health
care systems in this study lead the way in improvement and innovation of efficiencies and
performance excellence while addressing the issues of cost, such as quality and accessibility, in the
context of the political, policy, economic, and special interest challenges. Evans and Jack (2003)
state that applying the HCPE as an integrated performance management model in health care
potentially “suggests clear linkages between practice and results” (p. 10). The HCPE serve as a
business model for improving organizational performance. Organizational attributes detailed by
the HCPE can promote high levels of success in the execution approaches designed to implement
change initiatives.

Health Care Criteria and Organizational Performance 3
Driven by successful application of the HCPE model in health care organizations such as
the Mayo Clinic, a concerted effort is underway through the Monfort Institute at the University of
Northern Colorado to organize and assist U.S. universities’ academic researchers to study and
publish new interdisciplinary knowledge in the business, education, and health care fields
(Monfort Institute, 2012). Due to the promise of economic return on high quality health care
services, some of the Baldrige Award recipients eagerly agreed to share detailed corporate
information with interested researchers to answer questions about the validity of the criteria and
their use as a model for world-class performance (Monfort Institute, 2007). The validation of a
business model that has been used to improve health care organizations would be a significant
benefit to all stakeholders and the U.S. economy.
Statement of the Problem
While anecdotal stories and propositions related to the value of the HCPE in achieving
performance excellence in organizations abound, research foci providing empirical evidence of the
impact of applying HCPE to improve the efficiency and effectiveness specifically in the health
care industry is limited. The field offers rich data for exploration. Increasingly, health care
organizations across the U.S. are adopting the HCPE as a business model to improve
organizational performance. Each health care application submitted to the Baldrige Award
Program documents organizational improvement over time with past and current performance
levels, trends in key measures or indicators, as well as comparison with competitors’ levels of
performance.
Purpose of the Study
The purpose of the study is to determine if there is a relationship between the use of the
HCPE as a business model and the performance of health care organizations. To accomplish this,

Health Care Criteria and Organizational Performance 4
the study will compare Baldrige Award recipients in health care to their competitors using CMS
performance measures. This will help determine if there is sufficient evidence to support the use
of the HCPE as a business model for health care systems. The study adds to the health care
performance excellence theoretical foundation by identifying process and outcome metrics in
which the HCPE have the greatest impact.
No research currently exists that tests the HCPE model by comparing health care recipients
of the Baldrige Award to like competitive organizations with the same CMS performance
measures (see Chapter 2 for in-depth discussion). Although there are performance criteria for
health care, business, education, and non-profit organizations, health care provides the only
opportunity to make the comparison through the use of a standardized set of performance
indicators such as those found in the CMS measures. As of the end of 2011, 15 health care
organizations, representing 51 hospitals, have received the award for performance excellence. The
findings from this study could inspire health care leaders to push health care quality to new levels
of excellence, with empirical evidence supporting the adoption of the HCPE as a business model to
improve organizational performance and value-impact for health care recipients. It is the
confluence of evidence and decision making that should provide the structure for leaders to
develop evidence-based policy rather than policy based on political conviction, ideology, or
organizational position (Pawson, 2006).
Rationale
Adopting the HCPE business model requires a transformation of organizational culture, a
process requiring years of effort. Organizational transformation on this scale requires a focused,
disciplined approach and total commitment from the chief executive officer (CEO), senior
leadership, and all levels of management. Human systems in traditional organizations attempt to

Health Care Criteria and Organizational Performance 5
maintain equilibrium and thus resist change (Schein, 2004). Considering the current state of health
care and projected future challenges, health care leadership would be prudent to utilize a
systematic model for improving processes and outcomes to manage organizational change and
improve performance. W. E. Deming identified leadership as the key to success in all
organizations: “The aim of leadership should be to improve the performance of man and machine,
to improve quality, to increase output and simultaneously to bring pride of workmanship to
people” (1986, p. 248).
Significance of the Study to Health Care
The proposed research can have a significant impact on health care organizations pursuing
performance excellence by providing a clear and objective assessment of the HCPE as an overall
business model for leaders to improve the efficiency and effectiveness of health care systems. The
efforts of professional organizations such as the Institute for Health Care Improvement (IHI)
support the need for this study. The IHI has worked to support and encourage leaders of
innovative health systems by identifying important leverage points for leaders striving to achieve
dramatic system-level performance improvement for the leadership of organizational
transformation. The IHI identified the HCPE as a comprehensive framework for leadership
(Reinertsen, Pugh, & Bisognano, 2008) because the HCPE provide a systems approach that has
proven successful in assuring the best clinical outcomes. Health care leaders have learned that
applying the HCPE helps them focus, prioritize, integrate, and align their improvement initiatives
to accomplish the results that matter most (Bodinson, 2005). This proposed research can have a
significant impact on understanding the HCPE as a model for improving health care performance.

Health Care Criteria and Organizational Performance 6
Significance of the Study to Leadership
The HCPE provide leadership with a model for aligning organizational design, with the
resulting efficiencies of policies and processes, in order to better create long-term effectiveness in
an institutionalized high-performance culture (Meyer & Rowan, 1977). The result of this study
builds an understanding of the leadership characteristics needed to execute change management
that leads to performance improvements aimed at excellence. Bossidy and Charan (2002) stated,
“The leader must be in charge of getting things done by running the three core processes – picking
other leaders, setting the strategic direction, and conducting operations” (p. 24). According to
Bass (1990), leaders must be able to formulate and evaluate appropriate organizational responses
and arrange for their implementation in operations and policies. Because at least 70% of all
initiatives fail despite leaders’ best efforts (Beer & Nohria, 2000), results of this study have
provided information leaders can incorporate when planning the implementation of new policy and
resulting strategies within a workplace culture of performance.
Furthermore, this study adds value to the validation of the policy decision to use the HCPE
as a business model in health care organizations, such that organizations can attempt to develop a
high-performance culture that ensures continual learning, transformation, and performance
improvement. Hunt (1993, p. 112) believed that the Baldrige Award has become accepted as the
“gold standard” of quality practices, and the use of the HCPE model is becoming pivotal to
organizational performance. Leadership is responsible for creating a high-performance culture that
ensures continual learning, transformation, and performance improvement. The HCPE model
provides the framework for leadership that is quantifiable by assessing the performance of health
care organizations based on the CMS health care outcomes, processes, patient survey, and imaging
results. According to the HCPE model:

Health Care Criteria and Organizational Performance 7
Visionary leaders should serve as role models through their ethical behavior and their
personal involvement in planning, communicating, coaching the workforce,
developing future leaders, and reviewing organizational performance. Leaders should
set directions and create a patient focus, clear and visible organizational values, and
high expectations for the workforce. Leaders should ensure the creation of strategies,
systems, and methods for achieving performance excellence in health care, stimulating
innovation, building knowledge and capabilities, and ensuring organizational
sustainability. Leaders should inspire and encourage the entire workforce to
contribute, to develop and learn, to be innovative, and to embrace meaningful change.
(NIST, 2011-2012, p. 49)
Moreover, the HCPE model offers a systematic, holistic approach for hospital governance
that can provide answers to questions such as how business systems interrelate, adapt, learn, and
improve. Senge (2006a) noted that collective thinking and understanding of the systemic
connectivity within organizations must transcend organizational, temporal, and spatial boundaries
to redefine the organization and its function at all levels of organizations, communities, and
society. For the health care industry specifically, this study provides support to hospital
governance boards and trustees in their efforts to guide the complex hospital professional
bureaucracies and professional staff to improve overall organizational performance, without the
need to become technical experts or overly dependent upon the professional staff (Culbertson &
Hughes, 2008). The IHI identified key governance leadership activities to improve quality and
reduce harm. One recommendation was that boards spend more than 25% of their meeting time on
quality and safety issues, including a full board conversation with at least one patient, or family

Health Care Criteria and Organizational Performance 8
member of a patient, who sustained serious harm at their institution within the last year (Institute
for Healthcare Improvement [IHI], 2008). According to the Commonwealth Center for
Governance Studies (Prybil, Levey, Killian, Fardo, Chait, Bardach, & Roach, 2012), hospitals and
health care systems must have the discipline and commitment to organize their governance
structures and practices to provide “forward-thinking leadership and evidence-based outcomes”
that will assist in advancing their governance practices. It was the governance board of the Mayo
Clinic in 2004 that recommended the adoption of the HCPE as a business model, and by 2007,
seven of the 12 Mayo Health System organizations were using the HCPE (Fischer, 2007). During
that period, the Mayo Clinic Board of Trustees was composed of 23 total members, including three
doctors and seven chief executive officers (CEO) of major corporations, such as J. W. Marriott, Jr.
of the Marriott Corporation, owner of the Ritz Carlton Hotels and Resorts and 1992 and 1999
recipient of the Baldrige Award, and Frederick W. Smith, founder and CEO of Federal Express
and 1990 recipient of the Baldrige Award (Batalden et al., 2010, p. 171; Notable Names Database,
2012). Although this is not a leadership study, leadership is the key to both creating the high-
performance culture necessary to the adoption of the HCPE model (Schein, 2004) and to educating
future leaders in the health care industry.
Health Care Criteria and Organizational Performance 9
Chapter 2: Literature Review
In theory, there is no difference between theory and practice. In practice there is. - Yogi Berra
Overview of Chapter
The chapter begins by setting the stage for understanding the Baldrige Award program and
the HCPE, noting that the HCPE function as a continuous organizational performance
improvement model that includes all aspects of the organization such as leadership, strategic
planning, the customer, workforce, processes, and systems. The HCPE are not the responsibility
of a quality or regulatory department or function within the organization but instead the
responsibility of senior leadership, specifically the CEO. The HCPE model for continuous
organizational performance improvement has been used as a framework to align resources and
initiatives (such as the ISO 9001 international quality management standard, lean enterprise, and
Six Sigma), to improve communication, productivity, and effectiveness and to achieve
organizational strategy.
The U.S. Congress created the Baldrige Award program in 1987 as a national education
program developed to enhance the competitiveness of U.S. businesses and improve performance.
A brief overview of the history of quality and continuous improvement will provide the
background of events that led to the development of the Baldrige Award program. This
historiographical approach to understanding quality will address the events, theories, and best
practices that influenced the design of various quality programs and attempts to improve
organizational performance that are the basis for much of the quality today. These theories and
accepted best practices will illuminate the often-confusing array of quality movement initiatives.
Moreover, the relationships of these theories and accepted best practices to the hypothesis stated in

Health Care Criteria and Organizational Performance 10
previous chapter will be described in detail in Chapter 3 (Shi, 1997). The outline of this chapter is
as follows:
1. An introduction to the history of quality and the development of the Baldrige Award Program;
2. The CPE/HCPE model and the design of the CPE/HCPE framework and the process for
achieving the Baldrige Award;
3. The role of systems theory, systems thinking, and moving beyond linear thinking;
4. The evolution of quality strategies and programs, including statistical process control, Lean,
Six Sigma, total quality management, constraints management, and the Balanced Scorecard;
5. The Baldrige Health Care award recipients from 2002 through 2011;
6. The conception of applying quality standards and models to health care;
7. Programs to improve health care quality, such as accreditation programs, including the Joint
Commission and the ISO 9001 international quality management standard and the Patient
Protection and Affordable Care Act;
8. The gaps in knowledge in quality and performance improvement, including the HCPE;
9. CMS measures and Hospital Compare database in literature; and
10. Closing observations.
Based on current literature, this chapter provides the conceptual framework that supports
the overall theory for this dissertation and concludes with the values of this study in improving
health care outcomes.
Introduction to History of Quality and the Development of Baldrige Award Program
History of Quality. The body of literature related to the development of quality and
performance improvement is immense. This study began with the history, theory, practice, and
management of quality and resulting performance improvement. The study of quality and

Health Care Criteria and Organizational Performance 11
performance improvement began with the study of philosophy and nature of humanity. Ancient
philosophers performed a great deal of analysis to understand the world, studying language,
vocabulary, ideas, truth, reality, and methods and tacitly embedding this knowledge into the
implementation of working principles to improve understanding. Thus, for thousands of years
humans have sought to understand the world in an effort to improve their lives and their
conditions. This understanding of the world was critical to the survival of societies that learned
how to improve planning, decision making, resource allocation, and leadership.
The accomplishments of ancient society’s architectural marvels, such as the Great Wall of
China, Roman aqueducts and roads, and Egyptian pyramids, are well known. Less well-known
and often overlooked have been societies’ attempts to manage health, safety, and quality
(commerce). Historical records describe the laws ancient societies created to protect people,
commerce, and the society or government. For example, the concept of consumer protection dates
back to the Code of Hammurabi (c. 2000 B.C.), which “prescribed the death penalty for any
builder of a house that later collapsed and killed the owner” and the “Mark of the Seal,” critical to
commerce throughout history by ensuring the identity of the producer, traceability, and quality
(Juran, 1995, p. 614). Since ancient times, governors and rulers have created laws and regulations
to manage the activities of individuals and society.
Ancient philosophers studied the nature of humanity and the natural world, areas of study
that today would be considered the fields of physics, biology, and other natural sciences. Ancient
philosophers recognized that humans have the capacity to reflect on decisions and behavior, which
is a function of our desires, beliefs, and values (Perry, Bratman, & Fischer, 2010). The concepts of
values and resulting behaviors are core to the character of humans. The word for “character” in
Ancient Greek was ethos, from which we get our word ethics. The Greek philosopher Heraklitos,
Health Care Criteria and Organizational Performance 12
held that a person's “ethos is their daimon, or fate, thus man's character is his fate, which translates
in today’s language as ‘we hold our destiny in our own hands by virtue of our character’”
(Geldard, 2000, p. 85).
Before focusing specifically on the literature relative to quality and performance
improvement over the past 100 years, acknowledging how the evolution of human development
relates to quality bears mentioning because the concept of quality dates back to ancient times and
has been part of the fabric of human history. For example, the concept or idea of “progress” dates
back to the time of the Greeks and Romans, with the ideals of moral, spiritual, and material
improvement as well as the advance of knowledge—more particularly the kind of practical
knowledge contained in the arts and sciences. The view of all history may be seen as one of
humanity improving itself, step by step, stage by stage, through immanent forces, until at some
remote time in the future a condition of near-perfection for all will exist (Nisbet, 1979). This
concept of improvement, whether incrementally or through breakthroughs, is the basis of all
human learning and improvement of societies.
Joseph M. Juran’s (1995) historiography of quality covers the development and application
of quality tenets from ancient societies to current times. In the beginning of recorded history,
China’s autocratic form of government, dating back to twenty-first century B.C., controlled
political, military, cultural, and economic activities. China’s quality control system dates back to
the Western Zhou Dynasty (eleventh century to eighth century B.C.) when five large government
departments controlled (a) the production, collection, storage, and distribution of raw materials; (b)
the production and manufacturing of goods; (c) the storage and distribution of completed products;
(d) formulating and executing standards; and (e) supervision and examination (Juran, 1995, pp. 2-
6). The first three departments managed the process of creating goods, and the second two ensured

Health Care Criteria and Organizational Performance 13
the quality of the products through standards, inspection, and testing. The ancient kingdoms of
Israel and Judea also had laws that regulated work. Additionally, the concepts of product quality,
specifications, and laws are present in the Old Testament in the descriptions of Creation, Noah’s
ark, the Ark of the Covenant, the Exodus from Egypt by the Israelites, and the ancient cities of
Sodom and Gomorrah (Juran, 1995). The Ancient Greek civilization lasted from the Archaic
period of the eighth to sixth centuries B.C. to the end of Antiquity around 600 A.D. and is known
for the use of standards, specifications, regulations, and planning. The Ancient Greeks developed
science, technology, history, medicine, mathematics, economics, architecture, and the major fields
of philosophy (Juran, 1995, pp. 63-65). The works of Aristotle, Archimedes, Euclid, Plato,
Socrates, and Hippocrates all had a profound influence on Western culture (Perry, Bratman, &
Fischer, 2010). The Greek philosopher Hippocrates is credited with being the first person to
believe that diseases were caused naturally, not because of superstition and gods, and this
prognosis went unchallenged in the Western world until scientific advances in the nineteenth and
twentieth centuries supported many of his ideas (Jouanna, 1998). Thus, the concepts of quality
and improving performance are part of the effort of humans to learn and improve and part of the
story of the evolution of humanity for thousands of years.
The Industrial Revolution and the evolution of the scientific method were also part of this
story of human evolution and set the stage for a climate that fostered continuous quality
improvement through learning and development. Frederick Winslow Taylor’s “Scientific
Management” incorporated strategies of separating planning from execution, of standardization,
and of improved working conditions that propelled an increase in productivity (Juran, 1995).
Henry Ford adopted Taylor’s methodology in 1913 with the design and operation of the Highland
Park car plant in Detroit to produce the Model T (Waddell & Bodek, 2005). In 1918, Walther A.

Health Care Criteria and Organizational Performance 14
Shewhart joined the Western Electric Company at the Hawthorne Works outside Chicago in
Cicero, Illinois. Hawthorne Works was the center of many well-known industrial studies, as well
as the concept of the Hawthorne effect, coined in 1955 by Henry A. Landsberger, who studied and
analyzed data from experiments at Hawthorne Works performed between 1924 and 1932 by Elton
Mayo (Shuttleworth, 2009).
The scientific method provides the framework for the development of quality and
performance improvement during the past century. The modern scientific method was built upon
the works of Galileo Galilei (1564-1642) and the philosopher Francis Bacon (1561-1626), the
latter who developed the concept of inductive learning as a basis for science rather than the
deductive logic common in the 1600s (Moen & Norman, 2010). The work of Galileo and Bacon
was the foundation for the development of the concept of pragmatism by three noted philosophers.
The first was Charles Peirce who was influenced by Immanuel Kant (1724-1804); second was
William James (1842-1910), who studied with French philosopher, Charles Bernard Renouvier
(1815-1903); and last was John Dewey (1859-1952), philosopher, psychologist, and educator, who
led the integration of pragmatism and empiricism by Clarence Irving Lewis (1883-1964) (Moen &
Norman, 2010). During the 1920s and 1930s Shewhart, Harold F. Dodge, and W. Edwards
Deming developed the concepts of control charts, sampling plans, and statistical process in
attempts to understand and reduce process variation (Watson, 2005). Shewhart developed the
Shewhart learning and improvement cycle by combining management thinking with statistical
analysis, which led to continuous improvement (Juran, 1995). Figure 1 is a depiction of the
evolution of the scientific method and PDSA cycle depiction presented by Moen and Norman
(2010, p. 24).
Health Care Criteria and Organizational Performance 15
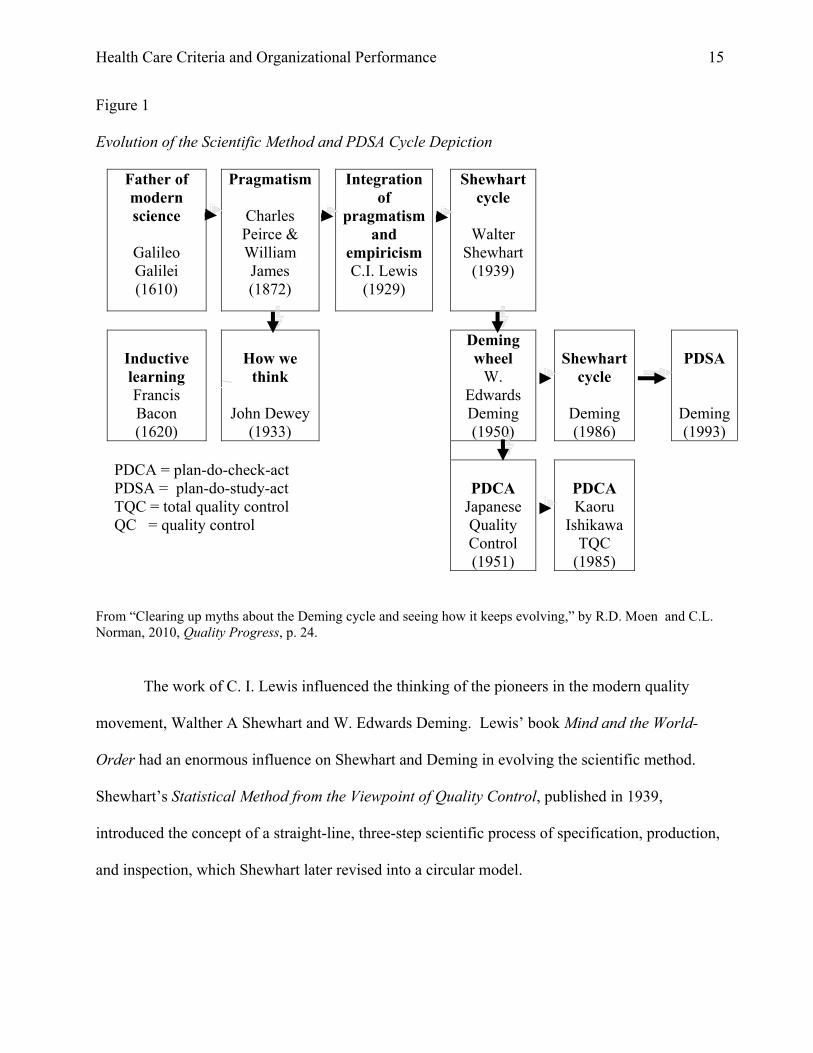
Figure 1
Evolution of the Scientific Method and PDSA Cycle Depiction
Father of modern science
Galileo Galilei (1610)
Pragmatism
Charles Peirce & William James (1872)
Integration of
pragmatism and
empiricism C.I. Lewis
(1929)
Shewhart cycle
Walter
Shewhart (1939)
Inductive learning Francis Bacon (1620)
How we
think
John Dewey (1933)
Deming wheel
W. Edwards Deming (1950)
Shewhart
cycle
Deming (1986)
PDSA
Deming(1993)
PDCA = plan-do-check-act PDSA = plan-do-study-act TQC = total quality control QC = quality control
PDCA
Japanese Quality Control (1951)
PDCA Kaoru
Ishikawa TQC
(1985)
From “Clearing up myths about the Deming cycle and seeing how it keeps evolving,” by R.D. Moen and C.L. Norman, 2010, Quality Progress, p. 24.
The work of C. I. Lewis influenced the thinking of the pioneers in the modern quality
movement, Walther A Shewhart and W. Edwards Deming. Lewis’ book Mind and the World-
Order had an enormous influence on Shewhart and Deming in evolving the scientific method.
Shewhart’s Statistical Method from the Viewpoint of Quality Control, published in 1939,
introduced the concept of a straight-line, three-step scientific process of specification, production,
and inspection, which Shewhart later revised into a circular model.

Health Care Criteria and Organizational Performance 16
According to Moen and Norman (2010), Shewhart identified a relationship between the
“three steps in the mass production process of (1) specification, (2) production and (3) inspection,
which correspond respectively to (1) hypothesizing, (2) carrying out an experiment and (3) testing
the hypothesis. The three steps constitute a dynamic scientific process of acquiring knowledge.”
Figure 2 is a depiction that contrasts the two views of Shewhart’s idea of “specification,
production, and inspection” and became known as the Shewhart cycle (Moen & Norman, 2010, p.
25).
Figure 2
Shewhart Cycle – 1939 depiction
Shewhart straight-line process
Step one Step two Step three
Specification Production Inspection
Shewhart cyclical concept
From “Clearing up myths about the Deming cycle and seeing how it keeps evolving,” by R.D. Moen and C.L. Norman, 2010, Quality Progress, p. 25.
Specification
Production
Inspection

Health Care Criteria and Organizational Performance 17
Deming built on Shewhart’s cycle and presented the new version of the cycle in 1950 at an
eight-day seminar in Japan sponsored by the Japanese Union of Scientists and Engineers. His
presentation stressed the importance of constant interaction among the four steps of (1) design, (2)
production, (3) sales, and (4) research, with the aim of the quality of product and service. Figure 3
depicts the model for the Deming cycle or the Deming circle.
Figure 3
Deming Wheel – 1950 Depiction
1. Design the product (with appropriate tests). 2. Make the product and test in the production line and in the laboratory. 3. Sell the product. 4. Test the product in service and through market research. Find out what users think about it and why non-users have not bought it. From “Clearing up myths about the Deming cycle and seeing how it keeps evolving,” by R.D. Moen and C.L. Norman, 2010, Quality Progress, p. 25.
Japanese executives redesigned the wheel Deming presented in the 1950 seminars into the
Plan–Do–Check–Act (PDCA) cycle. Table 1 shows Imai’s description of the relationship between
the Deming wheel and the PDCA cycle.
1
2
3
4

Health Care Criteria and Organizational Performance 18
Table 1
The Deming Wheel vs. the Japanese PDCA Cycle Depiction
1. Design = Plan Product design corresponds to the planning phase of management.
2. Production = Do Production corresponds to doing, making, or working on the product
that was designed.
3. Sales = Check Sales figures confirm whether the customer is satisfied.
4. Research = Act If a complaint is filed, it must be incorporated into the planning phase
and action taken in the next round of efforts.
From “Clearing up myths about the Deming cycle and seeing how it keeps evolving,” by R.D. Moen and C.L. Norman, 2010, Quality Progress, p. 25.
The resulting Japanese PDCA cycle, shown in Figure 4, defines the continuous circular nature of
the four-step cycle for problem solving.
Figure 4
Japanese Plan–Do–Check–Act (PDCA) Cycle - 1951 Depiction
From “Clearing up myths about the Deming cycle and seeing how it keeps evolving,” by R.D. Moen and C.L. Norman, 2010, Quality Progress, p. 25.
In 1986, Deming redefined the Japanese Plan–Do–Check–Act cycle from 1950 to a Plan–
Do–Study-Act (PDSA) cycle to focus on the aspect of studying the variation, system, and
Plan
DoCheck
Act

Health Care Criteria and Organizational Performance 19
information needed for planning and decision making (Best & Neuhauser, 2006). Figure 5 depicts
the PCSA cycle.
Figure 5
Shewhart Cycle: Deming - 1986 Depiction
Deming again redefined the cycle as Plan–Do–Study-Act (PDSA) cycle to focus on the
aspect of studying the variation, system, and information needed for management planning and
Study the results. What did you learn? What can we predict?
Step 1
Step 2
Step 3
Step 4
What could be the team’s most important accomplishments?
What changes might be desirable? What data are available?
Are new observations needed? If yes, plan a change or test.
Decide how to use the observations.
Carry out the change or test decided upon, preferably on a small scale.
Observe the effects of the change or test.
Step 5
Step 6
Repeat step one, with knowledge accumulated.
Repeat step two, and onward
From Out of the crises (p. 88), by W. E. Deming, 1986, Cambridge, MA: MIT, Center for Advanced Educational Services.

Health Care Criteria and Organizational Performance 20
decision making (Best & Neuhauser, 2006). Deming was clear to distinguish between the
Shewhart PDCA cycle and the Deming PDSA circle in 1980 during a roundtable discussion hosted
by the U.S. General Accounting Office. In the proceeding, Deming described the PDCA cycle as a
method for quality control and the PDSA as a management program with the aim of studying,
learning, and prediction (Proceedings of a roundtable discussion on product quality - Japan vs. the
United States, 1980). The PDSA cycle, also known as the Deming Wheel, was simple and elegant
in understanding and application and is the basis of many organizational improvement systems
today including many of the Baldrige Health Care Award recipients.
Figure 6
PDSA Cycle: Deming – 1993
From The New Economics for Industry, Government, Education (p. 132), by W. E. Deming, 1994, Cambridge, MA: Massachusetts Institute of Technology, Center for Advanced Educational Services.
In the early 1990s, the Hospital Corporation of America (HCA) customized the Deming
PDSA cycle and created the FOCUS-PDCA methodology for application in health care. FOCUS-
PDCA is an acronym that adds five basic steps to the PDSA cycle of the performance
Plan
Do
Study
Act
Do – Carry out the change or test (preferably on a small scale).
Study – Examine the results. What did we learn? What went wrong?
Act – Adopt the change, abandon it, or run
through the cycle again,
Plan – A change or test aimed at

Health Care Criteria and Organizational Performance 21
improvement process: F – Find an opportunity to improve, O – Organize a team who understands
the process, C – Clarify the current knowledge of the process, U – Understand the cause of process
variation, and S – Select the process improvement (Merritt, Morrison, Satterwhite, Smith,
Thomason, & Thompson, 2001).
Over time, the definition of quality changed in various ways. Juran (1999) provided two
definitions: (a) products or services that “meet customer needs resulting in improved customer
satisfaction thereby increasing income” and (b) “freedom from deficiencies or errors” that reduce
rework and waste, which improves income and reduces customer desertion. W. Edwards Deming,
on the other hand, had both a simple definition and a more complex definition of the concept of
quality. His simple definition was “quality is doing things right the first time” while his more
complex definition suggests a product or service is of high quality if “customers perceive good
value for their purchases, remain loyal in their purchases, urge others to buy the product or service,
and transfer those sentiments to other products or services from the same company” (Deming,
1986, p. 5). Deming's approach to quality challenged management, for he asserted that
management is responsible for 85% of all quality problems: management defines and controls
processes, policies, personnel practices, equipment, facilities and supplies; therefore, management
must take the lead for quality (Deming, 1994).

Health Care Criteria and Organizational Performance 22
Figure 7
FOCUS-PDCA methodology
During the 1970s and the notable expansion of the global markets, U.S. organizations
realized they were in competition with others across the world, in particular the auto industry in
Japan. When compared to American companies, organizations in Japan were different in every
way. The Japanese leadership, strategy development and execution, customer focus, measurement
and analysis, as well as the development and management of human capital, were completely
Plan
Do
Check
Act
Plan
Do
Check
Act

Health Care Criteria and Organizational Performance 23
different. By 1980, the U.S. consumer valued products made in Japan as superior in value and
quality. In June 1980, the U.S. television network NBC aired a special documentary featuring
Japan’s postwar recovery, entitled “If Japan Can, Why Can’t We?”, based on a NBC white paper.
The documentary showed American autoworkers destroying cars made in Japan and members of
Congress smashing Japanese-made stereos and cars. The claim in the documentary was that the
Japanese business techniques were better than those used by U.S. businesses. The documentary
described how American management largely ignored the knowledge taught by American quality
gurus such as W. Edwards Deming, and how Japanese manufacturers were receptive to learning
and improving the quality of their products and processes to be competitive in the global market.
Development of Baldrige Award Program. U.S. business leaders and the White House
recognized the challenge from Japan during the 1970s. In response, in 1977, C. Jackson "Jack"
Grayson, Jr., chair of the U.S. Price Commission from 1971 to 1973 during the administration of
President Richard M. Nixon, founded the American Productivity and Quality Center (APQC)
when the need became apparent for business to emphasize increased productivity and quality.
Grayson envisioned an award that would set national standards and recognize companies that
excelled in productivity and quality. Grayson and co-chair Sanford McDonnell, Chief Executive
Officer of McDonnell-Douglas, brought together business leaders to determine the criteria and
establish an administrative organization for the award. It took four years, 45 meetings (18 of
which were in the White House), and a final 75-page proposal to get the 10 categories of criteria
passed into law. In setting up the program, Grayson worked extensively with Malcolm Baldrige,
the U.S. Secretary of Commerce nominated by President Ronald W. Reagan on December 11,
1980 (American Productivity and Quality Center, 2012). Malcolm Baldrige served as the

Health Care Criteria and Organizational Performance 24
Secretary of Commerce from 1981 to 1987 and was closely involved in the creation of the award
until the time of his death in a rodeo accident in 1987 in California (Victor & Koch, 2012).
In 1987, Congress passed into law the Baldrige Award program, named in honor of the
quality-passionate Secretary of Commerce. The Baldrige Award was largely viewed by Grayson
and industry leaders as a counterpart to Japan's Deming Prize created in 1950 in honor of W.
Edwards Deming. (Many Japanese government and academic leaders credit Deming with
revolutionizing Japanese post-war industry through his advocacy in Japan of quality control and
managerial efficiency.) The specific goal of the Baldrige Award is to heighten U.S. awareness of
performance excellence and formally recognize successful high-performing organizational
management systems (NIST, 2011c). The Baldrige Award depends on the criteria in the Baldrige
Health Care Criteria for Performance Excellence (HCPE), a system-based organizational model
that will be described in more detail in the next section of this literature review. The Baldrige
HCPE are used in 41 states, which function as incubators for the Baldrige Award, and 79 award
programs internationally that include elements of the HCPE, such as the European Quality Award
(EFQM), a HCPE-based program in Japan in addition to the Deming Prose, and the New Zealand
Business Excellence Award (Latham & Vinyard, 2011, p. 1). The Global Excellence Model
(GEM) Council consists of the chief executives of national excellence models and award programs
from around the world. Their role is to manage and maintain a leading-edge position in models of
excellence by reviewing how business trends and external factors could impact the utility and
application of excellence models. In addition to the Baldrige Program from the U.S., GEM
members consist of performance excellence organizations from Australia, Europe, Ibero-America
(Brazil, Mexico, Spain), India, Japan, and Singapore (EFQM, 2012). The Baldrige Program each
year hosts the Quest for Excellence Conference in the Washington, DC, area. This international

Health Care Criteria and Organizational Performance 25
conference provides an opportunity for those interested in improving their organizations to learn
from the Baldrige recipients and attend training seminars. The GEM is represented, for example,
in the 25th Annual Quest for Excellence Conference and Award Ceremony during April 7-10,
2013. Scheduled speakers include Yasufumi Hirai, CEO of Cisco Systems, Japan; Cynthia Payne,
CEO of SummitCare, Australia; Choe Peng Sum, CEO of Frasers Hospitality Pte., Ltd.,
Singapore; and Andreas Sambel, Director of Marketing and Business Excellence for Bosch U.S.
(NIST, 2013).
The CPE/HCPE as a High Performance Model.
In a biological model, deoxyribonucleic acid (DNA) molecules are the design framework
of all modern living organisms. DNA determines the design, structure, and systems of the
organism, and with luck, the design will adapt to the environment and the organism will survive.
For the human organism, the body is the structure and consists of a head, neck, torso, two arms,
and two legs. The design of complex sustainable organisms may consist of a multitude of design
specifications, such as size, which can vary from that of a rat to that of a whale. In the same way,
the HCPE are the design framework for the organization, providing the questions for the
appreciative inquiry process that assists leadership with the design of the organization (Kelm,
2005). Business leaders structure a design to support the strategy developed from an environmental
analysis. The business structure may vary in size and complexity depending on the design created
by the leadership. While the human organism is structured on its skeletal system and depends on
other critical, complex, and adaptable systems of organs to sustain life (such as the circulatory,
repertory, nervous, digestive, and endocrine systems), business systems such as financial, health
and safety, customer relationship, operational, and leadership systems are required to sustain the
life of the business. The human body’s systems must work efficiently and effectively together to

Health Care Criteria and Organizational Performance 26
maintain a constant internal balance to sustain life, and in the business system, the Balanced
Scorecard strategic planning methodology allocates resources necessary to achieve balance in
business (Kaplan & Norton, 1996).
The tools and techniques of Lean methodology (just-in-time inventory, cycle time
reduction, etc.) are used in business systems to improve efficiency while the Six Sigma tools and
methodology reduce variation of the system’s processes (Pyzdek, 2003). The human body systems
are necessary to sustain life and are used in balance to manage the body’s functions. In business, it
is the role of the leadership to monitor failing systems and improve the organizational performance
to ensure sustainability. Use of the HCPE provides the organization with a framework to create a
learning organization that is dynamic and that can adapt to meet the needs of the complex business
environment (Senge, 2006b).
In other words, the HCPE are the architect’s blueprint or framework for creating a high–
performing, sustainable organization. The design provides an aligned, adaptive, integrated, and
systematic approach for organizational product and process improvement and sustainability. The
HCPE framework is a set of open-ended questions with no one correct answer. To answer the
questions, the organization must be creative, innovative, and free to incorporate all knowledge
developed over the past 100 years in academics and a multitude of global industries, including
health care. This presents a challenge to some organizations because the HCPE do not offer a
cookbook of recipes or secret answers to the questions leadership has with respect to
organizational improvement. Nonetheless, the HCPE are available to anyone with the desire and
discipline to “study,” learn, and improve. The HCPE provide the blueprint to build the building
(organization) but does not dictate to the leadership and workforce the necessary tools, technology,

Health Care Criteria and Organizational Performance 27
or knowledge to build the systems and processes. The HCPE instead offer a set of improvement
tools, including Lean Six Sigma tools.
Since the 1980s, leaders of organizations have rolled out various programs and strategies to
improve performance. Strategies such as total quality management (TQM) and continuous quality
improvement (CQI) provide a source of knowledge necessary for understanding the HCPE and
will assist health care organizations in answering the HCPE questions. In addition, learning from
and applying the knowledge developed by various organizations committed to improving health
care is important to the greater understanding of how to operationalize the HCPE model.
Examples of these organizations include (a) the Institute for Healthcare Improvement (IHI), (b)
Physician Consortium for Performance Improvement (PCPI), (c) The Leapfrog Group, (d)
National Quality Forum (NQF), (e) CMS, (f) The Joint Commission, (g) ISO 9001 Quality
Management Standard, and (h) the American Society for Quality (ASQ). The HCPE allow for
inclusion of any or all the above-mentioned tools and knowledge from academies and professional
organizations. This study will address the details on these tools, knowledge, organizations, and
strategies committed to improve health care.
The CPE/HCPE Model. The National Institute for Standards and Technology (NIST) is
responsible for the management of the Baldrige Program, which is a public-private partnership and
promotes U.S. innovation and industrial competitiveness. The Baldrige Program is a “national
education program based on the HCPE model to improve organizational performance” (NIST,
2011-2012, p. i). Although not addressing health care specifically, Werner (2007, p. 34)
recommended the adoption of the CPE improvement model as a whole system model that
provides a systems perspective for managing an organization and its key processes to achieve
performance excellence results. The HCPE have seven categories and an organizational profile

Health Care Criteria and Organizational Performance 28
with 40 areas to address (NIST, 2011a). The HCPE have a set of questions used to meet and
achieve the HCPE. These questions are based on 11 core values and concepts, which define
excellence for the organization (NIST, 2011-2012). The HCPE design includes interdependent
system of processes, activities, and practices that make up three essential competencies: strategic
leadership, execution excellence, and organizational learning. The HCPE focus on 15 systems and
28 specific processes necessary to achieve and sustain performance (Latham & Vinyard, 2011).
As evidence of the effectiveness of the CPE/HCPE, for example, Leonard (2006, p. 15)
wrote that Baldrige Program recipients from the 1988 to 2002 award cycles performed
significantly better than the industry medians in terms of profitability and asset utilization with
more leveraged debt and greater spending on capital expenditure, research and development, and
advertising. Figure 8 depicts the seven categories in the HCPE framework and demonstrates the
interrelated nature of the criteria in each category.

Health Care Criteria and Organizational Performance 29
Figure 8
HCPE Category Framework Depiction
From Health care criteria for performance excellence (p. iv), by the National Institute of Standards and Technology, 2011-2012, retrieved from http://www.quality.nist.gov/HealthCare_Criteria.htm.
Category 1
Leadership
Category 2
Strategic
Planning
Category 5
Workforce
Focus
Category 7
Results
Category3
Customer
Focus
Category 6
Operations
Focus
Category 4
Measurement, Analysis and Knowledge Management
Baldrige Criteria for Performance Excellence Framework:
Organizational Profile:

Health Care Criteria and Organizational Performance 30
Table 2 provides a brief description of 2011-2012 HCPE categories or constructs. The strength in
the unique design of the HCPE model is its support of a systems perspective, discussed in detail in
the next section.
Table 2
Brief Description of 2011-2012 Health Care Criteria for Performance Excellence
Constructs Description
1. Leadership Examines how senior leaders’ personal actions guide and sustain
the organization. Also examines the organization’s governance
system and how the organization fulfills its legal, ethical, and
societal responsibilities and supports its key communities (NIST,
2011-2012).
2. Strategic
planning
Examines how the organization develops strategic objectives and
action plans. Also examines how strategic objectives are chosen
and action plans are implemented and changed if circumstances
require, and how progress is measured (NIST, 2011-2012).
3. Customer
focus
Examines how the organization engages its patients and
stakeholders for long-term marketplace success. This engagement
strategy includes how the organization listens to the voice of its
customers (patients and stakeholders), builds customer
relationships, and uses customer information to improve and
identify opportunities for innovation (NIST, 2011-2012).
4. Measurement,
analysis, and
knowledge
management
Examines how the organization selects, gathers, analyzes,
manages, and improves its data, information, and knowledge
assets, and how it manages its information technology. The
category also examines how the organization uses review findings
to improve its performance (NIST, 2011-2012).

Health Care Criteria and Organizational Performance 31
Table 2 (continued)
Brief Description of 2011-2012 Health Care Criteria for Performance Excellence
Constructs Description
5. Workforce
focus
Examines the ability to assess workforce capability and capacity
needs and build a workforce environment conducive to high
performance. The category also examines how the organization
engages, manages, and develops the workforce to utilize its full
potential in alignment with the organization’s overall mission,
strategy, and action plans (NIST, 2011-2012).
6. Operations
focus
Examines how the organization designs, manages, and improves
its work systems and work processes to deliver patient and
stakeholder value and achieve organizational success and
sustainability. Also examines readiness for emergencies (NIST,
2011-2012).
7. Results Examines the organization’s performance and improvement in all
key areas—health care and process outcomes, customer-focused
outcomes, workforce-focused outcomes, leadership and
governance outcomes, and financial and market outcomes.
Performance levels are examined relative to those of competitors
and other organizations with similar health care service offerings
(NIST, 2011-2012).
The underlying causal relationships implied in the design structure of the framework of the
CPE/HCPE model utilized in the Baldrige Award remain unchanged across industries. Therefore,
the terms “Malcolm Baldrige National Quality Award framework,” “Baldrige Award framework,”
“Baldrige Award model,” “Baldrige framework,” “Criteria for Performance Excellence (CPE),”
“Health Care Criteria for Performance Excellence (HCPE),” and “Baldrige model” are used
interchangeably but are often industry specific to embody the causal relationships and framework.

Health Care Criteria and Organizational Performance 32
Because the relationships and the skeleton of the frameworks are the same regardless of name, the
business, non‐profit, education, and health care framework is used here on as a representation of
the Baldrige model, the Baldrige Award model, or the Baldrige Award framework.
Design of the HCPE. Like DNA, the HCPE are unique as applied to each organization;
there is no valid comparison among or between organizational models for creating and sustaining
high performance, excluding other international global excellence models earlier described that
were developed from the HCPE. Certainly, leaders have created high-performing organizations
without the use or knowledge of the HCPE, but when analyzed these organizations have embodied
the majority of the criteria depicted in the integrated HCPE framework. After all, much of the
knowledge is taught in business education comes in the context of individual silo courses, and
what is rarely taught is the integration of HCPE or how to manage the “white spaces on the
organizational chart,” which requires a “systems or horizontal understanding of the organization”
(Rummler & Brache, 1995, pp. 5-9), which will be addressed more extensively in the next section.
The HCPE offer a systematic, valid, and reliable model that has undergone decades of
development, implementation, and testing by thousands of organizations in various industries. The
HCPE serve as a non-prescriptive, adaptable, and non-limiting blueprint, framework, or model for
high performance presented as a list of open-ended questions. Since their creation in 1987, the
HCPE have continually evolved over time based on the input from experts and academics as well
as organizations applying the criteria. Each year, organizations across the U.S. utilize the HCPE in
an effort to learn and improve. Examiners who are experts in their fields donate their time and
expertise totaling more than 63,000 hours in support of the process (note that this equals more than
7,800 workdays, or 19 workdays per examiner) (NIST, 2003). Feedback from operating
organizations informs and improves the HCPE and thus institutes a continuous improvement

Health Care Criteria and Organizational Performance 33
process for the HCPE. For example, Flynn and Saladin (2001) studied the validity of the HCPE
framework as it changed over time (specifically 1988, 1992, and 1997) to broaden the constructs
from basic quality management to business excellence. They concluded that most of the changes
made to the Baldrige framework over the years have been significant and beneficial.
A non-prescriptive design, the HCPE are not based on any one management theory but
instead allow for the integration of any management theories, concepts, and best practices
organizations may require to ensure superior levels of performance and sustainability. These
theories cover numerous fields of study such as leadership, strategy development and execution,
marketing, finance, accounting, metrology, decision science, knowledge management, change
management, human capital management, and process management.
Each organization develops varying perspectives along with the structural and contextual
dimensions necessary to achieve high performance. The HCPE require leadership to see and
analyze the organization accurately and deeply to create the optimum organization design and
structure (Daft, 2007, pp. 25, 90). Leaders using the HCPE find mindful reflection is necessary to
provide a level of deep knowledge and vision often missing in strategy development and design
(Boyatzis & McKee, 2005). Leadership may choose to transform the organization by adopting
meta-theories such as Deming’s “System of Profound Knowledge” (Deming, 1994, pp. 92-93),
which begins with the transformation of individuals to understand a new way of thinking. This
transformation includes (a) appreciation for how the interaction of systems affects the
organization; (b) understanding of variation, which is always present and should be expected; (c)
theory of knowledge, which includes learning and knowledge transfer; and (d) psychology, which
includes motivation and engagement of the workforce.

Health Care Criteria and Organizational Performance 34
Although there has been limited scholarly research, some researchers have established the
validity of the HCPE framework or model. One empirical study that has validated the theoretical
model underlying the Baldrige framework was conducted by Meyer and Collier (2001). They
studied the Baldrige Pilot Health Care model in efforts to (a) develop a comprehensive
measurement model, with associated constructs and scales, (b) address whether the seven HCPE
categories represent a good model for health care organizations, and (c) provide insight into the
strength and direction of causation among the seven Baldrige categories. Meyer and Collier tested
the HCPE for the health care industry using data from 220 U.S. hospitals, and the results of
structural equation modeling showed that many of the hypothesized causal relationships in the
HCPE model were statistically significant, confirming the strong relationship between the
processes (Categories 1-6) and results (Category 7). The relationship between processes and
results was addressed by Deming (1986, pp. 2-4) in his chain reaction model, “which was on the
blackboard of every meeting with top management in Japan from July 1950 onward” (see Figure 9
below). Additional research by Wayhan et al. (2010) studied Deming’s theoretical construct,
which postulates that the impact of improved quality on financial performance is primarily indirect
in nature. Wayhan’s group concluded that their results were “entirely consistent with the essence
of Deming’s chain reaction theory of quality” (p. 762).

Health Care Criteria and Organizational Performance 35
Figure 9
Deming’s Chain Reaction Model Depiction
Improve
quality
Decrease cost
(less rework,
delays, and
mistakes)
Improve
productivity
Capture
market with
better quality
and lower
prices
Stay in
business
Provide
jobs and
more jobs
From Out of the crises (p. 4), by W. E. Deming, 1986, Cambridge, MA: MIT, Center for Advanced Educational Services.
The HCPE focus on creating value and sustainability and have a non-prescriptive design to
encourage creative thinking. The HCPE are adaptable to any theory, standard, or best practice and
encourage organizations to be open to continuous change and improvement. The HCPE are non-
prescriptive for the following three reasons. First, they focus on results, not on procedures,
improvement tools (such as Lean Six Sigma), or organizational structure. Second, the selection of
tools, techniques, systems, and organizational structure varies with an organization’s type and size,
organizational relationships, stage of development, and capabilities and responsibilities of the
workforce. Third, a focus on common requirements, rather than on common procedures, fosters
understanding, communication, sharing, alignment, and integration. The HCPE’s open design
“encourages creativity and innovation” while enabling the HCPE to integrate key health care
themes, such as the patient and stakeholder as key customers, complex leadership structures, and
the multiple roles of health care providers, including physicians, staff members, suppliers, and
customers (NIST, 2011-2012, p. 55).

Health Care Criteria and Organizational Performance 36
Another focus of the HCPE is in maintaining organization-wide goal alignment, which is
embedded in the integrated structure of the HCPE, including core values, scoring guidelines, and a
focus on results and cross-process linkages. HCPE alignment is built around connecting and
reinforcing measures derived from an organization’s processes and strategy. The HCPE systems
perspective recognizes that strategy and goals change over time, which requires dynamic linkages
among HCPE items. The understanding of the HCPE begins with the organizational strategy and
the systems with related processes created to execute the strategy. In the HCPE, action-oriented
cycles of improvement take place via feedback between systems, processes, and results along four
defined stages. The first is the approach (A), which involves planning, including design of
systems, processes, measures, and deployment of requirements. Second is the deployment (D),
which includes executing plans. Third is learning (L) by assessing progress and capturing new
knowledge, including seeking opportunities for innovation. Fourth is integration (I), which
includes revising plans based on assessment findings, harmonizing processes and work unit
operations, and selecting better metrics. These four stages, known as ADLI, represent levels of
organizational maturity during the scoring process (NIST, 2011-2012). Quantifying the levels of
organizational maturity on a scale from 0 to 1,000 is the role of the HCPE scoring process.
Scoring of responses to HCPE items and Baldrige Award applicant feedback are based on
two evaluation dimensions process and results. The “process” refers to the methods the
organization uses and improves to address the item requirements in Categories 1–6. The four
factors used to evaluate process are approach, deployment, learning, and integration (ADLI)
(NIST, 2011-2012). The results section is Category 7, which refers to the organization’s outputs
and outcomes in achieving the requirements in the following items: “7.1 Health Care and Process
Outcomes, 7.2 Customer-Focused Outcomes, 7.3 Workforce-Focused Outcomes, 7.4 Leadership

Health Care Criteria and Organizational Performance 37
and Governance Outcomes, and 7.5 Financial and Market Outcomes” (NIST, 2011-2012, pp. 23-
26). The four factors used to evaluate results are levels, trends, comparisons, and integration
(LTCI) (NIST, 2011-2012). As described in Flynn and Saladin’s research and Deming’s chain
reaction model, there is a systems relationship between the process and results. The approach,
deployment, learning, and integration of processes are linked to the performance results of the
processes. The results show performance levels, trends, and relevant comparisons for key
measures and indicators of organizational performance and integration with key organizational
requirements. The performance results relate directly to deployment and organizational learning;
if improvement processes are widely shared and deployed, there should be corresponding results.
A score for a results item is thus a composite based on overall performance, taking into account the
four results factors (LTCI) (NIST, 2011-2012).
This section has identified how the unique non-prescriptive design of the HCPE is a basis
for international performance excellence models, systems, or horizontal understanding of the
organization, and allows for the integration of any management theory, concept, and best practice.

Health Care Criteria and Organizational Performance 38
Although no published academic or scholarly work identifies weaknesses of the HCPE,
challenges with learning and using the HCPE include (a) the level of complexity, (b) the necessity
of learning new mental models, (c) the adoption of a philosophy of continual learning and
improvement, and (d) the creation of a culture that fosters high performance, reliability, and
sustainability. Overcoming these challenges and achieving the levels of performance necessary to
receive the Baldrige Award takes the total commitment of all levels of leadership to creating a
high-performing learning organization, and years of cycles of reflection, self-assessment, learning,
and transformation (Latham & Vinyard, 2008). Ultimately, organizational performance is the
responsibility of the leadership to “create consistency of purpose for improvement,” as described
by Deming (1982, pp. 24-25).
The HCPE High-Performance Business Model. Several researchers have studied the
general impact of the HCPE and quality awards on organizational results, with encouraging results
for application and future research. For example, Evans and Jack (2003) studied the HCPE
specifically and identified relationships between employee satisfaction, process performance, work
system improvement, and organization productivity. This study provided pioneering evidence that
validates the HCPE-based Baldrige model and the relationship between high-performance
management practices and business results. In other words, the results of this study supported
long-standing beliefs and anecdotal evidence that improving internal management practices leads
to improvements in external results.
In a different study of organizations that had received quality awards (including the
Baldrige award), Hendricks and Singhal (1997) explored the hypothesis that implementing
effective total quality management (TQM) programs improves the operating performance of firms,
with winning quality awards being used as a proxy for effective TQM implementation.

Health Care Criteria and Organizational Performance 39
Specifically, this study reviewed a ten-year period of performance—six years before and three
years following the year of receiving the first quality award—and observed the mean and median
change in the operating income. The award winner group reported an average operating income
and a median income that were 107% and 48% higher, respectively, than that of the control
sample. During the same period, the mean and median change in sales for the test sample were
respectively 64% and 24% higher than that of the control sample. Additionally, changes in the
ratios of operating income to assets, to sales, and to employees were higher relative to the control
by about 20% (Hendricks & Singhal, 1997, p. 1271).
In a follow-up study, Hendricks and Singhal (2001) analyzed long-run stock price
performance of firms with effective TQM programs, comparing stock price performance of award
winners against various matched control groups for a five-year implementation period and a five-
year post-implementation period. Results demonstrated that, for the implementation period, no
difference in the stock price performance existed, but for the post-implementation period, award
winners significantly outperformed firms in the various control groups, with the mean
outperformance ranging from 38% to 46%. According to the authors, “the results clearly indicate
that effective implementation of TQM principles and philosophies leads to significant wealth
creation” (Hendricks & Singhal, 2001, p. 359).
To demonstrate the quantitative correlation between recipient award winners and market
performance, the NIST, the program manager organization for the Baldrige Award, created a
fictitious stock fund made up of publicly traded U.S. companies that received the Baldrige Award
between 1991 and 2000. The “Baldrige Index” was created with a hypothetical investment of
$1,000 in each of the whole company winners—Eastman Chemical Company (1993 winner) and
Solectron Corp. (a winner in 1991 and 1997)—and the parent companies of 18 subsidiary

Health Care Criteria and Organizational Performance 40
recipients, and a second hypothetical sum of $1,000 was invested in the S&P 500 for the same time
period. The two Baldrige companies outperformed the S&P 500 by almost 4.5 to 1, a 512% return
on investment. The group of whole company winners plus the parent companies of subsidiary
winners outperformed the S&P 500 by about 3 to 1, achieving a 323% return on investment,
compared to a 110% return for the S&P 500 (NIST, 2002).
The recipients of the Baldrige Award provide compelling evidence that the adoption of the
CPE as a business model creates organizational results that support continuous improvement,
resiliency, and sustainability. For example, the Ritz Carlton Hotel Company, LLC is one of five
organizations that have sustained high performance over time and have twice received the Baldrige
award (1992 and 1999). The other four organizations include Solectron Corp. (1991 and 1997),
Texas Nameplate Company, Inc. (1998 and 2004), Sunny Fresh Foods, Inc. (1999 and 2005), and
MEDRAD, Inc. (2003 and 2010).
A NIST study looked at three areas of potential growth, such as revenue and jobs. The
results for job growth for the Baldrige recipients was 63%, compared to the average job growth of
3.2% for matching industries and time period, according to the Bureau of Economic Analysis and
the Bureau of Labor Statistics (NIST, 2012a). In 2011, Thomson Reuters released a report finding
that Baldrige hospitals (those that either received a site visit or the Baldrige Award at the national
level) outperformed non-Baldrige hospitals on nearly all of the measures of performance used in
the Thomson Reuters 100 Top Hospitals. Baldrige-recipient hospitals were six times more likely
to count among the 100 Top Hospitals, which represent the top 3% of hospitals in the United
States. Baldrige-recipient hospitals also outperform other hospitals in the 100 Top Hospitals on
the following Thomson Reuters measures: risk-adjusted mortality index, risk-adjusted
complications index, patient safety index, CMS core measures score, severity-adjusted average

Health Care Criteria and Organizational Performance 41
length of stay, and adjusted operating profit margin (Foster, 2011). Finally, hospitals that have
received the Baldrige Award have lower rates of mortality and complications, higher profit
margins, and higher improvement levels than other hospitals in the 100 Top Hospitals (top 3%
nationwide) designated by Thomson Reuters. For example, the Advocate Good Samaritan
Hospital reported a 24% reduction over three years in its risk-adjusted mortality rate, exceeding the
top level for its six-county region, while Mercy Health System reduced its mortality resulting from
congestive heart failure by 38% over four years. Moreover, Robert Wood Johnson University
Hospital at Hamilton reported a 95% reduction in mortality resulting from acute myocardial
infarction and a nearly 61% reduction in mortality resulting from congestive heart failure over four
years (NIST, 2012a).
The effects of the Baldrige Program are contagious, especially in health care. The Baldrige
Award and the Baldrige Award recipients constitute the visible centerpiece of the Baldrige
Program. In 2011, there were 69 applicants for the Baldrige Award, which included 40
applications from health care organizations. Between 2005 and 2011, 522 U.S. organizations
applied for the Baldrige Award. In 2010, 83 applications were submitted, which accounted for
277,700 jobs, 1,500 work locations, over $38.5 billion in revenues/budgets, and an estimated 80
million customers served. The value of the services volunteered by the 578 Baldrige examiners in
2010 was estimated at $8.8 million. In addition, 2,270 state Baldrige-based examiners volunteered
about $29.5 million in services to evaluate 1,350 organizations at the state level in 2010 (NIST,
2011b). Since the initial award in 1988, there have been 1,530 applications for the award with
only 95 organizations receiving the Baldrige Award. In health care, since 1999 there have been
382 applications and 15 recipient organizations (NIST, 2011e).

Health Care Criteria and Organizational Performance 42
Given the results of the organizational performance research, the more than 20 years of
history, and the 79 international award programs based on the CPE, why are the CPE not widely
known, accepted, or taught in business schools? This question has not been addressed in research.
The CPE’s cross-functional systems design and limited visibility among industry leaders and
academics presents a challenge to traditional research approaches along functional areas.
Likewise, business leaders have difficulty with the model because they were not educated or
trained to understand the CPE, and the weaknesses presented earlier—complexity, new mental
models, continual learning and improvement, culture that fosters high performance—seem
insurmountable hurdles to overcome.
Another reason for the surprising absence of CPE in business education is because
organizations frequently undertake the CPE as a self-assessment exercise rather than a
management strategy. Even well-managed organizations quickly realize that there are tremendous
gaps in their organization during self-assessment processes that require intense engagement by
senior leadership, specifically the CEO. The average company scores 150–200 out of a 1,000
points on their self-assessment, and government agency scores 80–150; in comparison, state award
recipients have scored over 450 points and national Baldrige Award recipients score over 600
points out a possible 1,000 points (Latham & Vinyard, 2011, p. 578). Once leaders are exposed to
a quantifiable reality of the current state of their organization, they either discredit the HCPE
model for a lack of understanding or question if the organization has the resolve to commit to a
long-term, continual, focused, and dedicated effort. The journey to performance excellence
requires a senior leadership team and CEO to possess specific competencies, motivations, and
attitudes, and requires discipline over time to adopt the HCPE as a proven business model for

Health Care Criteria and Organizational Performance 43
creating superior value for the customers and stakeholders, including the workforce, community,
and stockholders if the organization is a public company.
Researchers from the Monfort Institute Sustainable Transformation Program have studied
whether transformational leaders from Baldrige recipient organizations somehow differ in their
motivations and attitudes from other leaders who are at the top of their organizations, and they
found Baldrige CEOs differed in seven motivational and attitudinal patterns from the CEOs in a
control group (Larson, Latham, Appleby, & Harshman, 2012). The six motivational and
attitudinal patterns are listed in Table 3 with the “direction” indicating how the mean of the
Baldrige CEO Group (n=12) compares to the Leader Comparison Group (n = 1921). These six
motivational and attitudinal patterns provide an understanding of the areas where the Baldrige
CEOs differ from the comparison group. Thus, when organizations are designing leadership
development strategies, incorporation of these seven motivational and attitudinal patterns may be
valuable.
Table 3
Baldrige CEO Attitudes and Motivation Depiction
Patterns Direction Implication
Sole Responsibility Lower Baldrige CEOs are less likely to think that having sole
responsibility is important.
Evolution Higher Baldrige CEOs are more likely to want to evolve and to
drive continuous improvement.
Focus on the Past Higher Baldrige CEOs concentrate on the past and use experience
to make decisions.
Tolerance Lower Baldrige CEOs have a strong tendency to want to impose
their “rules” on others (this is “Assertive”). A low score
means that the individual is likely to be intolerant of the

Health Care Criteria and Organizational Performance 44
actions of others when they differ from their own or are
not consistent across the workforce; that is, they are not
very motivated to deal with people who have rules
different from their own. [Note: Individuals can have very
different tolerance patterns in different contexts and low
tolerance should not be confused with the extent to which
an individual cares about people.]
Focus on Systems Higher Baldrige CEOs are strongly motivated to work with
systems and processes.
Focus on
Information
Higher Baldrige CEOs are strongly motivated to work with facts
and knowledge (information).
From “CEO attitudes and motivations: Are they different for high-performing organizations?” by M. D. Larson, J. R. Latham, C. A. Appleby, and C. L. Harshman, 2012). Quality Managment Journal, 19(4), p. 60.
Unfortunately, there is little understanding of “why” CEOs choose not to transform their
organizations to achieve sustained high performance levels. Carl Icahn, a noted investment
manager and broker since the 1970s, who over the years has owned controlling positions in major
companies such as RJR Nabisco, Texaco, Phillips Petroleum, and Western Union, offered a
plausible explanation in The Icahn Report in 2008. Called an anti-Darwinian metaphor, Icahn
explains that the way CEOs become CEOs in America is one of the U.S.’s major problems:
namely, it is the “survival of the unfittest.” Icahn describes the CEO selection process as a flawed
fraternity or political approach rather than a competency approach (Icahn, 2008). Numerous books
profile the leaders of great organizations. Jim Collins, best-selling author of Good to Great: Why
Some Companies Make the Leap … and Others Don’t, stated, “I see the Baldrige process as a
powerful set of mechanisms for disciplined people engaged in disciplined thought and taking
disciplined action to create great organizations that produce exceptional results” (NIST, 2010b).

Health Care Criteria and Organizational Performance 45
Despite the uncertainty of leadership in implementing the model, the HCPE model has proven to
be effective in improving business performance for those who have decided to internalize the
systems approach the model embodies.
The Process for Achieving the Baldrige Award. The process for achieving the Baldrige
Award is a long-term commitment to moving from good to great, as described by Jim Collins. It is
a commitment to creating a culture that supports continuous improvement and learning (Schein,
1997). Depending on the level of organizational maturity in performance excellence, the process
could take 5 to 10 years. The Baldrige application process is extensive and thus intimidating. An
organization submits detailed application information, including a 5-page organizational profile
and a 50-page application addressing all areas of the HCPE, to NIST in May of each year. Experts
from around the U.S. donate their time as members of the Board of Examiners, having undergone a
comprehensive training course that has been named one of the “Top 10 Government Leadership
Development Programs by Leadership Excellence” for three consecutive years (NIST, 2012e).
Following the training, the examiners form teams to evaluate the applications. The board
members evaluate each application against the HCPE model’s seven organizational, high-impact
categories that were identified earlier in Table 1: (a) leadership; (b) strategic planning; (c)
customer focus; (d) measurement, analysis, and knowledge management; (e) workforce focus; (f)
operations focus; and (g) performance results. The performance results section include “health
care and process outcomes, customer-focused outcomes, workforce-focused outcomes, leadership
and governance outcomes, [and] financial and market outcomes” (NIST, 2011-2012, p. 3). The
first step is for each examiner to conduct an independent review of the application materials, which
takes about 40 hours, and creates a scorebook, or written evaluation, of an award application.
Scorebooks ultimately end up with the award applicants and provide them with a criteria-based
Health Care Criteria and Organizational Performance 46
assessment of their organization’s strengths and opportunities for improvement. In the second
step, all applications are sent through a consensus review. The team of examiners, led by a senior
examiner, conducts a series of reviews, including focused conference calls. The purpose of this
series of reviews is for the team to reach a consensus on comments and scores that capture the
team’s collective view of the applicant’s strengths and opportunities for improvement based on the
input from the independent review. The third step is a consensus review process, which includes
the development of a consensus report and scoring. Then in the fourth step, a panel of judges
selects applicants to receive site visits based upon the scoring profiles. If an applicant is not
selected for site visit review, one of the examiners on the consensus team edits the final consensus
report, which becomes the application’s terminating feedback report. Site visits are conducted for
the highest-scoring applicants. A team of examiners visits each selected applicant to verify and
clarify the processes and results described in the application. After the site visit, the team of
examiners prepares a final site visit scorebook. Applications, consensus scorebooks, and site visit
scorebooks for all applicants receiving site visits are forwarded to the panel of judges, who make
final recommendations on which applicants should receive the award. Following the judges’
review and recommendations of award recipients, the site visit team leader edits the final site visit
scorebook, which becomes the feedback report. Finally in November, the judges recommend
award recipients to the NIST Director and U.S. Secretary of Commerce (NIST, 2012d).
Baldrige Award applicants cite the feedback report as the most significant benefit of
applying (NIST, 2012c). The feedback report is a detailed, individualized written assessment of
the organization’s strengths and opportunities based on the Baldrige Award application. The
process includes approximately 1,000 hours of document review and category scoring for each
application. The components of the report include (a) key themes—the “executive summary”—

Health Care Criteria and Organizational Performance 47
which is a synthesis of the most significant cross-cutting strengths and opportunities for
improvement in the organization’s processes and results; (b) actionable comments addressing
strengths and opportunities for improvement related to each of the 17 Baldrige Criteria Items; (c)
item scoring range; and (d) scoring band distribution, which provides the percentage of scoring in
each of the eight overall scoring bands and gives a context for the total score based on 1,000 points
(NIST, 2012d).
Role of Systems Theory and Systems Thinking—Moving Beyond Linear Thinking
As introduced earlier in the previous section, a major strength of a HCPE-based approach,
such as Baldrige, is its integrative systems design and the prospect for creating sustainable high-
performance health care organizations. The seven HCPE categories and the core values and
concepts form the building blocks and the integrating mechanism for the system. The core values
and concepts are (a) visionary leadership, (b) patient-focused excellence, (c) organizational and
personal learning, (d) valuing of workforce members and partners, (e) agility, (f) focus on the
future, (g) managing for innovation, (h) management by fact, (i) societal responsibility and
community health, (j) focus on results and creating value, and (k) systems perspective. Successful
management of overall performance requires organization-specific synthesis, alignment, and
integration. Synthesis refers to looking at health care organizations as a whole and builds on key
organizational requirements, including strategic objectives and action plans. Alignment focuses on
using the key linkages among requirements given in the HCPE categories to ensure consistency of
plans, processes, measures, and actions. Integration builds on alignment, so that the individual
components of the performance management system operate in a fully interconnected manner
(NIST, 2011-2012).

Health Care Criteria and Organizational Performance 48
HCPE systems design enables the identification of key leverage points that have the
greatest impact on overall system performance and the ability to identify interrelationships,
interactions, and complexity, and provides leadership with a structure and mental model to
understand how to move the organization from good to excellent performance. This systems
perspective concept is based on General Systems Theory, which has been described by Jay
Forrester and Peter Senge from Massachusetts Institute of Technology (MIT) Sloan School of
Management, Russell Ackoff from the Wharton School at the University of Pennsylvania, and W.
Edwards Deming from Columbia University (Latham & Vinyard, 2011). The focus of systems
theory is a holistic understanding of reality, as opposed to a reductionist approach to understanding
the environment. The reductionist approach initially serves an organization well in improving
performance by applying tools, such as Lean Six Sigma, but at a certain point when complexity
and interactions are present, the limitation of linear cause-and-effect thinking creates an unseen
barrier to further improvement. In other words, this is an important concept in understanding
organizational complexity, resiliency, and sustainability.
Systems thinking requires moving beyond silo or functional linear cause-and-effect
thinking that is the basis of U.S. business school education to a mental model that presents reality
as dynamic interactions and inter-relationships of multiple variables or factors (Checkland, 1999).
Due to the complexity of organizations, particularly health care organizations in the current
dynamic and uncertain environment, fundamental views of the patterns of interrelationships need
to be uncovered in order to understand phenomena such as the relationship of systems and
processes to health care outcomes. Linking systems theory and thinking to leadership forecasting,
planning, analysis, and decision-making methods is critical in today’s complex world. Senge
(2006b, p. 71) adopted a view of “dynamic complexity to explain situations where cause and

Health Care Criteria and Organizational Performance 49
effect are subtle, and where the effects over time of interventions are not obvious” and today’s
conventional management practices are not equipped to deal with dynamic complexity.
Senge (2006b) built upon systems thinking by emphasizing personal awareness and the
integration of individuals’ thoughts, behaviors, and feelings into all aspects of organizational life,
and identified the root cause of problems as thinking and interacting, more than organization
structure and policy. Schoderbek et al. (1990, p. 9) wrote, “The systems approach, therefore,
implies some form of departure from the traditional analytical method so successfully employed
with simpler problems. The increasing complexities of various modern-day projects make it
impossible to look for isolated solutions to problems.” As organizational environments continue to
change dramatically, and often unpredictably, and organizational leaders continue to seek solutions
to problems of strategy execution, the value of systems thinking approaches might be recognized.
Solutions to complex issues can be found across industries in a variety of processes, designs,
product or service offerings, and organizational entities Systems theory attempts to understand
complexity and build on the most comprehensive view of a situation (Checkland, 1999, pp. 3-6).
The key principle of systems theory is that it is possible to uncover the true workings of different
phenomena by examining the whole instead of the parts.
According to Checkland (1999, p. 210), there are four fundamental types of systems: (1)
natural systems such as a biological organism; (2) designed physical systems which are man-made
for human purposes, such as buildings or engineering systems; (3) designed abstract systems,
which are conscious products of the human mind, such as mathematics, poetry, or philosophy; and
(4) human activity systems, which are less tangible but related to a purpose or mission, such as an
international political system, a team engaged on a task, or a health care organization. The human
activity system is used to understand and solve complex organizational problems, which may

Health Care Criteria and Organizational Performance 50
include other types of systems, such as designed physical systems. For example, the social aspects
of people and their inter-relationship to technical organizational structure and processes are
considered a sociotechnical system.
In the sociotechnical systems approach, the organization is an open system, which means
the system is capable of self-maintenance on the basis of throughput of resources from the
environment versus a closed system like an engineering or computer system (Scott & Davis,
2003). Closed systems are considered hard systems and are embodied in professions such as
systems engineering. The first attempts to solve complex organizational problems originated with
the hard systems approach, which was successful with technology but had limited success with
social systems. Some previous researchers have advocated that systems thinking approaches, in
particular soft systems methodology, be used as a gauge against which human activity could be
explored and better understood in terms of wholeness. Soft systems methodology (SSM) tackles
“problems which defy formulation in the hard sense, and also enrich the concept of human activity
system in order to understand better the social systems of the real world” (Checkland, 1999, pp.
15-17).
SSM has proven to be flexible enough to be successful in organizing and creating debate
regarding real-world problems. It is designed as a seven-step process of inquiry. The preliminary
steps of an SSM consist of
identifying a problem situation and expressing the situation in plain language. The intermediate steps, called collectively systems thinking about the real world consist of developing root definitions of associated purposeful activity systems, which give rise to conceptual models of potential systems. The process concludes with a comparison stage, whereby those models are held up against the real world situation. Out of this comparison may emerge changes systemically desirable and culturally feasible. In the best case, these suggestions result in actions to be taken to improve the problem or situation. (Checkland, 1999, pp. 161-183)

Health Care Criteria and Organizational Performance 51
SSM is used to make sense of complexity and provide a method for timely decision‐
making. For example, in the article “Using Soft Systems Methodology to Examine
Communication Difficulties,” Brenton (2007) described a problem concerning a number of
communication issues between a working-age mental health inpatient acute admission unit and a
tertiary rehabilitation service within a health and social care National Health System (NHS) trust in
West Sussex, United Kingdom (U.K.). SSM was used to facilitate informal discussion with the
unit manager and staff of both the rehabilitation service and the acute inpatient unit, through
structured meetings. After the discussion began, it became very clear that attempts to solve the
problem using traditional linear cause-and-effect thinking would not work, because the tendency to
sub-optimize along organizational functional lines prevented the identification of a solution. This
incapability to define the issues “concretely” lent itself to a soft systems approach.
Changes usually can be classified into three inter-related types, including structure,
processes, and attitudes; in the situation described by Brenton (2007), changes would be desirable
in all three areas. Most importantly, the power of the SSM lay in identifying the ways that issues
from one service impacted the other and the feasible changes that might be initiated to improve the
relationship between the two services. Specifically in this situation, the following improvements
were made: (a) increase in-bed availability on the acute unit; (b) for nursing staff and sector
consultants, a better understanding of the role of the rehabilitation service and procedures for
referral; (c) rehabilitation service's improved communication and liaison processes with potential
referrers; and (d) improved efficiency of rehabilitation service referral process (Brenton, 2007).
In a different study of the systematic performance improvement of a health care
organizations, Chuang and Inder (2009) used a systems theory approach (but not SSM) to study
the effectiveness of both an accreditation system and a quality management system used to

Health Care Criteria and Organizational Performance 52
improve health care quality and patient safety in Australia and New Zealand. The study identified
a lack of research literature providing appropriate analysis for identifying improvement of health
care outcomes based on a whole system that contributes to those outcomes. Chuang and Inder
(2009, p. 12) used a systems theory approach that included a combination of a “theoretical-based
and a literature-based empirical concept of systems theory and a general systems flow with the
Supply Input Process Output Key Stakeholder (SIPOKS) process model to form the systems’
theoretic approach.” The approach was used to develop a high-level integrated systems model as a
framework to guide the investigation of the effect of the accreditation and measurement and
reporting systems on health care quality, and then to examine, from a systems flow perspective in a
lower level, the causal links within the system that had an impact on effectiveness (Chuang &
Inder, 2009). Combining the concept of health care system hierarchy and an analysis of control
and communication relationships, a basic holistic health care systems relationship model was
designed as shown in Figure 10.
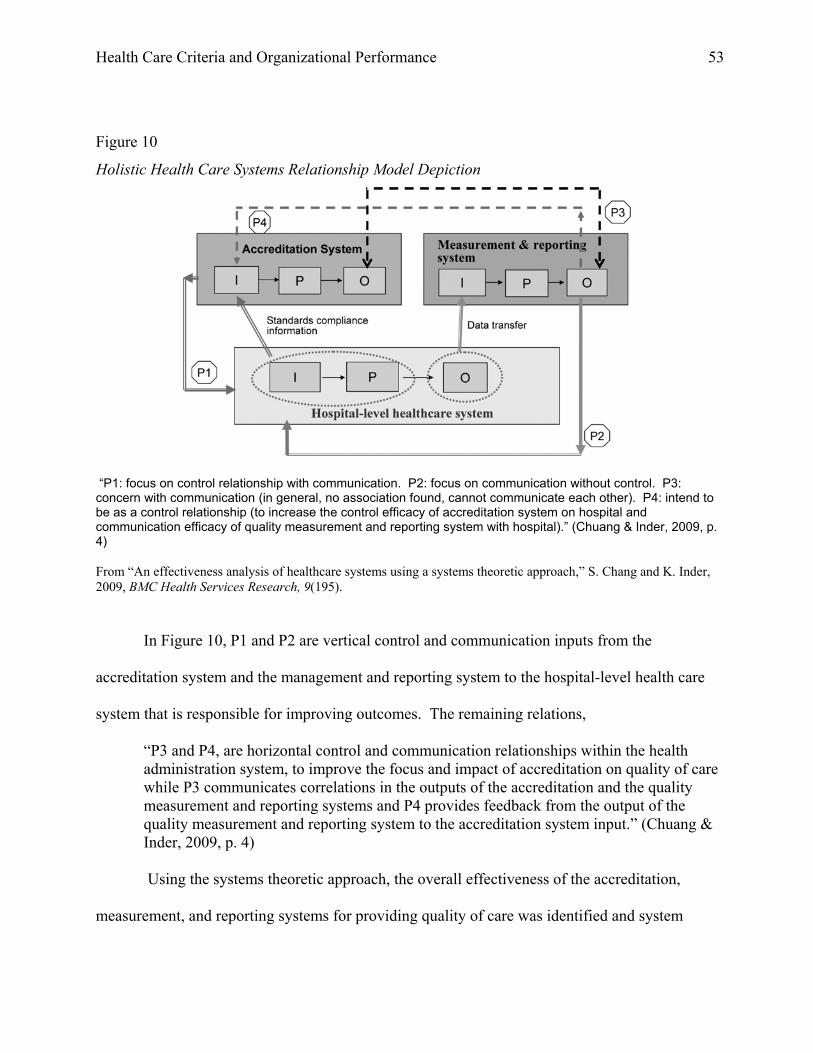
Health Care Criteria and Organizational Performance 53
Figure 10
Holistic Health Care Systems Relationship Model Depiction
“P1: focus on control relationship with communication. P2: focus on communication without control. P3: concern with communication (in general, no association found, cannot communicate each other). P4: intend to be as a control relationship (to increase the control efficacy of accreditation system on hospital and communication efficacy of quality measurement and reporting system with hospital).” (Chuang & Inder, 2009, p. 4) From “An effectiveness analysis of healthcare systems using a systems theoretic approach,” S. Chang and K. Inder, 2009, BMC Health Services Research, 9(195).
In Figure 10, P1 and P2 are vertical control and communication inputs from the
accreditation system and the management and reporting system to the hospital-level health care
system that is responsible for improving outcomes. The remaining relations,
“P3 and P4, are horizontal control and communication relationships within the health administration system, to improve the focus and impact of accreditation on quality of care while P3 communicates correlations in the outputs of the accreditation and the quality measurement and reporting systems and P4 provides feedback from the output of the quality measurement and reporting system to the accreditation system input.” (Chuang & Inder, 2009, p. 4)
Using the systems theoretic approach, the overall effectiveness of the accreditation,
measurement, and reporting systems for providing quality of care was identified and system

Health Care Criteria and Organizational Performance 54
weaknesses from a system flow perspective were discovered. Overall, the health administration
systems did not have significant positive impact on the quality of care. The study conclusion was
the identification of weaknesses implicit in the P4 feedback loop from the measurement and
reporting system to the accreditation system, thereby affecting the hospital-level health care system
(Chuang & Inder, 2009). This was an important discovery because a major component of systems
theory is the feedback loop or formal communication flow (Checkland, 1999).
Thus, a systems approach to solving complex problems is proving to be more effective than
the traditional silo effort of identifying previously unknown interactions or communications
channels as in the previous study, and “the interactions between our thinking and internal models
and our perceptions and actions” (Senge, 2006b, p. 222). The value of the HCPE is that they
provide a systematic and integrated methodology for aligning the entire organization and transcend
the organizational chart, which increases the likelihood that management will make decisions to
benefit the whole organization and not particular silos or parts. This type of thinking creates a
certain type of organizational enlightenment. It is the evolutionary process of the organizational
change and growth to a state of excellence where management systems, knowledge, and tools are
applied at a different points to produce a culture that drives performance, builds resiliency, and
ensures sustainability. According to Ford and Evans (2000, p. 9), “Many firms use the criteria as a
‘management guide’ and considerable evidence exists as to the benefits of doing so.” Their
research was unique for its time and in its approach because their investigation of strategic
planning drew from mainstream strategic management literature as well as more distant areas, such
as forecasting and systems theory, providing an integrative model for organizational effectiveness.
The HCPE model challenges leaders to learn how to think at a different level, beyond silo
or departmental linear thinking to a systems view, which includes unfamiliar concepts.

Health Care Criteria and Organizational Performance 55
Acceptance of this challenge to learn a new model for thinking will provide leaders with a broader
set of solution resources with which to design approaches and create a high-performing
organization. Schein (2004) established a pragmatic view and stated that “the learning leader must
believe that the world is intrinsically complex, nonlinear, interconnected, and over determined in
the sense that most things are multiply caused” (p. 402). The HCPE challenge leaders to create a
leadership system that provides the structures and mechanisms for decision-making: two-way
communication; selection and development of leaders and managers; and reinforcement of values,
ethical behavior, directions, and performance expectations. An effective leadership system
respects the capabilities and requirements of workforce members and other stakeholders, and it
sets high expectations for performance and performance improvement. It builds loyalties and
teamwork based on the organization’s vision and values and the pursuit of shared goals. It
encourages and supports initiative and appropriate risk-taking, subordinates organizational
structure to purpose and function, and avoids chains of command that require long decision paths.
An effective leadership system includes mechanisms for the leaders to conduct self-examination,
receive feedback, and improve (NIST, 2011-2012).
Evolution of Quality Improvement Strategies and Programs
This chapter began with a review of the history, theory, practice, and management of
quality and resulting performance improvement and the study of philosophy and nature of
humanity. This section builds on the philosophical understanding and approaches by providing a
historical reference that introduces a change from a Western philosophy to an Eastern philosophy
delineated by the end of World War II in 1945, identified in Figure 11, “Evolution of Quality and
Performance Excellence.” This figure was adapted from Folaron’s (2003) “The Evolution of Six
Sigma.”

Health Care Criteria and Organizational Performance 56
Figure 11
Evolution of Quality and Performance Excellence
Henry Ford’s World Oil Philip ISO 9000assembly line War II embargo Crosby MBNQA(just-in- time) ends (zero defects)
TQM Six Sigma1798 1913 1924 1945 1950 1950-54 1973 1980 1987
Years
Joseph M. Juran in Japan
(SPC & Management)
Walter Shewhart (SPC & PDCA)
Deming in Japan
(SPC & PDSA)
Eli Whitney interchange-able parts
Western Philosophy Eastern Philosophy
Adapted from "The evolution of Six Sigma,” by J. Folaron, 2003, Six Sigma Forum Magazine (August), 38-44.
The Western philosophy period began with Eli Whitney’s invention of the cotton gin in
1787, which led to Whitney receiving a government contract to produce 10,000 muskets in 1798
(Folaron, 2003, p. 38). Whitney proved it was possible to produce interchangeable parts that were
similar enough in fit and function to allow for a random selection of parts in the assembly of the
muskets. This had a great impact on modern manufacturing with the introduction of revolutionary
uniformity system, which eventually led to the design and operation of the Henry Ford Highland
Park assembly line in 1913.
Later, during Ford’s time, practitioners of quality focused on inspection and statistical
sampling theory, or the use of statistics for process control (Folaron, 2003). In the 1920s and
1930s, Shewhart, Harold F. Dodge, and Deming developed the concept of control charts. During
that time, the first attempt to link management thinking to statistical thinking and create a
philosophy of continuous improvement was developed by Shewhart’s PDCA learning and
improvement cycle, which was later referred to as PDSA by Deming.

Health Care Criteria and Organizational Performance 57
The Eastern philosophy period began with the rebuilding and transformation of Japan. At
the end of World War II, Americans were exposed to the cross-cultural perspective or worldview
of the Asian mind and philosophy through the reconstruction of Japan after the war. This era
began with General Douglas MacArthur and the occupying forces needed to rebuild the Japanese
infrastructure and to inform the people of Japan the war had ended and the U.S. was no longer an
enemy. In this spirit, MacArthur requested Homer Sarasohn from MIT to teach the Japanese
leaders U.S. manufacturing management principles. The Japanese leaders considered the use of
statistics the “secret weapon that helped the Allies win the war” and wanted to learn more about
the practical application of this weapon (Folaron, 2003, p. 40). The U.S. experts taught Japanese
management how to use statistical methods and quality and the use of Deming’s PDSA cycle of
continuous improvement. The Japanese embraced and internalized the PDSA learning cycle
because it was part of their cultural philosophy of personal improvement. Although statistical
methodology was well received as a field for experts, it was not incorporated into management
until 1954 with the arrival of Joseph M. Juran, who taught how quality should be incorporated
throughout all levels of organizations (Folaron, 2003). Juran included the need for project-by-
project quality improvement and diagnostic/remedial journeys, all of which he documented in his
Quality Control Handbook, first published in 1951 with the introduction of quality management
concept.
Ironically, the work in Japan during the 1950s became a learning laboratory for
management experts from the U.S. Thus, the origins of total quality management (TQM) began in
the early 1950s, with the work of Deming, Juran, and Armand V. Feigenbaum from General
Electric. The last of these three established the intellectual framework for quality as a discipline
worthy of top management’s attention. Feigenbaum applied a systems engineering approach to
Health Care Criteria and Organizational Performance 58
quality and introduced to management the use of financial performance as an indicator of poor
quality. Feigenbaum demonstrated the lag between the initiations of total quality improvement
programs within a nation’s leading companies and the observed economic effects throughout
general business. Feigenbaum used an economic basis for defining total quality and the integration
of previous concepts and methods of quality control into a systematic theory and discipline, which
he termed “total quality control,” known today as total quality management (TQM) (Folaron,
2003).
TQM is more than a quality method; it combines management methods and economic
theory with organizational principles to institute a sound business improvement doctrine that
results in commercial leadership (Watson, 2005). It is a way of emphasizing that quality, as
defined by the customer, results from the integration of multiple cross-functional workflows
throughout an organization. Generally, TQM defines quality as an organization-wide process that
requires continuous improvement and provides the most cost-effective, least capital-intensive route
to productivity.
Although TQM provides a necessary linkage of quality to all levels of management, it does
not provide a holistic model to accomplish these objectives. The HCPE provided the model to
achieve TQM (Watson, 2005). Thus, the quality strategies and programs of today are the result of
hundreds of years of development and the work of visionary individuals in businesses, universities,
and the U.S. and Japanese governments.
Lean and Six Sigma methodologies. The HCPE have a category called “operations
focus” that comprises two sections, the first relating to “work systems” and the second to “work
process” management (NIST, 2011-2012, pp. 21-22). Lean and Six Sigma methodologies are
important strategies for managing work systems and processes and consist of various tools and

Health Care Criteria and Organizational Performance 59
techniques used to reduce waste and improve process performance by reducing variation. While
important tools and strategies for creating high-performing sustainable organizations, Lean and Six
Sigma do not offer a holistic model of managing and transforming an organization. The purpose
of “Lean” is to reduce or eliminate waste in any form, including unnecessary processing,
movement of items or people, transportation of goods, overproduction, and rework because of
defects. As in all organizations, the commitment to being lean begins with strategy developed and
deployed by leadership and the alignment to goals to improve organizational performance (Zidel,
2006).
The term “lean” was coined by Cusumano (1988), a Massachusetts Institute of Technology
researcher in an article about the Japanese auto industry. Henry Ford pioneered and perfected the
theory of lean production. In his design, he identified “flow,” which described the production line
with minimum inventory, known today as just-in-time. Ford (1926) stated, “The time element in
manufacturing stretches from the moment the raw material is separated from the earth to the
moment when the finished product is delivered to the ultimate consumer” (p. 99). In 1929 Charles
Sorenson, the Assistant Production Manager at Ford taught the concepts of “flow” and lean
manufacturing to Eiji Toyoda from Japan who adopted the Ford system for the family-run Toyoda
Automatic Loom Works (Waddell & Bodek, 2005, p. 22). Then in 1950, Toyoda was named
Managing Director of the Toyoda Automotive Works. In 1957, Toyoda renamed the Toyoda
automotive operation the Toyota Company and changed the name again in 1983 to the Toyota
Motor Corporation. Toyoda’s adoption of Ford’s concepts is considered to be one of the major
building blocks of the Toyota Production System of continuous improvement know as kaizen
(Becker, 2012). Applying the Toyota Production System to health care, Chalice (2007) first
identifies U.S. health care system problems, then provides 46 steps for improvement. Thus Lean is

Health Care Criteria and Organizational Performance 60
a methodology that is beneficial for reducing waste in any organization, including health care
systems.
The incorporation of Lean in conjunction with Six Sigma offers an organizational
reductionist methodology that is a rigorous, focused, and highly effective improvement strategy.
The purpose of Six Sigma is to reduce process variation. The theory of reducing process variation
dates back to the 1920s with the development of “statistical process control” (SPC) by Shewhart at
the Western Electric Company (Juran, 1995, p. 252). Typically, companies have accepted three to
four sigma performance levels as a norm, which equates to 6,200-67,000 problems or errors per
million opportunities. High-performance organizations have adopted the strategy of achieving Six
Sigma, which translates to 3.4 problems or defects per million opportunities. Motorola, a 1988
recipient of the first Baldrige Award, popularized the theory and practice of Lean and Six Sigma
methodologies in the mid-1980s with the work of Bill Smith, an engineer at Motorola who
constructed the original statistics and formulas of the Six Sigma culture. To be competitive
Motorola developed the Six Sigma DMAIC methodology of defining a process problem (D),
measuring the process (M), analyzing the measurement (A), improving the process (I), and
ensuring the change was effective by checking for control (C). Eliminating problems or defects
improves the performance of any organization (Pyzdek, 2003). The success of Six Sigma was a
result of the direct support of leadership when Motorola CEO Bob Galvin and Senior Vice
President Jack Germaine incorporated Six Sigma training of the workforce into the company’s
Motorola University training and development program (Breyfogle, 2003).
Constraints Management. Constraints Management is based on the theory of constraints
(TOC) popularized by Eliyahu Goldratt, which focuses on “system” improvement rather than
“process” improvement. A constraint is the weak link in a system, and constraints management

Health Care Criteria and Organizational Performance 61
focuses on eliminating constraints through a five-step methodology: “(a) identify the constraint, (b)
exploit the constraint, (c) subordinate other processes to the constraint, (d) elevate the constraint,
and (e) repeat the cycle. TOC considers threes measures of system performance: (a) throughput,
(b) inventory, and (c) operating expense” (Breyfogle, 2003, pp. 886-900). Some examples of the
use of TOC in health care include “patient flow, lead times, supply-chain issues, accounts
receivables, and insurance processing” (Inozu, Chauncey, Kamataris, & Mount, 2012, p. 29). The
concept of constraints management is important to improving performance by managing the
organizational systems As described earlier, the HCPE are the framework, and TQM, Lean and
Six Sigma methodologies, and constraints management are practices and tools to build the
framework.
The HCPE and the Balanced Scorecard. The Balanced Scorecard was developed as a
new approach for more holistic performance measurement and strategy management system by
Robert S. Kaplan from Harvard Business School and David P. Norton, CEO of the Nolan Norton
Institute, a research arm of KPMG. In 1990, KPMG sponsored a one-year multi-company study,
titled “Measuring Performance in the Organization of the Future,” with results suggesting that
organizational reliance only on financial performance measures was limiting the ability to create
economic value. Four specific perspectives of performance areas were identified by participants to
provide a more holistic indicator of organizational performance: “(a) financial, (b) customer, (c)
internal, (d) innovation and learning” (Kaplan & Norton, 1996, pp. vii-viii). It is important to
balance between short- and long-term objectives, financial and non-financial measures, and
lagging and leading indicators.
Kaplan and Norton continued their research throughout the 1990s and in 2001 published
The Strategy-Focused Organization in which they enhanced the strategy section of the Balanced

Health Care Criteria and Organizational Performance 62
Scorecard theory, which included enhancements to planning and budgeting, feedback and learning,
leadership, strategy maps, business unit and shared services synergy. They argued that “explicit
through the strategy map’s cause and effect linkages across the four perspectives” there would be a
balance between short- and long-term strategy (Kaplan & Norton, 2001, p. 308). The four
perspectives were refined with expanded definitions and the perspective titled “innovation and
learning” evolved to “learning and growth” to enhance the focus on human resources. The
Strategy-Focused Organization proposed strategy as a continual process: align strategy to the
Balanced Scorecard and the performance metrics to operations (Kaplan & Norton, 2001). Many of
the Baldrige recipients use the Balanced Scorecard such as the Advocate Good Samaritan (2010),
Heartland Health (2009), Poudre Valley Health System (2008), Sharp Health Care (2007), and
North Mississippi Medical Center (2006). The Baldrige Program office also uses this effective
performance and strategy management theory (NIST, 2012b). The Balanced Scorecard represents a
critical component in the development of a more holistic and balanced approach for performance
management and strategy management, but it is only a portion of the model presented by the
HCPE. The Balanced Scorecard has evolved from its inception as a strategic planning
methodology in the 1990s to a more enterprise-focused approach that extends beyond strategy and
metrics to encompass enterprise management aligned with the HCPE.
The Baldrige Health Care Award Recipients from 2002 through 2011
The HCPE model has been attracting attention from health care organizations and the Joint
Commission because of the interest of health care systems throughout the country. Specifically,
the American Health Care Association and National Center for Assisted Living Quality Award
recognize member organizations that demonstrate their commitment to continuous quality
improvement; the Living Quality Award is modeled after the Baldrige Performance Excellence

Health Care Criteria and Organizational Performance 63
Award (The Joint Commission, 2007). Due to quality and cost challenges, health care leadership
has become increasingly engaged in the Baldrige Program not only as applicants but also in
administration and promotion. Additionally, on April 15, 2011, an American College of
Healthcare Executives (ACHE) news release announced that Thomas C. Dolan, president and CEO
of ACHE, was appointed by the U.S. Secretary of Commerce to the Board of Overseers that
advises the Department of Commerce on the Baldrige Program. Consisting of distinguished
leaders from all sectors of the U.S. economy, the Board of Overseers evaluates all aspects of the
Baldrige Program, including the adequacy of program criteria and processes for determining award
recipients. A key Board responsibility is assessing how well the Baldrige Program is serving
national interest and, as needed, recommending changes and improvements to the Secretary of
Commerce and to the NIST Director. The “ACHE and the Baldrige Program have many things in
common, the most important being a commitment to excellence,” says Dolan. “I am greatly
honored to chair a board that is dedicated to upholding quality and superior performance in the
healthcare field and other sectors of the U.S. economy” (Freund, 2011).
Table 4 lists all the health care recipients of the Baldrige Award through 2011. The
hospital systems receiving the award range in size and complexity. The first recipient, SSM
Health Care (SSMHC) is a private, not-for-profit health care system based in St. Louis, Missouri,
that provides primary, secondary, and tertiary health care services. The system owns, manages,
and is affiliated with 18 acute care hospitals and 3 nursing homes in 4 states: Illinois, Missouri,
Oklahoma, and Wisconsin. With operating revenues of approximately $1.7 billion, SSMHC
provides a wide range of medical services and employs nearly 5,000 physician partners and 23,000
employees (SSM Health Care, 2002).

Health Care Criteria and Organizational Performance 64
In 2006, the largest rural hospital system in the country received the Baldrige Award, North
Mississippi Medical Center (NMMC) in Tupelo, Mississippi. Established in 1937, NMMC is an
integrated health care delivery system that spans 20 counties in northeastern Mississippi and 4
counties in northwestern Alabama with a population of more than 700,000 segmented into 2
service areas, a 7-county primary area closest to NMMC and a secondary service area of the
remaining 17 counties. NMMC is the region’s only Level II trauma center, the largest non-
government hospital in Mississippi and the largest rural hospital in the country. NMMC has 3,875
employees, making it the largest employer in its service area and the second largest private
employer in the state (North Mississippi Medica Center, 2006).
In 2011, three health care recipients received the Baldrige Award: Schneck Medical Center,
Southcentral Foundation, and the Henry Ford Health System (HFHS). The HFHS was founded in
1915 by auto pioneer Henry Ford and is headquartered in Detroit, Michigan. HFHS includes 7
hospitals (a large, Level I trauma center flagship hospital; 4 community hospitals; and 2
psychiatric facilities); 33 multi-specialty ambulatory care centers; affiliated physician practices; a
research and education component; the Health Alliance Plan (providing health coverage to more
than 467,000 members); and 91 community care operations. The community care includes
outpatient behavioral health, nursing homes, hospices, and dialysis centers, and a broad range of
retail operations offering services such as optometry and home medical products. The 140 sites
with HFHS facilities serve a three-county region in southeast Michigan, encompassing Detroit and
its suburbs. The HFHS workforce of 29,856 includes 24,322 employees; 2,200 independent
community physicians; and 3,334 volunteers. Revenue in 2010 was $4.08 billion (NIST, 2011d).
HFHS’s customer engagement and satisfaction results exceeded the 90th percentile level from
2007 to 2010. HFHS maintained a positive net operating income of greater than $25 million per

Health Care Criteria and Organizational Performance 65
year from 2007 to 2010 despite significant increases in uncompensated care, which grew from
approximately $130 million in 2007 to approximately $200 million in 2010 (NIST, 2011a).
According to a New York Times (2012) editorial, Southcentral Foundation in Anchorage,
Alaska, has achieved startling efficiencies including a reduction in emergency room use by 50%
and in hospital admissions by 53%, while improving access. Other improved outcomes include an
increase in children receiving high-quality care for asthma from 35% to 85%, a high percentage
(more than 90%) of infants receiving needed immunizations by the age of two, a ranking in the top
10th percentile of a standard national benchmark for percentage of diabetics with blood sugar
levels under control, and customer and employee satisfaction rates greater than 90%.
Table 4
Health Care Recipients of the Performance Excellence Award
Year Recipients City State
2002 SSM Health Care (SSM) St. Louis Missouri
2003 Baptist Hospital Pensacola Florida
2003 Saint Luke’s Hospital (SLH) Kansas City Missouri
2004 Robert Wood Johnson University Hospital at
Hamilton
Hamilton New Jersey
2005 Bronson Methodist Hospital Kalamazoo Michigan
2006 North Mississippi Medical Center Tupelo Mississippi
2007 Mercy Health System Janesville Wisconsin
2007 Sharp Health Care San Diego California
2008 Poudre Valley Health System Fort Collins Colorado
2009 AtlantiCare Regional Medical Center Egg Harbor Township New Jersey
2009 Heartland Health St. Joseph Missouri
2010 Advocate Good Samaritan Hospital Downers Grove Illinois
Health Care Criteria and Organizational Performance 66
2011 Henry Ford Health System Detroit Michigan
2011 Schneck Medical Center Seymour Indiana
2011 Southcentral Foundation Anchorage Alaska
From Message from the Baldrige Program Director, Dr. Harry Hertz, by the National Institute of Standards and Technology, 2012, retrieved from http://www.nist.gov/baldrige/examiners/index.cfm.
The Application of Quality in Health Care
The application of quality to health care has been well documented. The process involved
a host of government agencies and commissions, professional organizations, insurance
underwriters, corporations, and market forces. In general, quality and performance improvement
principals focus on organizational leadership and management, which include process design,
measurement, assessment, and improvement of systems and processes. From the health care
perspective, quality and performance improvement is not limited to direct patient care functions
but clearly recognizes that leadership, management, and support functions significantly influence
care outcomes (Community Health Care, 2012). As discussed in preceding sections, various
organizations, such as the Institute for Healthcare Improvement (IHI), professional organizations
like the Physician Consortium for Performance Improvement (PCPI), and the federal government
through CMS have focused on improving the levels of health care quality to improve patient safety
and outcomes. This section of the literature review will focus on the work of key individuals who
contributed to the evolution in thinking about quality in health care. These individuals made
significant contributions in improving health care by influencing others and changing mental
models and existing paradigms, which is pivotal to ensuring change (Senge, 2006b). The creative
spirit of individuals over time is at the heart of transforming organizations and leads to culture
change (Hacker, 2012). A creative spirit in health care quality began with nurse, statistician, and
author Florence Nightingale (1820–1910) who made an enormous global contribution with the
Health Care Criteria and Organizational Performance 67
foundation of the public health care system in England and created what is known today as
“evidence-based nursing” (McDonald, 2001). Nightingale and 38 nurses arrived at a British
hospital in Uskiider, outside Istanbul, Turkey in November of 1854. She documented the first
seven months of their efforts, recording that 60% of the soldiers died from infection (Inozu et al.,
2012). Nightingale’s nursing experience and statistical analysis during the Crimean War (1853–
1856) led her to propose changes to health care administration and processes, which included the
creation of a royal commission to investigate the causes of the high mortality, the creation of a
statistical department to track rates of disease and mortality, and the uniform collection of hospital
statistics so that outcomes could be compared by hospital, region, and country (McDonald, 2001).
Building on Nightingale’s work at the national level of health care systems, Ernest Amory Codman
(1869–1940) brought individual accountability and quality to health care. Coleman developed the
“end results idea” around 1905, which entailed a small pocket-sized card with the patient’s case
number, preoperative diagnosis, operating team members’ names, procedure(s), and results (both
short- and long-term), and he was instrumental in forming the American College of Surgeons
(ACS) in 1913 (Mallon, 2007).
The ACS was created to address great variations in the quality of medical education and the
competence of physicians, and in 1917, the ACS developed the Hospital Standardization Program
using a learning-based model of quality assurance that successfully improved hospital standards up
to the 1950s and 1960s. At that time, the ACS transferred ownership of the original Hospital
Standardization Program to the Joint Commission on Accreditation of Hospitals (now Healthcare
Organizations, JCAHO) (Mallon, 2007). Institutionalization of quality assurance created a
regulatory mindset based on the establishment and maintenance of “minimum standards” that

Health Care Criteria and Organizational Performance 68
developed and created a major impediment to improving health care quality systems (Merry &
Grago, 2001).
Eliot Freidson (1923–2005) in the 1960s was the leading researcher in the sociology of the
profession of medicine. Freidson introduced the concept of the “market shelter” to designate the
unique institutional position that the medical profession holds in society, and he described how a
market shelter shields professional workers from competition, from third party and government
interference, and from other market forces (Freidson, 1975b, pp. 88-91). He was interested in the
medical profession's makeup of largely self-regulating bodies with unique expertise. He also
looked at how policy supported quality and efficient care but the conflict between the bureaucratic
model of service and physicians’ own autonomous professional model, coupled with the
complexity of accountability, presented a challenge to physicians and their patients (Freidson,
1975a).
In the 1970s Avedis Donabedian (1919–2000) introduced a method of assessing and
measuring the quality of care at the level of the physician-patient interaction, which included
outcome of care, process of care (input-activity-output), and structure—attributes of care
providers, settings, and arrangements (Donabedian, 2003). In his book, Donabedian (2003)
summarized over 30 years of his work in developing the concept of quality assurance in health
care with his structure, process, and outcome model and its application to diagnosis and treatment
of the patient and the management of the hospital. Donabedian’s work provided the foundational
thinking that led to changes in health care during the past three decades.
Although Donabedian does not reference Deming, there is a relationship between
Deming’s Theory of Profound Knowledge and chain reaction model (Figure 2) and Donabedian’s
structure, process, and outcome model in that both models are based on process, yielding outcomes

Health Care Criteria and Organizational Performance 69
as well as provider (physician) and customer (patient) relationships. Donabedian and Deming
agree that the assessment and measurement of the quality of care at the level of the physician-
patient interaction is the role of management and critical to continuous improvement. In the
preface to Out of the Crisis, Deming argued that only the transformation of management would
lead to the required improvement in organizational quality and performance, a transformation
involving learning how to change, understanding the “diseases” or barriers endemic in the system,
and knowing how to achieve a cure (Deming, 1986). Deming's philosophy requires “massive
changes in how managers think about their jobs” by providing focus on patients and delivering
quality services (Darr, 1990). Thus, from the time of Florence Nightingale until today, research
and the development of professionalism, standards, accreditations, and structures have influenced
the improvement of health care outcomes. The understanding of process design, measurement,
assessment, and improvement of systems is also important. Ultimately, creating a culture that
supports continuous learning and improvement is important to improving health care outcomes and
that is the responsibility of leadership (Schein, 2004).
The History of CMS/The Joint Commission Measure Alignment. In 1999, the Joint
Commission began a several-year process to solicit input from a wide variety of stakeholders—
clinical professionals, healthcare provider organizations, performance measurement experts, and
others—about potential focus areas for core measures for hospitals. In 2001, the Joint
Commission announced the four initial core measurement areas for hospitals: acute myocardial
infarction (AMI), heart failure (HF), pneumonia (PN), and pregnancy and related conditions (PR)
(CMS, 2011e). Concurrently, the Joint Commission worked with the CMS on the AMI, HF, and
PN sets that were common to both organizations. In 2002, the CMS and the Joint Commission
worked to align the measure specifications for the Quality Improvement Organizations (QIO)

Health Care Criteria and Organizational Performance 70
contracts and for the Joint Commission-accredited hospitals that began collecting these measures
for patient discharges; in 2006 the Surgical Infection Prevention (SIP), which transitioned to the
Surgical Care Improvement Project (SCIP), was included (CMS, 2011e).
The CMS partnered with the Agency for Healthcare Research and Quality (AHRQ),
another agency in the U.S. Department of Health and Human Services, to develop and test the
Hospital Consumer Assessment of Healthcare Providers and Systems (HCAHPS) hospital
experience survey in 2002 (CMS, 2012b). The AHRQ carried out a rigorous scientific process,
including a public call for measures, literature review, consumer focus groups, stakeholder input, a
three-state pilot program, and numerous small-scale field tests to develop the HCAHPS hospital
experience survey. In May 2005, the HCAHPS hospital experience survey was endorsed by the
National Quality Forum, a national organization that represents the consensus of numerous
healthcare providers, consumer groups, professional associations federal agencies, and research
and quality organizations, and in December 2005, the federal Office of Management and Budget
gave its final approval for the national implementation of HCAHPS for public reporting purposes
(CMS, 2012b). The CMS implemented the HCAHPS hospital experience survey in October 2006,
and the first public reporting of HCAHPS results occurred in March 2008 (CMS, 2012b). Since
2003, the CMS and the Joint Commission have worked to align common measures, which has
resulted in the creation of a common set of measure specifications known as the Specifications
Manual for National Hospital Inpatient Quality Measures with a standard data dictionary, measure
information, and algorithms to focus efforts on the use of data to improve the healthcare delivery
process (CMS, 2012b).

Health Care Criteria and Organizational Performance 71
Programs to Improve Health Care Quality
Accreditation programs, including the Joint Commission and the ISO 9001 Standard, other
programs to improve health care performance, and the Health Care Cost and the Patient Protection
and Affordable Care Act include quality improvement as a specific objective.
The Joint Commission. Founded in 1951, the Joint Commission is the nation’s oldest and
largest standards-setting, compliance-driven accrediting body, certifying more than 19,000 health
care organizations and programs in the U.S. The Joint Commission requires hospitals to meet
certain performance standards in an attempt to improve health care. The first major recognition of
the Baldrige HCPE was at a the Joint Commission and Joint Commission Resources (JCR) Annual
Conference on Quality and Patient Safety, held in June 2011 in Chicago, Illinois. At the pre-
conference, a workshop was titled “JCR Creating a Better Patient Experience: Joint Commission,
CMS, Magnet and Baldrige Alignment” (The Joint Commission, 2011).
On September 26, 2008, the CMS approved Det Norske Veritas (DNV) Healthcare, Inc.’s
accreditation program for hospitals seeking to participate in Medicare or Medicaid. DNV’s
program, National Integrated Accreditation for Healthcare Organizations (NIAHO), integrates the
quality management system of the International Organization for Standardization (ISO) 9001 with
the Medicare conditions of participation. The approval of DNV’s program gave hospitals another
accreditation option in addition to existing accreditation programs by the Joint Commission and
the American Osteopathic Association (AOA) or certification by a state survey agency.
Accreditation is critical for the existence of a health care system as it is necessary to have
before receiving CMS payments, and enormous pressure exists beyond the scope of the Joint
Commission survey or inspection once every three years. With such criticality, an industry

Health Care Criteria and Organizational Performance 72
evolved to help health care organization prepare for Joint Commission inspections. For example,
one company promotes on their website:
CMS Survey Preparation and Rescue Services. We are the only healthcare survey preparation firm in the U.S. that has published 1000+ survey-proven compliance documents – and brings them onsite to assure that you have best possible survey outcome. (Hospital Policy Net, 2012) The Joint Commission publishes an 85-page guide for the organization to use in preparing
for the survey titled The Joint Commission’s Survey Activity Guide. In contrast to the approach
taken by the Joint Commission, the HCPE do not set standards, provide regulations, or
accreditation, and as described earlier, the HCPE serve as a model for creating a high-performing
organization and not as a checklist for accreditation.
The HCPE and ISO 9001 Quality Management System Standard. The HCPE are a
holistic organizational model that differs from ISO 9001 Quality Management System standard in
purpose, content, and focus. As a quick review, Congress created the HCPE to enhance U.S.
competitiveness. Based on the non-prescriptive paradigm, the HCPE award program promotes
quality awareness, recognizes quality achievements of U.S. organizations, and provides a vehicle
for sharing successful strategies. The HCPE focus on results and continuous improvement and
provides a framework for designing, implementing, and assessing a process for managing an
organization. The ISO 9001 standard is a series of five international criteria published in 1987 by
the ISO, Geneva, Switzerland. The ISO 9001 standard is a prescriptive Quality Management
System that incorporates the W. Edwards Deming PDSA cycle of improvement (Reid, 2001).
Organizations use the prescriptive standards to define what is needed to maintain an efficient
quality conformance system. For example, the standards describe the need for an effective quality
system, ensuring that measuring and testing equipment are calibrated regularly, and for

Health Care Criteria and Organizational Performance 73
maintaining an adequate record-keeping system. ISO 9001 registration determines whether an
organization complies with its own quality system. Overall, ISO 9001 registration covers less than
10% of the HCPE (NIST, 2010b). Thus the adoption of the prescriptive ISO 9001 standard is the
first step in creating and managing an efficient quality conformance system, but lacks a holistic
model for organizational performance and sustainability.
Other Independent Quality Improvement Programs. This section describes
independent programs created by different interests to improve health care performance. All of the
programs bring value to the efforts of improving health care, but it is the responsibility of the
leadership of health care systems to understand “how” to integrate and align these disparate
programs into the organizational culture and strategy to ensure the workforce is not distracted and
confused by another “flavor of the month” program.
Institute for Healthcare Improvement (IHI). IHI was founded the in the late 1980s by
Dr. Don Berwick and other visionary leaders, including Sr. Mary Jean Ryan of SSM Health Care,
the 2002 recipient of the Baldrige Award. Dr. Berwick served as a member of the panel of judges
for the Malcolm Baldrige National Quality Award program from 1989 to 1991, and Sr. Mary Jean
also served as a Baldrige judge. Both Berwick and Ryan served together on the IHI Board at its
inception (Rhoades, 2003), with Dr. Berwick being the first Chief Executive Officer of the IHI.
While CEO of IHI, Dr. Berwick was appointed by President Barack Obama on July 7, 2010, to
serve as the Administrator of CMS through a recess appointment, but on December 2, 2011, he left
the position because it was clear that Republicans in the Congress would not allow a vote to
confirm him. Even though the American Hospital Association (AHA) issued a letter commending
Berwick for “his commitment and passion to improving health care” and his “openness to always
being willing to listen to the hospital field's perspective on how to deliver better care to patients,”

Health Care Criteria and Organizational Performance 74
political ideology outweighed what was best for the health care system, the economy, and the
citizens of the U.S. (Sullivan, 2011).
The IHI has a long history of formulating creative solutions to some of the most difficult
problems facing the health care system. Based on years of experience, IHI has created a method
for rapidly identifying innovative ideas, assessing their potential, and turning them into processes
and systems that work in the real world. The IHI has worked with dedicated partners to devise
now-familiar tools and concepts that have been critical to improved health care quality, and
through this process, the IHI Triple Aim was developed. The Triple Aim focuses on better care,
better health, at lower cost, and with this focus, the IHI has been committed to transforming health
care into a system that is no longer plagued by errors, waste, delay, and unsustainable social and
economic costs. Although IHI has been pivotal in improving health care, IHI does not offer a
comprehensive non-prescriptive organizational systematic model but instead offers the
transformational knowledge necessary in applying the HCPE (IHI, 2003).
The Physician Consortium for Performance Improvement (PCPI). PCPI was created
in November 2000 by the American Medical Association (AMA) as a national, physician-led
program dedicated to enhancing quality and patient safety. The PCPI leads efforts in developing,
testing, and implementing evidence-based performance measures for use at the point of care. The
purpose of the PCPI is to (a) identify and develop evidence-based clinical performance measures
and measurement resources that enhance quality of patient care and foster accountability, (b)
promote the implementation of effective and relevant clinical performance improvement activities,
and (c) advance the science of clinical performance measurement and improvement (American
Medical Association [AMA], 2012). The PCPI develops, tests, implements, and disseminates
evidence-based measures that reflect the best practices and best interest of medicine. The PCPI is

Health Care Criteria and Organizational Performance 75
nationally recognized for measure development, specification and testing, and enabling the use of
measures in electronic health records (EHRs). The PCPI’s measure development resources include
a measure testing protocol, a position statement on the evidence base required for measure
development, a composite framework, specification and categorization of measure exceptions, and
an outcomes measure framework. Performance measures developed at the PCPI are evidence-
based, valid, and reliable. More than half of the PCPI performance measures are included in the
Physician Quality Reporting Initiative (PQRI) Program. The PCPI has developed more than 250
individual measures covering 42 clinical topics (AMA, 2012). The HCPE provide the model to
actualize the knowledge developed by the PCPI to ensure organizational alignment and integration.
Leapfrog Group. Supported by the Business Roundtable, the Leapfrog Group began in
1998 with a group of large employers who came together to discuss a way to influence the quality
and affordability of purchased health care. In a 1999 report by the Institute of Medicine gave the
Leapfrog founders an initial focus—reducing preventable medical mistakes. The report stated that
up to 98,000 Americans die every year from preventable medical errors made in hospitals alone.
The report actually recommended that large employers provide more market reinforcement for the
quality and safety of health care. The founders realized that they could take “leaps” forward with
their employees, retirees, and families by rewarding hospitals that implement significant
improvements in quality and safety.
The Leapfrog Group’s mission is “to trigger giant leaps forward in the safety, quality, and
affordability of health care by supporting informed healthcare decisions by those who use and pay
for health care; and, promoting high-value health care through incentives and rewards” (Leapfrog
Group, 2012a). The Leapfrog Group offers a voluntary program aimed at mobilizing employer
purchasing power to alert America’s health industry that big advances in health care safety,

Health Care Criteria and Organizational Performance 76
quality, and customer value will be recognized and rewarded. A range of hospital quality and
safety practices are the focus of Leapfrog’s hospital ratings, based on the “Leapfrog Hospital
Quality and Safety Survey,” as well as hospital recognition and reward programs. Endorsed by the
National Quality Forum (NQF), the practices are computer physician-order entry, evidence-based
hospital referral, intensive care unit (ICU) staffing by physicians experienced in critical care
medicine, and the Leapfrog Safe Practices Score (Leapfrog Group, 2012a).
Among other initiatives, Leapfrog works with its employer members to encourage
transparency and easy access to health care information as well as rewards for hospitals that have a
proven record of high quality care (Leapfrog Group, 2012a). The Leapfrog Group created a
hospital survey in 2001 based on existing metrics that identified three quality and safety practices
(leaps) as the focus for hospital recognition and reward. The survey also encourages hospitals to
publicly report their progress in meeting three key safety practices identified as having the
potential to save a substantial number of patients’ lives. Since that time, the Leapfrog Hospital
Survey has evolved into a survey of hospital quality and safety, focusing on hospital structures,
processes of care, and outcomes data, most of which is collected for various regulatory and
accreditation organizations. The Leapfrog Hospital Survey results are accessible online at
www.LeapfrogHospitalSurvey.org (Leapfrog Group, 2012b). The survey site allows anyone to
obtain the results for individual hospitals or to compare hospitals in a region.
Leapfrog works closely with numerous organization to improve health care, such as the
National Quality Forum, Centers for Medicaid & Medicare Services (CMS), Agency for
Healthcare Research and Quality (AHRQ), and the Joint Commission. By 2012, the Leapfrog
Group had evolved into a consortium of Fortune 500 companies and other large private and public
health care purchasers providing health benefits to more than 37 million Americans in all 50 states

Health Care Criteria and Organizational Performance 77
and spending tens of billions of dollars on health care annually (Leapfrog Group, 2012b). All the
efforts of the Leapfrog Group are important to improving health care, but efforts do not provide a
systematic model to create a high performing health care organization.
The National Quality Forum (NQF). The NQF was created in 1999 to develop and
implement a national strategy for health care quality measurement and reporting. The NQF has
focused on several areas, including error rates, unnecessary procedures, and under-treatment,
especially in preventive care. Policies are formed through one of four Member Councils: (1)
Consumer Council, (2) Purchaser Council, (3) Provider and Health Plan Council, and (4) Research
and Quality Improvement Council. The NQF operates under a three-part mission to improve the
quality of American health care by (a) building consensus on national priorities and goals for
performance improvement and working in partnership to achieve them, (b) endorsing national
consensus standards for measuring and publicly reporting on performance, and (c) promoting the
attainment of national goals through education and outreach programs (National Quality Forum,
2012). Although these are important initiatives, the NQF also does not provide a systematic
model for creating a high performing health care organization.
Health Care Cost and the Patient Protection and Affordable Care Act (ACA). There
is a limited supply of resources available for health care in the U.S. despite the fact that the U.S.
spends more of its wealth on health care than any other developed country. In 2005, the U.S. spent
$1.9 trillion, 16% of Gross Domestic Product (GDP), on health care, up from $1.7 trillion or 15%
of GDP in 2003. In 1960, the share of GDP was only 5.2%, but now the U.S. now spends more on
health care than it does on food. Many studies have attempted to explain why the U.S. spends
disproportionately more on health care, and some theories include the high price of drugs, the
abundance of new medical technology, the private nature and administrative complexity of health
Health Care Criteria and Organizational Performance 78
care (Angrisano, Farrell, Kocher, & Laboissiere, 2007), an aging population, reimbursement
incentives under fee for service, poor quality, and limited access.
Several recent initiatives attempted address increasing health care expenditures. For
example, the U.S. Department of Health and Human Services (HHS) announced on September 27,
2011, grants to states and communities to fight chronic diseases—the leading cause of death in
Americans. Created by the ACA, Community Transformation Grants were designed to help states
and communities tackle the root causes of chronic disease, which account for 75% of health care
costs in the U.S. The root causes of chronic disease often relate to economic, social, and physical
factors, such as tobacco use or a lack of places to exercise. Thomas Frieden, Director of the
Centers for Disease Control and Prevention, which will administer the grants, said, “This initiative
will build on successful programs that have helped people lead healthier lives and will enable
communities and states to improve the healthy choices for their residents” (U.S. Department of
Health and Human Services, 2011).
Another consideration is the cost of poor health on the productivity of the economy
because healthy working people are essential to a productive society. Often researchers reference
the cost of poor health to business performance. For example, the National Center for Health
Statistics in 2008 reported that employed adults 18 years of age and over experienced an average
of 4.4 work-loss days per person due to illness or injury, for a total of approximately 698 million
work-loss days (Schuchat, 2009). To improve quality, CMS proposed a rule that would give the
agency the power to drop Medicare Advantage plans and Medicare prescription drug coverage
plans that get low marks for quality (Reichard, 2011). In addition to business, other segments of
the society would benefit from improved health of its participants.

Health Care Criteria and Organizational Performance 79
According to Ezekiel J. Emanuel, Special Advisor for Health Policy in the Office of
Management and Budget and Chair of the Department of Bioethics at the National Institutes of
Health, the ACA is a historical event—the passage of health-care reform having been attempted by
five previous presidents over the course of almost 100 years (Helwick, 2010). Dr. Emanuel
identified several provisions that will reduce the amount of spending on health care. Projections
indicated the greatest reductions will come from the following: (a) cutting overpayment to
Medicare Advantage, saving $136 billion, (b) reduction of payment update factor, saving $196
billion, (c) administrative simplification, saving $20 billion, (d) use of generic biologics, saving $7
billion, (e) enforcement of fraud and abuse laws, saving $3 billion, and (f) payment changes for
complex imaging procedures, saving $1.2 billion (Helwick, 2010). Although it is too early to
understand the actual outcome in the passage of the ACA in controlling spending and improving
health care outcomes, a concerted effort to prevent disease is a critical component.
The CMS National Health Expenditure (NHE) Projections 2010-2020 Report projected
2010 NHE to have reached $2.6 trillion and grown 3.9%, down from 4.0% in 2009. Estimated
spending growth in 2010 was slow due to the recession. Between 2011 and 2013, national health
spending, which is made up almost entirely of medical care, is projected to grow faster, reaching a
rate of 5.5% by 2013. In 2014, health spending is projected to grow 8.3%. This projected
acceleration in the growth rate, up from 5.5% in 2013, is primarily the result of the ACA’s being
signed into law by President Barack Obama on March 23, 2010. The new Health Insurance
Exchanges are expected to cover 13.9 million people in 2014 and contribute to 9.4% growth in
private health insurance spending. By 2014, Medicaid enrollment is expected to increase by 19.5
million people, and spending is projected to grow 20.3%. Over the projection period (2010-2020),
average annual health spending growth (5.8%) is anticipated to outpace average annual growth in

Health Care Criteria and Organizational Performance 80
the overall economy by 1.1 percentage points. By 2020, national health spending is expected to
reach $4.6 trillion and comprise 19.8%of GDP. The government-sponsored share of health
spending is projected to increase from 45% in 2010 to about 50% by 2020, driven by expected
robust Medicare enrollment growth, Medicaid coverage expansions, and exchange plan premiums
and cost-sharing subsidies. Table 5 identifies the billions of dollars of projected health care
expenditures and spending as a percentage of GDP through 2010.
Table 5
National Health Expenditures (NHE) and Selected Economic Indicators, Levels, and Annual Percent Change: Calendar Years 2005-2020 (Projected at 2009)
Year NHE in Billions of
Dollars NHE as a Percentage of Gross Domestic
Product (t% GDP)
2005 $2,021.0 16.0%
2006 $2,152.1 16.1% 2007 $2,283.5 16.2% 2008 $2,391.4 16.6% 2009 $2,486.3 17.6% 2010 $2,584.2 17.6% 2011 $2,708.4 17.7% 2012 $2,823.9 17.6% 2013 $2,980.4 17.6% 2014 $3,227.4 18.1% 2015 $3,417.9 18.3% 2016 $3,632.0 18.6% 2017 $3,849.5 18.8% 2018 $4,080.0 19.1% 2019 $4,346.5 19.4% 2020 $4,638.4 19.8%
Note. The health spending projections were based on the National Health Expenditures released in January 2011. The projections include impacts of the Affordable Care Act. Data from National health expenditure projections 2010-2020, by the Centers for Medicare & Medicaid Services, 2010, Washington, DC.

Health Care Criteria and Organizational Performance 81
The Gaps in Knowledge Including the HCPE in Literature
The health care quality improvement literature contains large gaps relative to the analysis
of HCPE. First, there is a general lack of peer-reviewed scholarly research articles on HCPE over
the past 20 years. Second, specific to health care, there are fewer than 50 actual peer-reviewed
articles and only about 25 published since 2000. The journal articles that actually study the HCPE
do not compare actual performance measures using CMS data in multiple constructs. For
example, one study analyzed the HCPE framework through a survey of quality personnel at 220
U.S. hospitals to investigate whether quality management systems relate to organizational results
and customer satisfaction in hospitals (Goldstein & Schweikhart, 2002). Third, no studies provide
leadership with the compelling evidence to support using the HCPE as a business model. This
dissertation begins to fill these knowledge gaps with an empirical study of health care
organizations using the HCPE model and comparing their performance with those not using a
HCPE model, whether using a different model or no model at all.
Hospitals using the HCPE as an organizational model take a multi-dimensional approach to
health care management with a focus on organizational performance. Health care quality
management is only one dimension of performance. Most studies only approach health care from
the single dimension of quality management, not a holistic approach of organizational
performance. Even so, the literature available in health care quality management studies is limited
generally to non-randomized experiments. According to Pernege (2006), the International Journal
for Quality in Health Care has published 192 papers (excluding editorials and letters) from 2004
through 2006, of which 8 papers, or 4.2%, were randomized experiments because of the nature of
organizational studies. Pernege (2006) suggests health care research methods should include more
scientific rigor to improve understanding health care quality management. A study of three

Health Care Criteria and Organizational Performance 82
organizational models concluded the Baldrige model, the European Foundation Quality
Management (EFQM) Excellence model, and the Chronic Care model have high face validity.
However, only a few studies exist in the academic literature and the effects of the model as a
whole on improved performance remains limited and comes mainly from self-reported,
uncontrolled studies (Minkman, Ahaus, & Huijsman, 2007).
A literature search of studies specific to the Baldrige Award and CPE and HCPE yielded
limited results. A literature review of available material between 1989 and 2012 included the
following keywords: “Baldrige,” “Baldrige Award,” “Baldrige Program,” “Baldrige Award
recipient,” “Baldrige recipient,” “Criteria for Performance Excellence,” “Health Care Criteria for
Performance Excellence,” and “Malcolm Baldrige National Quality Award.” The search of
Tulane University's main library catalog, the Howard-Tilton Memorial Library, on “Baldrige
Award” yielded 897 results with all publication types (periodicals, newspapers, books, primary
source documents, education reports, academic journals, etc.) with 298 peer-reviewed journal
articles. A search of the Business Source Complete database, an index of 3,800 business journals,
magazines, and other publications, identified 260 peer-reviewed journals articles. A search of the
PubMed database yielded 31 results, and Ovid MEDLINE 18 results. Removing the editorials,
reviews, announcements, news, etc. from the list provided 52 abstracts of articles to be reviewed.
Next, a specific search of professional journals that have traditionally published Baldrige
articles and research was conducted with a focus on health care. The results for ASQ Quality
Management Journal were 25 articles with one article specific to health care. The Quality
Management Journal, a peer-reviewed publication that links the efforts of academic researchers
and quality management practitioners by publishing significant research relevant to quality
management practice, yielded 25 articles, with 11 in the title and only 1 health care article. In

Health Care Criteria and Organizational Performance 83
addition, health care professional organizations and journals were searched and produced the
following results: British Medical Journal, 3; Hospitals & Health Networks, 101; IHI, 14; Journal
of American Medical Association, 4; the Commonwealth Fund website, 10; the American Medical
Association website, 58; the American Hospital Association website, 56; and the ASQ Health
Care Division website, 51 results. Finally, 38 books were used for this study with 12 specific to
health care improvement, most of which reference the HCPE model.
Most of the books that reference the HCPE do so in terms of identifying the performance of
health care recipients of the Baldrige Award and make a general reference to an aspect of the
HCPE model. In Strategic Management for Health Care Organizations, Swayne et al. (2008)
describe the role of a systems perspective to strategic management and profile the performance of
Baldrige Award health care recipients, including SSM Health Care System (2002 Baldrige
recipient), Baptist Hospital (2003 Baldrige recipient), and Sharp Health Care (2007 Baldrige
recipient). Another approach to describing the HCPE was addressed in The Health Care Quality
Book: Vision, Strategy and Tools where the authors describe the HCPE as a system for improving
health care performance (Ransom, Josji, Nash, & Ransom, 2008, pp. 70-71). The book Medical
Quality Management Theory and Practice addressed the HCPE as a model for “continuous
performance improvement” and referenced several recipients of the health care Baldrige Award
(American College of Medical Quality, 2010, pp. 178-184). Some books identify high-performing
hospitals and profile Baldrige Award recipients but do not address the HCPE model. For example
one 2012 book, Pursuing the Triple Aim: Seven Innovators Show the Way to Better Care, Better
Health, and Lower Costs, profiles high-performing health care systems such as Southcentral
Foundation (2011 Baldrige recipient) and SSM Health Care System (2002 Baldrige recipient) but
Health Care Criteria and Organizational Performance 84
makes no mention of the Baldrige Program or the HCPE in the book (Bisognabo & Kenney,
2012).
The literature available in the quality management, organizational systems, and general
management theories fields support the prominent view that a value-added experience can be
derived from implementing the HCPE for organizational self-assessment and Baldrige award
processes. In other words, the use of the HCPE model is pivotal to organizational performance
(Latham & Vinyard, 2011). Results of studies presented earlier in this paper suggested that the use
of the HCPE improves financial performance, with studies that explored hypotheses that
implementation of effective TQM programs improves the operating performance of firms
(Hendricks & Singhal, 1997) and that Baldrige award winners significantly outperform firms in the
various control groups (Hendricks & Singhal, 2001). Flynn and Saladin (2001) studied the validity
of the framework by examining its theoretical constructs relative to changes over time (1988,
1992, and 1997) and found all include robust relationships. Researchers from the Monfort Institute
Sustainable Transformation Program have studied how leaders of Baldrige recipient organizations
differ in their motivations and attitudes from leaders in other organizations not using Baldrige
HCPE models and processes (Appleby, Harshman, & Latham, 2009).
Positive results of a link between HCPE and organizational performance resonate in health
care research. In the Institute for Healthcare Improvement (IHI) report titled Seven Leadership
Leverage Points for Organization-Level Improvement in Health Care, the IHI identified seven
leverage points for organization-level improvement in health care. The IHI recommends the use of
the HCPE model as a “comprehensive framework for the leadership” to execute organizational
transformation and to operationalize the seven leverage points (Reinertsen, Pugh, & Bisognano,
2004, p. 7). The report provides leaders with a starting point to “leverage” specific activities and

Health Care Criteria and Organizational Performance 85
specific changes in leadership systems, in which a small change might bring about large, positive,
system-level results. These leverage point were developed from (1) complex systems theory; (2)
observed performance of leaders; (3) hunches, intuition, and collective experience; and (4)
ongoing research and development of management theories and methods (Reinertsen et al., 2004).
The seven leverage points are to (1) establish and oversee specific system-level aims at the highest
governance level; (2) develop an executable strategy to achieve the system-level aims and oversee
their execution at the highest governance level; (3) channel leadership attention to system-level
improvement, personal leadership, leadership systems, and transparency; (4) put patients and
families on the improvement team; (5) make the chief financial officer a quality champion; (6)
engage physicians; and (7) build improvement capability (Reinertsen et al., 2004).
According to Bodinson (2005), the HCPE provide a systems approach that has proven
successful in assuring the best clinical outcomes, and leaders have learned that applying the HCPE
helps them focus, prioritize, integrate, and align their improvement initiatives to accomplish the
results that matter most. Thus, it is evident a pattern exists in research studies and reports that
support the use of the HCPE as a model to improve performance.
In the Thomson Reuters 100 Top Hospitals (2012), Baldrige Award-winning hospitals were
six times more likely to be among The 100 Top Hospitals, which represent the top 3% of hospitals
in the United States. A NIST commission study in 2003 about leadership’s knowledge and attitude
found 70% of leaders surveyed among Fortune 1000 companies said they are likely to use the
HCPE while 50% to 80% of the education, health care, and small business organizations surveyed
had little or no familiarity with the HCPE (Booz Allen Hamilton, 2003). Leonard and Relle’s
(2004) article identified the HCPE as crucial to health care organization results and highlighted
critical issues for consideration in improving performance, such as (a) the importance of

Health Care Criteria and Organizational Performance 86
leadership, (b) the need to consider all elements of an organization, (c) the strategic importance of
scanning and analyzing the business environment, and (d) the value of creating focus on patients
and employees.
At the Fourth Annual Nursing Leadership Congress, under a theme of “Driving Patient
Safety Through Transformation,” a presentation titled “Using the Baldrige Business Model as the
Infrastructure for Creating a Culture of Patient Safety” (Gash & Trimble, 2008) described how the
2003 Baldrige recipient, Saint Luke’s Health System, adapted the Baldrige model into its own
model. St. Luke’s “Leadership for Performance Excellence” emphasizes the power of a systems
perspective in both vertical and horizontal integration, with everything flowing from the mission,
vision, and values of the organization. Together with input from consumers and other key
stakeholders, the model drives the organization’s strategic priorities and balanced scorecard (Gash
& Trimble, 2009). The HCPE provide a framework that focuses on obtaining the highest levels of
health care performance by providing a model to create well-defined systems to share best
practices and lessons learned to improve decision making, which offers a differentiating approach
to health care performance excellence (DeJong, 2009).
Wilson and Collier’s (2000) research tested the theory and causal performance linkages of
the HCPE and found the underlying theory of the HCPE supports leadership as the driver of
systems and processes that lead to positive results. Ford and Evans (2001) researched the links
between HCPE-inspired learning and effective change management, and their results suggest that
an effective process change management model can be derived from the framework of the HCPE
for any organization, including health care. Moreover, Denney, Johnson, and Pitcher (2010)
studied the relationship between the American Nurses Credentialing Center (ANCC), Magnet
Recognition Program, and the Baldrige Program, and their results revealed that the Magnet Criteria

Health Care Criteria and Organizational Performance 87
provided a framework for delivering sustained improvement in outcomes of the workforce,
patients, and the consumers, while HCPE filled the gaps in improving the leadership and
sustainability of an organization (Denney et al., 2010). In other words, “Magnet and the HCPE
complement and reinforce each other, the HCPE requires empowerment and staff engagement in
improvement, which are the core foundation of Magnet” (Denney et al., 2010, p. 4). The Magnet
Criteria provided the foundation to drive improvements in clinical and operational quality, and the
HCPE enabled a sustainability system that held the gains that Magnet delivered. The value of the
HCPE as documented in research is summed up by Robert Chalice (2007), who describes how
leadership must learn to improve decision making to improve the organization as in Step 41,
“Learning from Other Benchmark Healthcare Organizations.” Chalice states that hospitals should
“learn from Baldrige Award finalists” (p. 127). Finally, according to Kelly (2011, p. 51), the
HCPE offer the “most contemporary framework for organizational effectiveness in health care,”
and the HCPE provides managers with an understanding of alignment within the organization to
improve quality.
The literature has documented the effectiveness of the HCPE and the Baldrige Award
program in improving organizational results outside the U.S. boundaries. As described earlier, the
HCPE are the genesis for 79 international award programs that include elements of the HCPE,
such as the European Quality Award (EFQM), a HCPE-based program in Japan in addition to the
Deming Prose, and the New Zealand Business Excellence Award (Latham & Vinyard, 2011, p. 1).
The Global Excellence Model (GEM) Council is made up of the Chief Executives of national
excellence models and award programs from around the world. Members include Australia,
Europe, Ibero-America (Brazil, Mexico, Spain), India, Japan, and Singapore (EFQM, 2012).

Health Care Criteria and Organizational Performance 88
Schniederjans, Parast, Nabavi, Rao, and Raghu-Nathan (2006) developed an analysis of the
HCPE in terms of their importance and the differences in quality control management in the
United States, Mexico, and India. They reported significant differences in opinions regarding the
value of the HCPE, and there was less apparent difference between the U.S. and Mexico as
compared to India in a study of 500 firms. Some reasons for the differences include the
geographic distance between India and the U.S. and shared hemispherical managerial knowledge
transfer rates between the U.S. and Mexico. Relying on convergence theory, Schniederjans et al.
concluded that the U.S. and Mexico would continue to converge in quality management theory and
practice while India would not because of India’s geographical position and the rate of exchange
between the U.S. and Mexico.
The literature includes other studies on the international significance of the quality
management assessment frameworks. A study of 34 Spanish firms evaluated on the 1997-2000
European Foundation for Quality Foundation Excellence (EFQM) model was conducted by
Garcia-Bernal, Gargallo-Castel, Pastor-Agustin, and Ramirez-Aleson (2004). They found that (a)
firms with higher levels of quality across the full spectrum of the criteria performed at levels above
firms with the lowest scores across the EFQM variables and (b) that firms with partial
implementation across some parts of the EFQM criteria lacked positive business results. This
international interest in the HCPE and their cross-cultural adaptations shows the level of
acceptance in the global marketplace and reinforces the aim of this dissertation to validate a model
of performance excellence in health care with worldwide implications.
CMS Measures and the Hospital Compare Database in Literature
Due to its richness and availability, CMS data has been widely used by researchers. There
are various types of CMS data sets, including the “Long Term Care Minimum Dataset (MDS),

Health Care Criteria and Organizational Performance 89
Outcome and Assessment Information Set (OASIS), Inpatient Rehabilitation Facility Patient
Assessment Instrument (IRF-PAI), Medicare Current Beneficiary Survey (MCBS), Cost Reports,
Consumer Assessment Health Plans Survey (CAHPS), Health Outcomes Survey (HOS), [and]
Health and Retirement Survey (HRS)” (CMS, 2012e). Since the focus of this study is to compare
hospital performance, the CMS data set that will be used is Hospital Compare (CMS, 2012c),
which will be explained in detail in Chapter 3.
In order to validate the relevance of CMS data in current literature, a literature search of
different keywords related to CMS data in the Ovid MEDLINE and PubMed databases was
conducted for the period between 1996 and 2012. For example, the keywords “CMS data
research” resulted in 5,603,727 hits in Ovid and 771 in PubMed. For the keywords “hospital
compare,” results were 197,490 hits in Ovid and 69,950 in PubMed. Narrowing the search to a
focus on CMS data and hospital performance, results include 1,103 hits for keywords “hospital
performance comparisons” and 304 hits for “hospital performance quality comparisons.”
Narrowing the search further using search terms such as “CMS data for hospital performance,” hits
in the literature database were 56 in Ovid and 20 in PubMed. Approximately 150 abstracts were
reviewed for relevance to this study, which identified various types of articles on topics, such as
“pay-for-performance” (Collier, 2007; Vina, Rhew, Weingarten, Weingarten, & Chang, 2009) and
“quality improvement” (Izakovic, 2007; Wong, Levinson, & Shojania, 2012). The review revealed
that researchers consistently and confidently use CMS Hospital Compare data to study health care
outcomes, processes, and the satisfaction of patients.
Efforts to improve quality and cut costs have led the federal government to initiate public
reporting with Hospital Compare data. To reinforce the importance of standardized metrics in the
health care industry, the CMS, along with key stakeholders such as the Joint Commission, the
Health Care Criteria and Organizational Performance 90
AMA, the PCPI, and many medical societies, is developing performance measures for hospitals
and physicians (Laurent, Neuman, Martinez, Pauker, & Dutton, 2011). Although studies have
been conducted using CMS data and Hospital Compare, none segmented the study groups based
on achieving the performance excellence status of the Baldrige Award. Statistically comparing
Baldrige-winning hospitals with non-Baldrige hospitals using CMS data allowed for comparison of
the performance of health care systems using the HCPE as a business model to their competitors in
their market.
Closing Observations
The purpose of this chapter was to offer a review of the literature that provides a clear and
systematic understanding of the Baldrige Award program and the HCPE. The chapter gave a brief
historical account of the development of quality, the concept of continuous organizational
performance improvement, and various important theories and practices to provide a context for
the development of the HCPE. Henry Ford’s approach to manufacturing in 1913 using a
production line with minimum inventory, known today as just-in-time, and his philosophy of
measuring and eliminating waste, known as Lean, describes an early foundation of management
philosophies that the health care industry is implementing. The history of Six Sigma tools and
techniques, developed over a 50-year period, starting with Shewhart, Dodge, and Deming in the
1920s and continuing to Motorola in the 1980s, revealed the strength of proven methods that are
just now being accepted into health care performance improvement efforts and supported by
professional and learning organizations for health care, such as the Institute for Healthcare
Improvement, the American College of Healthcare Executives, and the Joint Commission. Finally,
the historical review emphasized a long-standing focus on leadership’s role in strategy

Health Care Criteria and Organizational Performance 91
development and executions through the Balanced Scorecard process, which is also being currently
accepted and applied in health care.
A common challenge in understanding the uniqueness of the HCPE was addressed in the
form of an architect’s blueprint or a biological model metaphor. The HCPE model is like DNA;
just as DNA is a basic design framework for all living organisms, the HCPE is a basic design
framework for organizations. Deming’s chain reaction model (see Figure 2) was presented as a
theoretical construct that supports the design of the HCPE. The strengths of the HCPE non-
prescriptive design allows for the integration of any management theory, concepts, and best
practices to ensure superior levels of performance and sustainability. The process for achieving
the Baldrige award explains a unique, complex, intensive organizational assessment system that
leads to improvement, with the HCPE systems-perspective design enabling the identification of the
key leverage points that have the greatest impact on overall system performance. Providing
leadership with a structure and mental model for understanding how to move an organization from
good to excellent performance, the HCPE challenge leaders to learn to think at a different level and
to move beyond silo or departmental linear thinking. Lines of authority and control are expanded
in the context of a systems view and new concepts for integrated performance improvement.
Acceptance of this challenge to learn a new model for thinking will provide leaders with a broader
set of solution resources with which to design approaches and create a high-performing
organization. Future leaders desiring to develop high-performing organizations will have to create
leadership systems that provide the structures, mechanisms, and discipline for decision-making,
selection, and development of the next generation of leaders, and the reinforcement of values,
ethical behavior, directions, and performance expectations.

Health Care Criteria and Organizational Performance 92
In this chapter, several studies were reviewed that demonstrated the effect of the HCPE and
quality awards on organizational results, including customer satisfaction, employee satisfaction,
process performance, financial performance, and stock price. In one study, award recipients
outperformed the S&P 500 by about 3 to 1 (NIST, 2002). Specific to health care, Baldrige
hospitals outperform The 100 Top Hospitals on the following measures: risk-adjusted mortality
index, risk-adjusted complications index, patient safety index, CMS core measures score, severity-
adjusted average length of stay, and adjusted operating profit margin (Foster, 2011).
Although there are no published academic or scholarly works identifying weaknesses of the
HCPE, experts have acknowledged there are challenges with (a) the level of complexity, (b) the
necessity to learn new mental models, (c) the adoption of a philosophy of continual learning and
improvement, and (d) the creation of a culture that fosters high performance, reliability, and
sustainability. This may help explain the low use of the HCPE-based model in academia and
industry, but results of its effectiveness cannot be ignored. Overcoming these challenges and
achieving the levels of performance necessary to receive the Baldrige Award takes the total
commitment of all levels of leadership to create a high-performing learning organization, and years
of cycles of reflection, self-assessment, learning, and transformation. Ultimately, organizational
performance is the responsibility of leadership—to “create consistency of purpose for
improvement” as described by Deming (1982, pp. 24-25).

Health Care Criteria and Organizational Performance 93
Chapter 3: Research Question and Hypothesis
The research question for this study is “Do hospitals that have received the national
Baldrige Award for Performance Excellence (HCPE) perform better than hospitals in their
geographic markets (non-HCPE) based on comparisons of the same CMS performance measures?”
This study explores the relationships between the use of the HCPE as a business model and
performance of health care organizations.
The null hypothesis is H0: µ HCPE = µ non-HCPE. Likewise, the alternative hypothesis is Ha:
µ HCPE > µ non-HCPE or Ha: µ HCPE < µ non-HCPE, depending on whether the higher value of the
outcome is favorable or unfavorable.

Health Care Criteria and Organizational Performance 94
Chapter 4: Methodology
Review of the Purpose of the Study
Health care organizations across the U.S. are adopting a policy of using the HCPE as a
business model to improve organizational performance. Some well-known heath care systems
specifically using the Baldrige Health Care Criteria to improve organizational performance include
Baylor Health Care System, Health Care Corporation of America, Kaiser Permanente, the Mayo
Clinic, M.D. Anderson Cancer Center, St. Jude Medical, Inc., and the Cleveland Clinic (Baldrige
Foundation, 2011). The purpose of the study is to determine if there is a relationship between the
use of the HCPE as a business model and the performance of health care organizations. To
accomplish this, the study will compare Baldrige Health Care Criteria award recipients to their
competitors using CMS performance measures. This will help determine if there is sufficient
evidence to support the use of the HCPE as a business model for health care systems. The study
adds to the health care performance excellence theoretical foundation by identifying process and
outcome metrics in which the HCPE have the greatest impact.
In other words, the purpose of this study will help to determine if there is sufficient
evidence to support the use of the Baldrige HCPE as a business model for health care systems.
The confluence of evidence and decision making should provide the structure for leaders to
develop policies based more on evidence than political conviction, ideology, hierarchical privilege,
or economic power (Pawson, 2006). No existing research has tested the HCPE model by
comparing health care recipients of the Baldrige Award to like competitive health care
organizations that have not used the HCPE, using the same CMS performance measures as the
dependent variable. Although there are HCPE applications for health care, business, education and
non-profit sectors, health care is the only industry with standardized, industry-wide, government-
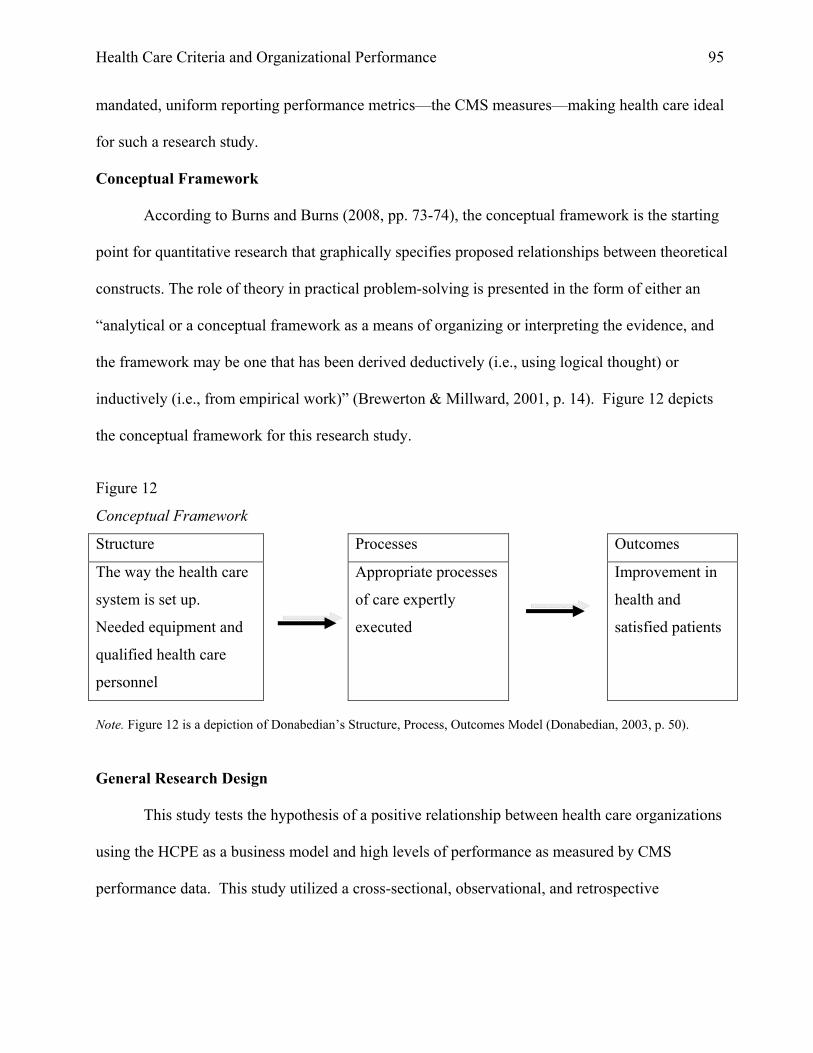
Health Care Criteria and Organizational Performance 95
mandated, uniform reporting performance metrics—the CMS measures—making health care ideal
for such a research study.
Conceptual Framework
According to Burns and Burns (2008, pp. 73-74), the conceptual framework is the starting
point for quantitative research that graphically specifies proposed relationships between theoretical
constructs. The role of theory in practical problem-solving is presented in the form of either an
“analytical or a conceptual framework as a means of organizing or interpreting the evidence, and
the framework may be one that has been derived deductively (i.e., using logical thought) or
inductively (i.e., from empirical work)” (Brewerton & Millward, 2001, p. 14). Figure 12 depicts
the conceptual framework for this research study.
Figure 12
Conceptual Framework
Structure Processes Outcomes
The way the health care
system is set up.
Needed equipment and
qualified health care
personnel
Appropriate processes
of care expertly
executed
Improvement in
health and
satisfied patients
Note. Figure 12 is a depiction of Donabedian’s Structure, Process, Outcomes Model (Donabedian, 2003, p. 50).
General Research Design
This study tests the hypothesis of a positive relationship between health care organizations
using the HCPE as a business model and high levels of performance as measured by CMS
performance data. This study utilized a cross-sectional, observational, and retrospective

Health Care Criteria and Organizational Performance 96
“quantitative correlational design” to explore these relationships (Brewerton & Millward, 2001, p.
57).
HCPE Construct Validity
Goldstein and Schweikhart’s (2002) research examined the relationships between the
constructs in the HCPE framework and management systems and organizational results to
establish the construct validity of the HCPE. The research hypothesized and tested the relationship
between process measures of Baldrige Categories 1 through 6 (independent variables) and hospital
Baldrige results scores on Dimensions 7.1 through 7.5 (dependent variables). All relationships
between the Baldrige Categories 1–6 and Category 7 were statistically significant. The regression
analysis results were as follows: Patient/Customer Satisfaction Results (7.1) R2 = 0.316, p < .001;
Health Care Results (7.2) R2 = 0.165, p < .001; Financial and Market Results (7.3) R2 = 0.166, p <
.001; Staff and Work Systems Results (7.4) R2 = 0.566, p < .001; and Organization-Specific
Results (7.5) R2 = 0.165, p < .001. The significant associations among Baldrige Categories 1–6
and each of the Category 7 dimensions provide confirmatory evidence of a relationship between
using the Baldrige framework as a research construct in studying organizational performance
excellence.
Research Question
Utilizing a “quantitative correlational design” (Brewerton & Millward, 2001, p. 57), this
study explored the relationships between the use of the HCPE as a business model and
performance of health care organizations. The research question was “Do hospitals that have
received the national Baldrige Award for Performance Excellence (HCPE) perform better than
hospitals in their geographic markets (non-HCPE) based on comparisons of the same CMS
performance measures?” Currently, no research exists that tests the HCPE model by comparing

Health Care Criteria and Organizational Performance 97
health care recipients of the Baldrige Award to like competitive organizations using the CMS
performance measures, although some prior research set the foundation for the proposed study.
For example, the research of Goldstein and Schweikhart (2002) examined the relationships
between constructs in the HCPE framework and organizational results and demonstrated that
measures of Baldrige Categories 1–6 predicted hospital scores in Category 7. Details of this study
are provided in Chapter 2.
Independent and Dependent Variables. In this study, the independent variable of
interest was whether a hospital uses the HCPE, and the dependent variables are CMS performance
measures. In order to assess performance of health care organizations, four different groups of
CMS measures were utilized to analyze whether or not hospitals using the HCPE business model
outperform competing hospitals across the following groups of measures:
(1) HCAHPS hospital experience patient survey measures performance;
(2) Outpatient imaging efficiency;
(3) Process of care measures performance for heart attack, heart failure, and pneumonia,
and surgical care improvement project (SCIP) process measures performance; and
(4) Outcome of care measures performance.
This data was available at no cost from the Hospital Compare website, which provides
consumers with the capability to compare the quality of hospital services and is hosted by the U.S.
Department of Health & Human Services (HHS).
Research Approach
The study discussed in this dissertation employed a research approach (Shi, 1997, p. 115)
designed to test whether the performance of HCPE hospitals will be significantly better on these
measures than that of non-HCPE hospitals. The current research was used to test the hypotheses

Health Care Criteria and Organizational Performance 98
and examine relationships among variables of interest (Shi, 1997, p. 219). Figure 13 is a depiction
of the research approach.
Figure 13
Operational Framework
Data Overview
CMS performance data for Baldrige Award hospitals were compared to competitors in their
geographic markets. The hospital performance data was downloaded from the CMS Hospital
Compare website (CMS, 2012c); the data are available as a Microsoft Access 2000 database or in
CSV file formats. The CMS Hospital Compare database includes all of the hospitals’ addresses
with phone numbers, zip codes, number of beds, type of ownership (public, private not-for-profit,
for-profit, etc.), and other pertinent information for analysis. Since this analysis would employ the
Baldrige Award
Recipient
Hospitals
2002 - 2011
CMS Data
1. HCAHPS Patient Survey Measures
2. Outpatient Imaging Efficiency
Measures
3. Process of Care for Heart Attack, Heart
Failure, Pneumonia, and Surgical
Care Improvement Project (SCIP)
Measures
4. Outcome of Care Measures
Non-Baldrige
Competitor
Hospitals
High-
Performing
Hospitals
Non-High-
Performing
Hospitals

Health Care Criteria and Organizational Performance 99
Statistical Package for the Social Sciences (SPSS), the Microsoft Excel files were converted to
SPSS files.
Subjects
A purposeful sampling strategy was used to “select information-rich cases” to focus on the
specific hospitals in a geographic region rather than a general random sample (Taylor-Powell,
1998, p. 6). Study subjects were chosen according to the following selection criteria. The
hospitals must be (1) Baldrige Health Care Award recipients from 2002 through 2011, (2) or
competing hospitals within a 25- to 50-mile radius of the Baldrige Award hospital, and (3) must
have reported CMS data. The exclusion criteria were (1) hospitals beyond the 25- or 50-mile
radius and (2) hospitals with no reported CMS data for the study period, such as Veterans
Administration hospitals and children’s hospitals. The Baldrige Health Care Award recipients
were identified from the NIST Baldrige Performance Excellence Program (NIST, 2011a) and
geographic competitors identified from the CMS Hospital Compare data (CMS, 2012c). To obtain
the geographic competitors to the Baldrige recipient hospitals, each Baldrige recipient hospital’s
ZIP code was entered into the CMS Hospital Compare website, and a general search was executed
on a 25- or 50-mile radius. The distance was based on patients’ access to a nearby hospital; 9
hospital systems had competitors identified within a 25-mile radial search, and 5 hospital systems,
in less populated areas, had competitors identified within a 50-mile radial search, and included
facilities in multiple states. The five Baldrige Award hospital systems in less populated areas were
SSM Health Care, North Mississippi Medical Center, Poudre Valley Health System, Heartland
Health, and Schneck Medical Center. In contrast, the Advocate Good Samaritan Hospital, located
in the Chicago metropolitan area, had 36 acute care hospitals available within 25 miles. Patients
who access hospitals outside metropolitan areas travel greater distances to obtain quality care.

Health Care Criteria and Organizational Performance 100
Residents in the Seymour, Indiana, area must travel 50 miles to access one of eight acute care
hospitals, including the 2011 recipient, Schneck Medical Center.
Many of the rural area hospitals were critical access hospitals, which play a crucial role in
the U.S. rural safety net but which lack in quality of care. A study by Joynt, Harris, Ovar, and Jha
(2011) compared critical access hospitals to acute care hospitals and found critical access hospitals
had fewer clinical capabilities, worse measured processes of care, and higher mortality rates for
patients with acute myocardial infarction, heart failure, and pneumonia. The Balanced Budget Act
of 1997 created critical access hospitals as a federal effort to increase resources for small,
geographically isolated hospitals, many of which were struggling financially. The Budget Act
required hospitals that converted to critical access status to become eligible for cost-based
reimbursement rather than diagnoses-related group–based reimbursement.
A total of 315 hospitals were initially considered for the study, with 51 HCPE and 264 non-
HCPE or competitors. The data used for this study are from (a) the American Hospital
Association, (b) the CMS Hospital Compare database, and (c) hospital websites. After a baseline
comparison of characteristics of the 315 hospitals, the study selected 187 hospitals to study and
excluded 128 hospitals; the baseline comparison is defined in Table 6.

Health Care Criteria and Organizational Performance 101
Table 6
Baseline Comparison of Hospital Characteristics
Characteristic Included
(N=187)
Excluded
(N=128)
p-value
Bed Size Small (< 99) 0 128 (100.0) *
Medium 131 (70.1) 0
Large 56 (29.9) 0
Hospital Type .000
Acute Care 183 (97.9) 64 (50.0)
Critical 4 ( 5.9) 64 (50.0)
Ownership .000
For Profit 8 ( 4.3) 24 (18.8)
Non-Profit 179 (95.7) 104 (81.2)
Religious .001
Yes 63 (33.7) 22 (17.2)
No 124 (66.3) 106 (82.8)
Emergency .037
Yes 174 (93.0) 110 (85.9)
No 13 ( 7.0) 18 (14.1)
System .000
Yes 117 (62.6) 48 (37.5)
No 70 (37.4) 80 (62.5) Note. Data are given as frequency (percentage); Pearson’s Chi-square test for categorical variables was used to determine significance. *Data not available for analysis.
The statistically significant characteristics were hospital type, ownership, religious
affiliation, emergency services, and system, which is a characteristic for multiple hospitals. The
characteristic of bed size was important in this study for managing missing data because a majority
of the missing data was attributed to hospitals with fewer than 100 beds. Thus, three size
categories were created to perform the analysis and clean the data: “small” was fewer than 99 beds,

Health Care Criteria and Organizational Performance 102
“medium” was 100-400 beds, and “large” was more than 400 beds. This methodology was
adopted from Jha, Orav, Zheng, and Epstein (2008). Table 7 identifies the hospital characteristics
(control variables) that were included in the study. The definitions of the hospital characteristics in
Table 7 were obtained from the American Hospital Association website, except for religious
affiliation, which was determined by reviewing the website of each hospital. This review included
references to religious principles in the mission, vision, and values of the organization or the
confirmation of a specific religious affiliation.
Table 7
Characteristics (Control Variables) and Definitions of All HCPE and Non-HCPE Hospitals
Characteristic or
Control Variable
Definition
Bed Size The number of beds licensed to operate by the state. The
American Hospital Association and health care research
use these three hospital categories.
Small (< 99)
Medium (100- 400)
Large (401 +)
Hospital Type Acute care hospitals have highly specialized personnel
and sophisticated, multifaceted equipment materials, and
may have intensive or emergency care. Critical access
hospitals meet certain federal guidelines, are designed to
improve rural health care access while reducing hospital
closures, and have a maximum of 25 acute care inpatient
beds.
Acute Care or
Critical Access

Health Care Criteria and Organizational Performance 103
Table 7 (continued)
Characteristics (Control Variables) and Definitions of all HCPE and non-HCPE
Hospitals
Characteristic or
Control Variable
Definition
Ownership For-profit is defined as investor-owned community
hospitals. Non-profit is defined as non-government
community hospitals.
For Profit or Non-Profit
Religious Affiliation Religious affiliation was determined by hospital self-
reporting documentation on their web site. This is the
only control variable not obtained from the American
Hospital Association website.
Yes or No
Emergency Services Hospital provides 24-hour emergency services. Yes or No
System Effect Hospital that have identified themselves as part of a group
of hospitals. Yes or No
Note. Definitions are based on definitions provided by the American Hospital Association website or information from hospitals’ websites.
Missing Data. Hospitals with fewer than 100 beds were excluded from the study due to
large amounts of missing data. The exclusion of these cases reduced the number of subject
hospitals from 315 to 187, with 34 HCPE and 159 non-HCPE hospitals. Of the 128 hospitals with
fewer than 100 beds excluded from the study, 64 (50%) were critical access hospitals.
Table 8 lists the 34 HCPE hospitals by system and indicates how many hospitals remain in
each system for study after removing hospitals with fewer than 100 beds. Two of the HCPE
hospital systems had no hospitals included in the study after omitting hospitals with fewer than 100
beds from analysis: Heartland Health with 97 beds and Schneck Medical Center with 93 beds.

Health Care Criteria and Organizational Performance 104
Table 8
Health Care Recipients of the Performance Excellence Award with ≥ 100 Beds
Year Recipients Number of HCPE
hospitals in study after
removing hospitals with
< 100 beds
2002 SSM Health Care (SSM) 11
2003 Baptist Hospital 1
2003 Saint Luke’s Hospital (SLH) 5
2004 Robert Wood Johnson University Hospital at
Hamilton
1
2005 Bronson Methodist Hospital 2
2006 North Mississippi Medical Center 1
2007 Mercy Health System 1
2007 Sharp Health Care 1
2008 Poudre Valley Health System 2
2009 AtlantiCare Regional Medical Center 1
2009 Heartland Health 0 (97 beds)
2010 Advocate Good Samaritan Hospital 1
2011 Henry Ford Health System 2
2011 Schneck Medical Center 0 (93 beds)
Total 34

Health Care Criteria and Organizational Performance 105
Table 9 defines the hospital characteristics based on hospitals with over 100 beds that were
retained in the study.
Table 9
Characteristics of Medium and Large Bed Size HCPE and Non-HCPE Hospitals
Characteristic HCPE
(N=34)
non-HCPE
Competitors (N=153)
p-value
Bed Size .452
Medium (100-400) 22 (64.7) 109 (71.2)
Large (401+) 12 (35.3) 44 (28.8)
Hospital Type .721
Acute Care 33 (97.1) 150 (98.0)
Critical Access 1 (2.9) 3 (2.0)
Ownership *
For Profit 0 8 (5.2)
Non-Profit 34 (100.0) 145 (94.8)
Religious Affiliation .026
Yes 17 (50.0) 46 (30.1)
No 17 (50.0) 107(69.9)
Emergency Services *
Yes 34 (100.0) 140 (91.5)
No 0 13 (8.5)
System .002
Yes 29 (93.2) 88 (57.5)
No 5 (6.8) 65 (42.5)
Note.Data are given as frequency (percentage) and Pearson’s Chi-square test for categorical variables used to determine significance. *Data not available for analysis.

Health Care Criteria and Organizational Performance 106
Data for the Analysis
The data used for this study were from (a) the American Hospital Association, (b) the CMS
Hospital Compare database, and (c) hospital websites. This study assessed hospital performance in
five areas for HCPE and non-HCPE hospitals: (1) HCAHPS hospital experience patient survey
measures performance; (2) outpatient imaging efficiency; (3) process of care measures
performance for heart attack, heart failure, and pneumonia measures; (4) surgical care
improvement project (SCIP) process measures performance; and (5) outcome of care measures
performance. See the appendix for a detailed description and definition of variables.
HCAHPS. The HCAHPS hospital experience patient survey measures were refreshed in
June 2011 and covered a collection period from October 2009 through September 2010. The
HCAHPS hospital experience patient survey measures had three response formats: (a) the patient
gives a rating of “sometimes or never,” “usually,” and “always”; (b) the patient indicates that a
certain action or process occurred with a response of “yes” or “no”; and (c) the patient gives a
rating of 6 or lower, 7 to 8, and 9 and 10 on a scale of 0-10, with 0 being the lowest rating and 10
being the highest.
This study included the positive or highest category score for the analysis, known as “top
box.” HCAHPS results are “top-box,” “bottom-box,” and “middle-box” scores. The “top-box”
was the most positive response to HCAHPS survey questions. The “top-box” response for the
different categories was "Always” for five HCAHPS composites (Communication with Nurses,
Communication with Doctors, Responsiveness of Hospital Staff, Pain Management, and
Communication about Medicines) and two individual items (Cleanliness of Hospital Environment
and Quietness of Hospital Environment); “Yes” for the sixth composite, Discharge Information; 9
or 10 (high) for the Overall Hospital Rating item; and “Would definitely recommend” for the

Health Care Criteria and Organizational Performance 107
Recommend the Hospital item (CMS, 2012d). In this study, only the HCAHPS “top-box”
methodology was used because it is commonly used in health care research (Gupts, Daigle,
Mojica, & Hurley, 2009; Heidenreich et al., 2012; Jha et al., 2008). Table 10 lists the 10 HCAHPS
hospital experience patient survey measures.
Table 10
HCAHPS Hospital Experience Patient Survey Measures
HCAHPS Measures
Nurses always communicated well.
Doctor always communicated well.
Patients always received help as soon as they wanted.
Patient’s pain was always well controlled.
Patient’s staff always explained about medicines.
Room and bathroom were always clean.
Room was always quiet at night.
Patients were given information about recovery at home.
Hospital received rating of 9 or 10.
Patients would definitely recommend the hospital.
Outpatient Imaging Efficiency. The outpatient imaging efficiency measures were
refreshed in June 2011 and covered a collection period from January 2009 through December
2010. Outpatient imaging efficiency measures were reported as percentages and composed of the
following measures in Table 11.
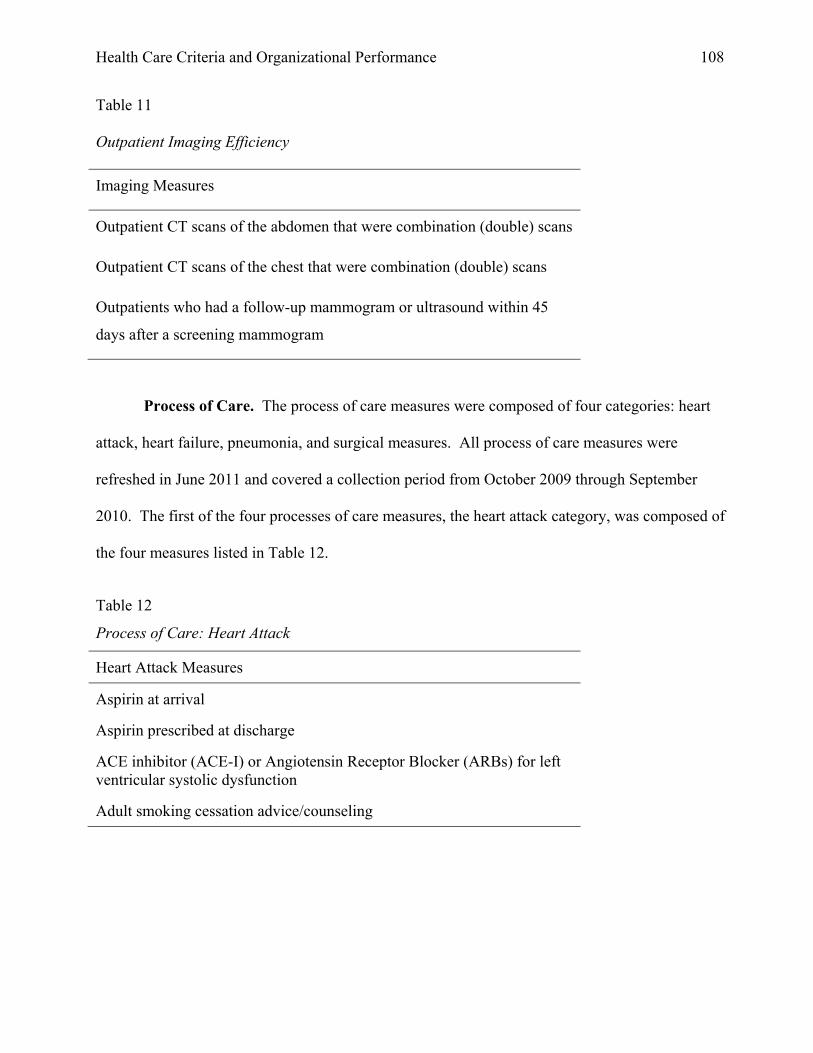
Health Care Criteria and Organizational Performance 108
Table 11
Outpatient Imaging Efficiency
Imaging Measures
Outpatient CT scans of the abdomen that were combination (double) scans
Outpatient CT scans of the chest that were combination (double) scans
Outpatients who had a follow-up mammogram or ultrasound within 45
days after a screening mammogram
Process of Care. The process of care measures were composed of four categories: heart
attack, heart failure, pneumonia, and surgical measures. All process of care measures were
refreshed in June 2011 and covered a collection period from October 2009 through September
2010. The first of the four processes of care measures, the heart attack category, was composed of
the four measures listed in Table 12.
Table 12
Process of Care: Heart Attack
Heart Attack Measures
Aspirin at arrival
Aspirin prescribed at discharge
ACE inhibitor (ACE-I) or Angiotensin Receptor Blocker (ARBs) for left ventricular systolic dysfunction
Adult smoking cessation advice/counseling

Health Care Criteria and Organizational Performance 109
The second category, heart failure, was composed of the following four measures in Table 13.
Table 13
Process of Care: Heart Failure
Heart Failure Measures
Evaluation of left ventricular systolic function
Given ACE inhibitor (ACE-I) or Angiotensin Receptor Blocker (ARB) for left ventricular systolic dysfunction
Given discharge instructions
Adult smoking cessation advice/counseling
The pneumonia category was composed of the following six measures in Table 14.
Table 14
Process of Care: Pneumonia
Pneumonia Measures
Patients initial antibiotics within 6 hours of arrival
Patients initial ER blood culture prior to first antibiotics
Patients given smoking cessation counseling
Patients given most appropriate initial antibiotic
Patients given influenza vaccination
Percent patients given pneumococcal vaccination
Surgical Care Improvement Project. The last of the four processes of care measures is
the surgical care improvement project (SCIP) measures category, which was composed of the
following nine measures in Table 15. All process of care measures were ratio data and reported on
patient rates.

Health Care Criteria and Organizational Performance 110
Table 15.
Process of Care: Surgical Care Improvement Project Measures
Surgical Measures
Antibiotic given at right time, 1 hour before surgery
Preventive antibiotics stopped at right time within 24 hours after surgery
Surgery patients given right kind of antibiotic
Treatment within 24 hours to help to prevent blood clots
Surgery patients receive treatment to prevent blood clots
Patients needing hair removed from surgical area
Patients’ urinary catheters removed on first or second day
Patients taking beta blockers were kept on them
Outpatients received antibiotic at right time, 1 hour before surgery
Outcome of Care. The outcome of care measures were refreshed in June 2011 and
covered collection period from July 2007 through June 2010. The outcome of care measures were
composed of the following five measures listed in Table 16.
Table 16
Outcome of Care Measures
Outcome Measures
Heart attack death rates (30-day mortality)
Heart attack readmission rates
Heart failure death rates (30-day mortality)
Heart failure readmission rates
Pneumonia death rates (30-day mortality)

Health Care Criteria and Organizational Performance 111
Outcome of care measures were ratio data and reported as patient rates. For mortality and
readmission rates, CMS provides estimates of confidence intervals of 30-day risk-adjusted
outcomes. The estimates were weighted to account for variance differences between hospitals, as
follows: 30-day mortality rate weight = 1/(standard error 30-day mortality rate)^2, where the
standard error of 30-day mortality rate = (upper C.I. – lower C.I.)/(1.96*2). This methodology was
used by Heidenreich et al. (2012) in their study of heart failure process of care and outcome of care
for hospitalized Medicare patients.
Power and Sample Size Analysis.
In this section, a strategy to understand Type I and Type II error was addressed. Effect size
in a population is linked to three other statistical properties: (1) sample size, (2) probability level at
which statistical significance is accepted (alpha level = 0.05), and (3) the ability of a test to detect
an effect (power). A statistical power of 80% and a Type I error of .05 was desired for this study.
This study had a predetermined sample size based on availability (n=187). The following equation
was used to calculate power for comparing the means of two normally distributed samples using a
one-sided test:
Power = Φ [ -Z1-α + ∆ / √ (σ21 / n1 + σ2
2 / n2 )] (Rosner, 2006, p. 333)
Given a predetermined sample size of n1 = 34 for the HCPE hospitals and n2 = 153 for non-HCPE
hospitals and an alpha level of .05, a power analysis varying the ∆ and σ2 produced Table 17.

Health Care Criteria and Organizational Performance 112
Table 17
Power- Sensitivity Analysis
σ21 Σ2
2 ∆ Power (percent)
0.7 0.8 3 100
0.7 0.8 2 100
0.7 0.8 1 99
0.7 0.8 0.5 97
0.7 0.8 0.3 71
5 11 5 99
5 11 4 94.
5 11 3 78
5 11 2 48
Various scenarios were used during the power analysis. The variation (σ) and the mean
differences percentage (∆) were changed from low to high values. Table 17 provides an example.
Sufficient power at low to medium levels of variations with the associated mean value difference
was identified. The power analysis determined there is adequate power to detect difference
between the means of comparison groups under a variety of conditions except the extremes.
Statistical Analysis Plan
This research is a quantitative analysis. The following is a list of proposed steps:
First, a power and sample size analysis was performed to understand Type I and Type II
error. Effect size in a population is linked to three other statistical properties: (1) sample size, (2)
probability level with accepted statistical significance α (alpha), and (3) the ability to detect an
effect (power).

Health Care Criteria and Organizational Performance 113
Second, frequencies and percentages were reported for categorical variables, while means,
medians, and standard deviations were reported for continuous variables.
Third, tests of underlying assumptions were performed, as indicated by statistical analyses
used in the study. These included tests for normality and homogeneity of variance.
Fourth a series of univariate hypothesis tests was performed, which compared HCPE and
non-HCPE hospitals, using Pearson’s Chi-square or Fisher’s Exact test for categorical variables.
The null hypothesis for the Pearson’s Chi-square or Fisher’s Exact test was H0: p HCPE = p non-HCPE
and the alternative hypothesis was Ha: p HCPE ≠ p non-HCPE. To assess group differences of
continuous variables, the t-test was used and the null hypothesis was H0: µ HCPE = µ non-HCPE.
Likewise, the alternative hypothesis was Ha: µ HCPE > µ non-HCPE or Ha: µ HCPE < µ non-HCPE,
depending on whether the higher value of the outcome was favorable or unfavorable. For
example, a higher HCAHPS hospital experience patient survey measures performance was
favorable, while a lower outcome mortality rate was favorable. To reduce the probability of Type
I error, the Bonferroni correction was used with an alpha value equal to .05 to evaluate all
hypotheses, except in cases when several dependent or independent statistical tests were performed
simultaneously on a single data set (Rosner, 2006).
Fifth, non-parametric generalized linear models (GENLIN) were used to compare HCPE
and non-HCPE hospitals and the effect of organizational characteristics such as religious affiliation
and hospital systems. In particular, the effect of HCPE on the likelihood of a patient
recommending the hospital, while accounting for organizational characteristics was evaluated.

Health Care Criteria and Organizational Performance 114
Chapter 5: Specific Findings and Results
This chapter presents the analysis and results of the study’s independent variable of the 34
HCPE and 153 non-HCPE hospitals and the four groups of 42 dependent variables: (1) HCAHPS
hospital experience patient survey measures performance; (2) outpatient imaging efficiency; (3)
process of care measures performance for heart attack, heart failure, pneumonia, and performance
surgical care improvement project (SCIP) process measures; and (4) outcome of care measures
performance. All the following tables present mean value comparisons where higher mean values
are preferred, except for Table 24, the outcome of care measures, where lower means values are
better. Of the 42 CMS measures in the 4 different CMS measure groups analyzed in the study,
there was a statically significant difference in 9 of the 10 HCAHPS patient survey measures (Table
18) and in 1 of the 9 surgical care improvement project process measures (Table 23). Although
not statistically significantly, HCPE hospitals had higher mean values representing higher
performance than the non-HCPE hospitals in 38 of the 42 (90%) of the study measures. For
most of the measures there was little difference between the means values and little variation, and
most of the values were at the extremes, which were in the 98% to 99% range.
Performance results comparing HCPE hospitals to non-HCPE hospitals using the 10 CMS
measures of patients’ satisfaction are listed in Table 18. Hospitals using the HCPE had higher
means and 8 of the 10 measures had lower standard deviations than the non-HCPE hospitals,
although these numbers are not statistically significant. All differences were statistically
significantly at α < .05, but after applying the Bonferroni correction of α*< .001, the HCAHPS
hospital experience measures were significant except for “Doctor always communicated well.” As
a group, these were the most significant findings in the study.

Health Care Criteria and Organizational Performance 115
The Bonferroni correction is an adjustment made to p values when several dependent or
independent statistical tests are performed simultaneously on a single data set.
Table 18
HCAHPS Hospital Experience Patient Survey Measures Results
HCAHPS Measures HCPE non-HCPE p-value
N=34
n=32
N=153
n=150
Nurses always communicated well 79.03 (3.21) 74.64 (5.10) .000
Doctor always communicated well 80.00 (3.41) 78.36 (3.58) .025
Patients always received help soon as desired 66.50 (5.45) 60.22 (6.21) .000
Patients’ pain was always well controlled 71.97 (2.91) 68.03 (4.31) .000
Patients’ staff always explained medicines 62.56 (3.92) 58.71 (5.13) .000
Room and bathroom were always clean 73.34 (5.93) 67.87 (5.81) .000
Room was always quiet at might 58.78 (7.47) 54.25 (6.82) .000
Patients were given information about recovery at home
84.56 (2.75) 81.79 (4.14) .000
Hospital rating of 9 or 10 73.22 (6.44) 65.67 (7.80) .000
Patients would definitely recommend hospital 75.75 (7.28) 68.37 (8.78) .000
Note. Data are given as number (percentage) or mean +/- SD. Wilcoxon rank-sum test is use for continuous variables. Bonferroni correction α* < .001. Table 19 lists outpatient imaging efficiency results. There were no statistically significant
differences between the hospitals using the HCPE and the non-HCPE hospitals. There were little
face-level differences between the values of the means among the three measures: the CT scans of
the abdomen (absolute difference of 0.013%), CT scans of the chest (absolute difference of
0.003%), and follow-up mammogram or ultrasound measure (absolute difference of 0.15%).
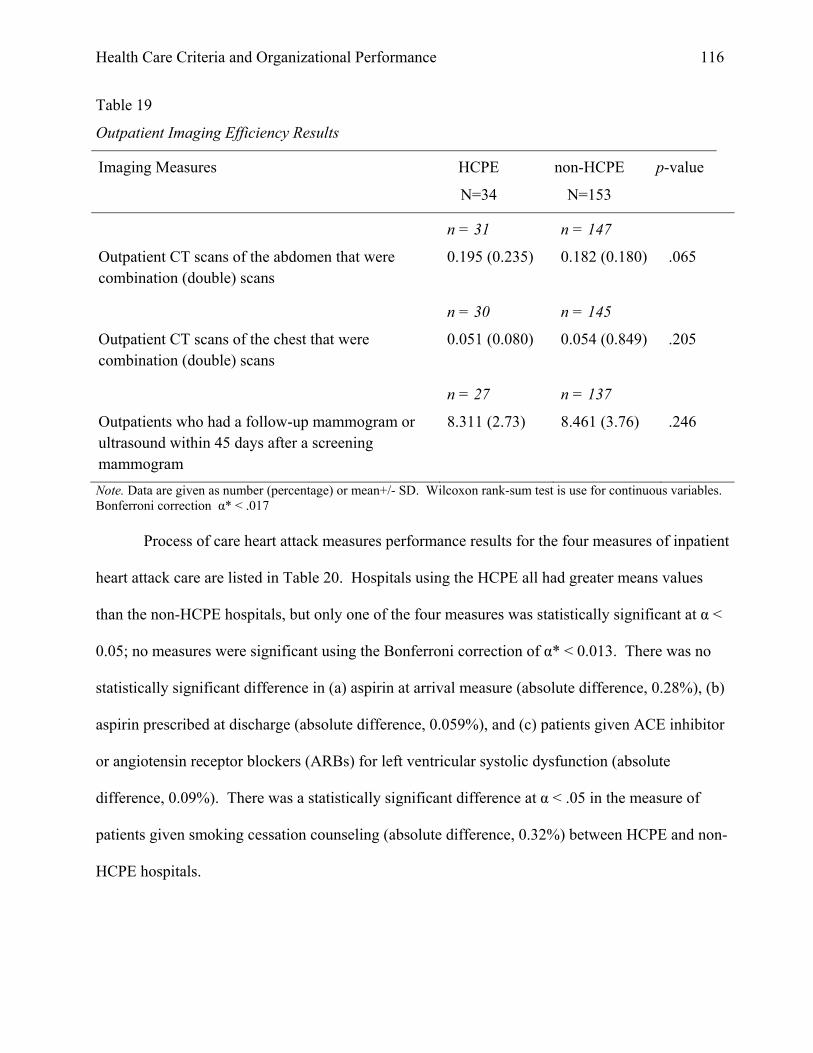
Health Care Criteria and Organizational Performance 116
Table 19
Outpatient Imaging Efficiency Results
Imaging Measures HCPE
N=34
non-HCPE
N=153
p-value
Outpatient CT scans of the abdomen that were combination (double) scans
n = 31
0.195 (0.235)
n = 147
0.182 (0.180)
.065
Outpatient CT scans of the chest that were combination (double) scans
n = 30
0.051 (0.080)
n = 145
0.054 (0.849)
.205
Outpatients who had a follow-up mammogram or ultrasound within 45 days after a screening mammogram
n = 27
8.311 (2.73)
n = 137
8.461 (3.76)
.246
Note. Data are given as number (percentage) or mean+/- SD. Wilcoxon rank-sum test is use for continuous variables. Bonferroni correction α* < .017 Process of care heart attack measures performance results for the four measures of inpatient
heart attack care are listed in Table 20. Hospitals using the HCPE all had greater means values
than the non-HCPE hospitals, but only one of the four measures was statistically significant at α <
0.05; no measures were significant using the Bonferroni correction of α* < 0.013. There was no
statistically significant difference in (a) aspirin at arrival measure (absolute difference, 0.28%), (b)
aspirin prescribed at discharge (absolute difference, 0.059%), and (c) patients given ACE inhibitor
or angiotensin receptor blockers (ARBs) for left ventricular systolic dysfunction (absolute
difference, 0.09%). There was a statistically significant difference at α < .05 in the measure of
patients given smoking cessation counseling (absolute difference, 0.32%) between HCPE and non-
HCPE hospitals.

Health Care Criteria and Organizational Performance 117
Table 20
Process of Care: Heart Attack Results
Heart Attack Measures HCPE
N=34
non-HCPE
N=153
p-value
Aspirin at arrival
n = 31
99.06 (1.63)
n =148
98.78 (2.30)
.286
Aspirin prescribed at discharge
n = 31
97.87 (7.17)
n =147
98.46 (2.99)
.394
Given ACE inhibitor (ACE-I) or angiotensin receptor blockers (ARBs) for left ventricular systolic dysfunction
n = 30
97.13 (4.40)
n = 140
97.04 (6.14)
.341
Adult smoking cessation advice/counseling
n = 30
99.77 (1.28)
n = 139
99.45 (1.69)
.047
Note. Data are given as number (percentage) or mean+/- SD. Wilcoxon rank-sum test is use for continuous variables. Bonferroni correction α* < .013.
Process of care heart failure measures performance results for the four measures of
inpatient heart failure care are listed in Table 21. Hospitals using the HCPE had higher mean
values than the non-HCPE hospitals in all measures, and two of the four measures were
statistically significant at α < 0.05 but not statistically significant using the Bonferroni correction
of α*< 0.013. There was no statistically significant difference in the four areas: (a) left ventricular
ejection fraction (LVEF) (absolute difference, 0.46%), (b) patients given ACE inhibitor or
angiotensin receptor blockers (ARBs) for left ventricular systolic dysfunction (absolute difference,
1.02%), (c) patients given discharge instructions (absolute difference, 4.72%), and (d) patients
receiving smoking cessation counseling (absolute difference, 1.32%).
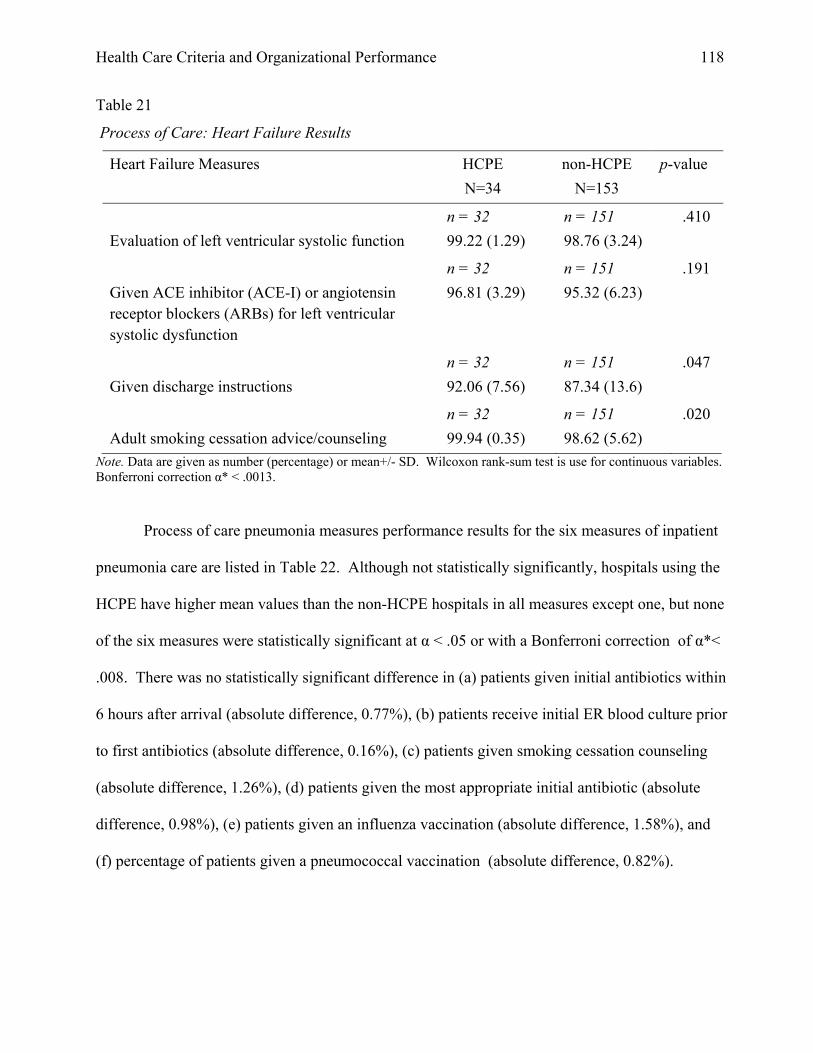
Health Care Criteria and Organizational Performance 118
Table 21
Process of Care: Heart Failure Results
Heart Failure Measures HCPE
N=34
non-HCPE
N=153
p-value
Evaluation of left ventricular systolic function
n = 32
99.22 (1.29)
n = 151
98.76 (3.24)
.410
Given ACE inhibitor (ACE-I) or angiotensin receptor blockers (ARBs) for left ventricular systolic dysfunction
n = 32
96.81 (3.29)
n = 151
95.32 (6.23)
.191
Given discharge instructions
n = 32
92.06 (7.56)
n = 151
87.34 (13.6)
.047
Adult smoking cessation advice/counseling
n = 32
99.94 (0.35)
n = 151
98.62 (5.62)
.020
Note. Data are given as number (percentage) or mean+/- SD. Wilcoxon rank-sum test is use for continuous variables. Bonferroni correction α* < .0013.
Process of care pneumonia measures performance results for the six measures of inpatient
pneumonia care are listed in Table 22. Although not statistically significantly, hospitals using the
HCPE have higher mean values than the non-HCPE hospitals in all measures except one, but none
of the six measures were statistically significant at α < .05 or with a Bonferroni correction of α*<
.008. There was no statistically significant difference in (a) patients given initial antibiotics within
6 hours after arrival (absolute difference, 0.77%), (b) patients receive initial ER blood culture prior
to first antibiotics (absolute difference, 0.16%), (c) patients given smoking cessation counseling
(absolute difference, 1.26%), (d) patients given the most appropriate initial antibiotic (absolute
difference, 0.98%), (e) patients given an influenza vaccination (absolute difference, 1.58%), and
(f) percentage of patients given a pneumococcal vaccination (absolute difference, 0.82%).
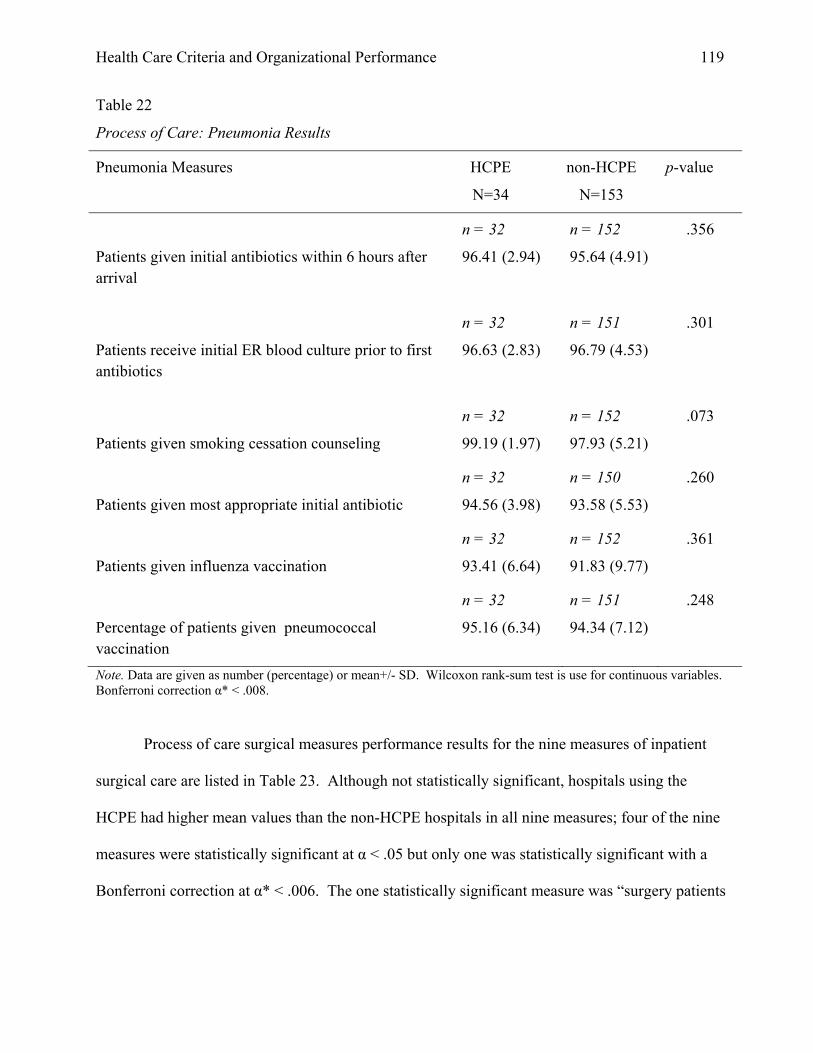
Health Care Criteria and Organizational Performance 119
Table 22
Process of Care: Pneumonia Results
Pneumonia Measures HCPE
N=34
non-HCPE
N=153
p-value
Patients given initial antibiotics within 6 hours after arrival
n = 32
96.41 (2.94)
n = 152
95.64 (4.91)
.356
Patients receive initial ER blood culture prior to first antibiotics
n = 32
96.63 (2.83)
n = 151
96.79 (4.53)
.301
Patients given smoking cessation counseling
n = 32
99.19 (1.97)
n = 152
97.93 (5.21)
.073
Patients given most appropriate initial antibiotic
n = 32
94.56 (3.98)
n = 150
93.58 (5.53)
.260
Patients given influenza vaccination
n = 32
93.41 (6.64)
n = 152
91.83 (9.77)
.361
Percentage of patients given pneumococcal vaccination
n = 32
95.16 (6.34)
n = 151
94.34 (7.12)
.248
Note. Data are given as number (percentage) or mean+/- SD. Wilcoxon rank-sum test is use for continuous variables. Bonferroni correction α* < .008.
Process of care surgical measures performance results for the nine measures of inpatient
surgical care are listed in Table 23. Although not statistically significant, hospitals using the
HCPE had higher mean values than the non-HCPE hospitals in all nine measures; four of the nine
measures were statistically significant at α < .05 but only one was statistically significant with a
Bonferroni correction at α* < .006. The one statistically significant measure was “surgery patients

Health Care Criteria and Organizational Performance 120
given right kind of antibiotic” (absolute difference, 1.57%). With the Bonferroni correction, the
following eight measures had no statistically significant difference: (a) antibiotic given at right
time, one hour before surgery (absolute difference, 1.64%), (b) preventive antibiotics stopped at
right time, within 24 hours (absolute difference, 1.61%), (c) treatment within 24 hours to help
prevent blood clots (absolute difference, 2.02%), (d) surgery patients provided treatment to prevent
blood clots (absolute difference, 1.65%), (e) patients needing hair removed from surgical area
(absolute difference, 0.14%), (f) patients’ urinary catheters removed on the first or second day
(absolute difference, 3.09%), (g) patients taking beta blockers were kept on them (absolute
difference, 2.96%), and (h) outpatients given antibiotic at right time, one hour before surgery
(absolute difference, 2.35%).

Health Care Criteria and Organizational Performance 121
Table 23
Process of Care: Surgical Results
Surgical Measures HCPE
N=34
non-HCPE
N=153
p-value
Antibiotic given at right time, one hour before surgery
n = 31
98.19 (1.33)
n = 150
96.55 (6.73)
.023
Preventive antibiotics stopped at right time, within 24 hours after surgery
n = 31
96.48 (2.11)
n = 150
94.87 (6.76)
.156
Surgery patients given right kind of antibiotic
n = 31
98.52 (1.02)
n = 150
96.95 (4.57)
.002
Treatment within 24 hours to help prevent blood clots
n = 31
95.19 (3.89)
n = 150
93.17 (7.59)
.105
Surgery patients received treatment to prevent blood clots
n = 31
96.54 (2.94)
n = 149
94.89 (7.08)
.253
Patients needing hair removed from surgical area
n = 31
99.81 (0.40)
n = 150
99.67 (1.40)
.044
Patients’ urinary catheters removed within the first or second day
n = 31
91.68 (6.82)
n = 150
88.59 (9.40)
.023
Patients taking beta blockers were kept on them
n = 31
96.06 (3.43)
n = 149
93.10 (7.49)
.016
Outpatients given antibiotic one hour before surgery
n = 31
94.26 (4.93)
n = 150
91.91 (11.05)
.138
Note. Data are given as number (percentage) or mean+/- SD. Wilcoxon rank-sum test is use for continuous variables. Bonferroni correction α* < .006.

Health Care Criteria and Organizational Performance 122
The results for the six measures of outcome of care performance are shown in Table 24.
Unlike all previous measures, for outcome measures, lower means are better. Although not
statistically significant, hospitals using the HCPE all have lower mean values than the non-HCPE
hospitals in six measures, but none of the measures were statistically significant (α* < .05).
Table 24
Outcome of Care Results
Outcome Measures HCPE
N=34
non-HCPE
N=153
p-value
Heart attack death rates (30-day mortality)
n = 29
14.86 (1.52)
n = 135
15.15 (1.47)
.255
Heart attack readmission rates
n = 29
19.99 (1.75)
n = 135
20.32 (1.30)
.290
Heart failure death rates (30-day mortality)
n = 29
10.62 (1.78)
n = 135
10.74 (1.60)
.237
Heart failure readmission rates
n = 29
25.20 (2.56)
n = 135
25.44 (1.89)
.367
Pneumonia death rates (30-day Mortality)
n = 29
10.96 (1.41)
n = 135
11.30 (1.61)
.231
Pneumonia readmission rates
n = 29
18.85 (1.81)
n = 135
19.25 (1.61)
.180
Note. Data are given as number (percentage) or mean+/- SD. Wilcoxon rank-sum test is use for continuous variables. Bonferroni correction α* < .0083.
Evaluation of the Relationship Between HCPE and Organizational Characteristics
The following analyses were performed using non-parametric generalized linear models
(GENLIN) in SPSS. There were two sets of models used for the following analyses, (a) an

Health Care Criteria and Organizational Performance 123
“unadjusted” model, which included only included a single HCPE vs. non-HCPE factor, and (b) an
“adjusted” model which included the characteristics of HCPE vs. non-HCPE, religious affiliation,
single or multiple hospitals to control for hospitals systems, and all 2-way interactions. The
mean values for the HCPE vs. non-HCPE and p values were reported for both models. The last
column on all the tables identifies interaction by the “In” label. In this interaction column, the
presence of a significant HCPE interaction with religious affiliation is signified by “REL” and the
effect of hospitals systems by the “SYS” label.
The analyses in this section used a generalized linear model approach in SPSS. General
(not generalized) linear models are based on the simple linear equation of
ηi = α + βi Xi1 + βi Xi1 + ….. βk Xik
where ηi = outcome variable, α = intercept, β = coefficients, and X = predictor variables. The
generalized linear model takes this same equation and adds a link function (e.g., log).
Consequently, g (the link function) is included to the equation
μi = ηi which g (μi ) = ηi = α + βi Xi1 + βi Xi1 + ….. βk Xik
A Poisson probability distribution was used to analyze the HCAHPS hospital experience
patient survey measures performance. The Poisson Model is log Yi = log(Li) + Σαk xik where X is
the outcome variable and log(Lii)=s the logarithmic link function. Σαk xik are the covariates.
A gamma distribution was used for heart attack, heart failure, pneumonia, and surgical
care improvement project (SCIP) process measures performance. Normal probability distributions
were used for outcome of care measures performance and outpatient imaging efficiency. All
probability distributions used a logarithmic-linked function. Maximum likelihood estimation for
parameters with a robust covariance matrix estimation approach was used, and the Wald
Likelihood was used for tests of model effects. Estimated marginal means are reported

Health Care Criteria and Organizational Performance 124
throughout, and sequential Bonferroni corrections at α*< .05 were used in reporting pairwise
significance levels with an alpha value equal to .05 and to evaluate all hypotheses. Other
organizational characteristics were analyzed and found to have no significance or interaction and
are not reported in this analysis. The following organizational characteristics were considered: (a)
hospital type, whether acute care or critical access, (b) for-profit or non-profit, (c) emergency
services, and (d) number of beds. However, these organizational characteristics were excluded
because there were no for-profit HCPE hospitals and no HCPE hospitals without emergency
services. The Wald χ2 values in this section will only be given for significant effects or
interactions.
Organizational Characteristics’ Effect on HCAHPS Hospital Experience Patient
Survey. Performance results comparing HCPE hospitals to non-HCPE hospitals using the 10
CMS measures of HCAHPS patient experience are listed in Table 25. In the unadjusted model, for
each of the 10 measures there was a significant effect of HCPE. The effect of HCPE was robust
throughout. HCPE hospitals scored significantly higher on all 10 HCAHPS measures. This was
also the case with the adjusted model, with the exception of the question about “doctors always
communicating well.” For that particular question, there was not a significant effect of HCPE
(Wald χ2 = 3.39, p > .05) when other variables of interest were included in the model.
In addition to the robust HCPE effects throughout the adjusted model, 3 of the 10 patient
experience measures indicated a main effect of system. These three were “room was always quiet
at night” (Wald χ2 = 5.41, p < .05); “patients were given information about recovery at home”
(Wald χ2 = 6.52, p < .05); and “patients would definitely recommend the hospital” (Wald χ2 = 4.44,
p < .05). The importance of the variable “patients would definitely recommend the hospital” will

Health Care Criteria and Organizational Performance 125
be discussed in the next chapter because of its potential to affect hospital profitability and
sustainability.
Table 25
Organizational Characteristics’ Effect on HCAHPS Hospital Experience Patient Survey Measures
HCAHPS Measures Unadjusted means a Sig Adjusted means b Sig In
Dependent Variable HCPE non-HCPE HCPE non-HCPE
Nurses always communicated well
79.031 74.640 .001 78.089 74.789 .001
Doctor always communicated well
80.000 78.366 .013 80.666 78.662 .070
Patients always received help soon as they wanted
66.500 60.220 .000 66.562 59.931 .000
Patients’ pain was always well controlled
71.968 68.026 .000 71.955 68.106 .000
Patients’ staff always explained about medicines
62.562 58.713 .000 62.918 58.744 .000
Room and bathroom were always clean
73.343 67.866 .000 74.711 67.870 .000
Room was always quiet at might
58.781 54.253 .001 60.171 54.927 .002
Patients were given information about recovery at home
84.562 81.793 .000 83.588 81.791 .008
Hospital rating of 9 or 10 73.218 65.673 .000 75.259 65.981 .000
Patients would definitely recommend the hospital
75.750 68.373 .000 78.373 68.4315 .000
Note. Bonferroni corrections at α*< 0.05. Unadjusted model a includes HCPE variables. Adjusted model b includes HCPE, religious affiliation, single or multiple hospitals to control for hospitals systems, and all 2-way interactions.

Health Care Criteria and Organizational Performance 126
Figure 14
Mean Score for “Patients Would Definitely Recommend Hospital”
Organizational Characteristics’ Effect on Outpatient Imaging Efficiency Results.
There were no statistically significant effects of HCPE in the unadjusted or adjusted models for all
three measures. For “Outpatient CT scans of the abdomen that were combination (double) scans,”
there was a significant interaction of religious affiliation and HCPE. Religiously affiliated
hospitals that used the HCPE had a higher marginal mean when compared to non-religiously
affiliated HCPE hospitals. Interestingly, there was a drop in performance for non-religiously
affiliated HCPE hospitals, where they performed lower than non-HCPE hospitals.
For “Outpatient CT scans of the abdomen that were combination (double) scans,” there was
a main effect by religion (mean difference of .014, Wald χ2 = 6.49, p < .05), with religiously
affiliated hospitals having a higher mean percentage. There was also a religion by HCPE
interaction (Wald χ2 = 12.15, p < .05). Although the result for this measure for hospitals using
HCPE was not significant, religiously affiliated hospitals that used the HCPE had a much higher

Health Care Criteria and Organizational Performance 127
marginal mean (.303) when compared to non-religiously affiliated HCPE hospitals (.0805).
Likewise, religiously affiliated hospitals that were non-HCPE had a lower marginal mean (.170)
when compared to non-religiously affiliated non-HCPE hospitals (.188). There was no significant
effect of HCPE in the unadjusted model with “Outpatient CT scans of the chest that was
combination (double) scans” (absolute difference, 0.002%) or in the adjusted model. There was an
interaction between system and religiously affiliated hospitals (Wald χ2 = 7.51, p < .05).
Religiously affiliated hospitals that were part of a system had a higher marginal mean (.081) when
compared to religiously affiliated hospitals that were not part of a system (.024). In contrast, non-
religiously affiliated hospitals that were part of a system had a lower marginal mean (.0317) than
the non-system hospitals (.170). The organizational characteristics’ effects on outpatient imaging
efficiency results are listed on Table 26.
Table 26
Organizational Characteristics’ Effect on Outpatient Imaging Efficiency Results
Imaging Measures Unadjusted means a Sig Adjusted means b Sig In
Dependent Variable HCPE non-HCPE HCPE non-HCPE
Outpatient CT scans of the abdomen that were combination (double) scans
.1953 .1824 .770 .1563 .1793 .620 SYS
Outpatient CT scans of the chest that were combination (double) scans
.0513 .0536 .885 .0292 .0494 .042
Outpatients who had a follow-up mammogram or ultrasound within 45 days after a screening mammogram
8.3111 8.4613 .804 8.2302 8.4297 .882
Note. Bonferroni corrections at α*< .05. Unadjusted model a includes HCPE variables. Adjusted model b includes HCPE, religious affiliation, single or multiple hospitals to control for hospitals systems, and all 2-way interactions. SYS indicates the presence of a significant system by HCPE interaction.

Health Care Criteria and Organizational Performance 128
Organizational Characteristics’ Effect on Process of Care: Heart Attack Results.
There were no significant effects of HCPE in the unadjusted model or adjusted model in the
performance results of the four process of care heart attack measures. Religious affiliation did
interact with HCPE on two of the four measures. Religiously affiliated hospitals that used the
HCPE had a higher marginal mean when compared to non-religiously affiliated HCPE hospitals,
and religiously affiliated hospitals that were non-HCPE had lower marginal means when compared
to non-religiously affiliated non-HCPE hospitals.
There was no significant effect of HCPE in the unadjusted model with “Aspirin at arrival”
(absolute difference, 0.287%) or in the adjusted model (absolute difference, 0.375%). There was
an interaction between HCPE and religious affiliation interaction (p = .028, Wald χ2 = 4.80, p <
.05). Religiously affiliated hospitals that used the HCPE had a higher marginal mean (99.691)
when compared to non-religiously affiliated HCPE hospitals (98.427). In contrast, religiously
affiliated hospitals that were non-HCPE had a slightly lower marginal mean (98.406) when
compared to non-religiously affiliated non-HCPE hospitals (98.958).
There was no effect of HCPE in the unadjusted model with “Given ACE inhibitor (ACE-I)
or angiotensin receptor blocker (ARB) for left ventricular systolic dysfunction” (absolute
difference, 0.090%) or in the adjusted model (absolute difference, 0.327%). There was a religious
affiliation and HCPE interaction (p = .028, Wald χ2 = 4.81, p < .05). Religiously affiliated
hospitals that used the HCPE had higher marginal means (98.917) when compared to non-
religiously affiliated HCPE hospitals (95.15). In contrast, religiously affiliated hospitals that were
non-HCPE had a lower marginal mean (95.785) when compared to non-religiously affiliated non-
HCPE hospitals (97.606). The organizational characteristics’ effect on the process of care heart
attack results are listed in Table 27.
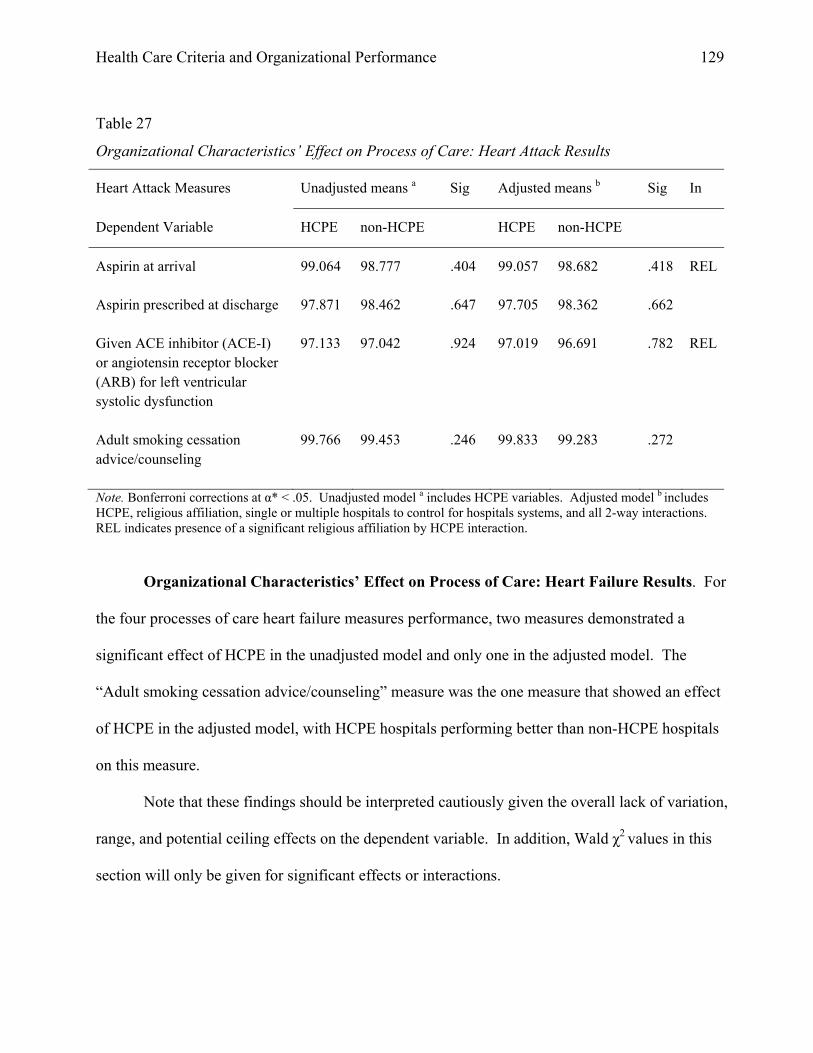
Health Care Criteria and Organizational Performance 129
Table 27
Organizational Characteristics’ Effect on Process of Care: Heart Attack Results
Heart Attack Measures Unadjusted means a Sig Adjusted means b Sig In
Dependent Variable HCPE non-HCPE HCPE non-HCPE
Aspirin at arrival 99.064 98.777 .404 99.057 98.682 .418 REL
Aspirin prescribed at discharge 97.871 98.462 .647 97.705 98.362 .662
Given ACE inhibitor (ACE-I) or angiotensin receptor blocker (ARB) for left ventricular systolic dysfunction
97.133 97.042 .924 97.019 96.691 .782 REL
Adult smoking cessation advice/counseling
99.766 99.453 .246 99.833 99.283 .272
Note. Bonferroni corrections at α* < .05. Unadjusted model a includes HCPE variables. Adjusted model b includes HCPE, religious affiliation, single or multiple hospitals to control for hospitals systems, and all 2-way interactions. REL indicates presence of a significant religious affiliation by HCPE interaction.
Organizational Characteristics’ Effect on Process of Care: Heart Failure Results. For
the four processes of care heart failure measures performance, two measures demonstrated a
significant effect of HCPE in the unadjusted model and only one in the adjusted model. The
“Adult smoking cessation advice/counseling” measure was the one measure that showed an effect
of HCPE in the adjusted model, with HCPE hospitals performing better than non-HCPE hospitals
on this measure.
Note that these findings should be interpreted cautiously given the overall lack of variation,
range, and potential ceiling effects on the dependent variable. In addition, Wald χ2 values in this
section will only be given for significant effects or interactions.

Health Care Criteria and Organizational Performance 130
There was not a significant effect of HCPE in the unadjusted model with “Evaluation of
left ventricular systolic function” (absolute difference, 0.4638%) or in the adjusted model (absolute
difference, 0.210%). There was a significant effect of religious affiliation (mean difference .658,
Wald χ2 = 4.24, p < .05). Religiously affiliated hospitals that used the HCPE had a higher marginal
mean (99.123) when compared to non-religiously affiliated HCPE hospitals (98.465).
There was a borderline effect of HCPE in the unadjusted model with “Given ACE inhibitor
(ACE-I) or angiotensin receptor blocker (ARB) for left ventricular systolic dysfunction” (absolute
difference, 1.494%, Wald χ2 = 3.84, p = .05), but there was no significant effect in the adjusted
model (absolute difference, 1.051%). There was a significant effect of HCPE in the unadjusted
model with “Given discharge instructions” (absolute difference, 4.724%, Wald χ2 = 7.64, p < .05),
but not in the adjusted model (absolute difference, 0.269%). There was a significant effect of
HCPE in the unadjusted model with “Adult smoking cessation advice/counseling” (absolute
difference, 1.315%, Wald χ2 = 8.10, p < .05), and in the adjusted model (absolute difference,
1.432%, Wald χ2 = 4.25, p < .05). The organizational characteristics’ effect on the process of care
heart failure results are listed in Table 28.

Health Care Criteria and Organizational Performance 131
Table 28
Organizational Characteristics’ Effect on Process of Care: Heart Failure Results
Heart Failure Measures Unadjusted means a Sig Adjusted means b Sig In
Dependent Variable HCPE non-HCPE HCPE non-HCPE
Evaluation of left ventricular systolic function
99.218 98.755 .179 98.688 98.899 .754
Given ACE inhibitor (ACE-I) or angiotensin receptor blocker (ARB) for left ventricular systolic dysfunction
96.812 95.317 .050 96.311 95.259 .351
Given discharge instructions 92.062 87.337 .006 87.154 87.424 .947
Adult smoking cessation advice/counseling
99.937 98.622 .004 99.899 98.641 .039
Note. Bonferroni corrections at α* < .05. Unadjusted model a includes HCPE variables. Adjusted model b includes HCPE, religious affiliation, single or multiple hospitals to control for hospitals systems, and all 2-way interactions.
Organizational Characteristics’ Effect on Process of Care: Pneumonia Results. There
was one significant effect of HCPE in the unadjusted model, “Patients given smoking cessation
counseling,” with HCPE hospitals performing better than non-HCPE hospitals, and no significant
effect in the adjusted model in the six process of care pneumonia measures performance results.
There was a significant system by HCPE interaction. Hospitals that were part of a system and
used the HCPE had a higher marginal mean when compared to hospitals using HCPE that were not
part of a system. Likewise, non-HCPE hospitals that were part of a system had a lower marginal
mean than the non-system hospitals.
There was a significant effect of HCPE in the unadjusted model with “Patients given
smoking cessation counseling” (absolute difference, 1.253%, Wald χ2 = 5.30, p < .05), but not in

Health Care Criteria and Organizational Performance 132
the adjusted model (absolute difference, 0.666%). In addition, there was a significant system by
HCPE interaction (Wald χ2 = 4.22, p < .05). Hospitals that were part of a system and used the
HCPE had a higher marginal mean (99.592) when compared to hospitals using HCPE that were
not part of a system (95.070). In contrast, non-HCPE hospitals that were part of a system had only
a slightly lower marginal mean (97.642) than the non-HCPE non-system hospitals (98.303).
There was no significant effect of HCPE in the unadjusted model with “Patients given most
appropriate initial antibiotic” (absolute difference, 0.975%) or in the adjusted model (absolute
difference, .450%). There was an interaction between system and religiously affiliated hospitals
(Wald χ2 = 5.61, p < .05). Religiously affiliated hospitals that were part of a system had a lower
marginal mean (93.905) when compared to religiously affiliated hospitals that were not part of a
system (95.710). In contrast, non-religiously affiliated hospitals that were part of a system had a
higher marginal mean (94.347) than the non-system hospital mean (91.956).
Process of care pneumonia measures performance results for the six measures of inpatient
pneumonia are listed in Table 29.

Health Care Criteria and Organizational Performance 133
Table 29
Organizational Characteristics’ Effect on Process of Care: Pneumonia Results
Pneumonia Measures Unadjusted means a Sig Adjusted means b Sig In
Dependent Variable HCPE non-HCPE HCPE non-HCPE
Patients receive initial antibiotics within 6 hours of arrival
96.406 95.644 .239 97.100 95.946 .067
Patients’ initial ER blood culture prior to first antibiotics
96.625 96.794 .728 96.705 97.067 .447
Patients given smoking cessation counseling
99.187 97.934 .021 97.305 97.972 .588 SYS
Patients given most appropriate initial antibiotic
94.562 93.586 .238 94.195 93.745 .617
Patients given influenza vaccination
93.406 91.934 .293 93.654 92.676 .533
Percent patients given pneumococcal vaccination
95.156 94.344 .514 95.004 94.707 .822
Note. Bonferroni corrections at α* < .05. Unadjusted model a includes HCPE variables. Adjusted model b includes HCPE, religious affiliation, single or multiple hospitals to control for hospitals systems, and all 2-way interactions. SYS indicates the presence of a significant system by HCPE interaction.
Organizational Characteristics’ Effect on Process of Care: Surgical Results. There
was a strong HCPE effect in many cases. A significant HCPE effect was present in the unadjusted
model with “Antibiotic given at right time, one hour before surgery” (absolute difference,
1.6469%, Wald χ2 = 7.55, p < .05), and in the adjusted model (absolute difference, 1.1668%, Wald
χ2 = 6.91, p < .05). There was a significant effect of HCPE in the unadjusted model with
“Preventive antibiotics stopped at right time within 24 hours” (absolute difference, 1.6105%, Wald
χ2 = 5.83, p < .05), but not in the adjusted model.

Health Care Criteria and Organizational Performance 134
There was a significant effect of HCPE in the unadjusted model with “Surgery patients
given right kind of antibiotic” (absolute difference, 1.5695%, Wald χ2 = 14.26, p < .05), and in the
adjusted model (absolute difference, 1.4846%, Wald χ2 = 10.92, p < .05). There was the presence
of a significant religious affiliation by HCPE interaction (Wald χ2 = 7.54, p < .05). This interaction
was driven by an increase in performance of religiously affiliated HCPE hospitals over non-
religiously affiliated HCPE hospitals (marginal means = 99.21 and 97.47, respectively).
There was a significant effect of HCPE in the unadjusted model with “Treatment within 24
hours to help prevent blood clots” (absolute difference, 2.026%, Wald χ2 = 4.82, p < .05), but not
in the adjusted model. There was a significant HCPE effect in the unadjusted model with “Surgery
patients receive treatment to prevent blood clots” (absolute difference, 1.6558%, Wald χ2 = 4.53, p
< .05), but not in the adjusted model. There was a significant effect of HCPE in the unadjusted
model with “Patients’ urinary catheters removed on the first of second day” (absolute difference,
3.0841%, Wald χ2 = 4.73, p < .05), but not in the adjusted model.
There was a statistically significant difference in the unadjusted model with “Patients
taking beta blockers were kept on them” (absolute difference, 2.9571%, Wald χ2 = 11.84, p < .05),
but not in the adjusted model. In addition, there was a significant religion by HCPE interaction
(Wald χ2 = 5.53, p < .05). Religiously affiliated hospitals that used the HCPE had a higher
marginal mean (97.551) when compared to non-religiously affiliated HCPE hospitals (93.395). In
contrast, religiously affiliated hospitals that were non-HCPE had a similar marginal mean (93.076)
when compared to non-religiously affiliated non-HCPE hospitals (93.059). Process of care
surgical measures performance results for the nine measures of inpatient surgical care are listed in
Table 30.

Health Care Criteria and Organizational Performance 135
Table 30
Organizational Characteristics’ Effect on Process of Care: Surgical Results
Surgical Measures Unadjusted means a Sig Adjusted means b Sig In
Dependent Variable HCPE non-HCPE HCPE non-HCPE
Antibiotic given at right time, one hour before surgery
98.193 96.546 .006 97.866 96.699 .009
Preventive antibiotics stopped at right time, within 24 hours after surgery
96.483 94.8733 .015 96.524 94.541 .140
Surgery patients given right kind of antibiotic
98.516 96.946 .000 98.335 96.8507 .001 REL
Treatment within 24 hours to help prevent blood clots
95.193 93.166 .028 92.554 93.250 .719
Surgery patients receive treatment to prevent blood clots
96.548 94.892 .038 94.730 95.240 .734
Patients needing hair removed from surgical area
99.806 99.673 .322 99.949 99.6962 .140
Patients’ urinary catheters removed on first or second day
91.677 88.593 .031 88.902 88.1444 .817
Patients taking beta blockers were kept on them
96.064 93.107 .001 95.450 93.067 .106 REL
Outpatients received antibiotic at right time, 1 hour before surgery
94.258 91.906 .061 92.491 92.403 .952
Note. Bonferroni corrections at α*< .05. Unadjusted model a includes HCPE variables. Adjusted model b includes HCPE, religious affiliation, single or multiple hospitals to control for hospitals systems, and all 2-way interactions. REL indicates presence of a significant religion by HCPE interaction.
Organizational Characteristics’ Effect on Outcome of Care Results. Unlike all the
previous performance measures, lower mean values are better for the six outcome of care
measures. There were no statistically significant differences in the means of six outcomes of care
measures unadjusted models. However, five of the six adjusted models were statistically

Health Care Criteria and Organizational Performance 136
significant, and each measure exhibited a strong system effect. This system effect was consistent
in all five measures, which concluded HCPE hospitals that were not part of a system
performed better.
There was not a significant HCPE effect in the unadjusted model with “Heart attack death
rates (30-day mortality)” (absolute difference, 0.0126%), but there was a statistically significant
difference in the adjusted model (absolute difference, 0.0902%, Wald χ2 = 5.79, p < .05). In
addition, there was a significant system main effect (mean difference .1456, Wald χ2 = 27.59, p <
.05), with hospitals that are part of the system having higher means. There was also presence of a
significant system by HCPE interaction (Wald χ2 = 6.50, p < .05). Hospitals that used the HCPE
and were part of a system had a higher marginal mean (.4584) when compared to non-system-
affiliated HCPE hospitals (.2425). In contrast, system hospitals that were non-HCPE had a higher
marginal mean (.4529) when compared to non-system non-HCPE hospitals (.3963), but less of a
difference. Based on these results, HCPE hospitals that were not part of a system performed
better.
There was no significant HCPE effect in the unadjusted model with “Heart failure death
rates (30-day mortality)” (absolute difference, 0.0899%), but there was a significant HCPE effect
in the adjusted model (absolute difference, 0.2582%, Wald χ2 = 9.72, p < .05). In addition, there
was a significant system main effect (absolute difference 0.3166%, Wald χ2 = 11.71, p < .05), with
hospitals that are part of a system having a higher marginal mean than those who are not. There
was presence of a significant system by HCPE interaction (Wald χ2 = 5.59, p < .05). Hospitals that
used the HCPE and were part of a system had a higher marginal mean (.8025) when compared to
non-system affiliated HCPE hospitals (.4527). In contrast, system hospitals that were non-HCPE

Health Care Criteria and Organizational Performance 137
had a slightly higher marginal mean (.8825) when compared to non-system non-HCPE hospitals
(.8400). Based on these results, HCPE hospitals that were not part of a system performed better.
There was no significant HCPE effect in the unadjusted model with “Heart failure
readmission rates” (absolute difference, 0.0202%) but a significant HCPE effect in the adjusted
model (absolute difference, 0.0913%, Wald χ2 = 5.55, p < .05). There was a significant system
main effect (absolute difference 0.1168%, Wald χ2 = 13.01, p < .05), with hospitals that are part of
a system having higher marginal means than those who are not. There was presence of a trending
system by HCPE interaction (Wald χ2 = 3.61, p = .05). Hospitals that used the HCPE and were
part of a system had a much higher marginal mean (.4448) when compared to non-system-
affiliated HCPE hospitals (.2765). Similarly, system hospitals that were non-HCPE had a higher
marginal mean (.4684) when compared to non-system-affiliated non-HCPE hospitals (.4171).
Based on these results, HCPE hospitals that were not part of a system performed better.
There was no significant HCPE effect in the unadjusted model with “Pneumonia death
rates (30-day mortality)” (absolute difference, 0.0724%) but a significant effect in the adjusted
model (absolute difference, 0.1849%, Wald χ2 = 9.09, p < .05). There was a significant system
effect (absolute difference 0.1933%, Wald χ2 = 11.13, p < .05), with hospitals that are part of a
system having higher marginal means than those not part of a system. There was a presence of a
significant system by HCPE interaction. Hospitals that used the HCPE and were part of a system
had a higher marginal mean (.6902) when compared to non-system-affiliated HCPE hospitals
(.4139). In contrast, system hospitals that were non-HCPE had a higher marginal mean (.7600)
when compared to non-system non-HCPE hospitals (.6810). Based on these results, HCPE
hospitals that were not part of a system performed better.

Health Care Criteria and Organizational Performance 138
There was no significant effect of HCPE in the unadjusted model with “Pneumonia
readmission rates” (absolute difference, 0.0290%) but a significant effect in the adjusted model
(absolute difference, 0.0691%, Wald χ2 = 5.13, p < .05). There was a significant system effect
(mean difference 0.0852%, Wald χ2 = 7.56, p < .05), with hospitals that are part of a system having
higher marginal means than those not part of a system. There was not a significant system by
HCPE interaction (Wald χ2 = 2.01, p > .05), but the means have a similar trend as other measures
in this set. Hospitals that used the HCPE and were part of a system had a higher marginal mean
(.4512) when compared to non-system-affiliated HCPE hospitals (.3290). Likewise, system
hospitals that were non-HCPE had a higher marginal mean (.4754) when compared to non-system
non-HCPE hospitals (.4341). Based on these results, HCPE hospitals that were not part of a
system performed better. The organizational characteristics’ effect on outcome of care results are
listed in Table 31.

Health Care Criteria and Organizational Performance 139
Table 31
Organizational Characteristics’ Effect on Outcome of Care Results
Outcome of Care Measures Unadjusted means a Sig Adjusted means b Sig In
Dependent Variable HCPE non-HCPE HCPE non-HCPE
Heart attack death rates (30-day mortality)
.4396 .4269 .727 .3334 .4237 .013 SYS
Heart attack readmission rates .3654 .3539 .653 .3149 3490 .256
Heart failure death rates (30-day mortality)
.7782 .8680 .296 .6027 .8610 .001 SYS
Heart failure readmission rates .4329 .4531 .630 .3507 .4420 .013 SYS
Pneumonia death rates (30-day mortality)
.6649 .7373 .269 .5345 .7194 .002 SYS
Pneumonia readmission rates .4395 .4684 .335 .3852 .4543 .018 SYS
Note. Bonferroni corrections at α*< .05. Unadjusted model a includes HCPE variables. Adjusted model b includes HCPE, religious affiliation, single or multiple hospitals to control for hospitals systems, and all 2-way interactions. SYS indicates the presence of a significant system by HCPE interaction.
Summary. The evaluation of the relationship between HCPE and organizational
characteristics of religious affiliation and “single or multiple hospitals to control for hospitals
systems” using the unadjusted and adjusted models produced interesting results. There was a
religious affiliation effect with several measures: the process of care heart attack performance
(Table 27) and the process of care surgical measures performance (Table 30). For these measures,
religiously affiliated hospitals that used the HCPE had the highest mean values when compared to
non-religiously affiliated HCPE hospitals, non-HCPE hospitals, and non-religiously affiliated non-
HCPE hospitals. Process of care pneumonia measures performance (Table 29) had one out of six
measures that exhibited an interaction between religious affiliation and system affiliation. For that

Health Care Criteria and Organizational Performance 140
measure, religiously affiliated hospitals that were not part of a system had the highest mean values
compared to religiously affiliated hospitals that were part of the system, non-religiously affiliated
hospitals that were part of a system, and non-system hospitals. Finally, for the process of care
surgical measures (Table 30), five of the six adjusted models were statistically significant, and
each measure exhibited a strong system effect. Based on these results, HCPE hospitals that were
not part of a system performed better.

Health Care Criteria and Organizational Performance 141
Chapter 6: Discussion
This chapter consists of six sections. The first is a summary of the problem, purpose, and
research question. Second is a summary of the main findings. Third is a discussion of the impact
on a hospital’s financial bottom line with consideration to changes in CMS payment structure and
a review of the net promoter theory. Fourth is a discussion of the significance of the study to
health care. Fifth is a discussion of the importance of this study to health care leaders. Sixth is a
discussion of the limitations and implications of this study in the wider context of the published
literature at large.
Summary of the Problem, Purpose, and Research Question
Despite anecdotal stories and propositions related to the value of the HCPE in achieving
performance excellence in organizations, there has been limited research providing empirical
evidence of the impact of applying HCPE to improve efficiency and effectiveness specifically in
the health care industry. The field offers rich data for exploration as health care organizations
across the U.S. increasingly have been adopting a policy of using the HCPE as a business model to
improve organizational performance. Each health care application submitted to the Baldrige
Program documents organizational improvement over time with past and current performance
levels, trends in key measures or indicators, as well as competitor’s levels of performance.
The purpose of the study was to determine if there was a relationship between the use of
the HCPE as a business model and the performance of health care organizations. To accomplish
this, the study sought to answer the following research question: “Do hospitals that have received
the national Baldrige Award for Performance Excellence (HCPE) perform better than hospitals in
their geographic markets (non-HCPE) based on comparisons of the same CMS performance
measures?” This study explored the relationships between the use of the HCPE as a business

Health Care Criteria and Organizational Performance 142
model and the performance of the health care organization. In other words, the purpose of this
study was to determine if there was sufficient evidence to support the use of the Baldrige HCPE as
a business model for health care systems.
In this study, the independent variable of interest was a hospital’s use of the HCPE, and the
dependent variables were CMS performance measures. This study tested the HCPE model by
comparing health care recipients of the Baldrige Award to like competitive health care
organizations that have not used the HCPE, using the same CMS performance measures. Some
well-known heath care systems using the Baldrige Health Care Criteria to improve organizational
performance include Baylor Health Care System, Health Care Corporation of America, Kaiser
Permanente, the Mayo Clinic, M.D. Anderson Cancer Center, St. Jude Medical, Inc., and the
Cleveland Clinic (Foundation for the Malcolm Baldrige National Quality Award, 2011).
Summary of Main Findings
This summary includes the analysis and results from the Wilcoxon Rank Sum test
described in Table 18 through Table 24. The study compared 34 HCPE hospitals to 153 non-
HCPE hospitals in the same geographic markets. There were 4 groups of 42 dependent variables:
(1) HCAHPS hospital experience patient survey measures performance; (2) outpatient imaging
efficiency; (3) process of care measures performance for heart attack, heart failure, pneumonia,
and surgical care improvement project process; and (4) outcome of care measures performance.
Of the 42 CMS measures in the 4 different CMS measures groups, there was a statistically
significant difference in 9 of the 10 HCAHPS patient survey measures and 1 of the 9 surgical
care improvement project process measures. To simplify the discussion, the 42 CMS measures
were classified into two major categories focused on (1) patient experience and (2) clinical

Health Care Criteria and Organizational Performance 143
processes and outcomes. The patient experience measures were comprised of the 10 HCAHPS
patient survey performance measures, and the clinical processes and outcomes were comprised of
the 32 measures in the other groups: outpatient imaging efficiency, heart attack, heart failure,
pneumonia, surgical care, and outcomes measures performance. Categorizing the data into two
categories assisted with rethinking and understanding of the results by the presentation of a
different mental model (Senge, 2006b).
Patient Experience Category. The first of the two categories studied was the patient
experience survey performance measures. The HCAHPS hospital experience patient survey
measures performance results were the most significant findings in this study. Hospitals that
used the HCPE had higher means and lower standard deviations than the non-HCPE hospitals in
all 10 measures, and all differences were statistically significant except the HCAHPS hospital
experience measure “Doctor always communicated well.”
A recent study on patient experience indicated that “the heart of the patient experience lies
in the organization's ability to energize the unique employees, relationships, and services it offers
and to purposefully shape a positive experience that delivers on the brand's promise” (Needham,
2012, p. 262). There has been ample research identifying the positive relationship between patient
experience and employee satisfaction, engagement, and quality of care (Atkins, Marshall, &
Javalgi, 1996; Davis et al., 2000; DerGurahian, 2009; Forrester & Maute, 2001). The patient
experience is important for the future of health care and will be discussed in more detail later in
this chapter. According to Dr. Donald Berwick, former President and Chief Executive Officer of
IHI and former Administrator of CMS, the concept of “patient-centeredness is a dimension of
health care quality in its own right, not just because of its connection with other desired aims, like
safety and effectiveness” (Berwick, 2009, p. 555). The concept of “patient-centeredness” was

Health Care Criteria and Organizational Performance 144
pivotal concept defined by the Institute of Medicine’s study as one of the “six aims and ten rules
for health care redesign” (Institute of Medicine, Committee on Quality of Health Care in America,
2001).
The final survey prompt, “Patients would definitely recommend the hospital,” was perhaps
the most critical performance measure in the study. This is a likelihood-to-recommend question
that has proven to be important to the profitability and sustainability of organizations, including
hospitals, and will be discussed further in the next section titled “The Bottom Line.” A list of the
statistically significant measures results is presented in Table 32.
Table 32
HCAHPS Hospital Experience Patient Survey Statistically Significant Measures Results
HCAHPS Measures Statistically Significant
1. Nurses always communicated well.
2. Patients always received help soon as they wanted.
3. Patients’ pain was always well controlled.
4. Patients’ staff always explained about medicines.
5. Room and bathroom were always clean.
6. Room was always quiet at night.
7. Patients were given information about recovery at home.
8. Hospital rating of 9 or 10.
9. Patients would definitely recommend the hospital.
Clinical Processes and Outcomes Category. The clinical processes and outcomes
category was composed of 32 measures. Unlike the patient experience performance measures,
these clinical and outcome process measures have been ingrained in health care education and

Health Care Criteria and Organizational Performance 145
experience for years. Health care professionals have been taught and have become proficient at
administering numerous examinations and tests including taking blood cultures and determining
the right kind of antibiotics and beta-blockers. Over the years, accreditation of hospitals through
the Joint Commission has depended on achieving performance targets for clinical processes. This
historically clinical approach has proven to be effective for all hospitals and may be a reason why
there is a lack of a statistically significant difference in process performance between clinical
performance between hospitals using the HCPE and the non-HCPE hospitals. There was only one
statistically significant measure among the 32 measures in the clinical processes and
outcomes category, which was “Surgery patients given right kind of antibiotic.” Although
there was no statically significant difference in the other 31 process of care measures there is more
to discuss.
Mean Values. Although the group mean differences were not statistically significant, the
study results showed that HCPE hospitals had performance outcomes with mean values
representing higher performance than the non-HCPE hospitals in 38 of the 42 (90%) of the study
measures. All 10 measures in the patient experience category and 28 of the 32 (88%) of the
clinical processes and outcomes category had mean values representing higher performance. Even
though there was a lack of a statistically significant difference in process performance between
HCPE hospitals and non-HCPE hospitals, there was a difference in performance between HCPE
and non-HCPE hospitals based on the mean values. As discussed above, decades of standardized
health care education, training, and hospital accreditation programs may explain the lack of
statistical differences in the clinical processes and outcomes category but not the overall difference
in mean values. Table 33 provides a summary of the 42 CMS measures’ mean values.

Health Care Criteria and Organizational Performance 146
Table 33
Summary of the 42 CMS Measures’ Mean Values
Table of Performance Measures Number of measures with higher
mean values for HCPE organizations
than non-HCPE organizations
Table 18. HCAHPS Patient Experience Results 10 of the 10 with higher mean values
Table 19. Outpatient Imaging Efficiency Results 1 of the 3 with higher mean values
Table 20. Process of Care: Heart Attack Results 3 of the 4 with higher mean values
Table 21. Process of Care: Heart Failure Results 4 of the 4 with higher mean values
Table 22. Process of Care: Pneumonia Results 5 of the 6 with higher mean values
Table 23. Process of Care: Surgical Results 9 of the 9 with higher mean values
Table 24. Outcome of Care Results 6 of the 6 with lower mean values
Total 38 of the 42 performance measures
Research Model. The model in Figure 15 describes the results of this study, depicting the
relationship of the HCPE to non-HCPE organizations. The model is based on an adaptation of the
Donabedian’s Structure, Process, and Outcomes Model earlier presented in Figure 11. The
Donabedian model was used because it has been so ingrained in the understanding of the process
for evaluating the quality of medical care that the Agency for Healthcare Research and Quality
(AHRQ) acknowledges its use for creating quality measures (Agency for Healthcare Research and
Quality [AHRQ], 2013e). The three structures of this model are first the “organizational model,”
which identifies two basic conceptual designs developed from the application of the HCPE. The
center structure is the “process,” and the final structure is the “quality outcomes.”
In Figure 15, the organizational model defines the difference between the traditional non-
HCPE and HCPE health care organizations in philosophical approaches. The traditional non-
HCPE health care organization model is focused on physical characteristics, equipment, qualified

Health Care Criteria and Organizational Performance 147
health care personnel, technology, and management, while the HCPE model is based on a
comprehensive, integrated, aligned, patient-centered system of care that is based on inter-related
organizational systems. Although both the non-HCPE and HCPE models contain much of the
same organizational “components” for providing patient care, a difference in approaches affects
the processes of care, especially those processes that influence the patient experience. As a result,
there is a statistical difference in patient experience and quality outcomes. This difference affects
loyalty, sustainability, and the bottom line and will be discussed next.
Figure 15
Conceptual Framework of the Research Results for HCPE and Non-HCPE Hospitals

Health Care Criteria and Organizational Performance 148
The Bottom Line
This section reviews the role of the federal government in health care funding and how the
performance measures in this study, including the HCAHPS patient experience survey questions,
have an effect on a hospital’s bottom line.
In 2012, U.S. health care spending hit a record $2.67 trillion; however, its share of the
overall economy shrank from 17.12% of gross domestic product in 2011 to 17.04% because non-
health care segments of the economy grew faster and because cost-saving measures put in place by
the initiation of the Affordable Care Act (ACA) had an impact (Cauchon, 2013). The ACA of
2010 has changed health care. One major practical implication of this study was revealing how
hospitals in this study using the HCPE have performed significantly better at managing the patient
experience than their competitors. This is important in a practical sense because the difference has
an effect on the hospital’s financial performance. The ACA has changed the Medicare program's
history as a payer for health care services, evolving from the reimbursement of providers based on
reasonable costs to a prospective payment system, to a payment system that will vary based on
the quality of the care provided (Shoemaker, 2011).
The ACA created the CMS value-based purchase (VBP) program to transition Medicare
toward integration and alignment between payment and quality. The VBP was designed to reward
hospitals for improving the quality of care by redistributing Medicare payments so that hospitals
with higher performance in terms of quality receive a greater proportion of the payment than do
the lower performing hospitals (CMS, 2012a). The VBP goal was to transform Medicare from a
passive payer of claims based on volume of care to an active purchaser of care based on the quality
of services its beneficiaries receive (CMS, 2012a). The program was designed to provide acute-
care hospitals that meet established performance or improvement standards with value-based

Health Care Criteria and Organizational Performance 149
incentive payments beginning in the federal fiscal year (FFY) 2013, which started on October 1,
2012 (Fahlman, 2012). The incentive payment was based on a hospital’s performance during the
period from July 1, 2011, to March 31, 2012. Over 3,000 hospitals across the country are eligible
to participate in Hospital VBP, which has a bonus pool to incentivize improved performance and
outcomes (CMS, 2012a). In the future, under the VBP, a hospital’s performance in clinical
quality process of care and patient experience (HCAHPS) measures will determine 1% of the
traditional base payment for FFY 2013, and payments for FFY 2014 will incorporate performance
on outcomes measures (CMS, 2012a).
The hospital's value-based incentive payment will be based on the hospital's performance
or improvement during the performance period. The VBP program was designed to be revenue
neutral for the federal government and is funded through a 1% reduction overall on Medicare
payments from participating hospitals’ base operating diagnosis-related group (DRG) payments for
FFY 2013, increasing to 2% by FFY 2017 under the Inpatient Prospective Payment System (CMS,
2012a). In 2015, hospitals that continue to show poor performance ratings will be excluded from
the bonus pool and will face additional cuts in reimbursement. Table 33 provides an overview of
the VBP program schedule changes in payments and identifies the transformation from the passive
payer of claims based on volume of care to an active purchaser of care based on the quality of
services that beneficiaries receive (CMS, 2012a). Note the shift from a focus on process of care to
outcomes and efficiency from 2013 to 2017. CMS will assess each hospital’s total performance by
comparing its achievement and improvement scores for each applicable VBP measure and award
the higher score for each measure. CMS will then aggregate each hospital’s scores into the
appropriate domain. The FFY 2013 Hospital VBP Program consists of only two domains: (1)
clinical process of care and (2) patient experience of care; many of these measures were part of this

Health Care Criteria and Organizational Performance 150
study (CMS, 2012a). The clinical process of care score is the sum of measure scores in that
domain, and the patient experience of care score is the sum of a hospital’s HCAHPS base score
and that hospital’s HCAHPS consistency score (CMS, 2012a). Table 34 identifies how hospitals’
domain scores will be weighted and the corresponding percentage of CMS program contribution.
For example for FFY 2013, the weight is 70% for clinical process of care and 30% for patient
experience of care, totaling 100% of the CMS contribution. Several of the clinical process of care
measures and all 10 HCAHPS included in this study are part of the 2013 value-based purchasing.
Physician payments will become more closely linked to value with the launch of a physician value-
based payment system and the implementation of a “value-modifier” that rewards physicians who
deliver better care.
Table 34
Value-Based Purchasing Program Domain Overview
Value-Based Purchasing Federal Fiscal Year 2013 2014 2015 2016 2017
% Program Contribution 1.00 1.25 1.5 1.75 2.0
1 Process of Care .70 .45 .20 Reclassification of Domains:
National Quality
Strategy*
2 Patient Experience
(HCAHPS Survey)
.30 .30 .30
3 Outcome 0 .25 .30
4 Efficiency:
Medicare Spending per Beneficiary
0 0 .20
*Six Domains: (1) Clinical Care, (2) Person- and Caregiver-Centered Experience and Outcomes, (3) Safety, (4) Efficiency and Cost Reduction, (5) Care Coordination, and (6) Community/Population Health
Currently the VBP measures are defined for 2013 and 2014, while those for 2015 have not
been released. CMS has not finalized its proposal to reclassify the VBP measures into the
Health Care Criteria and Organizational Performance 151
following six domains in FFY 2016, (1) Clinical Care, (2) Person‐ and Caregiver‐Centered
Experience and Outcomes, (3) Safety, (4) Efficiency and Cost Reduction, (5) Care Coordination,
and (6) Community/Population Health (CMS, 2012a).
The value-based purchasing strategies were designed to reward hospitals financially for
providing higher quality care, to bring about transformational changes in total care delivery, and to
increase the level of shared accountability among providers (Miltenberger, Downs, & Greene,
2012). The overall goal was to improve care outcomes and reduce Medicare spending per
beneficiary. The VBP Program was only one of the challenges leaders of health care systems
across must address in the future.
Net Promoter Score. The final measure in the HCAHPS patient experience survey,
“Patients would definitely recommend the hospital,” is a likelihood-to-recommend question that
has proven to be the "Ultimate Question" and the basis for calculating a “net promoter score”
(Reichheld & Rob, 2011). Of patients treated at a HCPE hospital in the study, 75.75% would
recommend the hospital, versus 68.37% for the non-HCPE hospitals (p < .000). Since 2001,
Reichheld has researched this likelihood-to-recommend question to identify those who would not
recommend (“detractors”) and those who would strengthen the organization image and reputation
through positive word of mouth (“promoters”), thus generating profitability and sustainable growth
(Reichheld & Rob, 2011, pp. 6-7). Initially the outcome of the research yielded the concept of a
“net promoter score” and later developed into a “management system,” which provided the
organization with an understanding of “how well the organization treats the people whose lives it
affects [and] how well it generates relationships worthy of loyalty” (Reichheld & Rob, 2011, p. 1).
This theory of customer focus and loyalty to the organization dates back to ancient times,
as described in the literature review. More recent theories of customer loyalty date from the

Health Care Criteria and Organizational Performance 152
1920s, and customer loyalty has been researched in other fields such as quality and operations
management. For example, Henry Ford said, “It is not the employer who pays the wages.
Employers only handle the money. It is the customer who pays the wages” (2006, p. 14).
Likewise, W. Edwards Deming stated that “loyal customers (and loyal employees and investors)
are also your most important business asset and loyal customers keep coming back; they refer their
friends and they measurably grow in value over time” (1994, p. 8). In health care, research
continues to confirm that patients choose hospitals on the basis of past experience, and “80% of
consumers now go online for health information, and 58% of those say their search affected their
health care decision-making” (Forrester & Maute, 2001, p. 259). There has been an effort over the
past decade to learn from the hospitality industry what factors improve the patient and family
hospital experience to foster healing and drive customer decisions and perceptions of service
quality (Wu, Robson, & Hollis, 2013). Health care research has identified “patient-centered
communication, reassurance, high-quality emotional and psychosocial care” as important attributes
for medical practices' developing sensitivity to patients' needs, which was “a leading predictor of
overall patient satisfaction and holds powerful influence over likelihood to recommend the
practice” (Clark, 2003, p. 119). The results of this study support the concept that patient
experience is important to HCPE hospitals. Ultimately, customer loyalty is an important aspect of
the profitability and sustainability of any organization. The hospitals using the HCPE have
transformed their organizations from a narrow focus on clinical outcomes to a more holistic
approach to quality in all respects, including the customer experience
Significance of the Study to Health Care Organizations
This research adds to the body of knowledge and understanding of the HCPE in health
care. The HCPE offer a systematic valid, reliable model that has undergone decades of

Health Care Criteria and Organizational Performance 153
development, implementation, and testing by thousands of organizations in various industries. The
HCPE model is a non-prescriptive, adaptable, and non-limiting blueprint, framework, or model for
high performance, presented as a list of open-ended questions. Since its creation in 1987, the
HCPE has continued to evolve based on input from experts, academics, and organizations applying
the criteria. Each year, health care organizations across the U.S. apply the HCPE in an effort to
learn and improve. The HCPE form a non-prescriptive model and are not based on any one
management theory but instead allow for the integration of any management theories, concepts,
and best practices that an organization requires to ensure superior levels of performance and
sustainability. These theories cover numerous fields of study such as leadership, strategy
development and execution, marketing, finance, accounting, metrology, decision science,
knowledge management, change management, human capital management, and process
management.
This study has an impact on organizations pursuing performance excellence, but especially
for health care organizations, by providing a clear and objective assessment of the HCPE as an
overall business model for leaders to improve the health care systems’ focus on the patient. As
discussed earlier, this focus on the patient has an effect on the bottom line. This study supports the
efforts of professional organizations, such as the IHI, that have worked to support and encourage
leaders of innovative health systems by identifying important leverage points for leaders striving
for dramatic system-level performance improvement for the leadership of organizational
transformation (Latham & Vinyard, 2011). The IHI identified the HCPE as a comprehensive
framework for improving health care performance (Reinertsen et al., 2008). The HCPE provide a
systems approach that has proven successful in assuring the best clinical outcomes, and leaders
Health Care Criteria and Organizational Performance 154
have learned that applying the HCPE helps them focus, prioritize, integrate, and align their
improvement initiatives to accomplish the results that matter most (Bodinson, 2005).
The HCPE are more than a proven framework for improving health care performance.
Some leaders apply the HCPE as a transformation strategy. The IHI has interviewed CEOs
regarding their first-hand experience in transforming health care in their organization. In a 2011
interview with Dennis Keefe, CEO of Cambridge Health Alliance (CHA) in Cambridge,
Massachusetts, Keefe explained how his organization is trying to get away from the concept of
pursuing perfection as a “project” to getting people to understand the transformation of the
organization using system-wide indicators and the HCPE as an overall framework for
transformation (IHI, 2011). In 2012, IHI profiled three recipients of the Baldrige Award—Baptist
Hospital, SSM Health Care and Saint Luke’s Hospital—in a story that described “how three health
care organizations won the top U.S. quality award” and “if you’re obsessed with organizational
quality, the Malcolm Baldrige National Quality Award is as good as it gets” (IHI, 2012).
The HCPE has provided a proven methodology for adapting and aligning health care
organizations to meet the new health care value-based paradigm created by the ACA. This new
paradigm requires health care organizations to develop strategies for achieving high value for
patients. The overarching goal of health care delivery is defined as the health outcomes achieved
per dollar spent (Porter & Teisberg, 2006). An organizational strategy aligned with patient-
specific goals is the requirement for any health care system. When value improves, patients,
payers, providers, and suppliers all benefit while the economic sustainability of the health care
system increases (Porter, 2010). Value is defined around the patient, and in a well-functioning
health care system, the creation of value depends on patient experience, input, process of care, and
results. Value in health care is measured by the outcomes achieved, not the volume of services

Health Care Criteria and Organizational Performance 155
delivered, and shifting focus from volume to value is a central challenge because value for patients
should determine the rewards for all other actors in the system (Porter, 2010).
Each health care organization develops varying perspectives along with the structural and
contextual dimensions necessary to achieve high performance. The HCPE requires leadership to
see and analyze the health care organization accurately and deeply to create the optimum
organization design and structure (Daft, 2007). The HCPE focus on creating value and
sustainability and has a non-prescriptive design to encourage creative thinking. The HCPE are
adaptable to any theory, standard, or best practice and encourage organizations to be open to
continuous change and improvement. Creating value is paramount to the sustainability of health
care. The concept of customer or patient loyalty is a critical component to sustainability. The
greater the loyalty an organization engenders among its customers, employees, suppliers, and
shareholders, the greater the profits it reaps (Reichheld, 2001). As hospitals look to the future, it
will require a greater level of teamwork to create relationships with various providers that deliver
high quality care.
The HCPE model is an open design that “encourages creativity and innovation” while
enabling the HCPE to integrate key health care themes, such as the patient and stakeholder as key
customers, complex leadership structures, and the multiple roles of health care providers, including
physicians, staff members, suppliers, and customers (NIST, 2011-2012, p. 55). The HCPE can
have a significant impact on organizations pursuing performance excellence, particularly health
care organizations.
Significance of the Study to Leadership
The ACA is redesigning health care, and leadership must be engaged in the transformation
of their health care organizations. The CMS is leading the effort in the redesign of health care

Health Care Criteria and Organizational Performance 156
systems with a new philosophical approach to managing health care organization, ranging from the
implementation of electronic health records to new designs of clinical quality measures. The CMS
will establish new programs and expectations in an attempt to facilitate the transformation. In
2014, a new standard for clinical quality measures (CQMs) will be required for hospitals to
measure and track the quality of health care services. These measures use a wide variety of data
that are associated with a provider’s ability to deliver high-quality care or relate to long-term goals
for health care quality. These measures include many aspects of patient care including “health
outcomes, clinical processes, patient safety, efficient use of healthcare resources, care
coordination, patient engagements, population and public health, and clinical guidelines” (CMS,
2013). The question is, will health care organizations have the ability to transform and meet the
challenges over the next 10 years? The answer is up to their leadership.
According to Meyer and Rowan (1977), leadership needs structured models to align
organizational design with the resulting efficiencies of policies and processes in order to better
create long-term effectiveness in an institutionalized high-performance culture. The result of this
study helps provide leadership with a model to execute change management, leading to
performance improvements aimed at excellence. Bossidy and Charan (2002) stated, “The leader
must be in charge of getting things done by running the three core processes – picking other
leaders, setting the strategic direction, and conducting operations” (p. 24). According to Bass
(1990), leaders must be able to formulate and evaluate appropriate organizational responses and
arrange for their implementation in operations and policies. Because at least 70% of all initiatives
fail despite leaders’ best efforts (Beer & Nohria, 2000), this study provides information that
leaders can incorporate when planning the implementation of new policy and resulting strategies
within a workplace culture of performance.

Health Care Criteria and Organizational Performance 157
Furthermore, this study adds value to the validation of the policy decision to use the HCPE
as a business model in health care organizations, such that organizations can attempt to develop a
high-performance culture that ensures continual learning, transformation, and performance
improvement. Hunt (1993, p. 112) believed that the Baldrige Award has become accepted as the
“gold standard” of quality practices, and the use of the HCPE model is becoming pivotal to
organizational performance. Leadership is responsible for creating a high-performance culture that
ensures continual learning, transformation, and performance improvement. The HCPE model
offers leaders a systematic holistic approach for hospital governance that presents questions as to
how business systems interrelate, adapt, learn, and improve. Senge (2006a) noted that collective
thinking and understanding of the systemic connectivity within organizations must transcend
organizational, temporal, and spatial boundaries to redefine the organization and its function at all
levels of the organization, community, and society.
Specifically for the health care industry, this study provides support for hospital
governance boards and trustees in their efforts to guide the complex hospital professional
bureaucracies and professional staff to improve overall organizational performance, without the
need to become technical experts or overly dependent upon the professional staff (Culbertson &
Hughes, 2008). According to the Commonwealth Center for Governance Studies (Prybil et al.,
2012), hospitals and health care systems must have the discipline and commitment to organize
their governance structures and practices to provide “forward-thinking leadership and evidence-
based outcomes” that will assist in advancing their governance practices. It was the governance
board of the Mayo Clinic in 2004 that recommended the adoption of the HCPE as a business
model, and by 2007 a total of seven of the 12 Mayo Health System organizations were using the
HCPE (Fischer, 2007). During that period, the Mayo Clinic Board of Trustees was composed of

Health Care Criteria and Organizational Performance 158
23 total members, including 3 doctors and 7 chief executive officers (CEO) of major corporations,
such as J. W. Marriott, Jr. of the Marriott Corporation, owner of the Ritz Carlton Hotels and
Resorts and 1992 and 1999 recipient of the Baldrige Award, and Frederick W. Smith, founder and
CEO of Federal Express and 1990 recipient of the Baldrige Award (Batalden et al., 2010, p. 171;
Notable Names Database, 2012). Although this was not a leadership study, leadership is the key to
both creating the high-performance culture necessary to the adoption of the HCPE model and
educating future leaders in the health care industry (Schein, 2004).
Certainly, leaders have created high-performing organizations without the use or
knowledge of the HCPE, but when analyzed these organizations have embodied the majority of the
criteria depicted in the integrated HCPE framework. After all, much of the knowledge taught in
business education comes in the context of individual silo courses, and what is rarely taught is how
to integrate HCPE or how to manage the “white spaces on the organizational chart,” which
requires a “systems or horizontal understanding of the organization” (Rummler & Brache, 1995,
pp. 5-9). Leaders using the HCPE find mindful reflection is necessary to provide a level of deep
knowledge and vision often missing in strategy development and design (Boyatzis & McKee,
2005).
Limitations
This study used CMS patient experience and process of care measures to compare
hospitals. These measures are useful but only present a limited understanding of the total hospital
performance. W. Edwards Deming credits Lloyd S. Nelson, the Director of Statistical Methods for
the Nashua Corporation, with the concept that “the most important figures needed for management
of any organization are unknown and unknowable” (Deming, 1986, p. 121). The implication of
this concept is that not everything can be measured but management must take all aspects into

Health Care Criteria and Organizational Performance 159
account. The main areas of limitation are in (a) the statistical analysis because of the small sample
size, (b) the lack of randomization in sampling, (c) the inability to generalize the results to small
hospitals, and (d) the use of CMS measures with lack of mean difference between the measures.
Of the number of limitations in this study, the most important is the sample size. There
were a fixed number of Baldrige Award recipients, and selection was based on geography. A
purposeful geographic sampling strategy was used to “select information-rich cases” to focus on
the specific hospitals in a geographic region rather than a general random sample (Taylor-Powell,
1998, p. 6). This was required to design a competitive analysis of CMS data to provide leaders
with an understanding of the competitive viability of using the HCPE as a business model. The
ability to generalize the study to small hospitals may be a limitation. Hospitals under 100 beds
were excluded from the study to reduce the amount of missing data. The exclusion of these cases
reduced the number of subject hospitals from 315 to 187, with 34 HCPE and 153 non-HCPE
hospitals.
Finally, the CMS patient experience and process of care measures used here are useful but
only present a limited understanding of the total hospital performance. Although numerous
organizations have made a concerted effort to understand hospital and clinical processes, the
challenge is to develop measurements of process that are focused on the improvement of patient
outcomes and hospital performance. Health care organizations have been measuring clinical
performance for decades and the accreditation process has helped to drive improvements. Now
with the development and adoption of CMS measures and performance targets, and the future
evolution of the ACA, the CMS has recognized these limitations and has focused on redesigning
its core measures beginning in 2014 to clinical quality measures (CQMs) to measure and track the
quality of healthcare services within the health care system. The CQMs will include 16 core

Health Care Criteria and Organizational Performance 160
clinical-focused objectives that are associated with a provider’s ability to deliver high-quality care
or that relate to long-term goals for health care quality. The CQMs measure many aspects of
patient care, including “health outcomes, clinical processes, patient safety, efficient use of
healthcare resources, care coordination, patient engagements, population and public health, and
clinical guidelines” (AHRQ, 2013c). Finally, the lack of a sizable mean difference between the
measures and the fact that the performance results had extreme values in the 98-100% range posed
limitations.
Implications for the Literature
This study begins to fill the gap in the wider context of the published literature by
addressing the use of the HCPE in health care quality improvement literature. First, there is a
general lack of peer-reviewed scholarly research articles (fewer than 300) on HCPE over the past
20 years. Second, specific to health care, there are fewer than 50 actual peer-reviewed articles and
only about 25 published since 2000. The journal articles that actually study the HCPE do not
compare actual performance measures using CMS data in multiple constructs. Third, there is a
general lack of health care studies with the compelling evidence to support using the HCPE as a
business model.
The review revealed that researchers consistently and confidently use CMS Hospital
Compare data to study health care outcomes, processes, and satisfaction of patients. Efforts to
improve quality and cut costs have led the federal government to initiate public reporting with
Hospital Compare data. Although studies have been conducted using CMS data and Hospital
Compare, none segmented the study groups based on achieving the performance excellence status
of the Baldrige Award. By statistically comparing Baldrige-winning hospitals with non-Baldrige
hospitals using CMS data, this study begins to fill the gap in the published literature.

Health Care Criteria and Organizational Performance 161
Chapter 7: Conclusions and Recommendations
The quality of health care has tremendous social and economic consequences for the U.S.,
including lost wages, reduced productivity, higher legal expenses, and lower confidence in the
health care system (Shalala, 2007). This study explored the performance of recipients of the
Malcolm Baldrige National Quality Award for Performance Excellence (Baldrige Award) and
competing hospitals in their geographic markets using CMS performance measures. The Baldrige
Award is based on the Baldrige Criteria for Performance Excellence (CPE) model for improving
organizational performance, with specific criteria for health care, business, education, and non-
profit organizations (NIST, 2011-2012). The use of the Baldrige Health Care Criteria for
Performance Excellence (HCPE) was the focus of this study. Health care systems using the HCPE
have achieved and sustained the highest national levels of patient safety and patient loyalty, health
care outcomes, physician, nurse, and staff satisfaction and engagement, revenue and market share,
and community services (NIST, 2010a).
This study included an analysis comparing 34 hospitals that use the Baldrige Health Care
Criteria for Performance Excellence (HCPE) as an organizational business model (independent
variables) to 153 hospitals in their geographic markets that do not use the HCPE. There were 4
groups of 42 dependent variables: (1) HCAHPS hospital experience patient survey measures
performance; (2) outpatient imaging efficiency; (3) process of care measures performance for heart
attack, heart failure, pneumonia, and surgical care improvement project processes; and (4) outcome
of care measures performance. The 42 CMS measures in these 4 groups were classified into 2
major categories focused on (1) patient experience and (2) clinical processes and outcomes. The
10 patient experience measures were the HCAHPS patient survey performance measures and the

Health Care Criteria and Organizational Performance 162
32 clinical processes, and the outcomes measures were comprised of the three other groups of
variables.
The first of the two categories studied was the patient experience survey performance measures.
The results of the HCAHPS hospital experience patient survey measures were the most
significant statistical findings in this study. The second category was the clinical processes and
outcomes. There was only one statistically significant measure in the 32 clinical processes and
outcomes category, which was the measure “Surgery patients given right kind of antibiotic.” The
overall performance of all 42 CMS measures analyzed in the study was noteworthy. Although the
group mean differences were not statistically significant, the study results showed that HCPE
hospitals had performance outcomes with mean values representing higher performance
than the non-HCPE hospitals in 38 of the 42 (90%) of the study measures. All 10 measures in
the patient experience category and 28 of the 32 (88%) of the clinical processes and outcomes
category had mean values representing higher performance.
A research model (Figure 15) was developed to describe the results of the study, which was
based on an adaptation of Donabedian’s Structure, Process, and Outcomes Model (Donabedian,
2003). The model identified differences in approaches that affect the processes of care, especially
those processes that influence the patient experience. As a result, there is a statistical difference in
patient experience and quality outcomes. These differences affect loyalty, sustainability, and the
bottom line.
The Affordable Care Act (ACA) of 2010 has changed health care. One major practical
implication of this study is revealing how hospitals using the HCPE have performed significantly
better at managing the patient experience than their competitors. This is important in a practical
sense because the difference has an effect on the financial performance of acute care hospitals.

Health Care Criteria and Organizational Performance 163
The ACA created the CMS value-based purchase program to shift Medicare toward integration and
alignment between payment and quality. The value-based purchasing strategies were designed to
reward hospitals financially for providing higher quality care, transform total care delivery, and
increase the level of shared accountability among providers (Miltenberger et al., 2012).
Another significant result was the identification of Reichheld’s (2001) measure of the
loyalty a company engenders among its customers, employees, suppliers, and shareholders, based
on the final question of the HCAHPS hospital experience patient survey about the “patient
definitely recommending the hospital.” A mean value of 75.75% of patients treated at HCPE
hospitals would recommend the hospital versus 68.37% of the non-HCPE hospitals p < .000. This
question is a likelihood-to-recommend question that has proven to be the "Ultimate Question”
relating to patient loyalty, which is important for the profitability and sustainability of the hospital
(Reichheld & Rob, 2011). Health care research has identified “patient-centered communication,
reassurance, [and] high-quality emotional and psychosocial care” as important attributes for
medical practices’ developing sensitivity to patients’ needs, which is “a leading predictor of
overall patient satisfaction and holds powerful influence over likelihood to recommend the
practice” (Clark, 2003). The results of this study support the concept that patient experience is
important to HCPE hospitals. Ultimately, customer loyalty is important for the profitability and
sustainability of any organization. The hospitals using the HCPE have transformed their
organizations from a narrow focus on clinical outcomes to a more holistic approach to quality in
all respects, including the customer experience.
This research adds to the body of knowledge and understanding for health care leaders.
What the HCPE offer is a systematic, valid, and reliable model that has undergone decades of
development, implementation, and testing by thousands of organizations in various industries.

Health Care Criteria and Organizational Performance 164
This study identifies that organizations pursuing performance excellence, especially in health care,
have an overall business model for leaders to use in their efforts to improve the health care system.
The HCPE have provided a proven methodology for adapting and aligning health care
organizations to meet the new health care value-based paradigm created by the ACA. This new
paradigm requires health care organizations develop strategies for achieving high value for
patients.
Finally, the ACA is redesigning health care, and leadership must be engaged in the
transformation of their health care organizations to ensure success. The CMS is leading the effort
in the redesign of how health care systems operate. Health care organizations will experience a
complete transformation over the next 10 years. The HCPE provides leadership with a model for
aligning organizational design, strategy, systems, and human capital to create long-term
effectiveness in an institutionalized high-performance culture.
Future Research. This study revealed the opportunity for future research. An approach
for planning future research could be structured around the Institute of Medicine's Committee on
Quality of Health Care in America report, Crossing the Quality Chasm: A New Health System for
the 21st Century. The committee identified and analyzed deficiencies in the quality of the medical
care delivery system and presented a framework for quality of care, described as “six aims” which
include (1) safety, (2) effectiveness, (3) patient-centeredness, (4) timeliness, (5) efficiency, and (6)
equitability (Institute of Medicine, Committee on Quality of Health Care in America, 2001). Since
2000, the CMS and the Agency for Healthcare Research and Quality (AHRQ) have worked with
interested parties to develop performance measures to address each of the six aims. This

Health Care Criteria and Organizational Performance 165
framework has been the foundation for the development of health care performance measures such
as the CMS patient experience, process of care, and outcomes used in this study.
The AHRQ has developed a portfolio of measures that address the six aims and other issues
such as access, care coordination, and health systems’ infrastructure capabilities. Using this
framework will provide a strategy for future research. For example, the AHRQ Hospital Survey
on Patient Safety Culture would provide performance measures for comparison. This hospital
survey addresses areas such as (a) hospital work area/unit performance, (b) supervisor/manager
expectations and actions promoting patient safety, (c) communications effectiveness, (d) frequency
of adverse events or mistakes, and (e) general hospital work climate (AHRQ, 2013b). Another
source of data is the AHRQ Inpatient Quality Indicators (IQIs). The IQIs include 28 hospital-level
indicators that can be used with inpatient discharge data to provide a perspective on quality
(AHRQ, 2013a).
The Healthcare Cost and Utilization Project (HCUP) sponsored by AHRQ is another
source of data for future comparison. The HCUP data provides a broad range of data on health
policy issues, including cost and quality of health services, medical practice patterns, access to
health care programs, and outcomes of treatments at the national, state, and local market levels.
For example, one of the HCUP databases includes more than 100 clinical and non-clinical data
elements for each hospital stay, and research studies could determine costs of hospital services,
medical practice variation, hospitals’ financial status, access to care, and utilization of health
services by special populations (AHRQ, 2013d)
Future research in employer and employee relationships is important to improving health
care. Consideration should be given to studies of the hospital workforce and their impact on the
process, outcomes, and parent experience. Employers find that dedicated employees stay with

Health Care Criteria and Organizational Performance 166
their organization, resulting in a reduction of turnover costs, and dedicated employees fare better in
comparison for clinical outcomes, increasing patient safety, improving the patient experience, and
reducing potential risk and loss (Press Ganey, 2012). Finally, there is a need for studies of hospital
organizational cultures and design relative to organizational performance.

Health Care Criteria and Organizational Performance 167
References Agency for Healthcare Research and Quality. (2013a). Fact sheet on inpatient quality indicators.
Retrieved March 3, 2013, from http://www.ahrq.gov/legacy/qual/qitoolkit/
Agency for Healthcare Research and Quality. (2013b). Hospital survey on patient safety culture:
Items and dimensions. Retrieved March 3, 2013, from http://www.ahrq.gov/legacy/
qual/patientsafetyculture/hospsurvindex.htm
Agency for Healthcare Research and Quality. (2013c). Meaningful use measures and metadata.
Retrieved March 10, 2013, from http://ushik.ahrq.gov/QualityMeasuresListing?
stage=Stage%202&system=mu&sortField=570&sortDirection=ascending&enableAsynchr
onousLoading=true
Agency for Healthcare Research and Quality. (2013d). Overview of the nationwide inpatient
sample. Retrieved March 3, 2013, from http://www.hcup-us.ahrq.gov/nisoverview.jsp#Data
Agency for Healthcare Research and Quality. (2013e). Selecting process measures for clinical
quality measurement. Retrieved March 3, 2013, from http://qualitymeasures.ahrq.gov/
tutorial/ProcessMeasure.aspx
American College of Medical Quality. (2010). Medical quality management theory and practice
(P. Varkey Ed., 2nd ed.). Boston, MA: Jones and Bartlett.
American Medical Association. (2012). Physician consortium for performance improvement.
American Productivity and Quality Center. (2012). History. Retrieved January 12, 2012, from
http://www.apqc.org/history
Angrisano, C., Farrell, D., Kocher, B., & Laboissiere, M. (2007). Accounting for the cost of health
care in the United States. McKinsey Global Institute, McKinsey & Company.
Health Care Criteria and Organizational Performance 168
Appleby, C. A., Harshman, C. L., & Latham, J. R. (2009). Baldrige CEO attitudes and
motivations: Developing a model of excellence. Monfort Institute Sustainable
Transformation Program.
Atkins, P. M., Marshall, B. S., & Javalgi, R. G. (1996). Happy employees lead to loyal patients:
Survey of nurses and patients shows a strong link between employee satisfaction and
patient loyalty. Journal of Health Care Marketing, 16(4), 14-23. doi: 0169075
Bass, B. M. (1990). Bass & Stogdill's handbook of leadership (3rd ed.). New York: Free Press.
Batalden, P., Daley, J., Deyo, R. A., Edwards, W. H., Headrick, L. A., Holmboe, E. S., . . .
Swensen, S. J. (2010). Lessons learned in changing healthcare and how we learned them
(P. Batalden Ed.). Toronto, ON: Longwoods.
Becker, R. M. (2012). Lean manufacturing and the Toyota production system. SAE International.
Retrieved January 8, 2012, from http://www.sae.org/manufacturing/lean/column/
leanjun01.htm
Beer, M., & Nohria, N. (2000). Cracking the code of change. Harvard Business Review, 78(3),
133-141.
Berwick, D. M. (2009). What patient-centered should mean: Confessions of an extremist. Health
Affairs, 28(4), 555-565. doi: 10.1377/hlthaff.28.4.w555
Best, M., & Neuhauser, D. (2006). Walter A. Shewhart, 1924, and the Hawthorne factory. Quality
& Safety in Health Care, 15(2), 142–143.
Bisognabo, M., & Kenney, C. (2012). Pursuing the triple aim: Seven innovators show the way to
better care, better health, and lower costs. San Francisco, CA: John Wiley & Sons.
Bodinson, G. W. (2005). Healthcare organizations from good to great. Quality Progress, 22-29.

Health Care Criteria and Organizational Performance 169
Booz Allen Hamilton. (2003). Assessment of leadership attitudes about the Baldrige National
Quality Program. National Institute of Standards and Technology.
Bossidy, L., & Charan, R. (2002). Execution: The discipline of getting things done. New York,
NY: Crown Business.
Boyatzis, R., & McKee, A. (2005). Resonant leadership: Renewing yourself and connecting with
others through mindfulness, hope and compassion. Boston, MA: Harvard Business School
Press.
Brenton, K. (2007). Using soft systems methodology to examine communication difficulties.
Mental health practice, 10(5).
Brewerton, P., & Millward, L. (2001). Organizational research methods: A guide for students and
researchers. Thousand Oaks, CA: SAGE Publications.
Breyfogle, F. W., III. (2003). Implementing Six Sigma: Smarter solutions using statistical methods
(2nd ed.). Hoboken, NJ: John Wiley & Sons.
Burns, R. B., & Burns, R. A. (2008). Business research methods and statistics using SPSS.
Thousand Oaks, CA: SAGE Publications.
Cauchon, D. (2013, March 4). Health care spending is transferred out of ICU. USA Today.
Centers for Medicare & Medicaid Services. (2010). National health expenditure projections 2010-
2020. Washington, DC: Author.
Centers for Medicare & Medicaid Services. (2011a). Outcome of care measures. Retrieved
September 12, 2011, from http://www.hospitalcompare.hhs.gov/staticpages/for-
professionals/ooc/calculation-of-30-day-risk.aspx

Health Care Criteria and Organizational Performance 170
Centers for Medicare & Medicaid Services. (2011b). Outpatient imaging efficiency measures.
Retrieved September 12, 2011, from http://www.cms.gov/HospitalQualityInits/
10_HospitalOutpatientQualityReportingProgram.asp#TopOfPage
Centers for Medicare & Medicaid Services. (2011c). Patients' survey. Retrieved September 12,
2011, from http://www.hospitalcompare.hhs.gov/staticpages/for-professionals/patient-
survey-faq.aspx?EntryID=0001
Centers for Medicare & Medicaid Services. (2011d). Process of care measures. Retrieved
September 12, 2011, from http://www.hospitalcompare.hhs.gov/Data/
ProcessOfCare/Measures.aspx
Centers for Medicare & Medicaid Services. (2011e). The specifications manual for national
hospital inpatient quality measures. Washington, DC: Author.
Centers for Medicare & Medicaid Services. (2012a). Frequently asked questions: Hospital value-
based purchasing program. Washington DC: Author.
Centers for Medicare & Medicaid Services. (2012b). HCAHPS fact sheet. Retrieved Jabaury 10,
2013, from http://www.hcahpsonline.org/files/
HCAHPS%20Fact%20Sheet%20May%202012.pdf
Centers for Medicare & Medicaid Services. (2012c). Hospital Compare. Retrieved March 2, 2012,
from http://www.hospitalcompare.hhs.gov/
Centers for Medicare & Medicaid Services. (2012d). A note about HCAHPS “boxes”. Retrieved
September 10, 2012, from http://www.hcahpsonline.org/SummaryAnalyses.aspx
Centers for Medicare & Medicaid Services. (2012e). Research data analysis center. Retrieved
March 30, 2012, from http://www.resdac.org/Available_CMS_Data.asp

Health Care Criteria and Organizational Performance 171
Centers for Medicare & Medicaid Services. (2013). Clinical quality measures. Retrieved March 2,
2013, from http://www.cms.gov/Regulations-and-Guidance/Legislation/
EHRIncentivePrograms/ClinicalQualityMeasures.html
Chalice, R. (2007). Improving healthcare using Toyota lean production methods: 46 steps for
improvement (2nd ed.). Milwaukee, WI: American Society for Quality, Quality Press.
Checkland, P. (1999). Systems thinking, systems practice: A 30-year retrospective. Chichester,
UK: John Wiley & Sons.
Chuang, S., & Inder, K. (2009). An effectiveness analysis of healthcare systems using a systems
theoretic approach. BMC Health Services Research, 9(195). doi: 10.1186/1472-6963-9-195
Clark, P. A. (2003). Medical practices’ sensitivity to patients’ needs: Opportunities and practices
for improvement. Journal of Ambulatory Care Management, 26,(2), 110-123.
Collier, V. U. (2007). Use of pay for performance in a community hospital private hospitalist
group: A preliminary report. Transactions of the American Clinical and Climatological
Association, 118, 263-272.
Community Health Care. (2012). Quality and performance improvement. Retrieved July 15, 2012,
from http://www.davchc.com/performance.htm
Culbertson, R. A., & Hughes, J. A. (2008). The trustee and patient safety: Redefining boundaries.
Patient Safety and Health Care Management Advances in Health Care Management, 7,
127-148. doi: 10.1016/S1474-8231(08)07006-7
Cusumano, M. A. (1988). Manufacturing innovation: Lessons from the Japanese auto industry.
MIT Solan Management Journal.
Daft, R. L. (2007). Organizational theory and design (9th ed.). Mason, OH: Thomson South-
Western.

Health Care Criteria and Organizational Performance 172
Darr, K. (1990). Applying the Deming method in hospitals. Hospital Topics, 68(1).
Davis, K. M., Koch, K. E., Harvey, J. K., Renee Wilson, M., Englert, J. R., & Gerard, P. D. P.
(2000). Effects of hospitalists on cost, outcomes, and patient satisfaction in a rural health
system. The American Journal of Medicine, 108, 621-626.
DeJong, D. J. (2009). Quality improvement using the Baldrige criteria for organizational
performance excellence. American Journal of Society of Health-System Pharmacists,
66(June 1, 2009), 1031-1034. doi: 10.2146/ajhp080450
Deming W.E. (1982). Out of the crisis: Cambridge, MA: MIT Press.
Deming, W. E. (1986). Out of the crises (T. W. E. D. Institute Ed.). Cambridge, MA: MIT, Center
for Advanced Educational Services.
Deming, W. E. (1994). The new economics: For industry, government and education (T. W. E. D.
Institute Ed., 2nd ed.). Cambridge, MA: MIT, Center for Advanced Educational Services.
Denney, W., Johnson, B., & Pitcher, E. (2010). Magnet and Baldrige: An essential double path to
hospital excellence. Quality Management Forum, 26(2), 1-6.
DerGurahian, J. (2009). The bottom line on happiness. Modern Healthcare. Retrieved from
http://www.modernhealthcare.com/article/20090601/NEWS/905299991/
Donabedian, A. (2003). An introduction to quality assurance in health care. New York, NY:
Oxford University Press.
Editorial. (2012, July 21). A formula for cutting health costs [Editorial]. The New York Times.
Retrieved from http://www.nytimes.com/2012/07/22/opinion/sunday/a-formula-for-cutting-
health-costs.html?_r=1&emc=eta1

Health Care Criteria and Organizational Performance 173
EFQM. (2012). Global Excellence Model Council. Retrieved January 27, 2012, from
http://www.efqm.org/en/Home/theEFQMnetwork/OurStrategicPartners/GEM/tabid/209/De
fault.aspx
Evans, J. R., & Jack, E. P. (2003). Validating key results linkages in the Baldrige performance
excellence model. Quality Managment Journal, 10(2), 7-24.
Fahlman, C. (2012). On the road together: Stories of successful implementation of the Premier
QUEST initiative - Affordable Care Act. Premier, Inc.
Fischer, D. (2007). Mayo Health System: Developing 65 points of excellence. Presentation.
Flynn, B. B., & Saladin, B. (2001). Further evidence on the validity of the theoretical models
underlying the Baldrige criteria. Journal of Operations Management, 19(6), 617-652.
Folaron, J. (2003). The evolution of Six Sigma. Six Sigma Forum Magazine (August), 38-44.
Ford, H. (2006). Quotations of Henry Ford. Bedford, MA: Applewood Books.
Ford, M. W., & Evans, J. R. (2000). Conceptual foundations of strategic planning in the Malcolm
Baldrige criteria for performance excellence. Quality Management Journal, 7(2), 1-25.
Ford, M. W., & Evans, J. R. (2001). Baldrige assessment and organizational learning: The need for
change management. Quality Management Journal, 8(3).
Forrester, W. R., & Maute, M. F. (2001). The impact of relationship satisfaction on attributions,
emotions, and behaviors following service failure. Journal of Applied Business Research,
17(1), 1-14. doi: 08927626
Foster, D. A., & Chenoweth, J. (2011). Comparison of Baldrige award applicants and recipients
with peer hospitals on a national balanced scorecard (Baldrige Award Research).
Retrieved from National Institutes of Standards and Technology website:
http://www.nist.gov/baldrige/upload/baldrige-hospital-research-paper.pdf

Health Care Criteria and Organizational Performance 174
Foundation for the Malcolm Baldrige National Quality Award. (2011). Members and Contributors.
Retrieved June 2, 2012, from http://www.baldrigepe.org/foundation/members.aspx
Freidson, E. (1975a). Doctoring together: A study of professional social control. New York, NY:
Elsevier Scientific.
Freidson, E. (1975b). Professionalism reborn: Theory, prophecy, and policy. Chicago, IL:
University of Chicago Press.
Freund, L. M. (2011). Thomas C. Dolan, PhD, FACHE, CAE, named chairperson of the Baldrige
Board of Overseers. Chicago.
Garcia-Bernal, J., Gargallo-Castel, A., Pastor-Agustin, G., & Ramirez-Aleson, M. (2004). Total
quality management in firms: Evidence from Spain. Quality Management Journal, 11(3),
30-34.
Gash, D., & Trimble, K. (2008). Using the Baldrige business model as the infrastructure for
creating a culture of patient safety. Paper presented at the 2008 Nursing Leadership
Congress, Alpharetta, GA.
Gash, D., & Trimble, K. (2009, October). Using the Baldrige business model as the infrastructure
for creating a culture of patient safety. Paper presented at the 4th Annual Nursing
Leadership Congress, Atlanta, GA.
Geldard, R. (2000). Remembering Heraclitus. Edinburgh, UK: Lindisfarne Books and Floris
Books.
Goldstein, S. M., & Schweikhart, S. B. (2002). Empirical support for the Baldrige Award
framework in U.S. hospitals. Health Care Management Review, 27(1), 62-75.

Health Care Criteria and Organizational Performance 175
Gupta, A., Daigle, S., Mojica, J., & Hurley, R. W. (2009). Patient perception of pain care in
hospitals in the United States. Journal of Pain Research, 2009:2, 147-164. doi:
/10.2147/JPR.S7903
Hacker, S. K. (2012). Change ability:Individual transformation is the key to organizational
improvement. Quality Progress, 45(8), 64.
Heidenreich, P. A., Hernandez, A. F., Yancy, C. W., Liang, L., Peterson, E. D., & Fonarow, G. C.
(2012). Get With the Guidelines program participation, process of care, and outcome for
Medicare patients hospitalized with heart failure. Circulation: Cardiovascular Quality and
Outcomes, 5(1), 37 - 43. doi: 10.1161/circoutcomes.110.959122
Helwick, C. (2010, November 2010). Patient Protection and Affordable Care Act: Dispelling the
myths. The ASCO Post. Retrieved from http://www.ascopost.com/articles/november-
2010/patient-protection-and-affordable-care-act-dispelling-the-myths.aspx
Hendricks, K. B., & Singhal, V. R. (1997). Does implementing an effective TQM program actually
improve operating performance? Empirical evidence from firms that have won quality
awards. Management Science, 43(9), 1258-1274.
Hendricks, K. B., & Singhal, V. R. (2001). The long-run stock price performance of firms with
effective TQM programs. Management Science, 47(3), 359-368.
Hospital Policy Net. (2012). CMS survey preparation and rescue services and Joint Commission
consulting services. Retrieved March 30, 2012, from http://www.hospitalpolicynet.com/
info/PREPARE.html
Hunt, V. D. (1993). Quality management for government: A guide to federal, state, and local
implementation. Milwaukee, WI: Quality Press.
Icahn, C. (2008). The Icahn Report.

Health Care Criteria and Organizational Performance 176
Inozu, B., Chauncey, D., Kamataris, V., & Mount, C. (2012). Performance improvement for
healthcare: Leading change with lean, Six Sigma and constraints management. New York,
NY: McGraw-Hill.
Institute for Healthcare Improvement. (2003). History. Retrieved January 14, 2012, from
http://www.ihi.org/about/Pages/History.aspx
Institute for Healthcare Improvement. (2008). 5 Million Lives Campaign. Getting started kit:
Governance leadership “Boards on Board” how-to guide. Retrieved August 1, 2012,
from http://www.ihi.org/knowledge/Pages/Tools/HowtoGuideGovernanceLeadership.aspx
Institute for Healthcare Improvement. (2011). Pursuing perfection: The journey to organizational
transformation: An interview with Dennis Keefe, CEO, Cambridge Health Alliance.
Retrieved January 15, 2013, from http://www.ihi.org
Institute for Healthcare Improvement. (2012). Lessons from the Baldrige winners in health care.
Retrieved January 10, 2013, from http://www.ihi.org
Institute of Medicine, Committee on Quality of Health Care in America. (2001). Crossing the
quality chasm: A new health system for the twenty-first century. Washington, DC: National
Academies Press.
Izakovic, M. (2007). New trends in the management of inpatients in U.S. hospitals: Quality
measurements and evidence-based medicine in practice. Bratisl Lek Listy, 108(3), 117-121.
Jha, A. K., Orav, E. J., Zheng, J., & Epstein, A. M. (2008). Patients’ perception of hospital care in
the United States. The New England Journal of Medicine, 359, 1921-1931.
The Joint Commission. (2007). Health care professional quality report user guide: A guide to
using the Joint Commission Hospital Quality Report.

Health Care Criteria and Organizational Performance 177
Jouanna, J. (1998). Hippocrates (medicine and culture). (M. B. DeBevoise, Trans.) Baltimore,
MD: The Johns Hopkins University Press.
Joynt, K. E., Harris, Y., Orav, E. J., & Jha, A. K. (2011). Quality of care and patient outcomes in
critical access rural hospitals. The Journal of the American Medical Association, 306(1),
45-52. doi: 10.1001/jama.2011.902
Juran, J. M. (1995). A history of managing for quality: The evolution, trends, and future directions
of managing for quality. Milwaukee, WI: American Society for Quality Control, Quality
Press.
Juran, J. M. (1999). Juran's quality handbook (5th ed.). McGraw-Hill.
Kaplan, R. S., & Norton, D. P. (1996). The balanced scorecard: Translating strategy into action.
Boston, MA: Harvard Business School Press.
Kaplan, R. S., & Norton, D. P. (2001). The strategy-focused organization: How balanced
scorecard companies thrive in the new business environment. Cambridge, MA: Harvard
Business School Press.
Kelly, D. L. (2011). Applying quality management in healthcare (3rd ed.). United States:
Foundation of the American College of Healthcare Executives.
Kelm, J. (2005). Appreciative inquiry principle summary.
Larson, M. D., Latham, J. R., Appleby, C. A., & Harshman, C. L. (2012). CEO attitudes and
motivations: Are they different for high-performing organizations? Quality Managment
Journal, 19(4), 55-69.
Latham, J., & Vinyard, J. (2008). Baldrige user's guide: Organization diagnosis, design, and
transformation (3rd ed.). Hoboken, NJ: Wiley & Sons.

Health Care Criteria and Organizational Performance 178
Latham, J., & Vinyard, J. (2011). Baldrige user's guide: Organization diagnosis, design, and
transformation (5th ed.). New York, NY: John Wiley & Sons.
Laurent, G. G., Neuman, M., Martinez, E. A., Pauker, K. Y., & Dutton, R. P. (2011). Performance
measurement at a “tipping point,” International Anesthesia Research Society, 112(4). doi:
10.1213/ANE.0b013e31820e778d
Leapfrog Group. (2012a). The Leapfrog Group fact sheet. Retrieved February 5, 2012, from
http://www.leapfroggroup.org/about_leapfrog/leapfrog-factsheet
Leapfrog Group. (2012b). The Leapfrog hospital survey. Retrieved December 10, 2012, from
https://leapfroghospitalsurvey.org/about-the-survey/
Leonard, D. (2006). The financial impact of the MBNQA. The Quality Management Forum, 32(1),
14-22.
Leonard, D., & Relle, M. K. (2004). Simplify Baldrige for healthcare. Quality Progress
(September 2004), 35-44.
Mallon, W. J. (2007). E. Amory Codman: Codman considered father of evidence-based medicine.
AAOS Now. Retrieved July 2, 2012, from http://www.aaos.org/news/bulletin/janfeb07/
research1.asp
McDonald, L. (2001). Florence Nightingale and the early origins of evidence-based nursing.
Evidence Based Nursing, 4(July 2011), 68-69. doi: 10.1136/ebn.4.3.68
Merritt, B. O., Morrison, L., Satterwhite, M. W., Smith, A., Thomason, G., & Thompson, J. The
FOCUS-PDSA strategy. Milledgeville, GA.
Merry, M. D., & Grago, M. G. (2001). The past, present and future of health care quality: Urgent
need for innovative, external review processes to protect patients. The Physician Executive
(September-October 2001), 30-35.

Health Care Criteria and Organizational Performance 179
Meyer, J. W., & Rowan, B. (1977). Institutionalized organizations: Formal structure as myth and
ceremony. American Journal of Sociology, 83(2), 340-363.
Meyer, S. M., & Collier, D. A. (2001). An empirical test of the causal relationships in the Baldrige
Health Care Pilot Criteria. Journal of Operations Management, 19(4), 403-426.
Miltenberger, B., Downs, S., & Greene, L. A. (2012). Value-based purchasing: What's ahead for
healthcare providers. American Health Lawyers Association, 16-22.
Minkman, M., Ahaus, K., & Huijsman, R. (2007). Performance improvement based on integrated
quality management models: What evidence do we have? A systematic literature review.
International Journal for Quality in Health Care, 19(2), 90-104. doi:
10.1093/intqhc/mzl071
Moen, R. D., & Norman, C. L. (2010). Clearing up myths about the Deming cycle and seeing how
it keeps evolving. Quality Progress, 22-28.
Monfort Institute. (2007). Retrieved from http://www.mcb.unco.edu/MonfortInstitute/
Monfort Institute. (2012). The Institute. Retrieved from http://www.monfortinstitute.org/
About_Us/About_Us.html
National Institute of Standards and Technology. (2002, March 7). Baldrige award winners beat the
S&P 500 for eighth year. Retrieved April 3, 2012, from http://www.nist.gov/
public_affairs/releases/g02-11.cfm
National Institute of Standards and Technology. (2003). Board of examiners update. Washington
DC.
National Institute of Standards and Technology. (2010a). Baldrige by sector: Health care.
Retrieved January 3, 2112, from http://www.nist.gov/baldrige/enter/health_care.cfm

Health Care Criteria and Organizational Performance 180
National Institute of Standards and Technology. (2010b). Frequently asked questions about the
Malcolm Baldrige National Quality Award. Retrieved from http://www.nist.gov/
public_affairs/factsheet/baldfaqs.cfm
National Institute of Standards and Technology. (2011a). Baldrige Award recipients' contacts and
profiles. Retrieved September 10, 2011, from http://www.baldrige.nist.gov/
Contacts_Profiles.htm
National Institute of Standards and Technology. (2011b). Baldrige frequently asked questions.
Retrieved from http://www.nist.gov/baldrige/about/baldrige_faqs.cfm
National Institute of Standards and Technology. (2011c). Biography of Malcolm Baldrige.
Retrieved from http://www.nist.gov/baldrige/about/biography.cfm
National Institute of Standards and Technology. (2011d). Henry Ford health system. Retrieved
January 6, 2012, from http://www.nist.gov/baldrige/award_recipients/ford_profile.cfm
National Institute of Standards and Technology. (2011e). Malcolm Baldrige National Quality
Award application data—1988-2011. Retrieved Spetember 20, 2011, from
http://www.nist.gov/public_affairs/factsheet/nqa_appdata.cfm
National Institute of Standards and Technology. (2011-2012). Health care criteria for performance
excellence. Retrieved from the National Institute of Standards and Technology website:
http://www.quality.nist.gov/HealthCare_Criteria.htm
National Institute of Standards and Technology. (2012a). The Baldrige enterprise creates great
value for your organization and the whole U.S. economy. Retrieved February 10, 2012,
from http://www.nist.gov/baldrige/transition/index.cfm
National Institute of Standards and Technology. (2012b). Baldrige program strategy map.
Retrieved March 15, 2012, from http://www.nist.gov/baldrige/about/strategy_map.cfm

Health Care Criteria and Organizational Performance 181
National Institute of Standards and Technology. (2012c). Benefits of applying. Retrieved from
http://www.nist.gov/baldrige/enter/benefits_applying.cfm
National Institute of Standards and Technology. (2012d). The feedback report: Your greatest
benefit. Retrieved March 16, 2012, from http://www.nist.gov/baldrige/enter/
feedback_report.cfm
National Institute of Standards and Technology. (2012e). Message from the Baldrige Program
Director, Dr. Harry Hertz. Retrieved March 16, 2012, from http://www.nist.gov/baldrige/
examiners/index.cfm
National Institute of Standards and Technology. (2013). The 25th Annual Quest for Excellence®
Conference and Award Ceremony. Retrieved from http://www.nist.gov/baldrige/
qe/index.cfm
National Quality Forum. (2012). Mission and vision. Retrieved January 10, 2012, from
http://www.qualityforum.org/About_NQF/Mission_and_Vision.aspx
Needham, B. R. (2012). The truth about patient experience: What we can learn from other
industries, and how three Ps can improve health outcomes, strengthen brands, and delight
customers. Journal of Healthcare Management, 57(4), 255-263.
Nisbet, R. (1979). The idea of progress. Literature of Liberty: A Review of Contemporary Liberal
Thought, 2(1) (January/March).
North Mississippi Medical Center. (2006). 2006 Baldrige award application summary.
Notable Names Database. (2012). Mayo Foundation. Retrieved July 7, 2012, from
http://www.nndb.com/org/912/000082666/
Pawson, R. (2006). Evidence-based policy. Great Britain: SAGE Publications.
Health Care Criteria and Organizational Performance 182
Perneger, T. (2006). Ten reasons to conduct a randomized study in quality improvement.
International Journal for Quality in Health Care, 18(6), 395-398. doi:
10.1093/intqhc/mzl057
Perry, J., Bratman, M., & Fischer, J. M. (2010). Introduction to philosophy: Classical and
contemporary readings (5th ed.). New York, NY: Oxford University Press.
Porter, M. E. (2010). What is value in health care? New England Journal of Medicine, 363(26),
2477-2481. doi: 10.1056/NEJMp1011024
Porter, M. E., & Teisberg, E. O. (2006). Redefining health care: Creating value-based competition
on results (1st ed.). Cambridge, MA: Harvard Business Press.
Press Ganey Associates. (2012). The many returns of employee partnership: How an engaged and
satisfied workforce leads to improved retention and outcomes. Retrieved from
www.pressganey.com
Proceedings of a roundtable discussion on product quality - Japan vs. the United States. (1980).
Washington, DC.
Prybil, L., Levey, S., Killian, R., Fardo, D., Chait, R., Bardach, D., & Roach, W. (2012).
Governance in large non-profit health systems: Current profile and emerging patterns.
Lexington, KY: Commonwealth Center for Governance Studies.
Pyzdek, T. (2003). The Six Sigma handbook. New York, NY: McGraw-Hill.
Ransom, E. R., Josji, M. S., Nash, D. B., & Ransom, S. B. (2008). The health care quality book:
Vision, strategy and tools (2nd ed.). Chicago, IL: Health Administration Press.
Reichard, J. (2011, October 11). Proposed rule would give CMS power to drop poor-quality plans.
Washington Health Policy Week in Review. Retrieved from

Health Care Criteria and Organizational Performance 183
http://www.commonwealthfund.org/Newsletters/Washington-Health-Policy-in-
Review/2011/Oct/October-11-2011/CMS-Power-to-Drop-Poor-Quality-Plans.aspx
Reichheld, F. F. (2001). Lead for loyalty. Harvard Business Review, 9.
Reichheld, F. F., & Rob, M. (2011). The ultimate question 2.0: How Net promoter companies
thrive in a customer-driven world. Cambridge, MA: Harvard Business Review Press.
Reid, D. R. (2001). From Deming to ISO 9000: 2000. Quality Progress (June 2011).
Reinertsen, J. L., Pugh, M. D., & Bisognano, M. (2004). Seven leadership leverage points for
organization-level improvement in health care. Innovation Series. Cambridge, MA:
Institute for Healthcare Improvement.
Rhoades, D. (2003). Four IHI board members rank high on modern healthcare's list of the most
powerful people in healthcare. Retrieved January 14, 2012, from http://www.ihi.org/about/
news/Pages/4IHIBoardMembersRankHighonModernHealthcaresMostPowerfulList.aspx
Rosner, B. (2006). Fundamentals of Biostatistics (6th ed.). United States of America: Thomson
Brooks/Cole.
Rummler, G. A., & Brache, A. P. (1995). Improving performance: How to manage the white space
on the organization chart (2nd ed.). San Francisco, CA: Jossey-Bass.
Schein, E. H. (1997). The three cultures of management: Implications for organizational learning.
Sloan Management Review.
Schein, E. H. (2004). Organizational culture and leadership (3rd ed.). San Francisco, CA: Jossey-
Bass.
Schniederjans, M. J., Parast, M. M., Nabavi, M., Rao, S. S., & Raghu-Nathan, T. S. (2006).
Comparative analysis of Malcolm Baldrige national quality award criteria: An empirical
study of India, Mexico, and the United States. Quality Management Journal, 13(4), 7-21.

Health Care Criteria and Organizational Performance 184
Schoderbeck, P. P., Schoderbeck, C. G., & Kefalas, A. G. (1990). Management systems:
Conceptual considerations. Boston: Irwin.
Schuchat, A. (2009). The cost of being sick: H1N1 and paid sick days. Washington DC: U.S.
Department of Health and Human Services. Retrieved from http://www.hhs.gov/
asl/testify/2009/11/t20091110a.html.
Scott, R. H., & Davis, G. F. (2003). Organizations and organizing: Rational, natural, and open
systems perspectives (5th ed.). New Jersey: Pearson Prentice Hall.
Senge, P. M. (2006a). The fifth discipline: The art and practice of the learning organization (2nd
ed.). New York, NY: Doubleday.
Senge, P. M. (2006b). The fifth discipline: The art and practice of the learning organization. (2nd
ed.). New York: Doubleday.
Shalala, D. E. (2007). Many challenges await. Modern Healthcare and the Commonwealth Fund.
Retrieved from http://www.commonwealthfund.org/Publications/Commentaries/
2005/Jul/Many-Challenges-Await.aspx
Shi, L. (1997). Health services research methods. Albany, NY: Delmar Publishers.
Shoemaker, P. (2011). What value-based purchasing means to your hospital. Healthcare Financial
Management (August 2011).
Shuttleworth, M. (2009). Hawthorne effect. Retrieved February 6, 2012, from
http://www.experiment-resources.com/hawthorne-effect.html
SSM Health Care. (2002). 2002 Baldrige award application summary.
Sullivan, T. (2011, November 28). Donald Berwick resigns as CMS administrator one month
early, president nominates Marilyn Tavenner to post [Web log post]. Policy and Medicine.
Retrieved March 18, 2012, from http://www.policymed.com/2011/11/donald-berwick-

Health Care Criteria and Organizational Performance 185
resigns-as-cms-administrator-one-month-early-president-nominates-marilyn-tavenner-to-
post.html
Swayne, L. E., Jack, D. W., & Ginter, P. M. (2008). Strategic management of health care
organizations (5th ed.). Blackwell Publishing.
Taylor-Powell, E. (1998). Sampling. University of Wisconsin Cooperative Extension.
U.S. Department of Health and Human Services. (2011). New Affordable Care Act initiative helps
create healthier communities, fight chronic disease. Retrieved from http://www.hhs.gov/
news/press/2011pres/09/20110927a.html
U.S. Department of Health and Human Services, Office of the Assistant Secretary for Planning and
Evaluation. (2002). Confronting the new health care crisis: Improving health care quality
and lowering costs by fixing our medical liability system. Washington, DC: U.S. Dept. of
Health and Human Services.
Victor, D. A., & Koch, J.C. (2012). Management awards. Reference for Business: Encyclopedia of
Business (2nd ed.). Retrieved December 20, 2012, from
http://www.referenceforbusiness.com/management/Log-Mar/Management-Awards.html
Vina, E. R., Rhew, D. C., Weingarten, S. R., Weingarten, J. B., & Chang, J. T. (2009).
Relationship between organizational factors and performance among pay-for-performance
hospitals. Journal of General Internal Medicine, 24(7), 833-840. doi: 10.1007/s11606-009-
0997-6
Waddell, W. H., & Bodek, N. (2005). Rebirth of American industry: A sudy of lean managment.
Vancouver, BC: PCS Press.
Watson, G. H. (2005). Gurus of quality: Feigenbaum’s enduring influence. Quality Progress
(November), 51-55.

Health Care Criteria and Organizational Performance 186
Wayhana, V. B., Khumawalaa, B. M., & Balderson, E. L. (2010). An empirical test of Deming’s
chain reaction model. Total Quality Management, 21(7), 761–777.
Werner, J. (2007). Avoid random acts of improvement with Baldrige. Quality Progress, 40(9), 33-
41.
Wilson, D. D., & Collier, D. A. (2000). An emperical investigation of the Malcolm Baldrige
National Quality Award causal model. Decision Sciences, 31(2), 361-390.
Wong, B. M., Levinson, W., & Shojania, K. G. (2012). Quality improvement in medical education:
Current state and future directions. Medical Education, 46(1), 107-119. doi:
10.1111/j.1365-2923.2011.04154.x
Wu, Z., Robson, S., & Hollis, B. (2013). The application of hospitality elements in hospitals.
Journal of Healthcare Management, 58(1), 47-62.
Zidel, T. G. (2006). A lean guide to transforming healthcare: How to implement lean principles on
hospitals, medical offices, clinics, and other healthcare organizations. Milwaukee, WI:
American Society for Quality, Quality Press.

Health Care Criteria and Organizational Performance 187
APPENDIX
REPRODUCED FROM THE CMS HOSPITAL COMPARE MEASURE WEBSITE

Health Care Criteria and Organizational Performance 188
Survey of Patients' Hospital Experiences (HCAHPS):
The CAHPS® Hospital Survey (Consumer Assessment of Healthcare Providers and
Systems), also known as Hospital CAHPS® or HCAHPS, is a standardized survey
instrument and data collection methodology for measuring patients' perspectives of hospital
care. While many hospitals collect information on patient satisfaction, there is no national
standard for collecting or public reporting information that would enable valid comparisons
to be made across all hospitals. In order to make apples-to-apples comparisons to support
consumer choice, it is necessary to introduce a standard measurement approach. HCAHPS
is a core set of questions that can be combined with customized, hospital-specific items to
produce information that complements the data hospitals currently collect to support
internal customer service and quality-related activities.
Three broad goals have shaped the HCAHPS survey. First, the survey is designed to
produce comparable data on patients' perspectives of care that allows objective and
meaningful comparisons among hospitals on topics that are important to consumers.
Second, public reporting of the survey results is designed to create incentives for hospitals
to improve quality of care. Third, public reporting will serve to enhance public
accountability in health care by increasing transparency. With these goals in mind, the
HCAHPS project has taken substantial steps to assure that the survey is credible, useful,
and practical. This methodology and the information it generates will be made available to
the public.

Health Care Criteria and Organizational Performance 189
HCAHPS Survey Implementation
Voluntary collection of HCAHPS data for public reporting began in October 2006. March
2008 is the first public reporting of HCAHPS results, which encompasses eligible
discharges from October 2006 through June 2007.
HCAHPS Survey Structure
The HCAHPS survey is composed of 27 items: 18 substantive items that encompass critical
aspects of the hospital experience (communication with doctors, communication with
nurses, responsiveness of hospital staff, cleanliness and quietness of hospital environment,
pain management, communication about medicines, discharge information, overall rating
of hospital, and recommendation of hospital); four items to skip patients to appropriate
questions; three items to adjust for the mix of patients across hospitals; and two items to
support congressionally-mandated reports. On average, it takes respondents about seven
minutes to complete the HCAHPS survey items (CMS2011c)
Process of Care Measures:
The clinical measures reported here focus on heart attack, heart failure, pneumonia, asthma
(children only) and the surgical care improvement project. Each rate calculation is based on
the hospital's relevant discharges.
Process of Care Measures Implementation
Beginning with discharges in 2004, eligible acute care hospitals could elect to report
quality data in order to receive the incentive payment established by Section 501(b) of the

Health Care Criteria and Organizational Performance 190
Medicare Prescription Drug, Improvement and Modernization Act of 2003 (MMA). To
obtain increased payment, the provision required eligible hospitals to report on an initial set
of 10 quality performance measures (the "starter set") and to agree to have their data
publicly displayed. Under Section 5001(a) of the Deficit Reduction Act of 2005, the set of
measures included in the incentive was expanded.
Process of Care Measures Structure
Heart Attack and Chest Pain
Every year, about one million people suffer a heart attack (acute myocardial infarction or
AMI). AMI is among the leading causes of hospital admission for Medicare beneficiaries,
age 65 and older.
Scientific evidence indicates that the following process of care measures represent the best
practices for the treatment of AMI. Higher scores are better.
Asprin at Arrival - Acute myocardial infarction (AMI) patients without aspirin
contraindications who received aspirin within 24 hours before or after hospital arrival. (Is
both an inpatient and outpatient measure.)
Aspirin at Discharge - AMI patients without aspirin contraindications who were prescribed
aspirin at hospital discharge.

Health Care Criteria and Organizational Performance 191
Angiotensin Converting Enzyme (ACE) Inhibitor or Angiotensin Receptor Blocker (ARB)
for Left Ventricular Systolic Dysfunction - AMI patients with left ventricular systolic
dysfunction (LVSD) and without angiotensin converting enzyme inhibitor (ACE inhibitor)
contraindications or angiotensin receptor blocker (ARB) contraindications who are
prescribed an ACE inhibitor or an ARB at hospital discharge.
Beta Blocker at Discharge - AMI patients without beta-blocker contraindications who were
prescribed a beta-blocker at hospital discharge.
Fibrinolytic Medication Within 30 Minutes Of Arrival - AMI patients receiving fibrinolytic
therapy during the hospital stay and having a time from hospital arrival to fibrinolysis of 30
minutes or less (Is both an inpatient and outpatient measure.)
Percutaneous Coronary Intervention (PCI) Received Within 90 Minutes of Hospital
Arrival - AMI patients receiving Percutaneous Coronary Intervention (PCI) during the
hospital stay with a time from hospital arrival to PCI of 90 minutes or less.
Smoking Cessation Advice/Counseling - AMI patients with a history of smoking cigarettes,
who are given smoking cessation advice or counseling during a hospital stay.
Median Time to Fibrinolysis (This is only an outpatient measure.) - Median time from
arrival to fribrinolysis for patients that received fibrinolysis.
Median Time to Transfer to Another Facility for Acute Coronary Intervention (This is only
an outpatient measure.) - Median number of minutes before outpatients with heart attack

Health Care Criteria and Organizational Performance 192
who needed specialized car were transferred to another hospital (a lower number of
minutes is better).
Median Time to ECG (This is only an outpatient measure.) - Median number of minutes
before outpatients with heart attack (or with chest pain that suggest a possible heart attack)
got an ECG (a lower number of minutes is better).
Heart Failure
Heart failure is the most common hospital admission diagnosis in patients age 65 or older,
accounting for more than 700,000 hospitalizations among Medicare beneficiaries every
year. It is associated with severe functional impairments and high rates of mortality and
morbidity.
Substantial scientific evidence indicates that the following Process of Care measures
represent the best practices for the treatment of heart failure. Higher scores are better.
Evaluation of left ventricular systolic (LVS) function - Heart failure patients with
documentation in the hospital record that an evaluation of the left ventricular systolic
(LVS) function was performed before arrival, during hospitalization, or is planned for after
discharge.
ACE inhibitor or ARB for left ventricular systolic dysfunction - Heart failure patients with
left ventricular systolic dysfunction (LVSD) and without angiotensin converting enzyme
inhibitor (ACE inhibitor) contraindications or angiotensin receptor blocker (ARB)
contraindications who are prescribed an ACE inhibitor or an ARB at hospital discharge.

Health Care Criteria and Organizational Performance 193
Discharge instructions - Heart failure patients discharged home with written instructions or
educational material given to patient or care giver at discharge or during the hospital stay
addressing all of the following: activity level, diet, discharge medications, follow-up
appointment, weight monitoring, and what to do if symptoms worsen.
Smoking cessation advice/counseling - Heart failure patients with a history of smoking
cigarettes, who are given smoking cessation advice or counseling during a hospital stay.
Pneumonia
Community acquired pneumonia is a major contributor to illness and mortality in the
United States, causing 4 million episodes of illness and nearly one million hospital
admissions each year.Scientific evidence indicates that the following process of care
measures represent the best practices for the treatment of community-acquired pneumonia.
Higher scores are better.
Initial Antibiotic Timing - Pneumonia inpatients that receive within 6 hours after arrival at
the hospital. Evidence shows better outcomes for administration times less than four hours.
Pneumococcal Vaccination Status - Pneumonia inpatients age 65 and older who were
screened for pneumococcal vaccine status and were administered the vaccine prior to
discharge, if indicated.
Influenza Vaccination Status - Pneumonia patients age 50 years and older, hospitalized
during October, November, December, January, or February who were screened for
influenza vaccine status and were vaccinated prior to discharge, if indicated.

Health Care Criteria and Organizational Performance 194
Blood Cultures Performed in the Emergency Department Prior to Initial Antibiotic
Received in Hospital - Pneumonia patients whose initial emergency room blood culture
specimen was collected prior to first hospital dose of antibiotics.
Appropriate Initial Antibiotic Selection - Immunocompetent patients with pneumonia who
receive an initial antibiotic regimen that is consistent with current guidelines.
Smoking cessation advice/counseling - Pneumonia patients with a history of smoking
cigarettes, who are given smoking cessation advice or counseling during a hospital stay
(CMS2011d).
Outcome of Care Measures:
The 30-day risk-standardized mortality and 30-day risk-standardized readmission measures
for heart attack, heart failure, and pneumonia are produced from Medicare claims and
enrollment data using sophisticated statistical modeling techniques that adjust for patient-
level risk factors and account for the clustering of patients within hospitals.
The three mortality models estimate hospital-specific, risk-standardized, all-cause 30-day
mortality rates for patients hospitalized with a principal diagnosis of heart attack, heart
failure, and pneumonia. All-cause mortality is defined as death from any cause within 30
days after the add link here index admission- Opens in a new window date, regardless of
whether the patient dies while still in the hospital or after discharge. For each condition, the
risk-standardized (“adjusted” or ‘"risk-adjusted’") hospital mortality rate can be used to
compare performance across hospitals (CMS2011a).

Health Care Criteria and Organizational Performance 195
Outpatient Imaging Efficiency Measures:
Outpatient imaging is a common and frequently performed component of healthcare
delivery, with important applications in diagnosing disease, establishing prognosis, and
monitoring therapy. Although the quality and safety of outpatient imaging services are
critically important, few national standards exist to address the variations in the delivery of
services, define the quality of outpatient imaging care, or allow its measurement. In
addition, because the cost of outpatient imaging studies is approximately $14 billion
annually for Medicare beneficiaries, it is critical to ensure that there is value for this
investment. Defining measurable value indicators such as appropriate utilization,
excellence in technical performance by certified or credentialed personnel, timeliness in
study reporting, and clinical efficacy is essential to this process.
The purpose of these measures is to promote high-quality efficient care. Specifically, each
of the following measures was created to reduce unnecessary exposure to contrast materials
and /or radiation, ensure adherence to evidence-based medicine and practice guidelines,
and promote efficiency defined as “absence of waste.”
The Centers for Medicare & Medicaid Services (CMS) has adopted 11 measures that are
currently used in the Hospital Outpatient Quality Data Reporting Program (HOP QDRP).
Four of the measures (OP-8 through OP-11) capture the quality of outpatient care in the
area of imaging. CMS notes that the purpose of these measures is to promote high-quality
efficient care. Specifically, each of the following measures was created to reduce
unnecessary exposure to contrast materials and /or radiation, ensure adherence to evidence-

Health Care Criteria and Organizational Performance 196
based medicine and practice guidelines, and promote efficiency defined as “absence of
waste.”
OP-8: MRI Lumbar Spine for Low Back Pain (NQF endorsed, October 2008)
This measure calculates the percentage of patients who had an MRI of the Lumbar Spine
with a diagnosis of low back pain without Medicare claims-based evidence of antecedent
conservative therapy.
OP-9: Mammography Follow-up Rates (Not NQF endorsed at this time)
This measure calculates the percentage of patients with mammography screening studies
done in the outpatient hospital setting that are followed within 45 days by a diagnostic
mammography or ultrasound of the breast study in an outpatient or office setting.
OP-10: Abdomen CT – Use of Contrast Material (Not NQF endorsed at this time)
This measure calculates the ratio of CT abdomen studies that are performed both with and
without contrast out of all CT abdomen studies performed (those with contrast, those
without contrast, and those with both).
OP-11: Thorax CT – Use of Contrast Material (NQF endorsed, October 2008)
This measure calculates the ratio of CT thorax studies that are performed with and without
contrast out of all CT thorax studies performed (those with contrast, those without contrast,
and those with both).

Health Care Criteria and Organizational Performance 197
OP-8: MRI Lumbar Spine for Low Back Pain (NQF Endorsed, October 2008) This
measure calculates the percentage of patients who had an MRI of the Lumbar Spine with a
diagnosis of low back pain without Medicare claims-based evidence of antecedent
conservative therapy.
OP-9: Mammography Follow-up Rates (Not NQF Endorsed at this time) This measure
calculates the percentage of patients with mammography screening studies done in the
outpatient hospital setting that are followed within 45 days by a diagnostic mammography
or ultrasound of the breast study in an outpatient or office setting.
OP-10: Abdomen CT –Use of Contrast Material (Not NQF Endorsed at this time) This
measure calculates the ratio of CT abdomen studies that are performed both with/without
contrast out of all CT abdomen studies performed (those with contrast, those without
contrast, and those with both).
OP-11: Thorax CT –Use of Contrast Material (NQF Endorsed, October 2008) This measure
calculates the ratio of CT thorax studies that are performed with and without contrast out of
all CT thorax studies performed (those with contrast, those without contrast, and those with
both) (CMS2011b).