Embed Size (px)
Citation preview

2014 Number 1
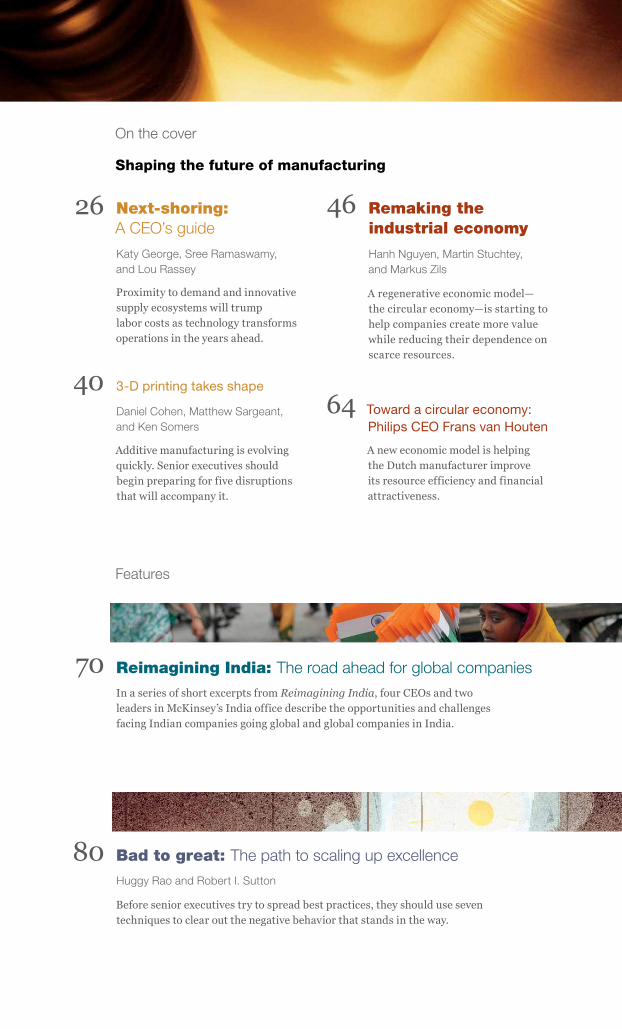
Shaping the future of manufacturing

Copyright © 2014 McKinsey & Company. All rights reserved.
Published since 1964 by McKinsey & Company, 55 East 52nd Street, New York, New York 10022.
Cover photo © Bruno Ehrs/Corbis
McKinsey Quarterly meets the Forest Stewardship Council (FSC) chain-of- custody standards.
The paper used in the Quarterly is certified as being produced in an environ- mentally responsible, socially beneficial, and economi- cally viable way.
Printed in the United States of America.
2014 Number 1
This Quarter
When McKinsey Quarterly published its first issue, in 1964,
manufacturing’s share of global GDP was roughly 50 percent larger
than it is today. More Harvard Business School graduates entered
manufacturing than any other field.
Fifty years on, manufacturing doesn’t seem so sexy. In conversations
about growth engines of the future, it’s often an afterthought—
something countries move from as their economic maturation shifts
employment and GDP from manufacturing to services and beyond.
Yet a major transformation is under way. Emerging markets’ consump-
tion of manufactured goods is surging and becoming more sophis-
ticated. Simultaneously, we’re experiencing a range of technological
changes, including advanced robotics, large-scale factory digitization,
and 3-D printing, not to mention a host of energy innovations. In
many sectors, these shifts are weakening the economic rationale for
manufacturing strategies built on long supply chains and cheap
labor in low-cost countries. Proximity to demand—whether in devel-
oped or emerging markets—and proximity to innovative supply
ecosystems will become increasingly important determinants of
competitiveness. We describe this phenomenon as “next-shoring”
and lay out the implications for leaders in any geography.
Shorter supply chains would remove one of the major obstacles
to the achievement of what our colleagues Hanh Nguyen, Martin
Stuchtey, and Markus Zils call “the circular economy,” which
restores rather than throws out the material, energy, and labor
inputs used in manufacturing goods. It’s not a pipe dream. Real com-
panies, including Philips, whose efforts are described by CEO
Frans van Houten in a related commentary, are working to reduce
and recover materials they use in manufacturing and to redesign
products so their components are easier to reuse. Geographic disper-
sion, materials complexity, and inertia have slowed progress,
though, suggesting a need for coordinated action in areas such as
standards-setting for materials used in a range of products.
The digitization of manufacturing is just one part of the broader
data-analytics revolution that’s sweeping across the economy. Stay
on the cutting edge by reviewing the insights of data-analytics
practitioners, from a range of industries, who got together late last
year to trade thoughts on their biggest challenges. And don’t miss
the latest McKinsey Global Institute research on open data or IMD
professor Phil Rosenzweig’s assessment of the areas where data-
driven decision models are (and aren’t) effective. A thread of data
also runs through fresh thinking on the management and mining
of information distilled from social media, the value consumers derive
from free (to them, at any rate) services available on the web,
and the identification of hidden influencers, who are often key to
organizational change. It’s striking how all-encompassing
and interrelated the impact of the digital revolution has become.
We hope this issue of the Quarterly helps you connect the dots.
Detlef KayserDirector, Hamburg office
Katy GeorgeDirector, New Jersey office
On the cover
Features
Next-shoring: A CEO’s guide
Remaking the industrial economy
70
26 46
6440
80
Katy George, Sree Ramaswamy, and Lou Rassey
Daniel Cohen, Matthew Sargeant, and Ken Somers
Hanh Nguyen, Martin Stuchtey, and Markus Zils
Proximity to demand and innovative supply ecosystems will trump labor costs as technology transforms operations in the years ahead.
Additive manufacturing is evolving quickly. Senior executives should begin preparing for five disruptions that will accompany it.
A new economic model is helping the Dutch manufacturer improve its resource efficiency and financial attractiveness.
A regenerative economic model— the circular economy—is starting to help companies create more value while reducing their dependence on scarce resources.
3-D printing takes shape
Toward a circular economy: Philips CEO Frans van Houten
Shaping the future of manufacturing
Reimagining India: The road ahead for global companiesIn a series of short excerpts from Reimagining India, four CEOs and two leaders in McKinsey’s India office describe the opportunities and challenges facing Indian companies going global and global companies in India.
Bad to great: The path to scaling up excellence
Huggy Rao and Robert I. Sutton
Before senior executives try to spread best practices, they should use seven techniques to clear out the negative behavior that stands in the way.
Features
Departments
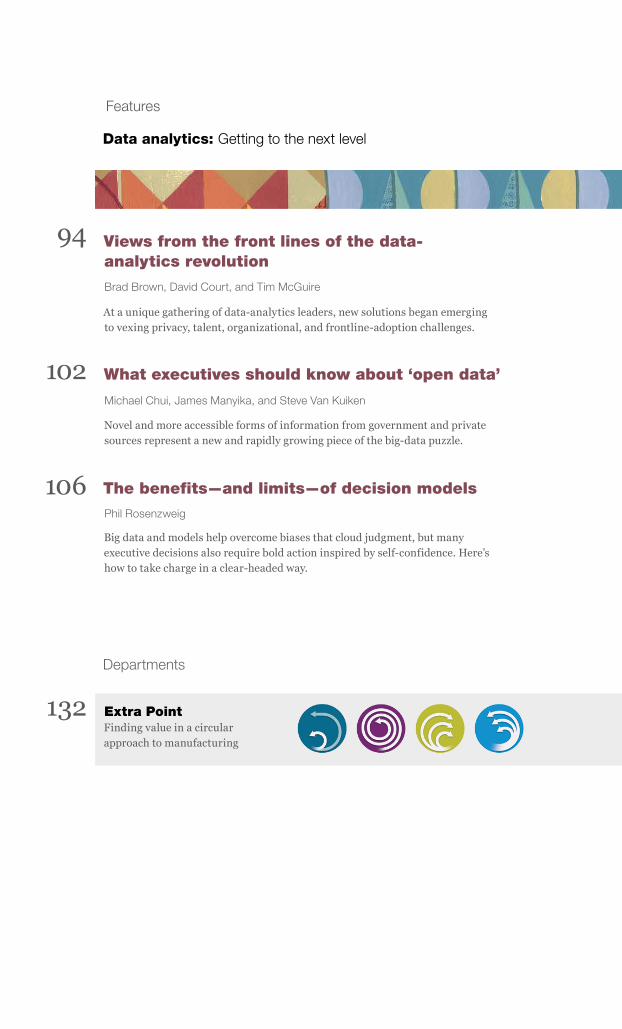
Extra PointFinding value in a circular approach to manufacturing
Views from the front lines of the data- analytics revolution
What executives should know about ‘open data’
The benefits—and limits—of decision models
At a unique gathering of data-analytics leaders, new solutions began emerging to vexing privacy, talent, organizational, and frontline-adoption challenges.
Novel and more accessible forms of information from government and private sources represent a new and rapidly growing piece of the big-data puzzle.
Big data and models help overcome biases that cloud judgment, but many executive decisions also require bold action inspired by self-confidence. Here’s how to take charge in a clear-headed way.
Data analytics: Getting to the next level
Brad Brown, David Court, and Tim McGuire
Michael Chui, James Manyika, and Steve Van Kuiken
Phil Rosenzweig
94
102
106
132
The mobile Internet’s consumer dividend
Jacques Bughin and James Manyika
New research suggests that user benefits have nearly doubled thanks to the growth of the wireless web.
Although social channels have become powerful and cost-effective tools for customer service, management may be in the wrong hands.
The strength of ‘weak signals’
Martin Harrysson, Estelle Métayer, and Hugo Sarrazin
Snippets of information, often hidden in social-media streams, offer companies a valuable new tool for staying ahead.
Leading Edge
Industry dynamics
Energy, resources & materials: Global gas markets: The North American factor
Software & online services: Breaking through the start-up stall zone
Financial services: The next wave of African mobile payments
Private equity: Uncovering hidden investment opportunities in Africa
A quick look at research and analysis from selected sectors
Why the COO should lead social-media customer service
Gadi BenMark
Tapping the power of hidden influencers
Why leadership- development programs fail
Lili Duan, Emily Sheeren, and Leigh M. Weiss
A tool social scientists use to identify sex workers and drug users can help senior executives find the people most likely to catalyze—or sabotage—organizational-change efforts.
Sidestepping four common mistakes can help companies develop stronger and more capable leaders, save time and money, and boost morale.
Unearthing the sources of value hiding in your corporate portfolio
Marc Goedhart, Sven Smit, and Alexander Veldhuijzen
Executives who rely on high-level metrics to manage will miss potential sources of value creation. A finer-grained look can help.
Applied Insight
Pierre Gurdjian, Thomas Halbeisen, and Kevin Lane
8 117
11121
14127
18
20
22
24

McKinsey Quarterly editorsFrank ComesTim Dickson Thomas FlemingAllen P. Webb, Editor in chief
Contributing editorsMichael T. BorrusoRon StachDennis SwinfordJonathan Ward
Design and data visualizationElliot Cravitz, Design directorJake Godziejewicz, DesignerMary Reddy, Data visualization editorDelilah Zak, Associate design director
Editorial operationsNicole Adams, Managing editorAndrew Cha, Web production administratorRoger Draper, Copy chiefDrew Holzfeind, Assistant managing editorHolly Lawson, Editorial assistant
DistributionDevin A. Brown, Social media and syndicationDebra Petritsch, Logistics
McKinsey Quarterly ChinaGlenn Leibowitz, EditorLin Lin, Managing editorRebecca Zhang, Assistant managing editor
How to change your mailing address McKinsey clients and other [email protected]
McKinsey [email protected]
How to contact the QuarterlyE-mail customer service [email protected]
To request permission to republish an [email protected]
To submit an article proposal [email protected]
Websitesmckinsey.com/insightsmckinsey.com/quarterlymckinseychina.com/insights-publications
Download the McKinsey Insights app on the Apple App Storehttp://bit.ly/McKInsightsApp
Download digital editions of McKinsey Quarterly From our website: http://www.mckinsey.com/insights/mckinsey_quarterly/digital_newsstand
From Zinio: http://bit.ly/mckinseydigitalissue
Audio and video podcasts on iTunes audio: http://bit.ly/mckinseyitunesaudio video: http://bit.ly/mckinseyitunesvideo
Follow us on Twitter@McKQuarterly
Join the McKinsey Quarterly community on Facebook facebook.com/mckinseyquarterly
Watch us on YouTubeyoutube.com/mckinsey
Digital offerings

Our latest thinking. Anytime. Anywhere. Stay up-to-date
Explore the latest insights
from McKinsey Quarterly,
the McKinsey Global
Institute, and our industry
and functional practices—
all delivered seamlessly to
your iPad or iPad mini.
Stay informed
Broaden and deepen
your perspective with
articles, reports, and
videos spanning the full
spectrum of McKinsey’s
knowledge. Create a
personalized reading list
that is accessible offline
and be notified when new
content is published.
Stay connected
Instantly share articles
via e-mail; post them to
social networks such
as Facebook, LinkedIn,
and Twitter; and connect
directly with McKinsey.
Download the
McKinsey Insights app for iPad®
Available on iPad running iOS 5.1.1 or higher
8
When consumers tweet, exchange photos,
or search for information on the web,
they’ve come to expect that it will be free.
In economic terms, this panoply of
services by web providers amounts to a
vast consumer surplus. Three years
ago, we took the measure of these con-
sumer benefits in the United States
and Europe.1 Using survey data and sta-
tistical analysis, we estimated how
much consumers would be willing to
pay for each of a range of services
and then aggregated the benefits,2 which
we found totaled €130 billion.
A 2013 update suggests that the con-
sumer surplus has nearly doubled, to
Jacques Bughin and James Manyika
New research suggests that user benefits have nearly doubled thanks to the growth of the wireless web.
The mobile Internet’s consumer dividend
€250 billion (exhibit). Three-fourths of
the incremental surplus results from
the explosion in consumer use of the
wireless web through smartphones
and tablets—propelled by the migration
of web services, communications
channels, social media, and entertainment
to these wireless devices. Broadband
usage also has grown in the countries
analyzed, rising to 65 percent of
all households, from a little more than
50 percent.
While web services are free to consumers,
many companies providing them gener-
ate income from their extensive platforms
and user networks, through advertising
Leading EdgeResearch, trends, and emerging thinking
8 The mobile Internet’s
consumer dividend
18 Energy, resources &
materials
24 Private equity
Industry dynamics
11 Why the COO should
lead social-media
customer service
14 The strength of
‘weak signals’
20 Software & online
services
22 Financial services

9
or access charges for valuable information
about consumers and their preferences.
In our analysis, we identify those two
activities as a cost to users and set a price
we think they would pay to avoid dis-
ruption of their web experiences or to limit
the risks associated with sharing
personal information.
Since 2010, these costs have risen to
€80 billion, from €30 billion, reflecting
growing consumer sensitivity to web
clutter and privacy issues. While that’s
a sizable increase, it’s less than the rise
in the web’s total surplus for consumers,
suggesting that the net effect on them
remains strongly positive. Interestingly, in Q1 2014Mobile paymentsExhibit 1 of 1
The web’s consumer surplus has nearly doubled in the past three years, primarily because of the explosion in consumer use of wireless access.
Web consumer surplus, € billion
Minus costs related to web clutter and privacy risks
115
15
All other surplus
Mobile surplus
2010
145
105
130 250
2013
Related to wireless –3 –25
Related to wired –27 –55
Total subtracted –30 –80
Implied net surplus 100 170
88
12
Net all other surplus
Net mobile surplus
2010
90
80
2013
Exhibit
10 2014 Number 1
a sign of maturing usage, the net surplus
for the wired web has remained close
to flat since 2010, as a large increase in
privacy and clutter risk balances the
increased surplus. Mobile usage drives
almost the entire increase in the overall
net consumer surplus.
As an extension of our core surplus
analysis, we estimated the value of the
trust users have in the web brands
they use to interact with others, seek
information, and consume entertain-
ment. This trust generates a €50 billion
surplus across both wired and wire-
less use. Leading web-service providers
such as Google (including YouTube),
Facebook, Microsoft, Yahoo!, and Twitter
capture nearly half of the trust surplus.
This concentration in a few marquee
brands, many of which actively generate
revenues from their web services,
suggests that these revenues can coexist
with acceptable privacy and web-
experience quality levels. Indeed, they
must do so, given the fragility of
that trust and the ease of undermining
it when companies mismanage user
expectations. Companies with strategies
that meet or exceed them while
increasing the range and reliability of
their web offerings—particularly mobile
services—should be well positioned
to enjoy a virtuous cycle in which the
creation of a consumer surplus expands
the scope of opportunities to generate
revenue and value.
Jacques Bughin is a director in McKinsey’s
Brussels office; James Manyika is
a director in the San Francisco office and a
director of the McKinsey Global Institute.
Copyright © 2014 McKinsey & Company. All rights reserved.
1 See Jacques Bughin, “The Web’s €100 billion surplus,” McKinsey Quarterly, January 2011, mckinsey.com.
2 The original research was a 2010 survey created in partnership with the Interactive Advertising Bureau. It was updated in 2013 to include questions about services for multiple screens—mobile (both smartphones and nonsmartphones), PCs, and tablets. In the original survey, more than 4,500 respondents across France, Germany, Russia, Spain, the United Kingdom, and the United States were asked about their use of several broad- band services. The 2013 survey focused only on four countries (France, Germany, the United Kingdom, and the United States), so estimates were scaled accordingly. The total sample size was 2,500 respondents. We used conjoint analysis to assess the value of each service by determining the respondents’ willingness to pay. Consumer payments for wired and wireless broadband access are subtracted from the value of those services.
11Leading Edge
Social media offers a chance to rede-
fine the delivery of service to customers,
changing the way they think and talk
about a company’s brands while dras-
tically lowering service costs. Seventy-
one percent of consumers who’ve had a
good social-media service experience
with a brand are likely to recommend it
to others,1 and 70 percent of companies
are trying out social customer care
in some form.2 But are they assigning
the right organizational “owner” to
those efforts?
Beyond the call center
Often, it’s the marketing or corporate-
communications function—typically social
media’s internal pioneer—that takes
ownership. That makes sense when social
channels are used to build brands, drive
loyalty, and boost sales. In the domain
of customer service, however, marketing
often lacks the resources, expertise, or
institutional support to handle the issues,
particularly in the face of a rapidly rising
number of requests. Many managers
feel that interactions with dissatisfied
customers should be conducted out
of the public eye and try to steer them
to one-on-one call-center conversa-
tions even when they prefer real-time
social media. Some executives
worry that customer-service issues are
“littering” marketing channels such as
a company’s Facebook page.
A powerful but underutilized alternative
is to locate social customer care in the
operations function, like other customer-
service channels. Service operations,
which have often emphasized costly call
centers, are designed to deal with
queries on a scale that has so far eluded
social media, which at many compa-
nies handles 5 percent or less of service
requests. Social-media channels can
work just as well as call centers to upsell
products or capture service-to-sales
opportunities—with some added advan-
tages. One is that social platforms
make it easier to guide customers to
relevant web pages or video content.
Gadi BenMark
Although social channels have become powerful and cost-effective tools for customer service, management may be in the wrong hands.
Why the COO should lead social-media customer service
12
Another is the expense: on average,
handling an inbound telephone call
typically costs a company $6 to $8; an
interaction using social media, less
than $1.3 Not every service request suits
social media, of course. These chan-
nels work best for simpler issues that
lend themselves to a full response in
writing. But that kind of written commu-
nication can be quite fluid: one large
retailer joins social-media conversations
to offer support and guidance for
customers who discuss relevant products
or express frustration with competi-
tors’ offerings.
How it looks in practice
When a financial-services company
pushed ahead with plans to build a
social channel, it achieved new levels of
collaboration between its marketing
and service operations. The chief
marketing officer maintained control
of the broad social-media strategy.
Ownership of the service channel, how-
ever, was given to the chief operations
officer, with the specific objective of
saving money by diverting traffic from
the organization’s call centers. Together,
the CMO and COO chaired a steering
2014 Number 1
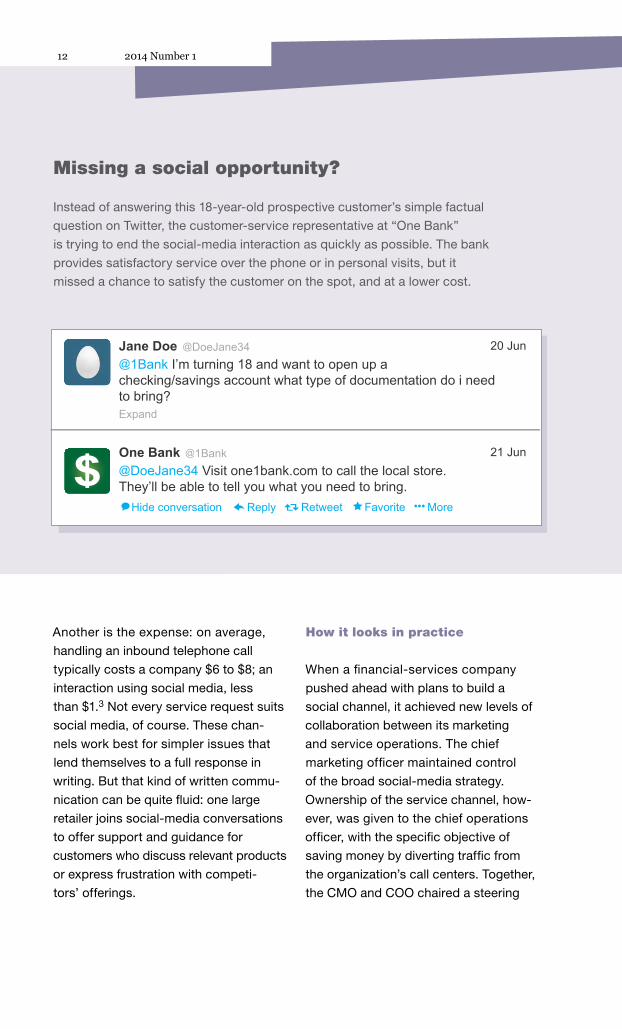
Missing a social opportunity?
Instead of answering this 18-year-old prospective customer’s simple factual
question on Twitter, the customer-service representative at “One Bank”
is trying to end the social-media interaction as quickly as possible. The bank
provides satisfactory service over the phone or in personal visits, but it
missed a chance to satisfy the customer on the spot, and at a lower cost.
Jane Doe@1Bank I’m turning 18 and want to open up a checking/savings account what type of documentation do i need to bring?
@DoeJane34 20 Jun
Expand
Hide conversation Reply Retweet Favorite More
One Bank@DoeJane34 Visit one1bank.com to call the local store. They’ll be able to tell you what you need to bring.
@1Bank 21 Jun
13Leading Edge
committee overseeing cross-
functional handoffs between marketing
and operations.
The company selected a group of
experienced customer-service agents
and tasked them with developing
the new service. Leaders realized that
balancing two goals—productivity
and a satisfying customer experience—
would raise the performance bar
considerably. They also understood the
risks of managing services across
an open channel, particularly if customers
perceived the interactions to be
ineffective. To minimize those risks, the
agents chosen for the new roles
shared some important characteristics:
deep product experience, excellent
writing skills, and the ability to act as
strong customer advocates. They
were given additional training, both on
the technical side of social media
and on compliance (such as the kind
of information appropriate to share
in a public channel and when to take a
conversation private, either through
private digital channels, such as direct
messaging on Twitter or e-mail, or
through a phone call).
Initial IT investments were kept low. Rather
than investing up front in the changes
required to integrate social-media chan-
nels into the existing service IT infra-
structure, the company gave its social-
media agents a specialized software
tool separate from that system, which
they can access when necessary.
This not only allowed the company to
The author would like to acknowledge the
contribution of Greg Malen to the research
underpinning this article.
Gadi BenMark is a consultant in
McKinsey’s New York office.
Copyright © 2014 McKinsey & Company. All rights reserved.
1 2012 State of Social Customer Service Report, NM Incite (a joint venture between McKinsey and Nielsen), December 2012.
2 Mike Stenger, “71 percent of businesses use social media for customer service,” Social News Daily, October 15, 2012, socialnewsdaily.com.
3 For insights into one sample industry, see Jon Anton and Bruce Belfiore, Benchmark Report: Best-in-Class Call Center Performance, Benchmark Portal, October 2012, benchmarkportal.com. Cited industry averages for the cost of calls can vary dramatically, depending on the method of calculation and the variability of other factors—for example, the hourly wage of service representatives.
Leading Edge
bring social-media service online faster
but also provided a real-world test that
could help to shape the development of
a fully integrated system down the road.
As this example suggests, realigning cus-
tomer service for the digital age gives
senior leaders a new range of opportuni-
ties and challenges. Integrating social
customer-care efforts with service oper-
ations while also boosting coordination
across the full range of social-media func-
tions will probably become an
increasingly important part of many com-
panies’ strategies for engaging customers.
After all, they will only become more
insistent that companies hear them out
and deal with their problems in the
social spaces where they are spending
much of their time.
14 2014 Number 1
As information thunders through the
digital economy, it’s easy to miss valuable
“weak signals” often hidden amid the
noise. Arising primarily from social media,
they represent snippets—not streams—
of information and can help companies
to figure out what customers want
and to spot looming industry and market
disruptions before competitors do.
Sometimes, companies notice them
during data-analytics number-crunching
exercises. Or employees who apply
methods more akin to art than to science
might spot them and then do some
further number crunching to test anom-
alies they’re seeing or hypotheses the
signals suggest. In any case, companies
are just beginning to recognize and
capture their value. Here are a few prin-
ciples that companies can follow to grasp
and harness the power of weak signals.
Engaging at the top
For starters, given the fluid nature of
the insights that surface, it’s often useful
to get senior leaders actively involved
with the social-media sources that give
rise to weak signals. Executives who
are curious and attuned to the themes
emerging from social media are more
likely to spot such insights.1 For example,
a global manufacturer whose high
quality and low prices were the topic of
one customer’s recent social-media
post almost certainly would not have
examined it but for a senior executive
who was a sensitive social “listener” and
found its implications intriguing. Did
the company have an opportunity, the
executive wondered, to increase prices
or perhaps to seek market share more
aggressively at the current prices?
To find out, the executive commissioned
research to quantify what had started
out as a qualitative hunch. Ultimately, the
low-price perception turned out to be
an anomaly, but the outsize perception
of the product’s quality was widely held.
In response, the company has started
funneling marketing resources to the prod-
uct in hopes of building its market
share by capitalizing on its quality and
differentiating it further from the
offerings of competitors.
Martin Harrysson, Estelle Métayer, and Hugo Sarrazin
Snippets of information, often hidden in social-media streams, offer companies a valuable new tool for staying ahead.
The strength of ‘weak signals’
15Leading Edge
Listening and mapping
As the manufacturer’s example implies,
spotting weak signals is more likely when
companies can marshal dispersed net-
works of people who have a deep under-
standing of the business and act as
listening posts. One global beverage com-
pany is considering including social-
media awareness in its hiring criteria for
some managers, to build its network
and free its management team from “well-
rehearsed habits.”
Weak signals are everywhere, of course,
so deciding when and where to keep
the antennae out is critical. One such sit-
uation involves a product, market, or
service that doesn’t yet exist—but could.
Consider the case of a global adver-
tising company that was investigating
(for one of its clients) a US growth
opportunity related to child care. Because
no one was offering the proposed
service, keyword searches on social media
(and on the web more broadly) wouldn’t
work. Instead, the company looked
to social-media platforms where it might
find weak signals—finally discovering
an online content service that allows
users to create and share individu-
alized newspapers.
In the child-care arena, digital-content
channels are often curated by mothers
and fathers, who invite conversations
about their experiences and concerns, as
well as assemble relevant articles by
experts or government sources. Analysts
used semantic clues to follow hundreds
of fine-grained conversations on these
sites. The exercise produced a wealth
of relevant information about the types of
services available in individual markets,
the specific levels of service that parents
sought, the prices they were willing
to pay, the child-care options companies
already sponsored, the strength of
local providers (potential competitors), and
the people in various communities
who might become ambassadors for a
new service. This wasn’t a number-
crunching exercise; instead, it took an
anthropological view of local child
care—a mosaic formed from shards of
information found only on social media.
In the end, the weak signals helped
the company to define the parameters of
a not-yet-existing service.
Spotting visual clues
It’s also useful to search for weak signals
when customers start engaging with
products or services in new, tech-enabled
ways, often simply by sharing per-
ceptions about a company’s offerings
and how they are using them. This
can be hard for companies to relate to
at first, as it’s quite removed from the
usual practice of finding data patterns,
clustering, and eliminating statistical
noise. Spotting weak signals in such cir-
cumstances requires managers and
employees to have the time and space to
surf blogs or seek inspiration through
services such as Tumblr or Instagram.
As intangible as these techniques may
sound, they can deliver tangible results.
US retailer Nordstrom, for example, took
16 2014 Number 1
an early interest in the possibilities
of Pinterest, the digital-scrapbooking
site where users “pin” images they
like on virtual boards and share them
with a larger community. Displayed
on Pinterest, the retailer’s products gener-
ate significant interest: the company
currently has more than four million
followers on the site.
Spotting an opportunity to share this
online engagement with in-store shoppers,
the company recently started dis-
playing popular Pinterest items in two
of its Seattle-area stores. When early
results were encouraging, Nordstrom
began rolling out the test more broadly
to capitalize on the site’s appeal to
customers as the “world’s largest ‘wish
list,’” in the words of one executive.2
The retailer continues to look for more
ways to match other customer inter-
actions on Pinterest with its products.
Local salespeople already use an
in-store app to match items popular on
Pinterest with items in the retailer’s
inventory. As the “spotting” ability of com-
panies in other industries matures,
we expect visual tools such as Pinterest
to be increasingly useful in detecting
and capitalizing on weak signals.
Crossing functions
As the Nordstrom example demonstrates,
listening for weak signals isn’t enough—
companies must channel what’s
been learned to the appropriate part of
the organization so the findings
can influence product development and
other operational activities. Interestingly,
TomTom, a company that offers products
and services for navigation and traffic,
found that the mechanism for spotting
weak signals proved useful in enhancing
its product-development process.
As part of normal operations, TomTom
monitored social media closely, mining
conversations to feed into performance
metrics for marketing and customer-
service executives. The normal process
changed after an attentive company
analyst noted that users posting on a UK
forum were focused on connectivity
problems. Rather than let the tenuous
comments get lost in the company’s
performance statistics, he channeled
them to product-development teams.
To resolve the issue, the teams worked
directly—and in real time—with
customers. That helped short-circuit an
otherwise costly process, which would
have required drivers using TomTom’s
offerings to check out connectivity
issues in a number of locales. The broader
payoff came in the form of new R&D
and product-development processes:
TomTom now taps directly into its
driving community for ideas on design
and product features, as well as to
troubleshoot new offerings quickly.
At most companies, weak signals will be
unfamiliar territory for senior manage-
ment, so an up-front investment in leader-
ship time will be needed to clarify the
strategic, organizational, and resource
implications of new initiatives. The new

17Leading Edge
Martin Harrysson is an associate
principal in McKinsey’s Silicon Valley office,
where Hugo Sarrazin is a director;
Estelle Métayer, an alumnus of the Montréal
office, is an adjunct professor at McGill
University, in Montréal.
Copyright © 2014 McKinsey & Company. All rights reserved.
1 See Martin Harrysson, Estelle Métayer, and Hugo Sarrazin, “How ‘social intelligence’ can guide decisions,” McKinsey Quarterly, November 2012, mckinsey.com.
2 See Rachel Brown, “Nordstrom touts merchandise with Pinterest,” Women’s Wear Daily, July 2, 2013, wwd.com.
roles will require people who are
comfortable navigating diverse, less
corporate sources of information.
Regardless of where companies observe
weak signals, the authority to act on
them should reside as close to the front
lines as possible. Weak signals
are strategic enough to demand top-
management attention. They are
sufficiently important to the day-to-day
work of customer-service, technical-
development, and marketing teams to
make anything other than deep
organizational engagement unwise.
18 2014 Number 1
Cost curves, which array blocks of supply
according to their expense, can clarify
the dynamics of supply in commodity
industries. They are particularly useful
when multiple new sources compete to
serve a finite market. Such a situation
exists today for liquefied natural gas (LNG).
Exporters from North America—now
among the world’s low-cost gas pro-
ducers, given recent advances in
recovering shale gas—aim to export LNG
in competition mostly with projects
in Africa, Australia, and Russia.
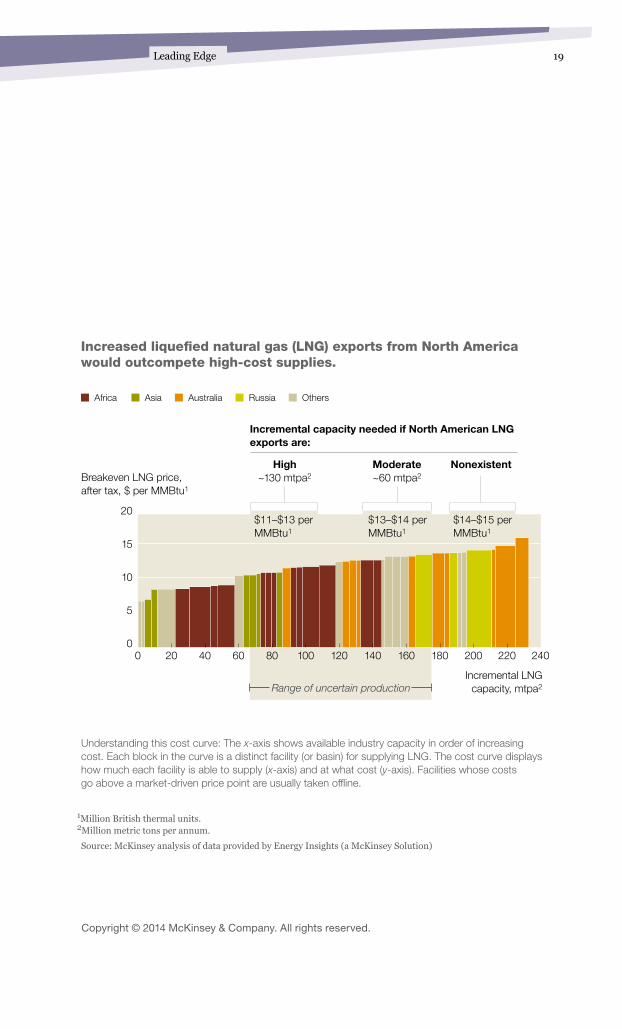
The exhibit shows how the required
breakeven costs of global LNG projects
could shift in three North American
export scenarios. The Canadian and US
governments have so far permitted
the building of six LNG export terminals,
with capacity equivalent to 25 percent
of current global LNG demand (moderate
scenario). An additional 20 terminals,
which could process the equivalent
of some 75 percent of global demand,
have also been proposed. Up to
70 percent of them could actually be built
(high scenario). If these additional
projects were authorized and constructed,
the market would need less capacity
from higher-cost exporters in Africa,
Australia, and Russia. Of course,
the development of unconventional gas
sources outside North America, the
trajectory of gas demand in Asia, and the
evolution of oil prices will also influence
global natural-gas supplies.
Giorgio Bresciani, Dieuwert Inia, and Peter Lambert
New exports of low-cost gas from Canada and the United States could threaten liquefied natural gas projects in other regions.
Global gas markets: The North American factor
Industry dynamics
The authors wish to thank Daniel Cramer,
Jaap Strengers, and Rembrandt Sutorius for
their contributions to our perspectives
on this topic.
Giorgio Bresciani is a director in McKinsey’s
London office, where Peter Lambert is a
senior expert; Dieuwert Inia is a principal in
the Amsterdam office.
19Leading Edge
OthersAsia RussiaAustraliaAfrica
Q1 2014Industry dynamics: Natural gasExhibit 1 of 1
Increased liquefied natural gas (LNG) exports from North America would outcompete high-cost supplies.
Breakeven LNG price, after tax, $ per MMBtu1
Understanding this cost curve: The x-axis shows available industry capacity in order of increasing cost. Each block in the curve is a distinct facility (or basin) for supplying LNG. The cost curve displays how much each facility is able to supply (x-axis) and at what cost (y-axis). Facilities whose costs go above a market-driven price point are usually taken offline.
Range of uncertain productionIncremental LNG
capacity, mtpa2
$11–$13 per MMBtu1
$13–$14 per MMBtu1
$14–$15 per MMBtu1
High ~130 mtpa2
Incremental capacity needed if North American LNG exports are:
Moderate ~60 mtpa2
Nonexistent
20
5
00 20 40 60 80 100 120 140 160 180 200 220 240
10
15
1Million British thermal units.2Million metric tons per annum.
Source: McKinsey analysis of data provided by Energy Insights (a McKinsey Solution)
Copyright © 2014 McKinsey & Company. All rights reserved.
20 2014 Number 1
The rapid pace of creative destruction in
today’s global economy makes the
ability to launch and grow (or to shut down
and move on from) new businesses
critical for companies large and small.
Competitive dynamics have long been
in overdrive in the software and Internet
sectors, where we have studied
patterns of birth and death for nearly
3,000 companies between 1980
and 2012. Seventy-two percent of them
failed to reach the $100 million mark.
Only 3 percent made it to $1 billion in
sales (exhibit).
Typically, the small minority of companies
that grew from $100 million to $1 billion
did so rapidly. Ten percent of companies
in the $100 million club grew at annual
rates of 60 percent or more within two
years of achieving that milestone. This
group was eight times more likely than
the remaining $100 million companies to
hit $1 billion in sales. Staying in the
high-growth club appears to depend on a
company’s ability to create new markets
with hundreds of millions of users (think
Facebook, Google, or Microsoft), disrupt
existing markets through new business
models (eBay or salesforce.com), set new
and revenue-rich technology standards
(Adobe Systems), or develop truly innova-
tive products (Citrix Systems or Electronic
Arts). Furthermore, some of these
companies (such as Oracle, through a
series of acquisitions and industry-
consolidation efforts) have been able to
transition to an “Act 2” product or
market before their “Act 1” was tapped
out—a tall order in software or any
other industry.
Ted Callahan, Eric Kutcher, and James Manyika
An early rush of revenue growth is necessary—but not sufficient—for long-term survival.
Breaking through the start-up stall zone
Industry dynamics
Ted Callahan is an associate principal in
McKinsey’s Silicon Valley office, where
Eric Kutcher is a director; James
Manyika is a director in the San Francisco
office and a director of the McKinsey
Global Institute.

21Leading Edge
Q1 2014Software GrowthExhibit 1
Very few software companies grow beyond $1 billion in revenues.
826
96 16
1 Companies that are currently public and fall within 1 of the following categories: applications, gaming, Internet, and systems (excludes pure network providers).
Number of software companies1 that reached given revenue point, 1980–2012, n = 2,952
16 companies with >$4 billion in revenues by 2012
Activision BlizzardAdobe SystemsCA TechnologieseBayElectronic ArtsFacebookGoogleIntuitMicrosoftNintendoOracleSAPSymantecTencentVMwareYahoo!
$100 million in revenues
$4 billionin revenues
$1 billion in revenues
2,952
Copyright © 2014 McKinsey & Company. All rights reserved.
22 2014 Number 1
Roughly two-thirds of adults in sub-
Saharan Africa have a mobile phone, but
digital payments have not yet reached
their full potential, even though they are
vastly more efficient and secure than
cash. In the few markets where mobile-
payment operators have gained traction,
the formula has been to focus on
larger payments that happen at a distance
and sending cash is risky—including
peer-to-peer (P2P) payments such as
domestic remittances, as well as
wages and payments from government
social-benefit programs. More than
half of all adults make or receive these
payments, which total $760 billion in
volume annually, though 50 to 60 percent
remains in cash.
One country that is demonstrating more
and more of what’s possible is Kenya,
where the penetration rate for digital pay-
ments is 70 percent, mostly because
Safaricom’s mobile money-transfer system,
M-Pesa,1 has been widely adopted. If
P2P and other payments across the region
were digitized to current Kenyan levels
and P2P payments grew as they did in the
country after the launch of M-Pesa, we
estimate that digital revenues could
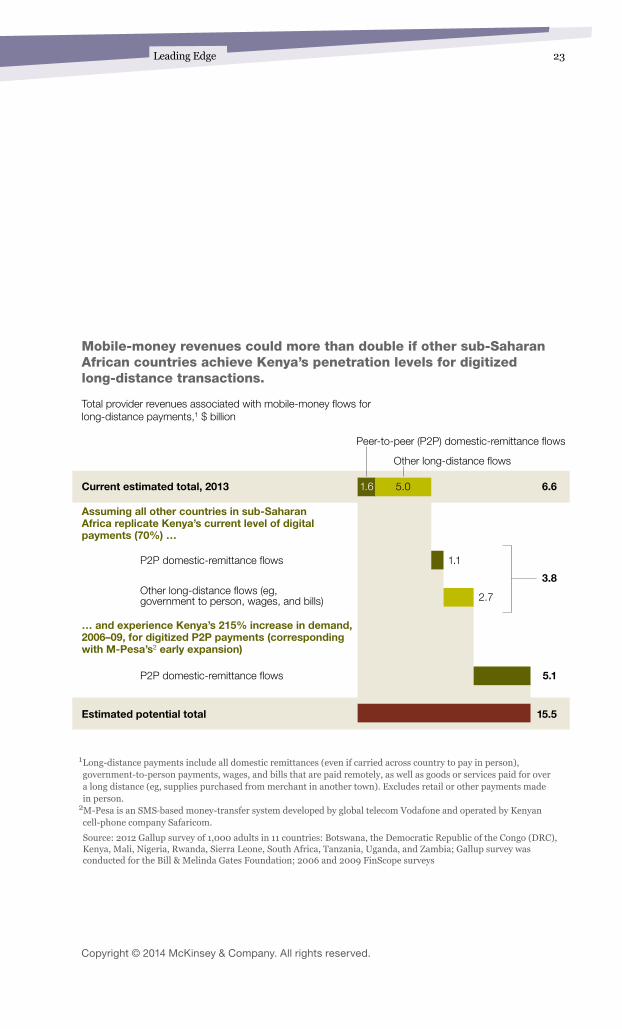
rise from $6.6 billion to $15.5 billion (exhibit).
About $3.8 billion of that growth would
result directly from higher digital-payment
rates at today’s transaction volumes,
the remaining $5.1 billion from more rapid
growth in the total number of P2P
transactions, such as the increase Kenya
experienced between 2006 and 2009 as
the number of people transacting and
of transactions per person rose steadily.
A $15.5 billion prize is equivalent to
25 percent of all African mobile revenues
for voice and data—and may be only
a fraction of the potential if mobile pay-
ments gain ground in retail transactions
while enabling financial services such
as credit and insurance.
Jake Kendall and Robert Schiff
Kenya has led the way so far, but the market’s potential spans the continent.
The next wave of African mobile payments
Industry dynamics
Jake Kendall leads the Research and
Innovation initiative of the Financial Services
for the Poor team at the Bill & Melinda Gates
Foundation. Robert Schiff is a principal
in McKinsey’s San Francisco office.
1 Vodafone developed M-Pesa with grant assistance from the United Kingdom’s Department for International Development. The system was launched in 2007 through Vodafone’s subsidiary Safaricom.
For a more complete discussion of this research, download the full report, Sub-Saharan Africa: A major potential revenue opportunity for digital payments, on mckinsey.com.
23Leading Edge
Q1 2014African mobile paymentsExhibit 1 of 1
Mobile-money revenues could more than double if other sub-Saharan African countries achieve Kenya’s penetration levels for digitized long-distance transactions.
1 Long-distance payments include all domestic remittances (even if carried across country to pay in person), government-to-person payments, wages, and bills that are paid remotely, as well as goods or services paid for over a long distance (eg, supplies purchased from merchant in another town). Excludes retail or other payments made in person.
2M-Pesa is an SMS‐based money-transfer system developed by global telecom Vodafone and operated by Kenyan cell-phone company Safaricom.
Source: 2012 Gallup survey of 1,000 adults in 11 countries: Botswana, the Democratic Republic of the Congo (DRC), Kenya, Mali, Nigeria, Rwanda, Sierra Leone, South Africa, Tanzania, Uganda, and Zambia; Gallup survey was conducted for the Bill & Melinda Gates Foundation; 2006 and 2009 FinScope surveys
Total provider revenues associated with mobile-money flows for long-distance payments,1 $ billion
Peer-to-peer (P2P) domestic-remittance flows
Other long-distance flows
Current estimated total, 2013
Assuming all other countries in sub-Saharan Africa replicate Kenya’s current level of digital payments (70%) …
Estimated potential total
6.6
P2P domestic-remittance flows 1.1
2.7
… and experience Kenya’s 215% increase in demand, 2006–09, for digitized P2P payments (corresponding with M-Pesa’s2 early expansion)
P2P domestic-remittance flows
Other long-distance flows (eg, government to person, wages, and bills)
5.1
15.5
3.8
5.01.6
Copyright © 2014 McKinsey & Company. All rights reserved.
24 2014 Number 1
Private equity is set to grow rapidly across
Africa. Continent-wide demand for
capital should increase by 8 percent a year
between now and 2018. Annual growth
could reach 20 percent in resource-rich
Angola and nine other countries, and
$50 billion in total investment is possible
over the next decade.1
But there will be wide variations by country
and industry, and the supply of capital
doesn’t seem to match the growing
demand. Large international investors
often prefer proven investment man-
agers, sizable investments, and diversi-
fication across Africa. Those preferences
may lead them to overlook some
attractive—and growing—country and
sector gems.
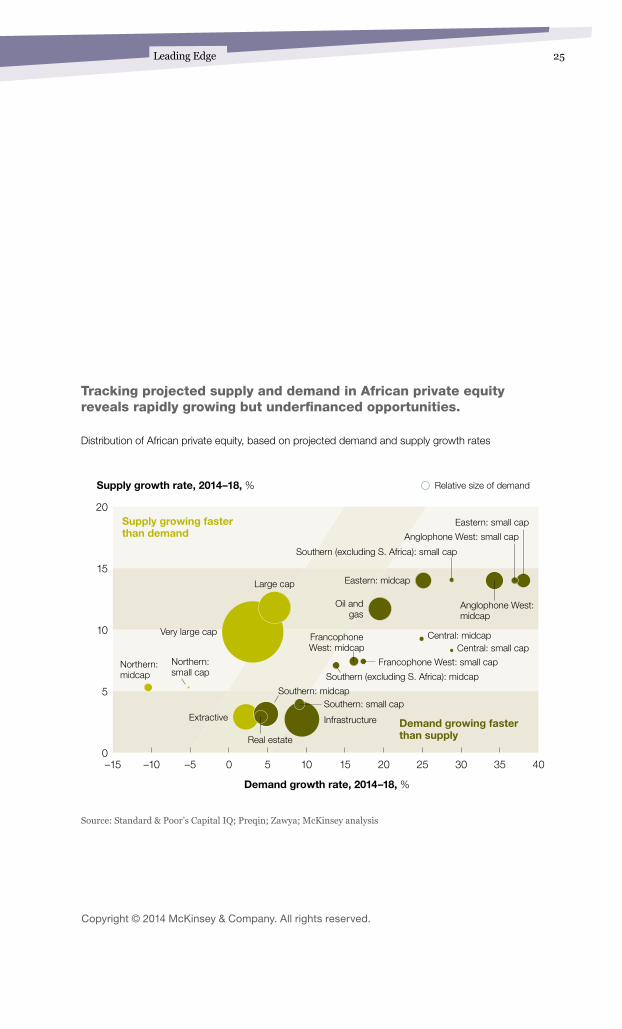
The exhibit shows the mismatch between
supply and demand by investment type.
On the right are segments with rapidly
growing opportunities but relatively
little money chasing them. These include
infrastructure funds (which some
investors view as too risky and politically
fraught) and small- and midcap funds
in East, West, and Southern Africa
(excluding South Africa, which will remain
a magnet for funding). On the other
end are funds that will probably raise more
money but face greater competition to
complete attractive deals, often involving
larger target companies. Multinationals
seeking viable acquisition targets might
look outside the active markets to mid-
size African companies.
Alastair Green, Conor Kehoe, and Farid Sedjelmaci
Recent research on the African private-equity market reveals a mismatch between supply and demand for financing that could point to investment opportunities.
Uncovering hidden investment opportunities in Africa
Industry dynamics
The authors would like to acknowledge the
contributions of Mayamiko Kachingwe to the
development of this article.
Alastair Green is a consultant in McKinsey’s
Washington, DC, office; Conor Kehoe is
a director in the London office; and Farid
Sedjelmaci is a principal in the Geneva office.
1 Estimate based on interviews with 70 leaders in the African private-equity market and an analysis of proprietary data.
25Leading Edge
Q1 2014Africa PEExhibit 1
Tracking projected supply and demand in African private equity reveals rapidly growing but underfinanced opportunities.
Distribution of African private equity, based on projected demand and supply growth rates
–150
–10
5
10
15
20
Supply growth rate, 2014–18, %
Demand growth rate, 2014–18, %
Northern: midcap
–5 0 5 10 15 20 25 30 35 40
Relative size of demand
Supply growing faster than demand
Demand growing faster than supplyReal estate
Extractive Infrastructure
Very large cap
Southern (excluding S. Africa): midcap
Southern: midcap
Southern (excluding S. Africa): small cap
Northern: small cap
Large cap
Eastern: small cap
Anglophone West: small cap
Anglophone West: midcap
Oil and gas
Central: midcapCentral: small cap
Southern: small cap
Francophone West: small cap
Francophone West: midcap
Eastern: midcap
Source: Standard & Poor’s Capital IQ; Preqin; Zawya; McKinsey analysis
Copyright © 2014 McKinsey & Company. All rights reserved.


2727
© B
runo
Ehr
s/C
orb
is
Katy George, Sree Ramaswamy, and Lou Rassey
Next-shoring: A CEO’s guide
Proximity to demand and innovative supply ecosystems
will trump labor costs as technology transforms operations
in the years ahead.
The problem
Demand for manufactured goods
in emerging markets is surging and
fragmenting as factor costs shift;
technological advances, such as
more powerful robotics and the
Internet of Things, are creating a
range of new opportunities for
manufacturers to digitize operations.
Why it matters
Manufacturing strategies built on
labor-cost arbitrage are becoming
outmoded; the race is on to get
ahead of what comes next.
What to do about it
Place greater emphasis on
proximity to both demand and
innovation while:
• Making location decisions that
balance economies of scale
against the growing diversity
of tastes within and across
global markets
• Building supplier ecosystems
that combine technical expertise
with local domain and market
knowledge
• Developing the people and skills
needed to make the most of
technological advances across
the organization
For a summary of 3-D printing’s
management implications, see
“3-D printing takes shape,” on page 40.
28
When offshoring entered the popular lexicon, in the 1990s, it
became shorthand for efforts to arbitrage labor costs by using lower-
wage workers in developing nations. But savvy manufacturing
leaders saw it as more: a decisive change in globalization, made possible
by a wave of liberalization in countries such as China and India, a
steady improvement in the capabilities of emerging-market suppliers
and workers, a growing ability to transfer proven management
processes to new locales, and increasingly favorable transportation
and communications economics.
Something of equal moment is occurring today. As we settle into
a “new normal” catalyzed by the global financial crisis, the ensuing
recession, and an uneven global recovery, traditional arbitrage
models seem increasingly outmoded.1 For some products, low labor
costs still furnish a decisive competitive edge, of course. But as
wages and purchasing power rise in emerging markets, their relative
importance as centers of demand, not just supply, is growing.
Global energy dynamics too are evolving—not just the now-familiar
shale-gas revolution in the United States, but also rising levels of
innovation in areas such as battery storage and renewables—potentially
reframing manufacturers’ strategic options. Simultaneously,
advances stemming from the expanding Internet of Things, the next
wave of robotics, and other disruptive technologies are enabling
radical operational innovations while boosting the importance of new
workforce skills.
Rather than focus on offshoring or even “reshoring”—a term used to
describe the return of manufacturing to developed markets as
wages rise in emerging ones—today’s manufacturing strategies need
to concentrate on what’s coming next. A next-shoring perspective
emphasizes proximity to demand and proximity to innovation. Both
are crucial in a world where evolving demand from new markets
places a premium on the ability to adapt products to different regions
and where emerging technologies that could disrupt costs and
processes are making new supply ecosystems a differentiator. Next-
shoring strategies encompass elements such as a diverse and agile
set of production locations, a rich network of innovation-oriented
partnerships, and a strong focus on technical skills.
1 See Ian Davis, “The new normal,” McKinsey Quarterly, March 2009, mckinsey.com.
2929
In this article, we’ll describe the economic forces sweeping across the
manufacturing landscape and examine technologies coming to
the fore. Then we’ll suggest some principles for executives operating
in this new world. The picture we’re painting is of necessity
impressionistic: next-shoring is still taking shape and no doubt will
evolve in unexpected ways. What’s increasingly clear, though, is
that the assumptions underlying its predecessor, offshoring, are giving
way to something new.
Economic fundamentals
The case for next-shoring starts with the economic fundamentals of
demand (since the importance of local factors is growing) and supply
(as the dynamics of labor and energy costs evolve).
The importance of local demand factorsMore than two-thirds of global manufacturing activity takes place in
industries that tend to locate close to demand. This simple fact helps
explain why manufacturing output and employment have recently
risen—not only in Europe and North America, but also in emerging
markets, such as China—since demand bottomed out during the
recession following the financial crisis of 2008.
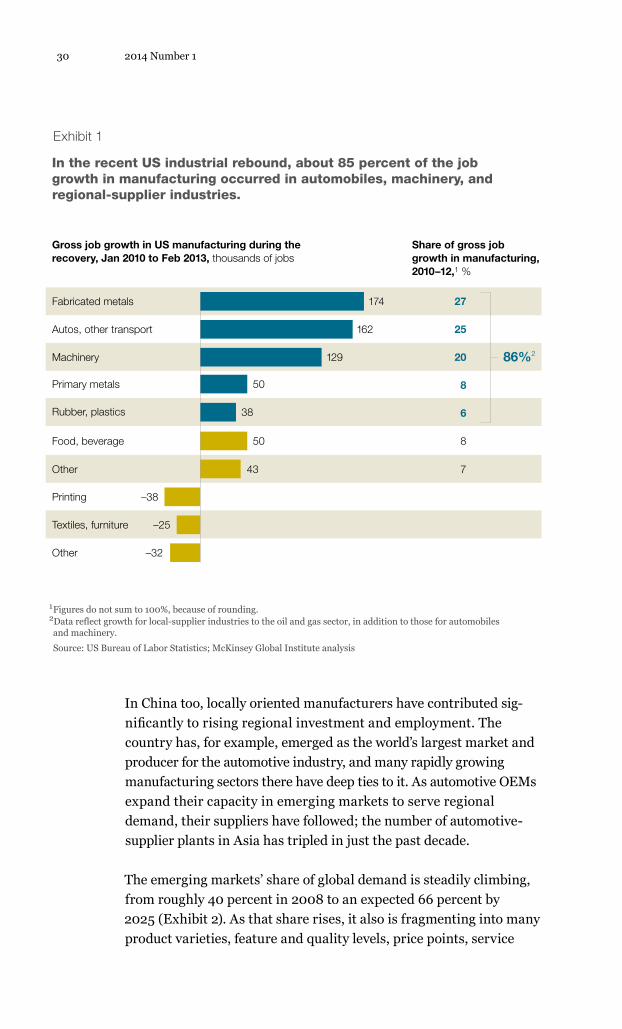
Regional demand looms large in sectors such as automobiles,
machinery, food and beverages, and fabricated metals. In the United
States, about 85 percent of the industrial rebound (half a million
jobs since 2010) can be explained just by output growth in automobiles,
machinery, and oil and gas—along with the linkages between these
sectors and locally oriented suppliers of fabricated metals, rubber, and
plastics (Exhibit 1).2 The automotive, machinery, and oil and gas
industries consume nearly 80 percent of US metals output, for example.
2 See Manufacturing the future: The next era of global growth and innovation, McKinsey Global Institute, November 2012, on mckinsey.com, for an in-depth analysis of the economics and trends surrounding five types of manufacturing industries: global technologies (for instance, electronics) that are R&D intensive and highly traded, global innovation for local markets (autos, machinery) that are R&D intensive but tend to produce adjacent to demand, labor-intensive regional processors (food, fabricated metals) that are highly localized and locate adjacent to demand, resource-intensive commodities (metals, paper and pulp) that are energy intensive and locate near demand or resources, and labor-intensive tradables (apparel, footwear) that are highly traded and locate where labor is cheap.
30 2014 Number 1
In China too, locally oriented manufacturers have contributed sig-
nificantly to rising regional investment and employment. The
country has, for example, emerged as the world’s largest market and
producer for the automotive industry, and many rapidly growing
manufacturing sectors there have deep ties to it. As automotive OEMs
expand their capacity in emerging markets to serve regional
demand, their suppliers have followed; the number of automotive-
supplier plants in Asia has tripled in just the past decade.
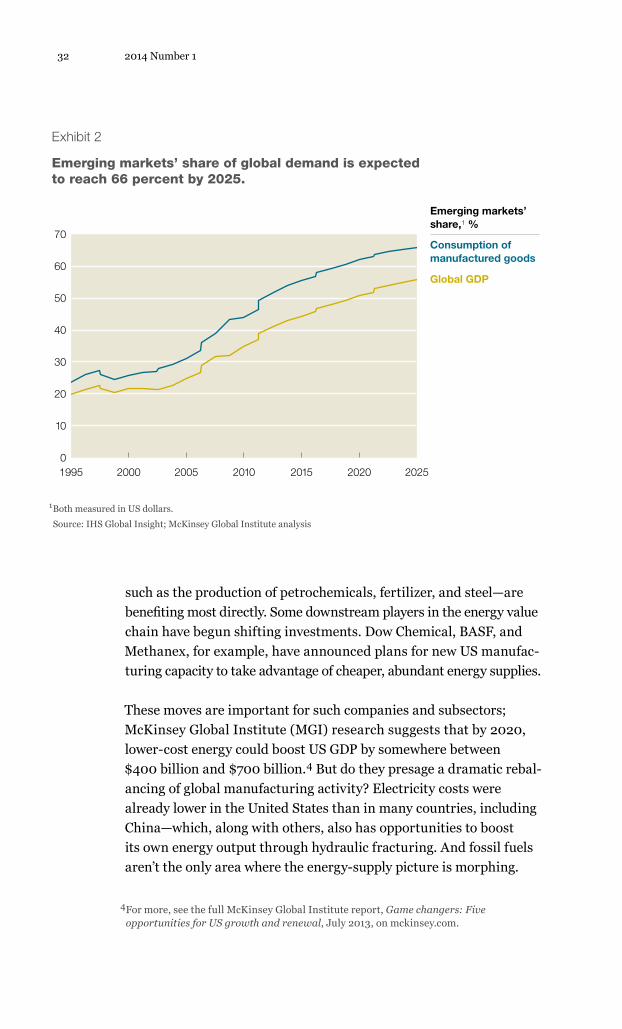
The emerging markets’ share of global demand is steadily climbing,
from roughly 40 percent in 2008 to an expected 66 percent by
2025 (Exhibit 2). As that share rises, it also is fragmenting into many
product varieties, feature and quality levels, price points, service
Exhibit 1
In the recent US industrial rebound, about 85 percent of the job growth in manufacturing occurred in automobiles, machinery, and regional-supplier industries.
Fabricated metals 174
Autos, other transport 162
Machinery 129
Primary metals 50
Rubber, plastics 38
Food, beverage 50
Other 43
Printing –38
Textiles, furniture –25
Other –32
8
7
Share of gross job growth in manufacturing, 2010–12,1 %
27
25
20
8
6
86%2
1 Figures do not sum to 100%, because of rounding.2Data reflect growth for local-supplier industries to the oil and gas sector, in addition to those for automobiles and machinery.
Source: US Bureau of Labor Statistics; McKinsey Global Institute analysis
Q1 2014Next ShoringExhibit 1 of 2
Gross job growth in US manufacturing during the recovery, Jan 2010 to Feb 2013, thousands of jobs
31
needs, and marketing channels. The regional, ethnic, income, and
cultural diversity of markets such as Africa, Brazil, China, and
India (where some local segments exceed the size of entire markets
in developed nations) is raising the ante for meeting local demand.
In the automobile industry, for example, fragmenting customer demand
has led to a 30 to 50 percent increase in the number of models.
Ninety percent of recent capital expenditures in the automotive sector
have involved product derivatives worldwide and capacity expan-
sions in new markets.
The limits of labor-cost arbitrage Surging local demand helps explain why rapid wage growth in China
hasn’t choked off manufacturing expansion there. Wages have
nearly doubled since 2008, partly as a result of domestic minimum-
wage policies.3 (The country’s 2011 five-year plan called for 13 percent
average annual minimum-wage increases, a rate some provinces
have already exceeded.) True, in a few labor-intensive, trade-oriented
industries, such as apparel production and consumer electronics,
labor-cost changes do tend to tip the balance between different geo-
graphic regions; manufacturing employment in Bangladesh and
Vietnam, for instance, has benefited from China’s wage surge, even
as Chinese manufacturers are seeking to raise productivity.
But these are far from the only implications of rising wages. Just as
Henry Ford’s $5 day helped create a new consuming class, so higher
wages in China are increasing local demand, thus reinforcing the
local-investment choices of OEMs and suppliers. At the same time,
there is little evidence of a zero-sum game between China and
advanced economies, such as the United States. Rather, the narrowing
labor-cost gap reinforces the importance of local demand factors
in driving manufacturing employment. Indeed, factor costs often have
the greatest impact on location decisions within a region—for example,
Airbus moving to Alabama instead of Texas or North Carolina.
These costs interact with policy factors, such as infrastructure spending
and tax incentives, to shape a region’s overall economic attractiveness.
The impact of energy costsThe price of natural gas in the United States has fallen by two-thirds
as gas production from shale deposits rose by 50 percent annually
since 2007. A narrow range of sectors—gas-intensive manufacturing,
Next-shoring: A CEO’s guide
3 Measured in nominal dollars.
32 2014 Number 1
such as the production of petrochemicals, fertilizer, and steel—are
benefiting most directly. Some downstream players in the energy value
chain have begun shifting investments. Dow Chemical, BASF, and
Methanex, for example, have announced plans for new US manufac-
turing capacity to take advantage of cheaper, abundant energy supplies.
These moves are important for such companies and subsectors;
McKinsey Global Institute (MGI) research suggests that by 2020,
lower-cost energy could boost US GDP by somewhere between
$400 billion and $700 billion.4 But do they presage a dramatic rebal-
ancing of global manufacturing activity? Electricity costs were
already lower in the United States than in many countries, including
China—which, along with others, also has opportunities to boost
its own energy output through hydraulic fracturing. And fossil fuels
aren’t the only area where the energy-supply picture is morphing.
Q1 2014Next ShoringExhibit 2 of 2
Emerging markets’ share of global demand is expected to reach 66 percent by 2025.
1 Both measured in US dollars.
Source: IHS Global Insight; McKinsey Global Institute analysis
Emerging markets’ share,1 %
0
10
20
30
40
50
60
1995 2000 2005 2010 2015 2020 2025
70Consumption of manufactured goods
Global GDP
Exhibit 2
4 For more, see the full McKinsey Global Institute report, Game changers: Five opportunities for US growth and renewal, July 2013, on mckinsey.com.
33
Consider, for example, the potential impact of energy-storage tech-
nologies, especially lithium-ion batteries and fuel cells, which are
becoming more capable and less costly. At the same time, the
improving economics of renewable-energy production—particularly
solar and wind power—offers manufacturers an expanding range
of future supply options. In some developing regions where power
grids are unreliable or nonexistent, factory complexes served by
distributed solar power may be feasible. Distributed generation is
also growing in combined heat–power (CHP) plants, which use
heat created in the production process to run steam turbines and
generate electricity locally.
None of these is a silver bullet today. But as advances continue over
time, more and more companies may become able to ask themselves
where they would place major strategic bets if the availability and
price of energy were lesser concerns. That too will probably lead back
to a focus on local demand patterns. Interestingly, the country
representing the greatest source of future demand growth—China—
also is actively stimulating the development of a range of new
energy sources and storage technologies through a focus on new
strategic industries in its five-year plans.5
Technology disruption ahead
Technology is affecting far more than energy dynamics. Advanced
robotics, 3-D printers, and the large-scale digitization of operations
are poised to alter fundamental assumptions about manufacturing
costs and footprints.6 To derive value from these shifts, companies
will have to make significant investments and ensure access to
hubs of innovation, capable suppliers, and highly skilled workers.
Advanced roboticsInvestments in industrial robots have increased by nearly 50 percent
since 2008—even in emerging nations such as China—as a new
generation of advanced systems develops, with greater dexterity and
ability to process information. These robots can perform an expanding
Next-shoring: A CEO’s guide
5 See Guangyu Li and Jonathan Woetzel, “What China’s five-year plan means for business,” July 2011, mckinsey.com.
6 For more, see Disruptive technologies: Advances that will transform life, business, and the global economy, McKinsey Global Institute, May 2013, on mckinsey.com.
34 2014 Number 1
array of factory tasks—for instance, manipulating small electronic
parts, and picking and packing individual products. They can
work side by side with humans and be trained by factory-floor oper-
ators rather than programmed by teams of highly paid engineers.
Improved economics and capabilities eventually may yield produc-
tivity gains that are unforeseen today, as well as better products
and faster speed to market. As that happens, companies will be able
to retool their manufacturing systems to provide new roles for
these mechanical “workers.”
Cheaper, more proficient robots that can substitute for a wider variety
of human tasks are another reason companies may locate more
manufacturing closer to major demand markets, even where wage
rates are higher. In developing nations, robots could speed up
rates of automation and help bridge shortages of some production
skills. MGI research suggests that 15 to 25 percent of the tasks
of industrial workers in developed countries and 5 to 15 percent of
those in developing countries could be automated by 2025.
Further out, highly robotized factories also equipped with other
information technologies might shift competition to areas such
as the ownership of customer networks, which should become
increasingly valuable as information embedded in them starts guiding
production priorities and flows. Flexible, intelligent assembly robots
also should enable contract manufacturers to serve an increasingly
diverse range of customers, creating new opportunities for attackers
to target attractive microsegments.
3-D printingThe economics of 3-D printing are improving rapidly, as well. While
still only a sliver of value in the manufacturing sector (0.02 percent),
sales of 3-D printers are set to double, to $4 billion, by 2015, and
prices for the equipment are declining swiftly.7 Also, 3-D printers open
up the possibility of more distributed production networks and
radical customization. In early manufacturing applications, some
companies are using the devices to accelerate product development,
since they eliminate wait times for prototyping by faraway
specialists. Companies will be able to consider new supply-chain
models and, in some cases, replace traditional suppliers of parts
with targeted usage of in-house printers.
7 Wohlers Report 2013: Additive Manufacturing and 3D Printing State of the Industry, Wohlers Associates, May 2013, wohlersassociates.com.
35
These printers won’t replace traditional high-volume modes of produc-
tion, such as die casting and stamping. For more specialized goods,
though, it’s easy to imagine the emergence of service businesses—the
equivalent of copy or print shops—that would manufacture items
based on design specifications provided by B2B or B2C customers.
Crowdsourcing networks for new-product ideas could one day
complement traditional R&D activities for some manufacturers. (For
more on 3-D printing, see “3-D printing takes shape,” on page 40.)
Digitized operations Significant as advanced robotics and 3-D printers are, they represent
just two plot lines in a much bigger story about the digitization
of operations. Cloud computing, mobile communications, and the
Internet of Things8 are beginning to combine with advanced
analytics to create threads of intelligent data that link assets and
stakeholders as never before. Increasingly, products will commu-
nicate with each other, with robots and advanced machines inside
factories, and with customers and suppliers. Digital “DNA” for
parts (including the materials, equipment, and time required to make
them) will also be increasingly available.
The implication is that we are approaching a day when manufacturers
will have unprecedented global visibility into who makes what,
where, and how well. They’ll be able to run virtual operations “war
rooms” on their phones. They’ll have new opportunities to solve
plant-floor optimization problems as intelligent machines interface
with each other and with people on the line. In the near future,
manufacturers also will exploit opportunities for crowdsourced design
and on-demand production. These opportunities will extend well
beyond goods made by 3-D printers; manufacturers will pursue the
buying and selling of previously underutilized production lines
“by the hour” and will rely on dynamic databases to determine what
every part should cost. And new forms of technology-enabled
collaboration, such as the three-dimensional virtual assembly and
testing of vehicles, will redefine what it means to be proximate to
innovation—which may be locally generated or accessed via broadband.
Digital operations aren’t a far-off fantasy. GE already has a 400-person
industrial Internet software team and its employees use iPads to run an
advanced battery factory in New York State. Amazon.com is employing
Next-shoring: A CEO’s guide
8 The growing collection of sensors and actuators embedded in products and equipment.
36 2014 Number 1
growing numbers of smart warehouse robots. Fiat has reduced the
number of physical prototypes needed to introduce a new product;
Alcoa has compressed prototyping time and costs for some products;
and an auto supplier recently slashed an eight-month prototyping
process to one week.
Next-shoring
Although these forces are still gathering strength, they’re already
pointing toward two defining priorities for manufacturing strategy
in the era of next-shoring: proximity to demand and proximity to
innovation, particularly an innovative base of suppliers. In developed
and emerging markets alike, both ingredients will be critical.
Next-shoring isn’t about the shift of manufacturing from one place
to another but about adapting to, and preparing for, the changing
nature of manufacturing everywhere.
Optimizing location decisionsBeing close to demand is particularly important at a time when
consumption in emerging markets is growing rapidly, boosting with
it the diversity of the regional preferences that manufacturers
must contend with. In a 2012 interview with McKinsey, Timken CEO
James Griffith explained his company’s approach: “Over the last
ten years, we’ve added a very strong Eastern European, Indian, and
Chinese manufacturing base,” not because wages are low there
“but because those were the markets that were growing.” This expan-
sion has been accompanied by a strategic shift away from a focus
on automotive parts—“we could make a car last for a million miles,
but nobody cares.” The new emphasis is on fast-growing mining,
trucking, steelmaking, and cement-making customers in emerging
markets. For them, Timken’s reliability is a decisive asset.9
Locating manufacturing close to demand makes it easier to identify
and meet local needs. It’s a delicate balancing act, though, to create an
efficient global manufacturing footprint that embraces a wide range
of local tastes, since economies of scale still matter in many industries.
Volkswagen has coped by moving from vehicle platforms to more
modular architectures that provide greater flexibility for manufacturing
several product variants or derivatives.
9 See “Manufacturing’s new era: A conversation with Timken CEO James Griffith,” December 2012, mckinsey.com.
37
New products, market segments, and consumer preferences are
combining with perennial risks (such as seasonal variations in demand
and fluctuations in wages and currency rates) to boost uncertainty
in manufacturing and supply networks. That uncertainty places a
premium on operational agility—the ability to adapt design, produc-
tion, and supply chains rapidly to fluctuating conditions.10 This too
may play into location decisions.
Take the experience of a consumer-products company that had relied
on one plant to supply its major market. When the company began
experiencing unaccustomed spikes in regional and seasonal purchasing
patterns, shortages and lost sales ensued. To accommodate rising
variations in demand, the company built a second plant, with similar
cost characteristics, in a different region. This additional capacity
helped ensure supplies to the prime market, where the problems were
most acute, while also allowing the company to meet growing
demand opportunistically in several new markets close to the new
plant. Although the investment was considerable, it lowered
the company’s risk exposure, eliminated damaging stockouts, and
improved the bottom line.
Building supplier ecosystemsNew combinations of technical expertise and local domain knowledge
will become the basis for powerful new product strategies. Responsive,
collaborative, and tech-savvy supplier ecosystems will therefore
be increasingly important competitive assets in a growing number of
regional markets. To keep up with the opportunities afforded by
technological change, for example, a major manufacturer that until
recently had relied on a low-cost supplier in Mexico for parts has
begun working with a new supplier that has cutting-edge 3-D printing
capabilities. The new relationship has lowered stocking costs (since
parts are made on demand), while providing avenues for developing
prototypes more quickly.
Examples like this are just a start. As information flows among partners
become more robust, they will usher in a range of improvements,
from surer logistics to better payment systems. These will create a
virtuous cycle of collaborative benefits. The supply bases of many
manufacturers thus may soon need significant upgrades and capital
Next-shoring: A CEO’s guide
10 For more on operational agility, see Mike Doheny, Venu Nagali, and Florian Weig, “Agile operations for volatile times,” McKinsey Quarterly, May 2012, mckinsey.com.
38 2014 Number 1
investments to create joint competencies in areas such as robotics.
Collaboration and management investment in skill-development
programs could be necessary as well. In some cases, it may be valuable
to collaborate with local or national governments to create the
conditions in which the manufacturing ecosystems of the future can
flourish. Tighter supply networks also will foster production systems
that reduce the need for virgin natural resources, a topic addressed in
more detail by our colleagues in “Remaking the industrial economy,”
on page 46.
A failure to develop innovative supply ecosystems will have growing
competitive implications for countries as well as companies. The
competitive challenges facing the United States sometimes look more
like a system failure than an economic one. US investment in advanced
robotics, for example, often lags behind that of other developed
economies, with trade deficits prevailing even in sectors where wage-
rate differentials aren’t a big influence on location decisions.
Developing people and skillsAll this will place a premium on manufacturing talent, creating a
range of regional challenges. In Europe and the United States,
educational institutions aren’t producing workers with the technical
skills advanced manufacturers need. In developing economies,
such as China, the millions of lower-cost production associates who
are well adapted to routine manufacturing may find it difficult to
climb to the next level. Line supervisors—often fresh out of regional
universities—struggle to manage baseline operations and to
coordinate teams. Organizations will need to invest more in formal
training and on-the-job coaching to bridge the gaps. They must
also cast a wider net, supporting local community colleges and tech-
nical institutes to shape curricula and gain access to new talent streams.
A related challenge is the need for new management muscle. As it
gets harder to hide behind labor-cost arbitrage, regional manufacturing
executives and midlevel managers will need to become both better
at running a tight operational ship and more versatile. They should
be able to grasp the productivity potential of a range of new tech-
nologies and have enough ground-level knowledge of local markets
to influence product strategies and investment trade-offs. The

39
ability to build external relationships—with suppliers, education
partners, and local-government officials who can influence the
development of vibrant, sophisticated supply ecosystems—will also
be a source of competitive advantage.
Next-shoring will look different in different locales, of course. Europe
and the United States have impressive advantages in areas such as
biopharmaceuticals, automotive engineering, and advanced materials.
China, meanwhile, is quickly climbing the expertise curve, with
increasingly sophisticated corporate and university research facilities
and growing experience in advanced processes and emerging
industries.11 In the world we’re entering, the question won’t be whether
to produce in one market for another but how to tailor product
strategies for each and how to match local needs with the latest veins
of manufacturing know-how and digital expertise. While the road
map for every company, industry, and location will be different, we
believe that the principles we’ve laid out here should be useful for all.
The authors would like to thank Michael Chui, James Manyika, and Venu Nagali for their contributions to this article.
Katy George is a director in McKinsey’s New Jersey office; Sree Ramaswamy is a fellow of the McKinsey Global Institute and is based in the Washington, DC, office; and Lou Rassey is a principal in the Chicago office.
11 See Gordon Orr and Erik Roth, “The CEO’s guide to innovation in China,” McKinsey Quarterly, February 2012; and “China’s innovation engine picks up speed,” McKinsey Quarterly, June 2013, both available on mckinsey.com.
Next-shoring: A CEO’s guide
40
3-D printing, or additive manufacturing,1 has come a long way from
its roots in the production of simple plastic prototypes. Today,
3-D printers can not only handle materials ranging from titanium to
human cartilage but also produce fully functional components,
including complex mechanisms, batteries, transistors, and LEDs.
The capabilities of 3-D printing hardware are evolving rapidly, too.
They can build larger components and achieve greater precision and
finer resolution at higher speeds and lower costs. Together, these
advances have brought the technology to a tipping point—it appears
ready to emerge from its niche status and become a viable alternative
to conventional manufacturing processes in an increasing number
of applications.
Should this happen, the technology would transform manufacturing
flexibility—for example, by allowing companies to slash development
time, eliminate tooling costs, and simplify production runs—while
making it possible to create complex shapes and structures that weren’t
feasible before. Moreover, additive manufacturing would help
companies improve the productivity of materials by eliminating the
waste that accrues in traditional (subtractive) manufacturing and
would thus spur the formation of a beneficial circular economy (for
3-D printing takes shape
Additive manufacturing is evolving quickly.
Senior executives should begin preparing
for five disruptions that will accompany it.
Daniel Cohen, Matthew Sargeant, and Ken Somers
1 Additive-manufacturing techniques build objects layer by layer, rather than through molding or “subtractive” techniques, such as machining.

41
more, see “Remaking the industrial economy,” on page 46). The
economic implications of 3-D printing are significant: McKinsey
Global Institute research suggests that it could have an impact
of up to $550 billion a year by 2025.2
The advantages of 3-D printing over other manufacturing tech-
nologies could lead to profound changes in the way many things
are designed, developed, produced, and supported. Here are
five 3-D printing disruptions that senior executives should begin
preparing for.
Accelerated product-development cycles
Reducing time in product development was a key benefit of the first
3-D printing machines, which were designed to speed the creation
of product prototypes (and in some cases helped reduce turnaround
times to a matter of hours, from days or weeks). Now many indus-
tries are poised for a second wave of acceleration as the line between
additive and conventional manufacturing blurs.
For example, additive manufacturing is already being used to get
prototypes into the hands of customers faster, for quicker and
more detailed feedback. (This is happening thanks to advances in
printer resolution, higher-definition coloration, and the broader
use of materials, such as elastomers, that help customers envision
the final product.) The ability to make prototypes without tooling
lets companies quickly test multiple configurations to determine cus-
tomer preferences, thus reducing product-launch risk and time to
market. Companies could even go into production using 3-D printed
parts and start selling products while the traditional production
tools were still being manufactured or before the decision to produce
them had been made. When companies did order those tools, they
could use additive-manufacturing techniques to make them, saving
even more time and money.
We expect that the use of such techniques will contribute to significant
reductions in product-development cycle times over the next decade.
(For example, 3-D printing makes some aspects of day-to-day R&D
2 For the full McKinsey Global Institute report, see Disruptive technologies: Advances that will transform life, business, and the global economy, May 2013, on mckinsey.com.
42 2014 Number 1
work, such as producing simple lab apparatus, vastly more productive.)
Over time, 3-D printing will begin to affect how companies think
about R&D more broadly, given how the technology enhances the
ability to crowdsource ideas through remote cooperation. For some
companies, that crowdsourced brainpower might one day begin
supplanting R&D activities, making its management a new priority.
New manufacturing strategies and footprints
As of 2011, only about 25 percent of the additive-manufacturing
market involved the direct manufacture of end products. With a
60 percent annual growth rate, however, that is the industry’s
fastest-growing segment. As costs continue to fall and the capabilities
of 3-D printers increase, the range of parts that can be economi-
cally manufactured using additive techniques will broaden dramat-
ically. Boeing, for example, already uses printers to make some
200 part numbers for ten different types of aircraft, and medical-
products companies are using them to create offerings such as
hip replacements.3
Nonetheless, not every component will be a candidate for the tech-
nology and reap its benefits (cost reductions, performance improve-
ments, or both). Companies should understand the characteristics
that help determine which ones are. These include components with
a high labor-cost element (such as time-consuming assembly and
secondary machining processes), complex tooling requirements or
relatively low volumes (and thus high tooling costs), or high obso-
lescence or scrap rates. Forward-looking manufacturers are already
investigating ways of triaging their existing parts inventories to
determine which hold the most potential.
Additive-manufacturing techniques also have implications for
manufacturing-footprint decisions. While there is still a meaningful
labor component to 3-D printed parts, the fact that it is lower than
that of conventionally manufactured ones might, for example, tip the
balance toward production closer to end customers. Alternatively,
companies could find that the fully digital nature of 3-D printing
3 For example, the Mayo Clinic uses 3-D printed hip-joint models—which are based on patient CT scans—to run practice surgeries. Later, the models are sent to a manufacturer that produces custom implants.
43
makes it possible to produce complex parts in remote countries with
lower input costs for electricity and labor.
A related area that executives should watch with interest is the
development of the market for printing materials. The cost of future
materials is uncertain, as today many printers use proprietary
ones owned or licensed by the manufacturer of the printing equipment.
Should this change and more universal standards develop—thus
lowering prices—the implications for executives devising manufac-
turing strategies and making footprint decisions would become
very significant very quickly.
Shifting sources of profit
Additive-manufacturing technologies could alter the way compa-
nies add value to their products and services. The outsourcing of
conventional manufacturing helped spur companies such as Nike
to rely more on their design skills. Likewise, 3-D printing techniques
could reduce the cost and complexity of other kinds of production
and force companies to differentiate their products in other ways.
These could include everything from making products more easily
reparable (and thus longer lived) to creating personalized designs.
Indeed, reducing the reliance on hard tooling (which facilitates the
manufacture of thousands of identical items) creates an opportunity
to offer customized or bespoke designs at lower cost—and to a far
broader range of customers. The additive manufacture of individualized
orthodontic braces is just one example of the potential of these
technologies. As more such offerings become technically viable, com-
panies will have to determine which are sufficiently appealing and
commercially worthwhile. The combination of mass customization
and new design possibilities will up the ante for many companies
and could prove very disruptive to traditional players in some segments.
In certain parts of the value chain, the application of additive
manufacturing will be less visible to customers, although its impact
may be just as profound. A key challenge in traditional aftermarket
supply chains, for example, is managing appropriate inventories
of spare parts, particularly for older, legacy products. The ability to
3-D printing takes shape

44 2014 Number 1
manufacture replacement parts on demand using 3-D printers
could transform the economics of aftermarket service and the
structure of industries. Relatively small facilities with on-site additive-
manufacturing capabilities could replace large regional ware-
houses. The supply of service parts might even be outsourced: small
fabricators (or fabs) located, for example, at airports, hospitals,
or major manufacturing venues could make these parts for much of
the equipment used on site, with data supplied directly by the
manufacturers.
Of course, retailers too could someday use fabs—for example, to let
customers tailor products such as toys or building materials to
suit their needs. That business model could represent a value-chain
play for manufacturers if, for instance, they owned the machines,
core designs, or both.
New capabilities
Design is inherently linked to methods of fabrication. Architects
can’t design houses without considering construction techniques, and
engineers can’t design machines without considering the benefits
and limitations of casting, forging, milling, turning, and welding.
While there is a wealth of knowledge around design for manufacturing,
much less is available on design for printing. Our conversations
with executives at manufacturing companies suggest that many are
aware of this gap and scrambling to catalog their design know-how.
Getting the most out of additive-manufacturing techniques also
involves technical challenges, which include setting environmental
parameters to prevent shape distortion, optimizing the speed
of printing, and adjusting the properties of novel materials. Indeed,
tuning materials is quite a challenge. While plastics are relatively
straightforward to work with, metals are more difficult. Slurries and
gels (for example, living tissue or the material for printed zinc–air
batteries) are extremely difficult.
The most successful players will understand these challenges. Some
are already creating centers of excellence and hiring engineers with
strong experience in additive manufacturing.
45
Disruptive competitors
Many benefits of 3-D printing could cut the cost of market entry for
new players: for example, the use of the technology to lower tooling
costs makes it cheaper to begin manufacturing, even at low volumes,
or to serve niche segments. The direct manufacturing of end
products greatly simplifies and reduces the work of a designer who
would only have to take products from the computer screen to
commercial viability. New businesses are already popping up to offer
highly customized or collaboratively designed products. Others
act as platforms for the manufacture and distribution of products
designed and sold online by their customers. These businesses are
gaining insights into consumer tastes and building relationships that
established companies could struggle to match.
Initially, these new competitors will be niche players, operating where
consumers are willing to pay a premium for a bespoke design,
complex geometry, or rapid delivery. Over the longer term, however,
they could transform industries in unexpected ways, moving the
source of competitive advantage away from the ability to manufacture
in high volumes at low cost and toward other areas of the value
chain, such as design or even the ownership of customer networks.
Moreover, the availability of open-source designs for 3-D printed
firearms shows how such technologies have the potential to create
ethical and regulatory dilemmas and to disrupt industries.
3-D printing takes shape
The authors would like to thank Michael Chui and Markus Hammer for their contributions to this article.
Daniel Cohen is a consultant in McKinsey’s New York office, Matthew Sargeant is a consultant in the Stamford office, and Ken Somers is a master expert in the Antwerp office.
Copyright © 2014 McKinsey & Company. All rights reserved.

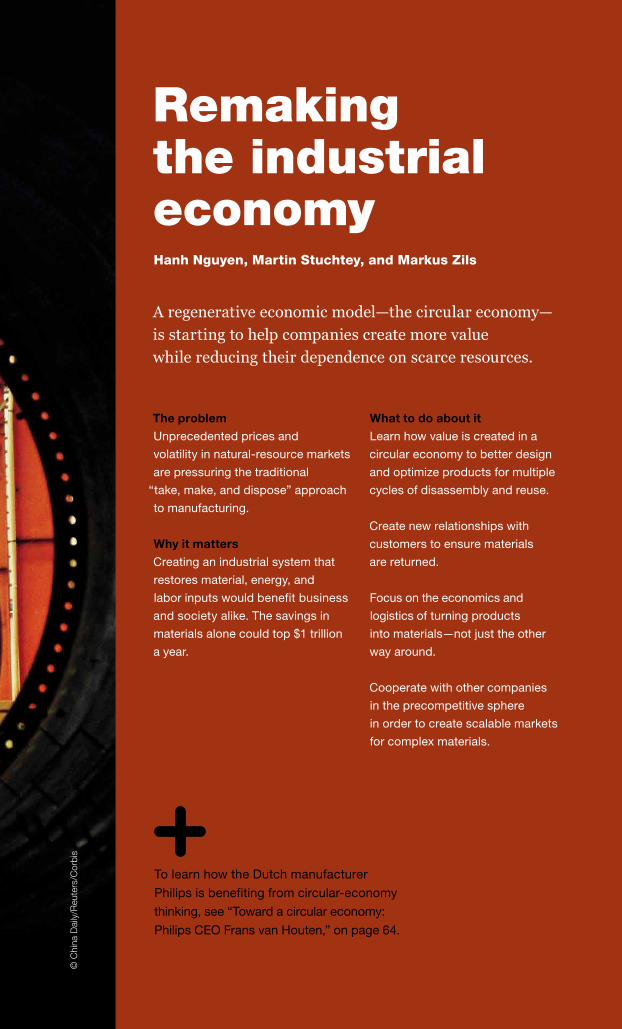
A regenerative economic model—the circular economy—
is starting to help companies create more value
while reducing their dependence on scarce resources.
Hanh Nguyen, Martin Stuchtey, and Markus Zils
Remaking the industrial economy
The problem
Unprecedented prices and
volatility in natural-resource markets
are pressuring the traditional
“take, make, and dispose” approach
to manufacturing.
Why it matters
Creating an industrial system that
restores material, energy, and
labor inputs would benefit business
and society alike. The savings in
materials alone could top $1 trillion
a year.
What to do about it
Learn how value is created in a
circular economy to better design
and optimize products for multiple
cycles of disassembly and reuse.
Create new relationships with
customers to ensure materials
are returned.
Focus on the economics and
logistics of turning products
into materials—not just the other
way around.
Cooperate with other companies
in the precompetitive sphere
in order to create scalable markets
for complex materials.
To learn how the Dutch manufacturer
Philips is benefiting from circular-economy
thinking, see “Toward a circular economy:
Philips CEO Frans van Houten,” on page 64.
© C
hina
Dai
ly/R
eute
rs/C
orbi
s
48
Visualize, for a moment, the industrial economy as a massive
system of conveyor belts—one that directs materials and energy
from resource-rich countries to manufacturing powerhouses, such
as China, and then spirits the resulting products onward to the
United States, Europe, and other destinations, where they are used,
discarded, and replaced. While this image is an exaggeration, it
does capture the essence of the linear, one-way production model
that has dominated global manufacturing since the onset of the
Industrial Revolution.
Increasingly, however, the linear approach to industrialization has
come under strain. Some three billion consumers from the developing
world will enter the middle class by 2030. The unprecedented size
and impact of this shift is squeezing companies between rising and
less predictable commodity prices, on the one hand, and blistering
competition and unpredictable demand, on the other. The turn
of the millennium marked the point when a rise in the real prices of
natural resources began erasing a century’s worth of real-price
declines. The biggest economic downturn since the Great Depression
briefly dampened demand, but since 2009, resource prices have
rebounded faster than global economic output (Exhibit 1). Clearly, the
era of largely ignoring resource costs is over.
In light of volatile markets for resources, and even worries about
their depletion, the call for a new economic model is getting louder.
In response, some companies are questioning the assumptions
that underpin how they make and sell products. In an effort to keep
control over valuable natural resources, these companies are
finding novel ways to reuse products and components. Their success
provokes bolder questions. Could economic growth be decoupled
from resource constraints? Could an industrial system that is regen-
erative by design—a “circular economy,” which restores material,
energy, and labor inputs—be good for both society and business? If
the experience of global automaker Renault is any indicator, the
answer appears to be yes.
• Renault’s plant in Choisy-le-Roi, near Paris, remanufactures
automotive engines, transmissions, injection pumps, and other
components for resale. The plant’s remanufacturing operations
use 80 percent less energy and almost 90 percent less water (as
well as generate about 70 percent less oil and detergent waste)
2014 Number 1
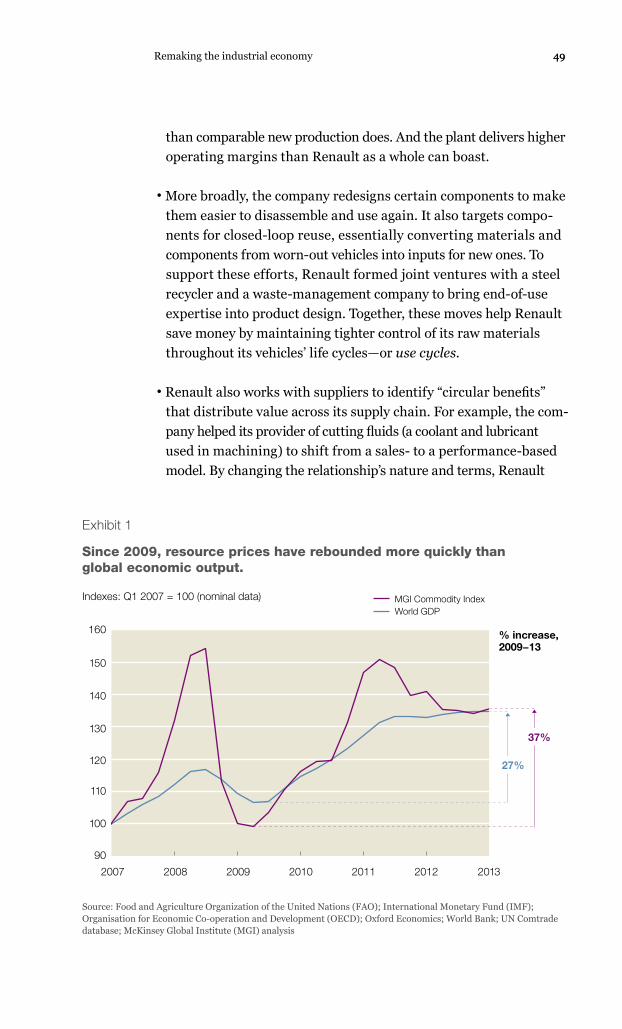
4949
than comparable new production does. And the plant delivers higher
operating margins than Renault as a whole can boast.
• More broadly, the company redesigns certain components to make
them easier to disassemble and use again. It also targets compo-
nents for closed-loop reuse, essentially converting materials and
components from worn-out vehicles into inputs for new ones. To
support these efforts, Renault formed joint ventures with a steel
recycler and a waste-management company to bring end-of-use
expertise into product design. Together, these moves help Renault
save money by maintaining tighter control of its raw materials
throughout its vehicles’ life cycles—or use cycles.
• Renault also works with suppliers to identify “circular benefits”
that distribute value across its supply chain. For example, the com-
pany helped its provider of cutting fluids (a coolant and lubricant
used in machining) to shift from a sales- to a performance-based
model. By changing the relationship’s nature and terms, Renault
Exhibit 1
Q1 2014Circular economy Exhibit 1 of 3
Since 2009, resource prices have rebounded more quickly than global economic output.
Source: Food and Agriculture Organization of the United Nations (FAO); International Monetary Fund (IMF); Organisation for Economic Co-operation and Development (OECD); Oxford Economics; World Bank; UN Comtrade database; McKinsey Global Institute (MGI) analysis
Indexes: Q1 2007 = 100 (nominal data)
160
2007 2008 2009 2010 2011 2012 2013
150
140
13037%
120
110
100
90
MGI Commodity IndexWorld GDP
27%
% increase, 2009−13
Remaking the industrial economy
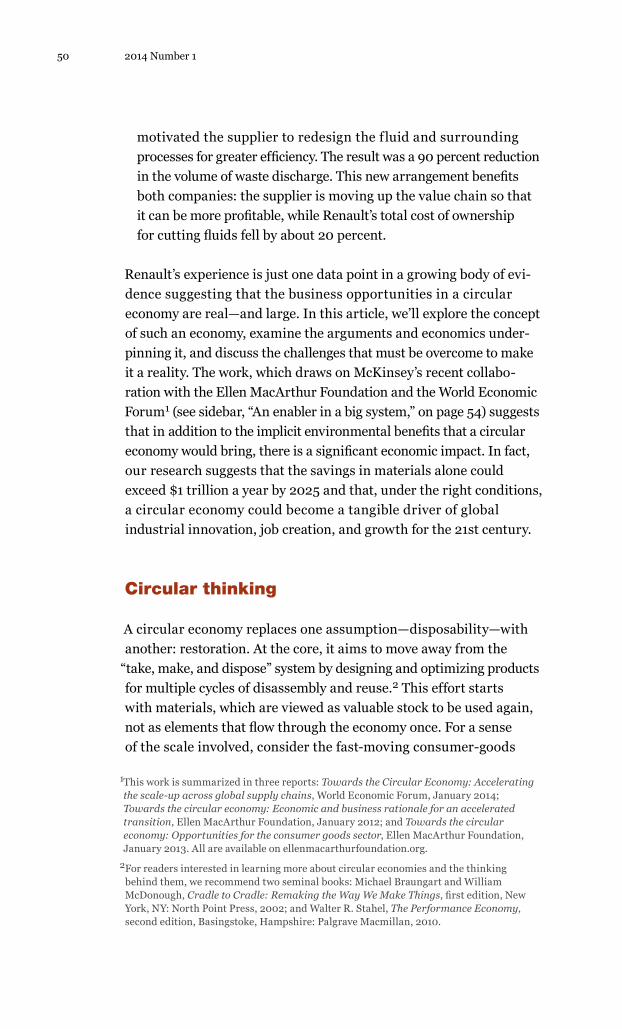
50 2014 Number 1
motivated the supplier to redesign the fluid and surrounding
processes for greater efficiency. The result was a 90 percent reduction
in the volume of waste discharge. This new arrangement benefits
both companies: the supplier is moving up the value chain so that
it can be more profitable, while Renault’s total cost of ownership
for cutting fluids fell by about 20 percent.
Renault’s experience is just one data point in a growing body of evi-
dence suggesting that the business opportunities in a circular
economy are real—and large. In this article, we’ll explore the concept
of such an economy, examine the arguments and economics under-
pinning it, and discuss the challenges that must be overcome to make
it a reality. The work, which draws on McKinsey’s recent collabo-
ration with the Ellen MacArthur Foundation and the World Economic
Forum1 (see sidebar, “An enabler in a big system,” on page 54) suggests
that in addition to the implicit environmental benefits that a circular
economy would bring, there is a significant economic impact. In fact,
our research suggests that the savings in materials alone could
exceed $1 trillion a year by 2025 and that, under the right conditions,
a circular economy could become a tangible driver of global
industrial innovation, job creation, and growth for the 21st century.
Circular thinking
A circular economy replaces one assumption—disposability—with
another: restoration. At the core, it aims to move away from the
“take, make, and dispose” system by designing and optimizing products
for multiple cycles of disassembly and reuse.2 This effort starts
with materials, which are viewed as valuable stock to be used again,
not as elements that flow through the economy once. For a sense
of the scale involved, consider the fast-moving consumer-goods
1 This work is summarized in three reports: Towards the Circular Economy: Accelerating the scale-up across global supply chains, World Economic Forum, January 2014; Towards the circular economy: Economic and business rationale for an accelerated transition, Ellen MacArthur Foundation, January 2012; and Towards the circular economy: Opportunities for the consumer goods sector, Ellen MacArthur Foundation, January 2013. All are available on ellenmacarthurfoundation.org.
2 For readers interested in learning more about circular economies and the thinking behind them, we recommend two seminal books: Michael Braungart and William McDonough, Cradle to Cradle: Remaking the Way We Make Things, first edition, New York, NY: North Point Press, 2002; and Walter R. Stahel, The Performance Economy, second edition, Basingstoke, Hampshire: Palgrave Macmillan, 2010.

51
industry: about 80 percent of the $3.2 trillion worth of materials it
uses each year is not recovered.
The circular economy aims to eradicate waste—not just from manufac-
turing processes, as lean management aspires to do, but system-
atically, throughout the various life cycles and uses of products and
their components. (Often, what might otherwise be called waste
becomes valuable feedstock for successive usage steps.) Indeed, tight
component and product cycles of use and reuse, aided by product
design, help define the concept of a circular economy and distinguish
it from recycling, which loses large amounts of embedded energy
and labor.
Moreover, a circular system introduces a strict differentiation
between a product’s consumable and durable components. Manufac-
turers in a traditional economy often don’t distinguish between
the two. In a circular economy, the goal for consumables is to use non-
toxic and pure components, so they can eventually be returned to
the biosphere, where they could have a replenishing effect. The goal
for durable components (metals and most plastics, for instance) is
to reuse or upgrade them for other productive applications through
as many cycles as possible (Exhibit 2). This approach contrasts
sharply with the mind-set embedded in most of today’s industrial
operations, where even the terminology—value chain, supply
chain, end user—expresses a linear view.
Since restoration is the default assumption in a circular economy,
the role of consumer is replaced by that of user. For companies, this
change requires a different way of thinking about their implicit
contract with customers. For example, in a buy-and-consume economy,
the goal is to sell the product. In a circular economy, the aspiration
might be to rent it out to ensure that its materials were returned
for reuse. When products must be sold, companies would create incen-
tives to guarantee their return and reuse. While all this might
sound rather utopian, a number of companies are starting to pull
four (often mutually reinforcing) levers to convert theory into
hard-hitting practice.
1. The power of the inner circleRicoh, a global maker of office machines, designed its GreenLine
brand of office copiers and printers to maximize the reusability of
Remaking the industrial economy
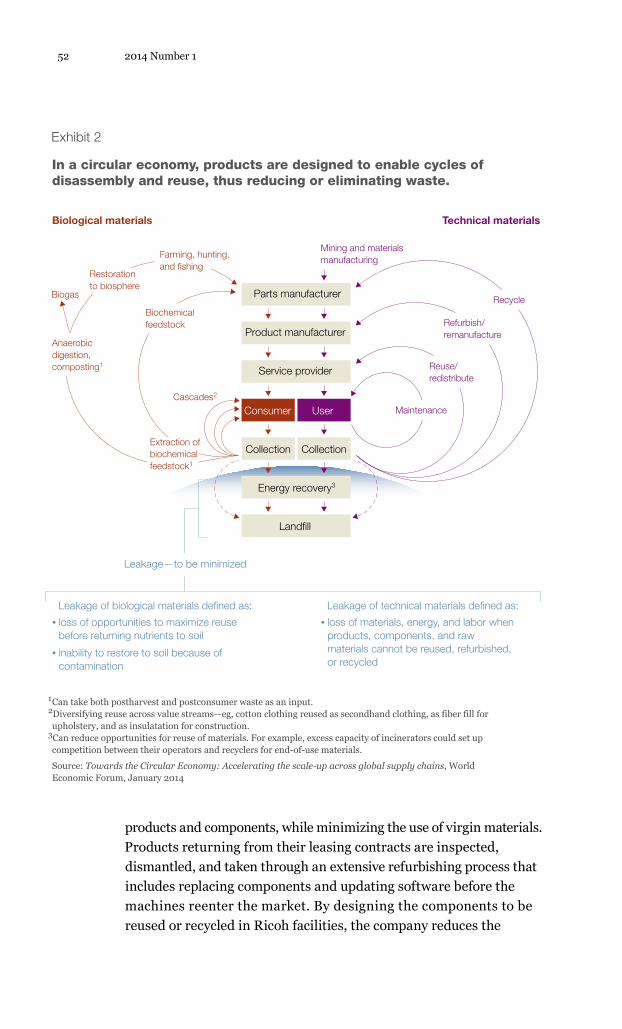
52 2014 Number 1
products and components, while minimizing the use of virgin materials.
Products returning from their leasing contracts are inspected,
dismantled, and taken through an extensive refurbishing process that
includes replacing components and updating software before the
machines reenter the market. By designing the components to be
reused or recycled in Ricoh facilities, the company reduces the
Q1 2014Circular economy Exhibit 2 of 3
In a circular economy, products are designed to enable cycles of disassembly and reuse, thus reducing or eliminating waste.
1 Can take both postharvest and postconsumer waste as an input.2Diversifying reuse across value streams—eg, cotton clothing reused as secondhand clothing, as fiber fill for upholstery, and as insulatation for construction.
3Can reduce opportunities for reuse of materials. For example, excess capacity of incinerators could set up competition between their operators and recyclers for end-of-use materials.
Source: Towards the Circular Economy: Accelerating the scale-up across global supply chains, World Economic Forum, January 2014
Biological materials
Biochemical feedstock
Parts manufacturer
Product manufacturer
Mining and materials manufacturing
Refurbish/ remanufacture
Leakage—to be minimized
Leakage of biological materials defined as:
Reuse/ redistribute
Service provider
Cascades2
Collection
Energy recovery3
Landfill
Consumer User
Recycle
Collection
Anaerobic digestion,composting1
Extraction of biochemical feedstock1
Restoration to biosphere
Technical materials
Maintenance
Farming, hunting, and fishing
Biogas
• loss of opportunities to maximize reuse before returning nutrients to soil
• inability to restore to soil because of contamination
Leakage of technical materials defined as:
• loss of materials, energy, and labor when products, components, and raw materials cannot be reused, refurbished, or recycled
Exhibit 2
53
need for new materials in production and creates a tight “inner circle”
of use that allows it to employ less material, labor, energy, and capital.
GreenLine products are now offered in six major European markets,
where they account for 10 to 20 percent of Ricoh’s sales by volume and
earn margins that are as much as two times higher than those of the
company’s comparable new products—without a reduction in quality.
For products that can’t be remanufactured, refurbished, or upgraded,
Ricoh harvests the components and recycles them at local facilities.
The company is currently considering a plan to return some recycled
materials to its manufacturing plants in Asia for use in making new components. After factoring in the price differences between virgin
and recycled materials (polypropylene, for example) and the cost of
Asia-bound container shipping, Ricoh estimates it could save up to
30 percent on the cost of materials for these components. Overall, the
company says, it’s on track to reduce the input of new resources in
its products by 25 percent below their 2007 levels no later than 2020.
2. The power of circling longerA closely related way companies can benefit from a circular economy
is to maximize the number of consecutive product cycles (cycles
of reuse, repair, or remanufacture), the time products spend in each of
them, or both. If designed appropriately, each additional cycle
eliminates some measure of the net material, energy, and labor costs
of creating a new product or component. For example, Renault leases
batteries for electric cars, in large part to recover them more easily
so they can be reengineered or recycled for additional duty. Keeping
close control over the process helps ensure the product’s quality and
gives Renault a chance to strengthen its ties to customers.
Leasing isn’t new in the automotive industry, of course: tire-maker
Michelin leased automobile tires in the 1920s. In 2011, Michelin Fleet
Solutions had 290,000 vehicles under contract in more than
20 European countries. The group offers tire upgrades, maintenance,
and replacement to optimize the performance of trucking fleets
and to lower their total cost of ownership. By maintaining control over
the tires, Michelin can collect them when they wear out and can
extend their technical utility by retreading or regrooving them for
resale. The company estimates that retreads, for example, require
half of the raw materials new tires do but deliver up to 90 percent of
the performance.
Remaking the industrial economy
54 2014 Number 1
Meanwhile, in a few stores, the UK-based retailer B&Q is piloting a
take-back program for its power tools. Customers can exchange
used ones either for cash or a charity donation. The company plans
to refurbish the tools it collects in Europe for resale locally or to
recycle them and thus recover raw materials that could be used to
make new power tools in the company’s facilities in China. Our
research suggests that the margin-improvement potential, primarily
resulting from savings in the cost of materials, could be as high as
ten percentage points.
3. The power of cascaded useAnother source of value creation is to take a product or component
and diversify its reuse more widely across the value chain,
redistributing the materials so they can substitute for inflows of
When you set off around the world on a boat, you know that you only have
so much food, so much diesel. And you become incredibly connected
to those resources. As you watch those resources go down, you understand
just what “finite” means because you’re two and a half thousand miles
from the nearest town. I realized that our global economy is no different—
powered by resources that are ultimately finite—and that there is a much
greater challenge out there than sailing around the world. Our global eco-
nomic system relies on taking something out of the ground and making it
into something else, and the material or the product it’s made into ultimately
gets thrown away. In the long term, that just can’t work. When you finish
a round-the-world journey on a boat, you can restock and do it again. But
we’re not able to do that on a global economic scale.
One of the most striking things I learned from talking to analysts and investors
is that a century of real declines in commodity prices was erased in just
ten years. That increase in, and growing volatility of, raw-materials prices
means that the conversation with businesses quickly turns to efficiency
and the need to use less energy in manufacturing. Businesses are receptive
because they understand that there will be further pressure on commodity
prices as three billion new middle-class consumers are created in emerging
An enabler in a big system
Dame Ellen MacArthur made history in 2005, when she became the fastest solo
sailor to circumnavigate the globe. She now leads the Ellen MacArthur Foundation,
an organization that works with businesses, universities, and governments to
accelerate the transition to a circular economy.

55
virgin ones somewhere else. For example, the Australian property
and infrastructure company Lend Lease uses scrapped-wood
chips from timber mills to create cross-laminated timber panels
for construction.
Global apparel retailer H&M launched an in-store collection program
encouraging customers to bring in old clothes in exchange for
discount vouchers on new H&M clothing. The company partners with
I:CO, a reverse-logistics provider, to sort the clothes for a range
of subsequent “cascaded” uses.3 The majority of items collected are
dispatched to the global secondhand-apparel market. Clothes
that are no longer suitable to wear are used as substitutes for virgin
markets. It’s not just about tweaking
the system—it’s about rethinking how
the economy can run in the long term.
When we set up the foundation,
in 2010, our goal was, first, to
demonstrate the economics through
analysis. Second, to work with
business, we created the Circular
Economy 100 platform, bringing
together corporations such as Coca-
Cola, H&M, and Unilever; emerging
innovators and small businesses;
and regions. Finally, we are working
with universities in Europe, the
United States, and India, and next year will be adding universities in China
and Brazil. We see ourselves as an enabler in a big system. In the first three
years, we have seen the “circular economy” move from a phrase that was
barely used to something that is becoming mainstream, and we’re glad to have
helped this framework become credible. Now we’re into a phase where
companies need to take this on and unlock more value. And the faster that
happens, the faster everyone else will be chasing. This isn’t something
that needs to take 50 years, though. It can happen a lot more quickly.
This commentary is adapted from an interview with Tim Dickson,
a member of McKinsey Publishing who is based in the London office.
3 Cascading is the process of putting materials and components to use, across value streams and industries, after their end of life.
For the full video interview, see “Navigating the circular economy: A conversation with Dame Ellen MacArthur,” on mckinsey.com.
Remaking the industrial economy
56 2014 Number 1
materials in other applications—for example, as cleaning cloths
and textile yarns or as inputs for damping and insulation materials
in the auto industry or for pipe insulation in the construction
industry. When all other options are exhausted, the remaining textiles
(1 to 3 percent, according to I:CO estimates) become fuel to pro-
duce electricity.
H&M executives view the program as a way to increase in-store traffic
and customer loyalty. It is also the first step in the company’s longer-
term goal of recycling all of its textile fibers for additional purposes
and using yarns made from collected textiles in its new products—
a move that would bring greater arbitrage opportunities.
4. The power of pure inputsThe final way companies can benefit from the principles of a circular
economy is by designing products and components so they are
easier to separate into consumable and durable elements later on, thus
helping to ensure the purity and nontoxicity of materials along
the manufacturing process. Greater ease of separation also increases the
efficiency of collection and redistribution while maintaining
the quality of the materials—a crucial economic consideration and
often a substantial challenge. In the United States, for example,
less than one-third of the rubble generated during the construction
and demolition of buildings is recycled or reused, though it con-
tains high concentrations of recyclable steel, wood, and concrete.4
Even in paper recycling (where the inputs are generally considered
“pure” and recycling rates approach 80 percent in Europe), the
difficulty of removing inks, fillers, and coatings from paper without
degrading it results in a loss of materials worth $32 billion a year.
In some cases, companies work with their supply partners to create
ecosystems that support circular product designs. For example,
Desso, a Dutch manufacturer of carpets, operates a take-back program
that collects end-of-use carpet tiles to recover their materials for
further production or for sale to secondary materials suppliers. The
carpet-backing material can be fully recycled in the company’s
own production processes; Desso’s supplier, Aquafil, converts the
Nylon 6–based top yarn back into new yarn. Because the nylon
inputs are pure, they can be reused over and over again without
degradation. In general, designing a product to use the purest
4 Buildings and Their Impact on the Environment: A Statistical Summary, revised April 22, 2009, US Environmental Protection Agency, epa.gov.
57
materials possible helps maintain their residual value and supports
recycling and reuse.
Squaring the circle
Given the potential of the circular economy to replace untapped
value through resource arbitrage, why isn’t it taking off faster? Three
barriers have slowed the realization of that potential; each holds
clues about moves companies can make to convert themselves from
linear to circular economics.
Geographic dispersionThe most tangible barrier for corporate decision makers is all around
them, in the extensive supply and manufacturing footprints that
companies have created to thrive in the linear economy. This problem
is evident even in seemingly simple products. For example, B&Q
estimates that its cordless drills contain up to 80 components derived
from 14 raw materials sourced in as many as seven countries. A
product such as a car is significantly more complex. Understandably,
closing product and component loops for most products is difficult,
despite attractive arbitrage opportunities.
Moreover, good standards for reusable materials require global support,
which is not always present. Whether companies attempt to create
closed global loops (like Ricoh) or geographically open cascades (as
H&M and I:CO are attempting to do in the apparel industry), there
is always a risk that an efficient and effective collection, reuse, and
recycling process will break down. That is particularly true in devel-
oping countries, where the collection and recycling of valuable
end-of-use materials frequently falls to the informal sector. In China,
for example, the formal sector covers only about 20 percent of
the “e-waste” collected.5 Without adequate standards, reprocessing
is inefficient and, worse, creates health and safety hazards for the
workers involved.
To get a handle on the challenge of geographic dispersion, senior
executives must start thinking as hard about reverse-network activities
(moving from products to components to materials) as they do
about the traditional inbound ones. They will have to deal with a
5 Euromonitor; expert interviews.
Remaking the industrial economy
58 2014 Number 1
host of thorny trade-offs. Should refurbishment take place in the
region of manufacture or of usage? When is it more economical to
reduce components to their constituent materials and sell them on
global markets? How cost effective would it be to establish postusage
loops with business partners as opposed to making new compo-
nents with virgin materials?
Developing a clear picture of the economics will be crucial, as will
the ability to create “win–win” partnerships. For example, in exchange
for lower prices and guaranteed access to supplies, Philips Healthcare
returns used components to its suppliers and lets them decide
whether to reuse the components for new builds and service parts or
to sell them to raw-materials suppliers as high-quality, recyclable
(or even ready-to-use) feedstock. (See “Toward a circular economy:
Philips CEO Frans van Houten,” on page 64.)
Reverse-logistics skills (such as collection, sorting, remanufacturing,
and refurbishment) will be critical. One of the success factors in
Ricoh’s GreenLine operations is the company’s “take-back” system,
which optimizes supply and demand for remanufactured machines.
This system requires sophisticated reverse-network-management
capabilities, such as tracking the location and condition of used devices
and components, as well as storing bill-of-materials information.
Complex materialsThe second point of leakage involves the sheer complexity and
proliferation of modern product formulations, which are rarely labeled
or made public and are therefore devilishly difficult to identify
after the fact, even for manufacturers. In the world of plastics, for
example, companies have broadened the spectrum of materials
used, in creative and complex ways. Most innovations in polymer-
materials science have come courtesy of new additives that act,
for example, as heat stabilizers, f lame retardants, pigments, or
antimicrobial agents.
In addition, the proliferation of materials can come from sheer habit
or even management inattention. Companies, for example, often
add materials to cut costs or innovate and then later fail to revisit these
decisions; in their purchasing practices, say, they might introduce
16 plastics, where 4 would cover all functional specifications and
application needs. These problems have exponentially increased
the complexity of materials, while making it hard to classify and

59
collect them on the scale required to create arbitrage opportunities
or to demonstrate the returns needed to attract investors.
Moreover, companies often have no cost-efficient way of using chemical
or physical processes to extract embedded raw materials without
degrading the product, so most of the original value is lost in current,
smelter-based recycling processes. For example, only $3 worth of
gold, silver, and palladium can currently be extracted from a mobile
phone that, when new, contains $16 worth of raw materials.
Despite the difficulties, some companies are making progress.
Veolia’s Magpie materials-sorting system, for example, uses infrared
and laser technologies to sort some plastics quickly. The company’s
facility in Rainham, in the United Kingdom, can separate nine
grades of plastics while processing 50,000 metric tons of them a year.
Nonetheless, current technologies still depend on accurate (and
often manual) presorting, which must meet minimum purity require-
ments to ensure an economically viable yield.
As Veolia’s example suggests, tackling the problem of complex materials
will ultimately come down to extracting them at scale, so that
they have a marketable value. This will in turn require companies to
cooperate in the precompetitive sphere. Arbitrage opportunities
already exist across the value chain—from raw-materials suppliers to
product manufacturers, players in end-of-use management, and
suppliers of the enabling information technologies. Successful first
movers could capture significant economic benefits, including an
outsized influence on global standards or on the design of products
and supply chains.
The curse of the status quoThe final barrier against a circular economy is the sheer difficulty of
breaking ingrained habits. Many aspects of the current system
reflect decisions made long ago. While some are relatively innocuous
(for instance, QWERTY keyboards and the shape of power plugs),
others incur higher costs.
Misaligned incentives dot the industrial landscape, making it hard to
create, capture, and redistribute value. Customers, for instance,
are used to evaluating the expense of products only at the point of
sale, even if costlier but longer-lasting products would be more
economical in the long term. Leasing models are unheard of in many
Remaking the industrial economy
60 2014 Number 1
industries, though they would benefit both customers and companies.
Research from the Ellen MacArthur Foundation suggests, for
example, that leasing high-end home washing machines would lower
the cost of use for customers by one-third over five years. During
that time, manufacturers would earn roughly one-third more in profits
because they could lease their fleets of machines multiple times
before refurbishment.6
Ingrained habits within companies also thwart change. Senior exec-
utives rightly worry about the higher levels of capital needed to
change products, as well as the friction of moving from familiar sales-
to usage-based approaches. One of the biggest concerns for Ricoh’s
executives before launching GreenLine, for example, was that it might
cannibalize new products. Only after creating a control plan to
monitor sales of GreenLine and other offerings was the company
confident that it could guarantee strong coverage across different
customer segments while not cannibalizing its products.
Misaligned incentives also exist between companies. Dividing the
gains from optimized designs of more circular products or processes
is tricky given the different motivations involved. For example,
in the European beer industry, the closed-loop model for returnable
bottles is well established. Yet in some markets, the share of bottles
completing the circle back to the manufacturer dropped to one-third,
from one-half, between 2007 and 2012. The reason: store owners
preferred to dispose of the empty bottles themselves because that
maximized the sales space available to promote new products.
Addressing such challenges requires companies to develop profit-
sharing models across their value chains. They should also learn
how to spot “moments of truth” when it might be easier to break with
the status quo—for example, when companies enter new markets,
renegotiate agreements with suppliers and service providers, or face
choices about big capital investments.
Toward a circular economy
Ultimately, the systemic nature of the barriers means that indi-
vidual corporate actions, while necessary, won’t suffice to create a
circular economy at scale. The real payoff will come only when
6 For more, see Towards the circular economy: Economic and business rationale for an accelerated transition, Ellen MacArthur Foundation, January 2012, ellenmacarthurfoundation.org.
61
multiple players across the business and research communities,
supported by policy makers and investors, come together to reconceive
key manufacturing processes and flows of materials and products.
Should that happen, our research finds, the benefits would be huge.
They include:
• Net materials savings. On a global scale, the net savings from
materials could reach $1 trillion a year. In the European Union
alone, the annual savings for durable products with moderate
lifespans could reach $630 billion. The benefits would be highest
in the automotive sector ($200 billion a year), followed by
machinery and equipment.
• Mitigated supply risks. If applied to steel consumption in the auto-
motive, machining, and transport sectors, a circular trans-
formation could achieve global net materials savings equivalent
to between 110 million and 170 million metric tons of iron ore
a year in 2025. Such a shift could reduce demand-driven volatility
in these industries.
• Innovation potential. Redesigning materials, systems, and
products for circular use is a fundamental requirement of a circular
economy and therefore represents a giant opportunity for
companies, even in product categories that aren’t normally con-
sidered innovative, such as the carpet industry.
• Job creation. By some estimates, the remanufacturing and
recycling industries already account for about one million jobs in
Europe and the United States.7 The effects of a more circular
industrial model on the structure and vitality of labor markets still
need to be explored. Yet we see signs that a circular economy
would—under the right circumstances—increase local employment,
especially in entry-level and semiskilled jobs, thus addressing
a serious issue facing many developed countries. Ricoh’s remanu-
facturing plant, for instance, employs more than 300 people.
Focusing a collective effort on the leverage points that would have a
systemic impact is the key to unlocking this potential. Our research
suggests that the place to start is materials flows, as they represent
the most universal industrial assets. The ultimate objective is to
7 According to the Automotive Parts Remanufacturers Association (United States) and SITA (the waste-management arm of Suez Environnement).
Remaking the industrial economy
62 2014 Number 1
close materials loops on a global level and to achieve tipping points
that would bring major streams of materials back into the system, at
high volume and quality levels, through established markets.
Creating pure-materials stocks for companies would help jump-start
that process while giving companies strong incentives to innovate.
The ubiquitous PET8 provides a useful analogy for how this could
happen. The polymer’s strong adoption as the basic input for bottles
in the beverage industry created a recycled-PET market that
extended beyond bottles. This in turn created a stable platform for
beverage companies to use PET for their own innovative purposes.
Innovation therefore shifted from materials (new additives harder to
isolate and later remove) and toward products and processes (for
example, novel shapes for sports-drink bottles, new process innovations
that allow hot drinks to be injected into bottles, and thinner-walled
water bottles requiring lower amounts of materials to create).
Establishing de-facto standards for other materials would act
as a catalyst for further action. Our research identified four types of
materials, each at a different stage of maturity in its evolution
toward the circular economy. These four thus represent realistic
starting points where pilot projects would make the greatest
difference right away (Exhibit 3).
Mobilizing multiple stakeholders is always challenging, of course, and
could take several forms, including industry partnerships and con-
sortia. Nonprofits and nongovernmental organizations will also play
a vital convening role.9 Regardless of the route companies choose,
by joining forces they can begin using existing science to develop the
projects and enabling mechanisms that could trigger a self-reinforcing
virtuous cycle. That would in turn ultimately benefit stakeholders on
every level—customers, businesses, and society as a whole.
The “take, make, and dispose” model of production has long relied
on cheap resources to maintain growth and stability. That world no
8 Polyethylene terephthalate.
9 For example, the Ellen MacArthur Foundation’s Circular Economy 100 program aims to bring companies and innovators together across regions to help develop and accelerate various commercial opportunities. Similarly, the World Economic Forum has created a number of initiatives focused on circular-economy issues.
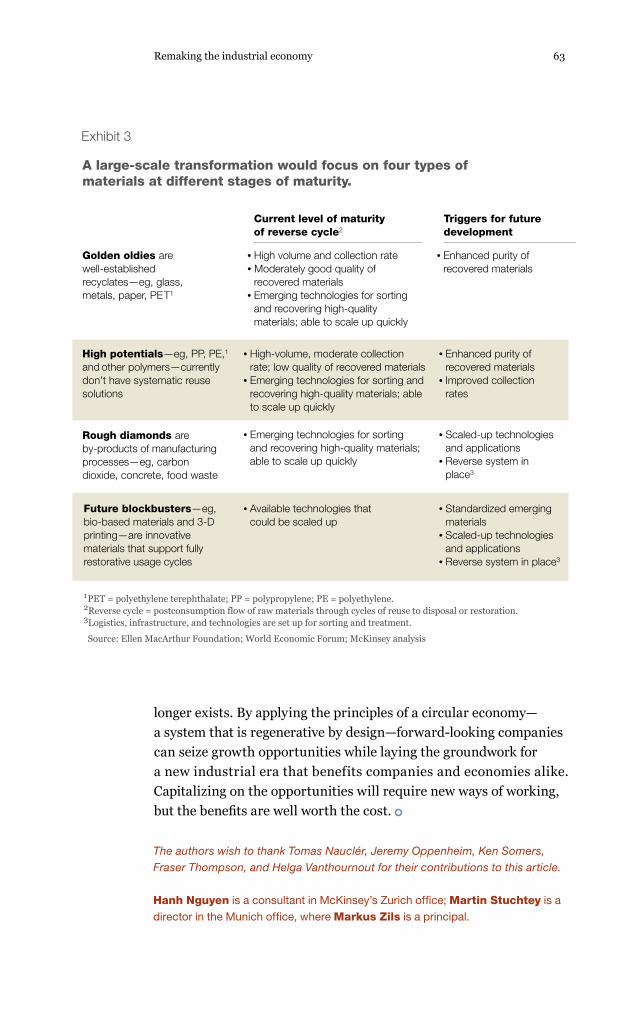
63
longer exists. By applying the principles of a circular economy—
a system that is regenerative by design—forward-looking companies
can seize growth opportunities while laying the groundwork for
a new industrial era that benefits companies and economies alike.
Capitalizing on the opportunities will require new ways of working,
but the benefits are well worth the cost.
The authors wish to thank Tomas Nauclér, Jeremy Oppenheim, Ken Somers, Fraser Thompson, and Helga Vanthournout for their contributions to this article.
Hanh Nguyen is a consultant in McKinsey’s Zurich office; Martin Stuchtey is a director in the Munich office, where Markus Zils is a principal.
Q1 2014Circular economy Exhibit 3 of 3
A large-scale transformation would focus on four types of materials at different stages of maturity.
• Enhanced purity of recovered materials
Golden oldies are well-established recyclates—eg, glass, metals, paper, PET1
• Enhanced purity of recovered materials
• Improved collection rates
• High-volume, moderate collection rate; low quality of recovered materials
• Emerging technologies for sorting and recovering high-quality materials; able to scale up quickly
• Emerging technologies for sorting and recovering high-quality materials; able to scale up quickly
High potentials—eg, PP, PE,1
and other polymers—currently don’t have systematic reuse solutions
• Standardized emerging materials
• Scaled-up technologies and applications
• Reverse system in place3
Future blockbusters—eg, bio-based materials and 3-D printing—are innovative materials that support fully restorative usage cycles
• Scaled-up technologies and applications
• Reverse system in place3
Rough diamonds are by-products of manufacturing processes—eg, carbon dioxide, concrete, food waste
• High volume and collection rate• Moderately good quality of
recovered materials • Emerging technologies for sorting
and recovering high-quality materials; able to scale up quickly
• Available technologies that could be scaled up
Current level of maturity of reverse cycle2
Triggers for future development
1 PET = polyethylene terephthalate; PP = polypropylene; PE = polyethylene.2Reverse cycle = postconsumption flow of raw materials through cycles of reuse to disposal or restoration.3Logistics, infrastructure, and technologies are set up for sorting and treatment.
Source: Ellen MacArthur Foundation; World Economic Forum; McKinsey analysis
Exhibit 3
Remaking the industrial economy
64
Two years ago, we decided to embed circular-economy thinking in
our strategic vision and mission, both as a competitive necessity and
with the conviction that companies solving the problem of resource
constraints will have an advantage. We believe that customers will
increasingly consider natural resources in their buying decisions
and will give preference to companies that show responsible behavior—
something we are already seeing. Designing products and services
for a circular economy can also bring savings to a company. The first
impression people always have is that it adds costs, but that’s not
true. We find that it drives breakthrough thinking and can generate
superior margins.
In our lighting business, for example, rapidly changing technology
and the economic crisis made business and municipal customers
reluctant to make big investments, because they felt uncertain. This
led us to consider lighting as a service. After all, why do these
customers buy light fixtures and luminaires? It’s not for the fixture
but for the light itself.
For business customers, we therefore now sell lighting as a service:
customers only pay us for the light, and we take care of the tech-
nology risk and the investment. In many cases, we also take the
Toward a circular economy: Philips CEO Frans van Houten
A new economic model is helping the
Dutch manufacturer improve its resource
efficiency and financial attractiveness.
65
equipment back when it’s the right moment to recycle the materials
or upgrade them for reuse. Similarly, for municipal customers we
now have streetlight installations in Singapore and, more recently, a
contract in Buenos Aires to replace the majority of the 125,000
existing streetlights there with LED luminaires over the next three
years. We install the equipment, maintain it, and make sure that it
runs for a very long time.
The benefits are substantial: the energy savings are anywhere from
50 to 70 percent, depending on the installation, so customers
can pay us out of the savings for the light output. The LEDs have five
times the lifetime of normal lights—which, in turn, means much
lower maintenance and operating costs for us. We are putting net-
working capabilities in these lights, as well, essentially making
them part of an IT network. This lets the community adjust the lights
depending on the circumstances. For example, if there is low traffic
density at night, then the lights can be turned further down. But if
there is a soccer match one night, the lights can go up. And, of
course, we can apply all sorts of algorithms as well to give customers
even more control. These kinds of innovations help us move away
from selling products and toward selling higher-value solutions.
A second place we are using circular-economy principles is Philips
Healthcare, where we establish leasing relationships with customers
to take back equipment and upgrade it, then refurbish it and send
it on to another customer. In the process, we might upgrade the first
customer to a more state-of-the art technology, and in doing so we
make both customers happy. This is already a €200 million business
for us.
Meeting the external challenges
I don’t want to make this sound easy. In our health-care business, for
example, a lot of customers initially thought: A secondhand product?
We don’t want it. Of course, we are refurbishing it and guaranteeing
it as new, but convincing a hospital customer, for example, is
challenging and requires a major educational program. We still have
much more to do given the size of the market, but as we work with
66 2014 Number 1
hospitals and establish ourselves as technology partners—and not
just sellers of a “box”—we can more easily convince customers of the
mutual benefits of circular-economy principles.
Similarly, for municipal-lighting customers, the thinking around
the tendering process needs to change. These customers are
used to looking at the initial purchase price, not the total cost of
ownership and the ecological impact. Changing the ownership
of the lights is also tricky, as it often gets into legislative issues with
municipal governments.
There are supply challenges in operating in this new way, as well. We
need to get our products back. Streetlights are fairly simple because
the lights don’t walk away, but consumer lamps are another story.
Here we work with partners to organize for collection, but even then
it’s very hard. Currently, in Europe we recover about 40 percent of
our lamps, of which 85 percent are recycled for reuse.
Changing minds at Philips
Above all, operating with circular-economy principles requires the
people of Philips to challenge ourselves and to change. We can’t think
in terms of designing products that we throw over the wall to
customers, but instead we need to design products that are upgradable
and maintainable and that can be mined for materials and com-
ponents that can be reused. Our mind-set needs to be 15 years out—
not just “now”—and it requires us to think in an end-to-end way,
involving our suppliers and sales force.
I’ll admit this was challenging at first. Even though we have a long-
standing focus on sustainability—a natural stepping stone toward
a circular economy—people still tested us when we initially stepped
up our circular-economy work. They wanted to make sure this
wasn’t “just words.” But after seeing the KPIs on the Philips “dashboard”
and learning that if you were in the red you could expect a call
from the CEO, people said OK. People become resourceful and inven-
tive when you challenge them.

67
In our innovation process, we have a program we call Design for
Excellence. It comes in a number of flavors, such as designing
for recyclability, upgradability, and serviceability. As part of the effort,
we set criteria for every product in order to challenge the business-
unit managers. To reach the targets, the businesses need to meet
criteria associated with the circular economy, and we continuously
raise the targets. For example, in our Consumer Lifestyle group,
where we make domestic appliances, we are asking for 10 percent
recycled materials in our total portfolio by 2015, compared with
a 2 percent target in 2012. Meeting goals like these often takes the
form of multiweek workshops where we tear down the entire value
proposition of a product to see what we might change and how. We
Toward a circular economy: Philips CEO Frans van Houten
Frans van Houten
Vital statistics Born April 26, 1960, in Eindhoven, the Netherlands
Married, with 4 children
Education Graduated with an MA in economics and business management in 1985 from Erasmus University, Rotterdam
Career highlights Philips (1986–2006, 2010–present)
President, chairman, and CEO (2011–present)
CEO, Philips Semiconductors (2004–06)
Co-CEO, Consumer Electronics division (2002–04)
NPX Semiconductors (formerly Philips Semiconductors) (2006–09)
CEO (2006–09)
Fast factsIs a member of the European Round Table of Industrialists
Serves on the International Institute for Management Development’s (IMD) Foundation Board
68 2014 Number 1
involve our suppliers in this activity so that it becomes cocreative
and so that we can learn to design our value chains better.
To help accelerate the transformation to circular principles, we
created a center of expertise—a permanent internal group that helps
with methodologies and programs. The center is networked through
the entire organization, and every business unit has a flag bearer
there. This is important because the circular economy needs to be
intrinsic in our end-to-end value chain and embedded in all our
processes, metrics, and structures. This is integral to our strategy.
Looking ahead
Even though we still have far to go, I see a real eagerness in the
organization to think in these new ways, and business units are being
quite creative in coming up with good solutions. The thinking is
very much driven by the engineers on the ground, and they are very
good at challenging themselves. It’s rewarding to see how enthusi-
astic people can be when they learn what they can do from a circular-
thinking point of view. That’s when you know you’ve reached the
tipping point inside the company—when the enthusiasm and creativity
are self-reinforcing—and I’m convinced that’s where we are headed.
Ultimately, we can do a lot on our own, but a circular economy on a
worldwide scale will require a lot of players to change simultaneously,
and that’s a bit of a chicken-and-egg problem. It would help tre-
mendously if governments took the lead and changed their procure-
ment policies so that a certain proportion of what they buy—be it
50 percent, 25 percent, or some other figure—represented products
It’s rewarding to see how enthusiastic people can be when they learn what they can do from a circular-thinking point of view.

69
manufactured according to circular-economy principles. We hope
that we can play the role of catalyst and help to reach a much
bigger tipping point by putting our weight on the entire value chain,
as well as by educating customers and suppliers. We hope that
by setting the right example, we can help encourage the right behavior.
This is just the beginning.
This commentary is adapted from an interview with Thomas Fleming, a member of McKinsey Publishing who is based in the Chicago office, and Markus Zils, a principal in McKinsey’s Munich office.
Copyright © 2014 McKinsey & Company. All rights reserved.
Toward a circular economy: Philips CEO Frans van Houten
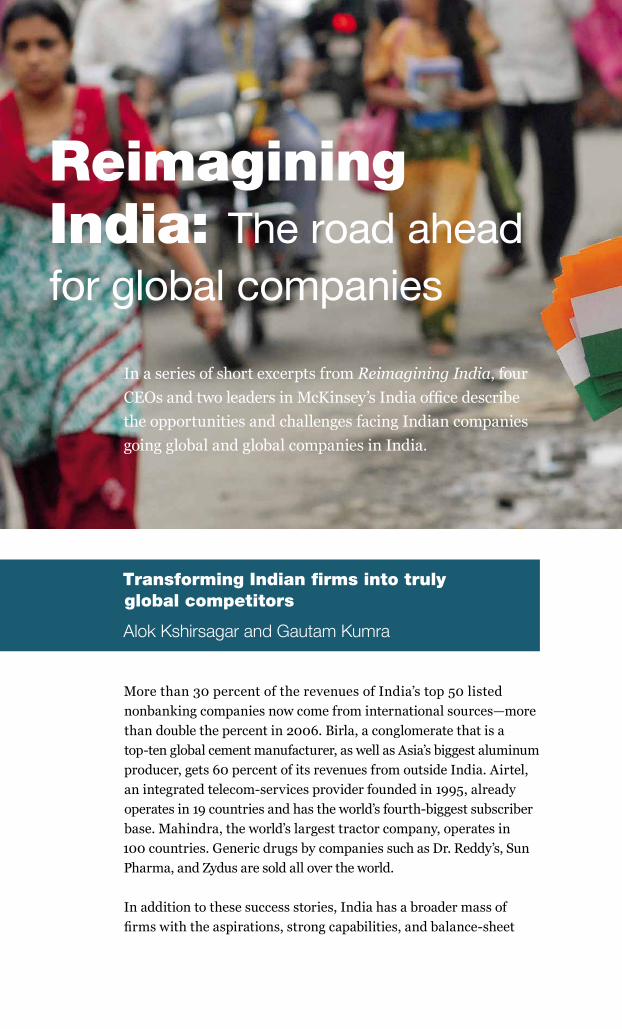
In a series of short excerpts from Reimagining India, four
CEOs and two leaders in McKinsey’s India office describe
the opportunities and challenges facing Indian companies
going global and global companies in India.
Reimagining India: The road ahead for global companies
Transforming Indian firms into truly global competitors
Alok Kshirsagar and Gautam Kumra
More than 30 percent of the revenues of India’s top 50 listed
nonbanking companies now come from international sources—more
than double the percent in 2006. Birla, a conglomerate that is a
top-ten global cement manufacturer, as well as Asia’s biggest aluminum
producer, gets 60 percent of its revenues from outside India. Airtel,
an integrated telecom-services provider founded in 1995, already
operates in 19 countries and has the world’s fourth-biggest subscriber
base. Mahindra, the world’s largest tractor company, operates in
100 countries. Generic drugs by companies such as Dr. Reddy’s, Sun
Pharma, and Zydus are sold all over the world.
In addition to these success stories, India has a broader mass of
firms with the aspirations, strong capabilities, and balance-sheet

71
strength from which to build truly global companies. We believe that
over the next 15 years, India can develop at least 50 world-class
multinationals that have progressed from increasing their exports
and overseas investments to establishing global platforms and
brands. But it will take more than imagination. It will require many
acts of will, calculated daring, and new capabilities. Drawing on
McKinsey’s experiences working with Indian companies, we suggest
four imperatives for the successful globalization of India Inc.
1. Deepen market insights: think local while going globalMany Indian companies have grown internationally via a combination
of opportunistic export-led growth and product-driven sales. Some
in the pharma and IT industries have developed tailored services for
different customer segments, but most companies have faltered
when it comes to developing deep local insights. Increasing inter-
national market share requires much greater levels of investment
in segment and market insight. Indian companies have to tailor their
offerings, not just replicate their business model. For some, this
requires a fundamental shift in mind-set.
© D
ivya
kant
Sol
anki
/epa
/Cor
bis
72 2014 Number 1
The approach Tata Motors took with Jaguar Land Rover in China
is a good example of the rewards of doing this right. Since the
acquisition of JLR in 2008, Tata has made substantial investments
in China and built a new factory, which it operates with a local
joint-venture partner. In the financial year ending March 2012, sales
for JLR China surged nearly 50 percent. China is now JLR’s largest
market and a big factor in its turnaround.
2. Create and institutionalize global processesFounders and entrepreneurs have led India’s globalization. These
kinds of leaders made their mark via intuition, inspiration, and
navigation of personal networks. But what works in India does not
necessarily work overseas. The need is for a more process-driven
form of management that can be rolled out in different countries. To
create order and consistency across their global operations, Indian
companies need to create systems for everything from how to get
supplies to their factories to how they operate their plants.
In particular, Indian firms must place greater emphasis on managing
unfamiliar risks. Most Indian companies, especially those in the
top 100, are very good at managing domestic risks on an intuitive
and reactive basis. Their ability (with the help of one or two phone
calls) to understand the underlying reason for regulatory changes,
commodity price shifts, the lack of suppliers, and labor union troubles
is extraordinary. When they go abroad, however, they encounter
unfamiliar challenges. They do not know the regulator, the unions,
the policy makers, or the nature of the local partners. A much more
disciplined process to identify and manage these risks is required—
not just to check a box for compliance or regulatory purposes but as
a critical way to increase value and build resilience.
The essays featured in this section are excerpted from a new McKinsey-edited book, Reimagining India: Unlocking the Potential of Asia’s Next Superpower, which convenes leading thinkers from around the world to explore and debate the challenges and opportunities facing India.
73Reimagining India: The road ahead for global companies 73
3. Be an active owner to create value from M&ATraditional M&A involves consolidation and back-office synergies,
but when acquiring an asset overseas, it is essential to increase
revenues. Indian acquirers often buy an asset that is already distressed,
troubled, or starved of investment. It is necessary to focus on revenue
growth by bringing in new technology, attracting new customers,
and finding new markets. These will make a big difference to the
morale of the acquired organization.
Unfortunately, some senior Indian leaders have the view that Indian
companies are preferred because they are relatively passive investors
who are apt to leave the acquired company alone. This is not always
the right view to take. Being passive can mean losing value. And being
active does not necessarily mean slash and burn; it can be about
bringing in three or four new managers to improve performance in a
disciplined fashion and to work on mind-sets and capabilities.
4. Develop and recruit global talentIndian executives can readily recite the challenges that foreign com-
panies have faced in finding their feet in India. Among them: they
were not committed to the long term; they didn’t have the right people;
they changed their (expatriate) bosses every three years; they
didn’t know how to manage a local joint venture; and they were not
integrated into society. There is truth in this critique. There is also
irony because Indian companies often make the exact same mistakes
in their own overseas ventures.
When asked who will manage international expansion, they usually
come up with the same set of five or ten trusted people who have
been managing everything for them in the domestic market. It is
typical in the Indian C-suite for executives never to have held an
international assignment or even to have worked outside their com-
panies or business units. These leaders may be brilliant at managing
domestic businesses, but that does not mean they are well prepared
to run global ones. One key priority for global Indian companies, then,
is to start to build a cadre of 50 to 100 internationally oriented
middle to senior managers now so that leadership capabilities can
match global ambitions.
Fortunately, most of today’s managers grew up in a multicultural
country with a complex, dynamic, and competitive environment. In
74 2014 Number 1
many ways, India does not operate as a single market. The complexity
of competing across state borders with different tax systems, con-
sumer habits, and local government policies is akin to competing
across national borders. Indian executives have learned to be resil-
ient and know how to adapt in a volatile business environment. These
capabilities can now prove very valuable as they venture out,
particularly to other emerging markets that share some of the
same conditions.
Not only does India lack internationally experienced leaders, but many
companies don’t consider giving outsiders a real shot. It’s not
hard to find firms that get more than three-quarters of their revenues
from outside India—and have 95 percent Indian senior leadership.
The CEO of Coke was born in Turkey, the CEO of Pepsi in India,
the former CEO of Sony in Britain. At the moment, it is hard to imagine
any Indian company of similar stature selecting a non-Indian for
the top spot. This glass ceiling, coupled with the fact that few Indian
companies have great global brand names, prevents top talent
from joining even the best Indian firms. They need to show exec-
utives that there are clear, performance-based career paths and
no impediments to advancement.
Alok Kshirsagar is a director in McKinsey’s Mumbai office, and Gautam Kumra is a director in the New Delhi office.
Serving butter chicken at Birla
Kumar Mangalam Birla
When I took over the company in 1996 at age 29, after the sudden
death of my father, no meat was cooked in Birla cafeterias; no wine
or whiskey was served at company functions.
Seven years later, we bought a small copper mine in Australia. The
deal wasn’t a huge one, worth only about $12.5 million, but it
presented me with a unique challenge of the sort I had not yet faced
as chairman. Our newest employees were understandably worried
75Reimagining India: The road ahead for global companies 75
about how life might change under Indian ownership. Would they
have to give up their Foster’s and barbecues at company events? Of
course not, we reassured them.
But then several of my Indian managers asked why they should
have to go meatless at parties, if employees abroad did not. I was genu-
inely flustered. My lieutenants were relentless: I had never faced a
situation where my own people felt so strongly about something. Yet
at the same time I knew vegetarianism was a part of our values
as a family and as a company. A core belief! Fortunately, my grand-
parents merely laughed when I approached them with my dilemma:
They understood better than I did that our company had to change
with the times. If we wanted to make our mark on the world, we
had to be prepared for the world to leave its mark on us.
The Aditya Birla Group is now one of India’s most globalized conglom-
erates. We have operations in 36 countries on five continents and
employ 136,000 people around the world. Over 60 percent of our
revenues come from overseas, in sectors as varied as mining, pulp,
aluminum, and insurance. We’ve branched out into Australia, America,
Canada, and Europe. For the moment, our top management remains
all-Indian, but I would guess that within a decade, half of our senior-
most staff will be non-Indian.
We have expanded internationally for many reasons—sometimes to
spread our bets, sometimes because we found it impossible to open
a plant in India as fast and as cheaply as we could abroad. In each
case we’ve made our decision based on whether or not the deal would
increase shareholder value. Yet when I look around me, I see too
many Indian companies eager simply to be written about as global
players. Sometimes that clouds the fundamentals of making an
overseas acquisition or having an overseas presence. To globalize for
the sake of globalizing—as a matter of ego—is perilous. Expanding
internationally is hard, risky work. And as I was reminded the first
time I saw butter chicken being served in a Birla canteen, the most
difficult challenges turn out to be the ones you least expect.
Kumar Mangalam Birla is chairman of the Aditya Birla Group.
76 2014 Number 1
Success on India’s terms
Muhtar Kent
In India, appearances can be deceiving. For outsiders, there is always
a hint of mystery. Even if you live and work there, you can never be
entirely sure you understand. It is best to assume that you do not. If
you come to India with some grand, predetermined strategy or
master plan, prepare to be distracted, deterred, and even demoralized.
That’s something I keep in mind as I think of The Coca-Cola Company’s
experience in India. Coca-Cola launched operations in India in
1950, shortly after independence. Our business grew steadily. But
in 1977, we exited (along with other multinational companies)
after a new law diluted ownership of our assets and operations.
We returned to rebuild our business in 1993 as economic reforms
unleashed a period of robust growth. It was harder going than we’d
imagined. We struggled at first to find and keep talented employees.
We learned that although Indian consumers were eager to embrace
global brands, they resented any hint of global corporate dominance.
It took us time to understand that small stores, many operated
by families out of the front of their homes, were an unappreciated
source of economic opportunity.
Today our India business is thriving. India now ranks among our top
ten markets in unit-case sales. I still see enormous potential in
India—which is why last summer I went to New Delhi to announce
that The Coca-Cola Company and its global bottling partners will
invest $5 billion in our India operations between 2012 and 2020. By
the end of that period, we think India could be one of our top five
global markets. But the key to our success so far has been learning to
see the Indian market as it is, not as we wished it to be, and to
seek success on India’s terms. We have learned to see our investments
in India in broad terms—not just as capital investment in bottling
plants and trucks but also human investment in schools and training,
social investment in women entrepreneurs, and technological
investment in innovations like solar carts that can power a cooler,
mobile phone, or a lantern by which a young boy or girl can study.
Muhtar Kent is chairman and CEO of The Coca-Cola Company.
Reimagining India: The road ahead for global companies 77
The power of partnership
Howard Schultz
We hope to have thousands of stores in India. I look forward to a day
in the not-too-distant future when India takes its place alongside
China as one of our two largest markets outside North America. But
we know getting there won’t be easy. And our successful beginning
in India has not been without hurdles; on the contrary, it was a com-
plicated six-year journey. Along the way, we learned a lot about
India and ourselves.
One key to our success has been our partnership with the Tata Group.
We announced our joint venture with Tata in January 2012. Ten
months later, the Indian government loosened restrictions on foreign
investment in the retail industry. From a legal standpoint, we
could have tried to set up shop in India on our own. But I can’t imagine
bringing Starbucks to India without the assistance we’ve received
from Tata. They helped us find great locations for our stores. They
helped with store design and in getting the food menu right (tandoori
paneer rolls and cardamom-flavored croissants!). They helped us
overcome the many logistical and infrastructure obstacles to make
sure everything on our India menu is fresh. They also helped with
recruiting, which is crucial for us because no matter how big we get,
the essence of Starbucks is to make that human connection: serving
coffee one person, one cup, one neighborhood at a time.
The other unique aspect of our alliance with Tata is the ability to
source and roast coffee beans locally in India. India is the only major
market in the world where we can do that, and it is only because
of our relationship with Tata, which is the largest coffee estate owner
in all of Asia. They not only own farms but also operate their own
roasting facilities. We were able to work with them to develop an India-
only espresso roast, designed specifically for India, that is every
bit as good as the espresso we serve all over the world.
Developing that blend required us to do some things differently. We
created a unique blend for India, and it’s not roasted by our team,
which is something we had never done before. It was a real test of our
trust in our new partner because it required us to share with Tata
some of the roasting secrets we have perfected over four decades and
guarded very closely. But the result has been well worth it. In the

78 2014 Number 1
process, we learned that not everything needs to be invented
in Seattle, and that with the right partner, we can collaborate and
coauthor, as long as there is a foundation of trust.
Howard Schultz is chairman, president, and CEO of Starbucks Coffee Company.
Finding the right prescription
Miles White
In business, sometimes you find the most valuable insights in places
you’d least expect them. In my case, it was a crowded Mumbai
alley full of “chemist” shops where I went to buy some medicine. That
brief visit helped me understand why, after imagining India
for a long while, my company had to become an integral part of it.
It was 2009. I had embarked on what might be called an immersion
course in India—in particular in its health system. I toured its
hospitals and other health-care facilities, at all levels of service. I
visited private homes across a broad spectrum of socioeconomic
levels. I tried to understand as well as I could what it was like to be
an Indian citizen during this extraordinary moment in the country’s
history and what it was like to provide and receive health care.
As it happened, in the course of investigating India’s health-care
system, I came to need a little care myself. That’s how I found myself
in the lanes surrounding Bombay Hospital, where about 30 chemist
shops, each with a storefront perhaps three to five meters wide,
serve the hospital’s many patients. The scene I encountered was eye-
opening. Clerks clamored for my attention as I walked past. Indian
pharmacies function as informal doctors as well as medicine
purveyors, but the people manning these shops were unexpectedly
young and could have been selling any commodity. Once I chose a
shop, the young man at the counter asked numerous questions about
the malady I wanted to treat. After a loud discussion between him
and someone in the back—during which passersby could easily over-
hear details of my symptoms—I received a small bag of generic
medicines. The drugs prescribed were just what I needed, and I was
stunned by how little they cost—a fraction of the price I would
79Reimagining India: The road ahead for global companies
have paid for them in the United States or almost any other developed
country. In a way that no spreadsheet or PowerPoint ever could,
this experience drove home to me how crucial it was for us at Abbott
to be part of India’s health-care solution.
The medicines I bought that day were what are known as “branded
generics,” and their prevalence in India underscores the essence of
the country’s health-care system. At the tip of the iceberg is outstanding
care for the relatively few who can afford it. But the overwhelming
majority of people receive a very different level of care, if any. For this
majority, branded generics are appealing because, although their
patent protection has expired, they offer the quality of manufacture
and trustworthiness of consistency that comes with the imprimatur
of a major pharmaceutical firm, at a much more accessible price than
newer, patent-protected drugs. India is a powerhouse for these
drugs, due to its wealth of scientific and managerial talent and its low
production costs. We concluded that securing a major foothold in
India would provide Abbott an ideal base from which to sell not only
to the 1.2 billion people in India but also to fast-growing markets
throughout the developing world.
We made a series of key transactions in 2010, acquiring the pharma-
ceutical business of Belgium-based Solvay, which had an Indian
operation larger than our own, and forming a partnership with a
major Indian pharmaceutical maker to market drugs in emerging
economies outside India. Then came the deal that was fundamental
to our vision: our $3.7 billion acquisition of Piramal Healthcare
Solutions, a part of Piramal Group, one of India’s largest companies.
These actions made us one of the largest players in the health-care
system of the second-most-populous nation on earth. In just four years,
we’ve achieved our goal of attaining a number-one position in
India’s pharmaceutical sector where we have about 7 percent of the
market. India now represents more than 4 percent of our total sales
and almost 5 percent of profits—percentages that will surely grow.
Miles White is chairman and CEO of Abbott Laboratories.
These essays are excerpted from Reimagining India: Unlocking the Potential of Asia’s Next Superpower. Copyright © 2013 by McKinsey & Company. Published by Simon & Schuster, Inc. Reprinted by permission. All rights reserved.
Copyright © 2014 McKinsey & Company. All rights reserved.


81
Huggy Rao and Robert I. Sutton
Before senior executives try to spread best practices, they should
use seven techniques to clear out the negative behavior that stands
in the way.
Bad to great: The path to scaling up excellence
Illus
trat
ion
by D
avid
e B
onaz
zi
The problem
Destructive behavior—selfishness,
nastiness, fear, laziness, dishonesty—
packs a far bigger wallop than
constructive behavior. In particular,
research has found that negative
interactions with bosses and
coworkers have five times more
impact than positive ones.
Why it matters
When bad behavior crowds out good,
it results in confusion, destructive
conflict, distrust, and dead ends that
can undermine the scaling of
excellence—one of the toughest
challenges senior leaders face.
What to do about it
To spread and sustain the good,
you must first remove the bad. Seven
proven methods can help leaders
do so: nipping bad behavior fast;
putting mundane improvements
before inspirational ones; seeking
adequacy before excellence;
using well-respected staff to squelch
bad behavior; killing the thrill
destructive behavior generates;
time-shifting from current to future
selves; and focusing on the best
times, the worst times, and the end.
82 2014 Number 1
Leaders who aim to boost organizational performance often
start with efforts to kindle good behavior, however they define it. Yet
case studies and rigorous academic research show that if you want
to create and spread excellence, eliminating the negative is the first
order of business. Destructive behavior—selfishness, nastiness,
fear, laziness, dishonesty—packs a far bigger wallop than constructive
behavior. Organizational researcher Andrew Miner and colleagues,
for example, measured the moods of 41 employees at random intervals
throughout the workday. The researchers discovered that negative
interactions with bosses and coworkers had five times more impact
on employees’ moods than positive interactions.1 This “bad is
stronger than good” effect holds in nearly every other setting studied,
from romantic relationships to group effectiveness.
Efforts to scale up excellence stall when bad behavior crowds out good.
Scaling is one of the toughest challenges that senior leaders face.
Executives can always point to places where a company is doing a
great job. What drives them, keeps them up at night, and devours
their workdays is the difficulty of spreading excellence to more people
and more places. This “problem of more” is tough to crack. Scaling
requires pressing each person, team, group, division, or organization
to change what they believe, feel, or do.
Eliminating destructive behavior and beliefs clears the way for
excellence to spread—particularly when these impediments clash
with the mind-set that propels your organization’s performance.
When it comes to mind-sets, however, one size does not fit all; what
is good for another company may be bad for yours. At Facebook,
everyone from senior executives to new engineers lives the mantra
“move fast and break things.” When we asked an executive at one
company if its people lived this mind-set, he answered that “move
fast and break things” was wrong for many of its businesses,
especially the unit that builds software for nuclear submarines!
Negative actions and beliefs also come in different flavors. Whatever
their exact characteristics, bad behavior undermines scaling
efforts by introducing confusion, destructive conflict, distrust, and
dead ends. To spread and sustain something good, you’ve first got
1 Theresa M. Glomb, Charles Hulin, and Andrew G. Miner, “Experience sampling mood and its correlates at work,” Journal of Occupational and Organizational Psychology, 2005, Volume 78, Number 2, pp. 171–93.
83Bad to great: The path to scaling up excellence 83
2 George L. Kelling and James Q. Wilson, “Broken windows: The police and neighborhood safety,” the Atlantic, March 1, 1982, theatlantic.com.
3 Charles A. O’Reilly III and Barton A. Weitz, “Managing marginal employees: The use of warnings and dismissals,” Administrative Science Quarterly, 1980, Volume 25, Number 3, pp. 467–84.
to take out the bad. Seven methods can help leaders who are bent
on “breaking bad.”
1. Nip it in the bud
In 1982, criminologist George L. Kelling and political scientist
James Q. Wilson described what they called the “broken windows”
theory: they observed that in neighborhoods where one broken
window was left unrepaired, the remaining windows would soon be
broken, too. Allowing even a bit of bad to persist suggests that no one
is watching, no one cares, and no one will stop others from doing far
worse things.2 The theory soon had a big impact on public policy,
particularly in New York, where crime plummeted after efforts were
made to stamp out minor offenses such as graffiti and panhandling.
Much research supports this theory. Charles O’Reilly and Barton
Weitz, for example, studied 141 supervisors in a large retail chain. They
focused on how supervisors handled salespeople who were tardy,
unhelpful, uncooperative, discourteous to customers, or unproductive.
O’Reilly and Weitz found that supervisors of the most productive
units confronted problems more directly and quickly, issued more
warnings, used formal punishments more often, and promptly
fired employees when warnings failed.3
This isn’t an argument for striking fear among employees. The best
bosses nip bad behavior in the bud but treat people with dignity.
Mauria Finley is CEO of the start-up Citrus Lane, which sends monthly
care packages of baby goods to moms. We asked her how she struck
the right balance as the company grew from 6 people to 20. Finley
explained that her years as a manager at Netscape, eBay, and
elsewhere taught her never to withhold bad news or hesitate to tell
employees when and why their work wasn’t up to snuff—but to
deliver such messages with empathy. When we interviewed Finley,
she told us that one of her direct reports described her as a
“compassionate hard-ass.” She laughed and said, “that’s me.”

84 2014 Number 1
Many employees who are prone to selfishness, nastiness, incompetence,
cheating, and laziness change their ways after getting feedback
and coaching or moving to a workplace where such behavior isn’t
tolerated. Stanford’s Perry Klebahn is known for his mastery at
coaching and turning around dysfunctional teams in the hands-on
creativity classes for master’s students and programs for visiting
executives at the Hasso Plattner Institute of Design (which everyone
calls “the Stanford d.school”). During several recent executive
programs, he and his fellow coaches identified some bad apples who
harmed their groups. So Klebahn put all of these destructive
characters together “in the same barrel”—a new team. Then he moved
it to a corner where they wouldn’t infect others and recruited a
no-nonsense coach to guide them.
This technique works. A couple of bad-apple teams have performed
poorly, but a few others have produced “shockingly good” proto-
types of new products and improved customer experiences. When a
team filled with alpha types has a coach who can handle them,
constructive dynamics often emerge. Although those big personalities
may trample on less aggressive people, a “balance of power”
emerges when you put a bunch of these overbearing types together.
Such people, Klebahn observed, usually have lot of energy; the
trick is getting them to channel it toward the design challenge rather
than pushing around their teammates.
2. Plumbing before poetry
Stanford’s James March distinguishes between leaders who are “poets”
and “plumbers.”4 Getting people to focus on small, mundane, and
gritty details is effective for eliminating negativity. In March’s lingo,
you’ve got to fix the plumbing before you spout the poetry.
Consider the incredible mess that the Alameda Health System (AHS),
in Oakland, California, experienced a decade ago.5 By 2005, it had
4 Mie Augier, “James March on education, leadership, and Don Quixote: Introduction and interview,” Academy of Management Learning & Education, 2004, Volume 3, Number 2, p. 169–77.
5 Russ Mitchell, “The medical wonder: Meet the CEO who rebuilt a crumbling California hospital,” Fast Company, May 2, 2011, fastcompany.com; and John Commins, “HL20: Wright L. Lassiter III—Getting better all the time,” HealthLeaders, December 13, 2011, healthleadersmedia.com.
85Bad to great: The path to scaling up excellence 85
churned through ten CEOs in 11 years. AHS was losing $1 million
a month and had a deficit of more than $50 million, partly because
employees did a poor job collecting Medicare and MediCal pay-
ments. Working conditions were horrendous. A doctor was beaten
and strangled by a patient—and left on the floor for half an hour
before a janitor found him. Nurses defied doctors and supervisors.
Employees’ cars filled the garage, forcing patients to circle around
to find parking spots.
New CEO Wright Lassiter III and new COO Bill Manns decided
that so many things were broken at AHS that talking about values and
strategy would backfire, so they repaired one broken part at a
time. They started by launching a “grassroots money hunt,” which they
now call “the foundation of our success.” Lassiter and Manns put
85 top managers into 12 “odd couple teams” including doctors, nurses,
managers, and technicians. He asked the teams to find $21 million
by cutting costs and increasing revenues. Lassiter told them, “It’s up
to you.” They came up with many good ideas; for example, they
replaced a $96.50 tool to test the umbilical-cord blood of newborns
with a 29-cent solution that worked just as well—saving $322,000 a
year. They found new sources of revenue, too.
An especially tough problem was working with the union to get rid
of terrible nurses. As a veteran physician told Fast Company, “I’d say,
‘Nurse, draw this man’s blood,’ and she’d say, ‘Why don’t you do it
yourself?’” This doctor noted that most AHS colleagues were highly
professional and “wanted those nurses gone.” Dozens of them were
fired. Lassiter and Manns also worked with unions to free parking
spots for patients, not only opening up spaces, but also creating
a gateway experience in which employees embraced a mind-set
Lassiter and Manns hoped to spread: putting patients’ needs first.
3. Adequacy before excellence
As we noted earlier, before you can spread something good,
the first order of business is to drive out bad behavior. This may
seem obvious, but as our colleague Jeffrey Pfeffer loves to say,
great leaders and teams are masters of the obvious—a rare talent.
86 2014 Number 1
The Customer Contact Council of the Corporate Executive Board
(CEB) found that many companies don’t follow this path. When the
firm surveyed 100 customer-service heads, 89 reported that “their
main strategy is to exceed expectations.” But CCC’s surveys of more
than 75,000 customers revealed that most aren’t looking for over-
the-top service. What drives them away—and hurts companies—is
bad service: “They exact revenge on airlines that lose their bags,
cable providers whose technicians keep them waiting, cellular com-
panies whose reps put them on permanent hold, and dry cleaners
who don’t understand what ‘rush order’ means.”
CEB researcher Matthew Dixon and his colleagues report that
25 percent of customers are likely to say something positive about a
good customer-service experience, but 65 percent are likely to
say something negative about a bad one. Similarly, 23 percent of
customers who received good service told ten or more people,
compared with 48 percent who experienced bad service. This research
shows that making things easy for customers is crucial for main-
taining their loyalty.6 Smart companies, for example, find ways to
ensure that customers don’t have to call back a second time to
make purchases, set appointments, complete transactions, or resolve
problems. One CEB client, an Australian telecommunications
company, eliminated productivity metrics for reps who work the phones.
It now evaluates them by interviewing customers and asking “if
the service they received met their needs.” Calls take slightly longer,
but repeat calls have fallen by 58 percent.
4. Use the ‘cool kids’ (and adults) to define and squelch bad behavior
The people you recruit for a scaling effort have a big impact on its
success. Recruit your organization’s most admired and connected
people, teach them what “bad” looks like, and encourage them to
stop being perpetrators.
A senior executive from a large South American retail chain, for
example, told us he was fed up with top-team members who used
6 Matthew Dixon, Karen Freeman, and Nicholas Toman, “Stop trying to delight your customers,” Harvard Business Review, 2010, Volume 88, Numbers 7–8, pp. 116–22.
Bad to great: The path to scaling up excellence 87
7 Gary P. Latham, “The importance of understanding and changing employee outcome expectancies for gaining commitment to an organizational goal,” Personnel Psychology, 2001, Volume 54, Number 3, pp. 707–16.
their smartphones during meetings, despite his repeated requests
to put them away. On several occasions, “those damn little screens”
(his words) caused participants to miss important facts and to
zone out when their wisdom was needed. So the executive pulled aside
two of the most admired members of his team—two of the worst
offenders—and asked them to keep their phones off and in their pockets
during meetings and to help him encourage fellow team members
to do the same. The two role models didn’t look at their phones during
the next meeting and began pressing teammates to stop doing so.
Now, when a team meeting starts, everyone powers off their phones
and puts them away.
5. Kill the thrill
As Mark Twain said, “There is a charm about the forbidden that makes
it unspeakably desirable.” One of our favorite examples of the thrill
of bad behavior—and how to squelch it—comes from an intervention
the University of Toronto’s Gary Latham helped to invent, imple-
ment, and study at a large sawmill.7 Hourly employees stole a million
dollars’ worth of equipment a year, and management couldn’t figure
out how to stop them. Although many workers disapproved of the
stealing and didn’t do it themselves, peer pressure prevented them
from reporting the thieves.
Latham’s interviews revealed that workers didn’t need most of what
they stole; they stole because that was a source of prestige among
peers. Because the thieves never sold this stuff, they argued heatedly
about who should store it. Although workers weren’t afraid of
management, they feared “the wrath of their spouses,” who complained
that the loot was “clogging up their garages, basements, and attics.”
Eventually, with Latham’s help, managers decided to eliminate the
thrill by letting employees check out equipment for personal use
anytime they wished. The theft rate immediately dropped to virtually
zero, though workers almost never checked out equipment. Bragging
about stealing something that’s there for the taking doesn’t earn you
prestige. And other kinds of bad behavior did not increase.
88 2014 Number 1
6. Try time shifting: From current to future selves
You can sometimes break bad patterns by getting people to think
about who they hope to be, not just who they are. Research from
New York University’s Hal Hershfield and his colleagues shows that
people are more prone to behave unethically when they are
preoccupied with their present selves. But when they focus on the
link between who they are now and who they want to be in the
future, they behave more ethically and engage in other constructive
long-term behavior, such as saving more money.8
Sometimes, encouraging employees to look to the future—time
shifting—just requires finding ways to make the impact of negative
actions more vivid to them, so they link short-term actions with
long-term consequences. BG Group executives explained to us how
they had tackled such a problem in India. In some cities, the
company is the only energy supplier, and its employees were often
contemptuous of customers. Managers hit upon an ingenious
solution, organizing role-playing sessons where consumers behaved
like rude frontline employees and employees took the consumers’
role. The employees got the point, and accountability took hold.
7. Focus on the best times, the worst times, and the end
Research by Nobel Prize winner Daniel Kahneman uncovered the
“peak–end rule”: no matter how good or bad an experience is or
how long it lasts, judgments about it are shaped most strongly by the
best and worst moments and by how it ended.9
In a project at the Stanford d.school, for example, three of Sutton’s
students followed and interviewed JetBlue passengers through their
journeys in and out of two airports. For many, the worst part of
flying was claiming baggage; they were anxious about when (and if)
8 Taya R. Cohen, Hal E. Hershfield, and Leigh Thompson, “Short horizons and tempting situations: Lack of continuity to our future selves leads to unethical decision making and behavior,” Organizational Behavior and Human Decision Processes, 2012, Volume 117, Number 2, pp. 298–310.
8 Daniel Kahneman et al., “When more pain is preferred to less: Adding a better end,” Psychological Science, 1993, Volume 4, Number 6, pp. 401–5.

89Bad to great: The path to scaling up excellence
their stuff would arrive—and surrounded by similarly tense people.
The baggage-carousel experience was not only the worst part of an
airplane trip but also happened at its end.
The students tested an “experience prototype” they called Blue Cares
by going to the airport, hanging out in the baggage-claim area,
and offering to help passengers. The students focused on those who
looked most anxious or confused, because they were most in need
of help and if their anxieties were calmed, negative emotions wouldn’t
infect others. The positive responses the prototype generated from
customers and JetBlue employees impressed company leaders, who
redoubled their efforts to make the baggage-claim experience as
smooth for passengers as possible, though adding this new role wasn’t
economically feasible given the industry’s competitive pressures.
Postscript: Some warning signs
How can you recognize when bad behavior exists—or soon will?
Here are four feelings to watch for; when pervasive, they signal trouble.
The first is fear of responsibility, especially the sense that it is safer
to do nothing—or something bad—than the right thing. Silence is
among the most reliable signs that people fear personal responsibility
and that the learning and self-criticism needed for excellence
aren’t happening.
In a study of drug-treatment errors in eight nursing units, Harvard’s
Amy Edmondson demonstrated the stifling effects of such fears.10
At first, Edmondson was bewildered because her findings revealed
that nurses in units with the best managers and coworker relation-
ships reported making as many as ten times more mistakes than
nurses in the worst units. She sent a researcher with no knowl-
edge of these findings to spend two months doing interviews and
observations in the eight units. Eventually, Edmondson realized
that nurses in the worst ones reported fewer mistakes because they
were afraid to admit making them. In the best units, nurses and
10 Amy C. Edmondson, “Learning from mistakes is easier said than done: Group and organizational influences on the detection and correction of human error,” Journal of Applied Behavioral Science, 1996, Volume 32, Number 1, pp. 5–28; and Amy C. Edmondson and Anita L. Tucker, “Why hospitals don’t learn from failures: Organizational and psychological dynamics that inhibit system change,” California Management Review, 2003, Volume 45, Number 2, pp. 55–72.

90 2014 Number 1
managers expected everyone to report mistakes immediately and to
discuss their root causes. When nurses learned how to avoid a mistake,
they told their colleagues. In other words, silence isn’t always golden;
it often signals that people are afraid to speak the truth.
Feelings of injustice are the second warning sign. Numerous studies
show that when people think they are getting a raw deal from
their employer, bad behavior runs rampant. As Stanford d.school
professor Michael Dearing told us, his experience as a senior
executive (and, more recently, as a venture capitalist who financed
more than 80 start-ups) taught him that “there is a difference
between what you do and how you do it.” Whether you are doing some-
thing difficult (such as announcing pay cuts or demotions) or
something pleasant (raises and promotions), employees work harder
and more loyally if you explain your actions, talk about how
changes will unfold, and treat people with dignity.
Helplessness is the third dangerous feeling. When people feel power-
less to stop bad forces and events, they shirk responsibility. As
psychologist Martin Seligman’s classic research on learned help-
lessness demonstrates, even when people can actually escape
from a bad situation easily or make it better for others, they sulk and
suffer if they believe they cannot do anything to improve their lot.11
Before Lassiter and Manns arrived at the Alameda Health System,
for example, its employees had been in a downward spiral for so
long that they felt it was impossible for them or anyone else to make
meaningful improvements. That’s why Lassiter and Manns were
smart to skip the poetry and start the money hunt right away. The
diverse and influential employees who joined the money hunt did
more than just dig up more than $20 million. They also demonstrated,
to themselves and their colleagues, that they weren’t helpless.
The final dangerous feeling is anonymity: the belief that no one is
watching you closely, so you can do whatever you want. In the 1990s,
Michael Dearing managed the original flagship department store
of Filene’s Basement. At the time, this century-old institution in down-
town Boston was the city’s second-most-popular tourist attraction
(after Fenway Park); it finally closed its doors in 2007. His mentors
taught him that when employees worked in brightly lit, open spaces,
11 Martin E. P. Seligman, Helplessness: On Depression, Development, and Death, first edition, San Francisco, CA: W. H. Freeman, 1975.

91Bad to great: The path to scaling up excellence
the amount of lost, damaged, or stolen merchandise fell and labor
efficiency rose. An experiment by the University of Toronto’s
Chen-Bo Zhong and his colleagues bolsters Dearing’s insight.12 They
found that people are less honest and more selfish when they work in
darker rooms or wear sunglasses rather than clear glasses.
Accountability is difficult to sustain when employees see the people
they serve as nameless and faceless. Making their humanity more
vivid to employees increases accountability. In a study by Emory
University’s Srini Tridandapani and his colleagues,13 for instance,
ten licensed radiologists were asked to examine 20 pairs of chest
X-rays. Each pair was supposed to be for the same patient at two
different junctures in his or her life. Most were, but two to four pairs
in each set were intentionally mismatched, so that the radiologists
actually reviewed pictures of different patients. When they saw the
first 200 images, they detected 12.5 percent of the mismatches. Each
radiologist was then asked to review another batch of pairs of chest
X-rays from different patients; as before, there were mismatches in
each set. This time the patient’s picture was attached to each pair of
X-rays. The radiologists detected 64 percent of the mismatches.
This stark contrast is instructive for anyone bent on stamping out bad
behavior and scaling up excellence: leaders and employees do the
right thing when they focus, not on their own needs and wants, but
on the people affected by their actions.
12 Vanessa K. Bohns, Francesca Gino, and Chen-Bo Zhong, “Good lamps are the best police: Darkness increases dishonesty and self-interested behavior,” Psychological Science, 2010, Volume 21, Number 3, pp. 311–14.
13 Srini Tridandapani et al., “Increasing rate of detection of wrong-patient radiographs: Use of photographs obtained at time of radiography,” American Journal of Roentgenology, 2013, Volume 200, Number 4, pp. W345–W352; and Irith Hadas-Halpern, David Raveh, and Yehonatan N. Turner, “The effects of including a patient’s photograph to the radiographic examination,” paper presented at the 94th meeting of the Radiological Society of North America, 2008.
Huggy Rao is the Atholl McBean Professor of Organizational Behavior and Human Resources in the Graduate School of Business at Stanford University. Robert Sutton is a professor of management science and engineering at the Stanford School of Engineering. This article is adapted from their forthcoming book, Scaling Up Excellence: Getting to More without Settling for Less (Crown Business, February 2014).
Copyright © 2014 McKinsey & Company. All rights reserved.

Illus
trat
ion
by T
hom
Sev
alru
d
94Views from the front lines of the data-analytics revolutionBrad Brown,
David Court, and
Tim McGuire
102What executives should know about ‘open data’ Michael Chui,
James Manyika, and
Steve Van Kuiken
106The benefits— and limits—of decision models Phil Rosenzweig
Data analytics: Getting to the next level

93
The top-management implications of data analytics continue to
grow. In this package, eight executives at the forefront offer their
perspectives on applying advanced analytics to real business
problems. Avoid lapsing into management autopilot cautions IMD
professor Phil Rosenzweig, who flags the limitations of models
for decisions in which leadership, initiative, and confidence heavily
influence outcomes. And embrace the flood of openly available
data, which is amping up big data’s disruptive power, according to
new research from the McKinsey Global Institute.
94
This past October, eight executives from companies that are
leaders in data analytics got together to share perspectives on their
biggest challenges. All were the most senior executives with
data-analytics responsibility in their companies, which included
AIG, American Express, Samsung Mobile, Siemens Healthcare,
TD Bank, and Wal-Mart Stores. Their backgrounds varied, with chief
information officers, a chief data officer, a chief marketing officer,
a chief risk officer, and a chief science officer all represented.1 We had
seeded the discussion by asking each of them in advance about the
burning issues they were facing.
Views from the front lines of the data-analytics revolution
At a unique gathering of data-analytics
leaders, new solutions began emerging
to vexing privacy, talent, organizational, and
frontline-adoption challenges.
Brad Brown, David Court, and Tim McGuire
1 Murli Buluswar, chief science officer, AIG Property Casualty; Ash Gupta, president, Risk and Information Management, and chief risk officer, American Express; Mark Ramsey, chief data officer, Samsung Mobile; John Glaser, chief executive officer, Health Services, Siemens Healthcare; Teri Currie, group head, Direct Channels, Corporate Shared Services, Marketing, and People Strategies, TD Bank; Karenann Terrell, executive vice president and chief information officer, Wal-Mart Stores.
9595
For these executives, the top five questions were:
• Are data and analytics overhyped?
• Do privacy issues threaten progress?
• Is talent acquisition slowing strategy?
• What organizational models work best?
• What’s the best way to assure adoption?
Here is a synthesis of the discussion.
1. Data and analytics aren’t overhyped—but they’re oversimplified
Participants all agreed that the expectations of senior management
are a real issue. Big-data analytics are delivering an economic impact
in the organization, but too often senior leaders’ hopes for benefits
are divorced from the realities of frontline application. That leaves
them ill prepared for the challenges that inevitably arise and quickly
breed skepticism.
The focus on applications helps companies to move away from “the
helicopter view,” noted one participant, in which “it all looks
the same.” The reality of where and how data analytics can improve
performance varies dramatically by company and industry.
Customer-facing activities. In some industries, such as telecommuni-
cations, this is where the greatest opportunities lie. Here, companies
benefit most when they focus on analytics models that optimize
pricing of services across consumer life cycles, maximize marketing
spending by predicting areas where product promotions will be
most effective, and identify tactics for customer retention.
Internal applications. In other industries, such as transportation
services, models will focus on process efficiencies—optimizing
96 2014 Number 1
routes, for example, or scheduling crews given variations in worker
availability and demand.
Hybrid applications. Other industries need a balance of both. Retailers,
for example, can harness data to influence next-product-to-buy
decisions and to optimize location choices for new stores or to map
product flows through supply chains. Insurers, similarly, want to
predict features that will help them extend product lines and assess
emerging areas of portfolio risk. Establishing priorities wisely and
with a realistic sense of the associated challenges lies at the heart of
a successful data-analytics strategy.
Companies need to operate along two horizons: capturing quick
wins to build momentum while keeping sight of longer-term, ground-
breaking applications. Although, as one executive noted, “We
carefully measure our near-term impact and generate internal ‘buzz’
around these results,” there was also a strong belief in the room
that the journey crosses several horizons. “We are just seeing the tip
of the iceberg,” said one participant. Many believed that the real
prize lies in reimagining existing businesses or launching entirely
new ones based on the data companies possess.
New opportunities will continue to open up. For example, there was
a growing awareness, among participants, of the potential of tapping
swelling reservoirs of external data—sometimes known as open
data—and combining them with existing proprietary data to improve
models and business outcomes. (See “What executives should
know about ‘open data,’” on page 102.) Hedge funds have been
among the first to exploit a flood of newly accessible government
Establishing priorities wisely and with a realistic sense of the associated challenges lies at the heart of a successful data-analytics strategy.
97
data, correlating that information with stock-price movements to
spot short-term investment opportunities. Corporations with longer
investment time horizons will need a different playbook for open
data, but few participants doubted the value of developing one.
2. Privacy concerns must be addressed—and giving consumers control can help
Privacy has become the third rail in the public discussion of big data,
as media accounts have rightly pointed out excesses in some data-
gathering methods. Little wonder that consumer wariness has risen.
(Data concerns seem smaller in the business-to-business realm.)
The flip side is that data analytics increasingly provides consumers,
not to mention companies and governments, with a raft of benefits,
such as improved health-care outcomes, new products precisely
reflecting consumer preferences, or more useful and meaningful
digital experiences resulting from a greater ability to customize
information. These benefits, by necessity, rest upon the collection,
storage, and analysis of large, granular data sets that describe
real people.
Our analytics leaders were unanimous in their view that placing
more control of information in the hands of consumers, along with
building their trust, is the right path forward.
Opt-in models. A first step is allowing consumers to opt in or opt
out of the collection, sharing, and use of their data. As one example,
data aggregator Acxiom recently launched a website (aboutthedata
.com) that allows consumers to review, edit, and limit the distribution
of the data the company has collected about them. Consumers,
for instance, may choose to limit the sharing of their data for use in
targeted Internet ads. They control the trade-off between targeted
(but less private) ads and nontargeted ones (potentially offering
less value).
Company behavior. Our panelists presume that in the data-collection
arena, the motives of companies are good and organizations will
act responsibly. But they must earn this trust continually; recovering
from a single privacy breach or misjudgment could take years.
Installing internal practices that reinforce good data stewardship,
Views from the front lines of the data-analytics revolution
98 2014 Number 1
while also communicating the benefits of data analytics to customers,
is of paramount importance. In the words of one participant:
“Consumers will trust companies that are true to their value propo-
sition. If we focus on delivering that, consumers will be delighted.
If we stray, we’re in problem territory.”
3. Talent challenges are stimulating innovative approaches—but more is needed
Talent is a hot issue for everyone. It extends far beyond the notoriously
short supply of IT and analytics professionals. Even companies
that are starting to crack the skill problem through creative recruiting
and compensation strategies are finding themselves shorthanded
in another area: they need more “translators”—people whose talents
bridge the disciplines of IT and data, analytics, and business
decision making. These translators can drive the design and execution
of the overall data-analytics strategy while linking IT, analytics,
and business-unit teams. Without such employees, the impact
of new data strategies, tools, and methodologies, no matter how
advanced, is disappointing.
The amalgam is rare, however. In a more likely talent scenario,
companies find individuals who combine two of the three needed
skills. The data strategists’ combination of IT knowledge and
experience making business decisions makes them well suited to
define the data requirements for high-value business analytics.
Data scientists combine deep analytics expertise with IT know-how
to develop sophisticated models and algorithms. Analytic
consultants combine practical business knowledge with analytics
experience to zero in on high-impact opportunities for analytics.
A widespread observation among participants was that the usual
sources of talent—elite universities and MBA programs—are falling
short. Few are developing the courses needed to turn out people
with these combinations of skills. To compensate, and to get more
individuals grounded in business and quantitative skills, some
companies are luring data scientists from leading Internet companies;
others are looking offshore.
99
The management and retention of these special individuals requires
changes in mind-set and culture. Job one: provide space and
freedom to stimulate exploration of new approaches and insights. “At
times, you may not know exactly what they”—data scientists—
“will find,” one executive noted in describing the company’s efforts to
provide more latitude for innovation. (So far, these efforts are
boosting retention rates.) Another priority: create a vibrant environ-
ment so top talent feels it’s at the cutting edge of technology
change and emerging best practices. Stimulating engagement with
the data-analytics ecosystem (including venture capitalists,
analytics start-ups, and established analytics vendors) can help.
4. You need a center of excellence—and it needs to evolve
To catalyze analytics efforts, nearly every company was using a center
of excellence, which works with businesses to develop and deploy
analytics rapidly. Most often, it includes data scientists, business
specialists, and tool developers. Companies are establishing these
centers in part because business leaders need the help. Centers of
excellence also boost the organization-wide impact of the scarce
translator talent described above. They can even help attract and retain
talent: at their best, centers are hotbeds of learning and innovation
as teams share ideas on how to construct robust data sets, build
powerful models, and translate them into valuable business tools.
Our participants agreed that it’s worth creating a center of excellence
only if you can locate it in a part of the company where data-analytics
assets or capabilities could have a dramatic strategic impact. For
some companies, this meant IT; for others, marketing and sales or
large business units. At one company, for instance, the analytics
agenda is focused on exploiting a massive set of core transactional
data across several businesses and functions. In this case, the center
of excellence resides within IT to leverage its deep knowledge of
this core data set and its role as a shared capability across businesses.
The goal should be for these centers to be so successful at building
data-analytics capabilities across the organization that they can
Views from the front lines of the data-analytics revolution
100 2014 Number 1
tackle increasingly ambitious priorities. One executive suggests
that as businesses build their analytics muscle, centers of excellence
will increasingly focus on longer-term projects more akin to
sophisticated R&D, with an emphasis on analytics innovation and
breakthrough insights.
5. Two paths to spur adoption—and both require investment
Frontline adoption was the most important issue for many leaders.
Getting managers and individual contributors to use new tools pur-
posefully and enthusiastically is a huge challenge. As we have
written elsewhere,2 companies simply don’t invest enough, in time
or money, to develop killer applications that combine smart,
intuitive design and robust functionality. However, our participants
see two clear paths leading to broad adoption.
Automation. One avenue to spurring adoption works for relatively
simple, repetitive analytics: creating intuitive end-user interfaces
that can be rolled out rapidly and with little training. For example, a
mobile application on a smartphone or tablet might give brand
managers instant visibility into volume and sales trends, market share,
and average prices. These tools become part of the daily flow of
decision making, helping managers to figure out how intensely to
promote products, when tactical shifts in pricing may be necessary
to match competitors, or, over time, where to begin pushing for new
products. According to one executive, “Little or no training is
required” with simple tools like these. Provided they are “clear and
well designed, with strong visualization qualities, end users will
seek them out.”
Training. A second path requires significant investments in training
to support more complex analytics. Consider a tool for underwriting
small and midsize business loans. The tool combines underwriters’
knowledge and the power of models, which bring consistency across
2 Brad Brown, David Court, and Paul Willmott, “Mobilizing your C-suite for big-data analytics,” McKinsey Quarterly, November 2013; and Stefan Biesdorf, David Court, and Paul Willmott, “Big data: What’s your plan?,” McKinsey Quarterly, March 2013, both available on mckinsey.com.
101
underwriting judgments, clarifying risks and minimizing biases.
But underwriters need training to understand where the model fits
into the underwriting process flow and how they can incorporate
what the models and tools say into their own experience of customer
characteristics and their business priorities.
Whichever path is chosen, it should start with pilot efforts and clear
rules for making “go/no-go” decisions about the shift from exploratory
analytics to a full-scale rollout. Some models don’t end up being
predictive enough to deliver the desired impact; better to shelve them
before they become investment sinkholes and undermine organi-
zational confidence in analytics. Executives need to be willing to press
“pause” and remind the organization that the failure of some ana-
lytics initiatives to materialize is nothing to worry about; in fact, this
is the reason for pursuing a portfolio of them. The combination
of success stories and hard-nosed decisions to pull the plug is all
part of creating a climate where business units, functions, top
management, and frontline employees embrace the transformational
possibilities of data analytics.
The authors would like to acknowledge the contributions of Brian Tauke and Isaac Townsend to the development of this article.
Brad Brown is a director in McKinsey’s New York office, David Court is a director in the Dallas office, and Tim McGuire is a director in the Toronto office.
Views from the front lines of the data-analytics revolution

102
Not all data that’s valuable is internal and proprietary. New
initiatives by governments as diverse as those of the United States,
Mexico, and Singapore are opening the spigots of readily usable
public data. Corporate information too is becoming more “liquid,”
moving across the economy as companies begin sharing data with
their business partners and, sometimes, consumers. Also surging is
the richness of the information from data aggregators, which are
assembling, rendering anonymous, and selling (to interested third
parties) a wide range of data flows. Then add huge volumes of
data from social-media interactions, available from providers of
digital platforms such as Twitter and Facebook.1
These new sources of open data represent an expanding trove of
largely unexploited value. One everyday illustration of open data at
work is a smartphone app that uses real-time data (provided by
transit authorities) to tell commuters when the next bus or train will
arrive. Using open or pooled data from many sources—all the
businesses in a particular sector, for example—often combined with
proprietary big data, can help companies develop insights they
could not have uncovered with internal data alone.
What executives should know about ‘open data’
Novel and more accessible forms of
information from government and private
sources represent a new and rapidly
growing piece of the big-data puzzle.
Michael Chui, James Manyika, and Steve Van Kuiken
1 Data sets range from completely open to completely closed, across four dimensions: accessibility (the range of users permitted to access the data), machine readability (the ease with which the data can be processed automatically), cost (the price to obtain data), and rights (limitations on the use, transformation, and distribution of the data).
103
Demographic data, financial transactions, health-care benchmarks,
and real-time location data are among the myriad new information
sources a company can exploit to create novel products and
services and to make its operations more effective and efficient. New
research from the McKinsey Global Institute, the McKinsey
Center for Government, and McKinsey’s Business Technology Office
suggests that $3 trillion or more in annual value could arise from
the use of open data in applications across seven domains of the global
economy (exhibit). About a third of those potential benefits would
involve the use of benchmarks to identify areas for improvement.
Whether or not individual executives at large companies choose to
work with open data of various types, the magnitude of the value
at stake suggests that some of them will—and that these applications
will probably affect a wide range of industries, markets, and
customers. Layering open-data mandates into the ongoing develop-
ment of data and analytics strategies by considering both the
use and sharing of more liquid data should therefore become an
increasingly important priority for a wide range of companies.
Here are a few examples of open data’s potential:
• Energy exploration. As new technologies have made it possible to
drill in a wider range of geological formations, reservoirs have
become more complex. That’s raising costs and risks—estimated
ratios of prospects to explored targets can be as high as 50 to 1.
The sharing of information on drilling permits and on seismic and
other data across companies could reduce the number of dry
holes and help optimize investments. While the widespread sharing
of seismic data is unlikely, sharing among even a few companies
could produce significant new value in the oil and gas industry.
Governments keen on maximizing resource wealth could take
the lead in structuring processes for granting permits so that grants
of initial drilling licenses would require greater sharing of seismic
data. Sharing data on projected costs and development timetables
(through third parties) could establish benchmarks that, we
estimate, would reduce per-project costs by 15 to 25 percent.
• Consumer insights. In the consumer-products sector, sharing data
among retailers and manufacturers in limited circumstances—
avoiding exchanges with direct competitors, for example—could
lead to marketing approaches not possible with proprietary data
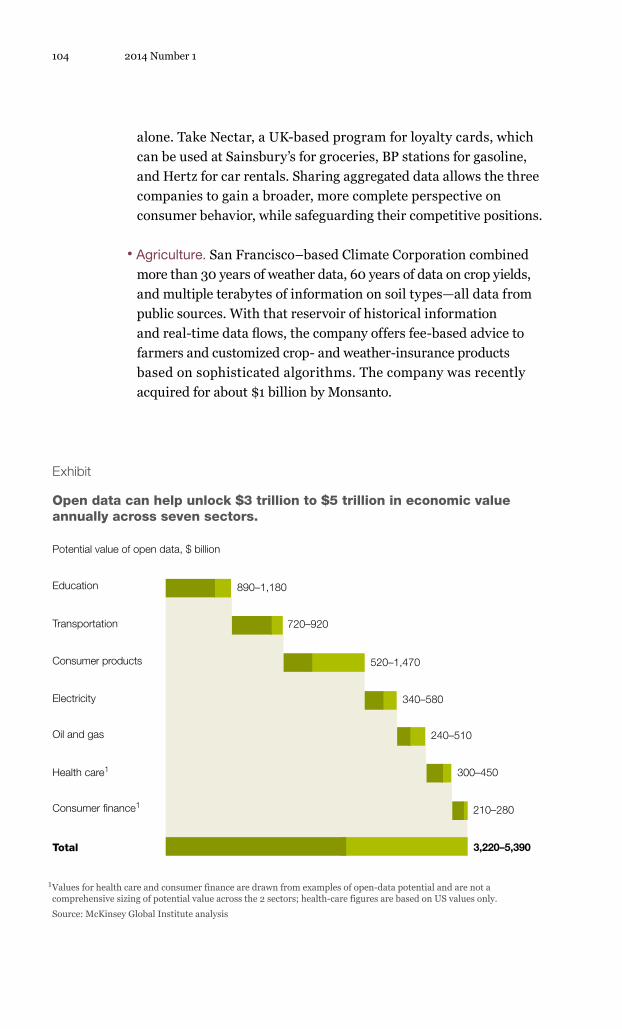
104 2014 Number 1
alone. Take Nectar, a UK-based program for loyalty cards, which
can be used at Sainsbury’s for groceries, BP stations for gasoline,
and Hertz for car rentals. Sharing aggregated data allows the three
companies to gain a broader, more complete perspective on
consumer behavior, while safeguarding their competitive positions.
• Agriculture. San Francisco–based Climate Corporation combined
more than 30 years of weather data, 60 years of data on crop yields,
and multiple terabytes of information on soil types—all data from
public sources. With that reservoir of historical information
and real-time data flows, the company offers fee-based advice to
farmers and customized crop- and weather-insurance products
based on sophisticated algorithms. The company was recently
acquired for about $1 billion by Monsanto. Q1 2014Open DataExhibit 1 of 1
Open data can help unlock $3 trillion to $5 trillion in economic value annually across seven sectors.
1 Values for health care and consumer finance are drawn from examples of open-data potential and are not a comprehensive sizing of potential value across the 2 sectors; health-care figures are based on US values only.
Source: McKinsey Global Institute analysis
Education
Potential value of open data, $ billion
Transportation
Consumer products
Electricity
Oil and gas
Health care1
Consumer finance1
Total
890–1,180
720–920
520–1,470
340–580
240–510
300–450
210–280
3,220–5,390
Exhibit
105
Other possibilities abound. Premium pricing for some goods could
be facilitated if companies shared detailed information about products,
such as the materials they use or the conditions under which they
were manufactured (for example, with renewable energy). On the flip
side, open-data applications may also create new areas of consumer
value. In a budding trend known as MyData, organizations share infor-
mation they have collected about individuals with them, in useful
forms. Patients could access targeted medical data from a hospital,
for instance, to help them manage their health.
Powerful as open data can be, many companies have valid concerns.
Consider the sharing of data to establish industry benchmarks.
Even if a company uses a third party and gets assurances of anonymity,
there’s always a risk that its identity might be revealed and that
competitors could see how well or poorly it was doing. Shared data
also could give away sources of competitive advantage or com-
promise intellectual property. Similarly, tapping social data could
heighten privacy worries among consumers.
Still, it’s hard to imagine that the open-data wave will slow down.
Third-party open-data aggregators will certainly proceed to sell and
publish corporate data, such as customer ratings, safety records,
defect complaints and recalls, and comparative price data. Open-data
initiatives also continue to proliferate in the public sector. In
June 2013, G8 governments adopted an Open Data Charter, which
establishes the expectation that the default policy should be
the open publication of government data. Traditional competitors
and entrepreneurial attackers can take advantage of open-data
sources such as social-media comments and crowdsourced ideas to
come up with new products and services. Open data, in short,
seems to be another of the many relentless shifts in the digital land-
scape to appear unexpectedly, create new opportunities and strategic
complexities, and leave established players with no place to hide.
The authors would like to acknowledge the contributions of Diana Farrell and Peter Groves to this article.
Michael Chui is a principal of the McKinsey Global Institute, where James Manyika is a director; both are based in McKinsey’s San Francisco office. Steve Van Kuiken is a director in the New Jersey office.
For more on this research, see the full McKinsey report, Open data: Unlocking innovation and performance with liquid information, on mckinsey.com.
What executives should know about ‘open data’
106
The growing power of decision models has captured plenty of
C-suite attention in recent years. Combining vast amounts of data
and increasingly sophisticated algorithms, modeling has opened
up new pathways for improving corporate performance.1 Models can
be immensely useful, often making very accurate predictions or
guiding knotty optimization choices and, in the process, can help
companies to avoid some of the common biases that at times under-
mine leaders’ judgments.
Yet when organizations embrace decision models, they sometimes
overlook the need to use them well. In this article, I’ll address an
important distinction between outcomes leaders can influence and
those they cannot. For things that executives cannot directly
influence, accurate judgments are paramount and the new modeling
tools can be valuable. However, when a senior manager can have a
direct influence over the outcome of a decision, the challenge is quite
different. In this case, the task isn’t to predict what will happen but
The benefits—and limits—of decision models
Big data and models help overcome biases
that cloud judgment, but many executive
decisions also require bold action inspired
by self-confidence. Here’s how to take
charge in a clear-headed way.
Phil Rosenzweig
1 See these recent articles: Brad Brown, Michael Chui, and James Manyika, “Are you ready for the era of ‘big data’?,” McKinsey Quarterly, October 2011; Erik Brynjolfsson, Jeff Hammerbacher, and Brad Stevens, “Competing through data: Three experts offer their game plans,” McKinsey Quarterly, October 2011; Brad Brown, David Court, and Paul Willmott, “Mobilizing your C-suite for big-data analytics,” McKinsey Quarterly, November 2013; and Stefan Biesdorf, David Court, and Paul Willmott, “Big data: What’s your plan?,” McKinsey Quarterly, March 2013, all available on mckinsey.com.
107
to make it happen. Here, positive thinking—indeed, a healthy
dose of management confidence—can make the difference between
success and failure.
Where models work well
Examples of successful decision models are numerous and growing.
Retailers gather real-time information about customer behavior
by monitoring preferences and spending patterns. They can also run
experiments to test the impact of changes in pricing or packaging
and then rapidly observe the quantities sold. Banks approve loans and
insurance companies extend coverage, basing their decisions on
models that are continually updated, factoring in the most infor-
mation to make the best decisions.
Some recent applications are truly dazzling. Certain companies
analyze masses of financial transactions in real time to detect fraud-
ulent credit-card use. A number of companies are gathering years
of data about temperature and rainfall across the United States to run
weather simulations and help farmers decide what to plant and
when. Better risk management and improved crop yields are the result.
Other examples of decision models border on the humorous. Garth
Sundem and John Tierney devised a model to shed light on what
they described, tongues firmly in cheek, as one of the world’s great
unsolved mysteries: how long will a celebrity marriage last? They
came up with the Sundem/Tierney Unified Celebrity Theory, which
predicted the length of a marriage based on the couple’s combined
age (older was better), whether either had tied the knot before (failed
marriages were not a good sign), and how long they had dated (the
longer the better). The model also took into account fame (measured
by hits on a Google search) and sex appeal (the share of those
Google hits that came up with images of the wife scantily clad). With
only a handful of variables, the model did a very good job of
predicting the fate of celebrity marriages over the next few years.
Models have also shown remarkable power in fields that are usually
considered the domain of experts. With data from France’s premier
wine-producing regions, Bordeaux and Burgundy, Princeton
economist Orley Ashenfelter devised a model that used just three

108 2014 Number 1
variables to predict the quality of a vintage: winter rainfall, harvest
rainfall, and average growing-season temperature. To the surprise of
many, the model outperformed wine connoisseurs.
Why do decision models perform so well? In part because they can
gather vast quantities of data, but also because they avoid common
biases that undermine human judgment.2 People tend to be overly
precise, believing that their estimates will be more accurate than they
really are. They suffer from the recency bias, placing too much
weight on the most immediate information. They are also unreliable:
ask someone the same question on two different occasions and you
may get two different answers. Decision models have none of these
drawbacks; they weigh all data objectively and evenly. No wonder
they do better than humans.
Can we control outcomes?
With so many impressive examples, we might conclude that decision
models can improve just about anything. That would be a mistake.
Executives need not only to appreciate the power of models but also
to be cognizant of their limits.
Look back over the previous examples. In every case, the goal was to
make a prediction about something that could not be influenced
directly. Models can estimate whether a loan will be repaid but won’t
actually change the likelihood that payments will arrive on time,
give borrowers a greater capacity to pay, or make sure they don’t
squander their money before payment is due. Models can predict the
rainfall and days of sunshine on a given farm in central Iowa but
can’t change the weather. They can estimate how long a celebrity mar-
riage might last but won’t help it last longer or cause another to
end sooner. They can predict the quality of a wine vintage but won’t
make the wine any better, reduce its acidity, improve the balance, or
change the undertones. For these sorts of estimates, finding ways
to avoid bias and maintain accuracy is essential.
2 Dan P. Lovallo and Olivier Sibony, “Distortions and deceptions in strategic decisions,” McKinsey Quarterly, February 2006, mckinsey.com.
109
Executives, however, are not concerned only with predicting things
they cannot influence. Their primary duty—as the word execution
implies—is to get things done. The task of leadership is to mobilize
people to achieve a desired end. For that, leaders need to inspire
their followers to reach demanding goals, perhaps even to do more
than they have done before or believe is possible. Here, positive
thinking matters. Holding a somewhat exaggerated level of self-
confidence isn’t a dangerous bias; it often helps to stimulate
higher performance.
This distinction seems simple but it’s often overlooked. In our embrace
of decision models, we sometimes forget that so much of life is
about getting things done, not predicting things we cannot control.
The insight of Billy Beane . . .
The failure to distinguish between what we can and cannot control
has led to confusion in many fields. Perhaps nowhere has the
gap been more evident than in the application of decision models to
baseball. For decades, baseball managers made tactical decisions
according to an unwritten set of rules, known as going by the book.
Beginning in the 1970s, a group of statistically minded fans—
practitioners of sabermetrics, a term coined in honor of the Society
for American Baseball Research—began to apply the power of
data analysis to test some of baseball’s cherished notions, often with
surprising results.
The benefits—and limits—of decision models

110 2014 Number 1
Take a common tactic, the sacrifice bunt. With a runner on first base
and one or no outs, should the batter bunt the ball to advance the
runner? Conventional wisdom said yes. As Bill James, a pioneer of
sabermetrics, put it, “The experts all knew that when there was
a runner on first and no one out, the percentage move was to bunt.”3
Until recently, there was no way to conduct a decent empirical
analysis of the sacrifice bunt, but now there is. A simple test compares
the runs that result from two situations: a runner at first base
with no outs and a runner at second base with one out. Analyzing an
entire season of major-league games revealed that, on average,
making an out to advance the runner leads to fewer runs. The sacrifice
bunt is just one example of how conventional wisdom in baseball
can be wrong. James concluded, “A very, very large percentage of the
things that the experts all knew to be true turned out, on examination,
not to be true at all.”4
The use of data analysis was the key insight of Michael Lewis’s 2003
bestseller, Moneyball: The Art of Winning an Unfair Game. Lewis
described how the Oakland Athletics, a low-budget team in a
small market, posted several consecutive years of excellent results.
Athletics general manager Billy Beane used decision models to
discover what truly led to a winning performance and applied those
insights to assemble a team of very good players at bargain prices.
In “decision speak,” he was trying to optimize runs scored per
dollar spent. Oakland compiled a strong record for several consec-
utive years, despite a low payroll, largely thanks to its reliance
on decision analytics.
With the publication of Moneyball, the use of statistics in baseball
became widely accepted. Statistically minded general managers,
some of them disciples of Billy Beane, spread throughout major-
league baseball. Soon a host of new statistics was devised to measure
increasingly esoteric aspects of play. One tracks the location and
velocity of every single pitch, providing for the ever-finer analysis of
any pitcher’s performance. Another records every ball in play
and extends statistical analysis to fielding, the aspect of play least
amenable to quantification. Insights into the batting patterns of
3 Bill James, Solid Fool’s Gold: Detours on the Way to Conventional Wisdom, first edition, Chicago, IL: ACTA Sports, 2011, p. 185.
4 James, p. 186.
111
individual players now help teams to shift the positions of their
fielders for each batter. America’s pastime has fully embraced the
digital age, bringing Cupertino to Cooperstown.
. . . and the wisdom of Joe Morgan
The notion that players could be evaluated by statistical models was
not universally accepted. Players, in particular, insisted that perform-
ance couldn’t be reduced to figures. Statistics don’t capture the
intangibles of the game, they argued, or grasp the subtle qualities that
make players great. Of all the critics, none was more outspoken
than Joe Morgan, a star player from the 1960s and 1970s. “I don’t think
that statistics are what the game is about,” Morgan insisted.
“I played the Game. I know what happens out there. . . . Players win
games. Not theories.”5
Proponents of statistical analysis dismissed Joe Morgan as unwilling
to accept the truth, but in fact he wasn’t entirely wrong. Models are
useful in predicting things we cannot control, but for players—on the
field and in the midst of a game—the reality is different. Players
don’t predict performance; they have to achieve it. For that purpose,
impartial and dispassionate analysis is insufficient. Positive thinking
matters, too.
When we stand back from the claims and counterclaims, Billy Beane
and Joe Morgan are both right—just about different things. The job
of a general manager is to assemble a team that will perform well on
the field. When general managers evaluate players, decide whom
to sign and how much to pay, whom to promote and whom to trade,
they do best by relying on dispassionate analysis. There’s nothing
to be gained from wishful thinking or biased judgments. Billy Beane
was known to work out in the clubhouse gym during games rather
than watch the action on the diamond. Why? Because as general
manager, he doesn’t throw a ball or swing a bat. He can exercise con-
trol over the composition of the team, but once the game begins
he’s powerless.
The benefits—and limits—of decision models
5 Tommy Craggs, “Say-It-Ain’t-So Joe,” SF Weekly, July 6, 2005, sfweekly.com.
112 2014 Number 1
For players, the reality is entirely different: their job is to hit the ball
and drive in the runs. A mind-set with high self-confidence—even
a level of confidence that is, by some definitions, slightly excessive—
is vital. Perhaps it shouldn’t be surprising that this point was
articulated so intuitively by Joe Morgan, a diminutive man who not
only won the National League’s Most Valuable Player award in
1975 and 1976 but is also considered one of the greatest second base-
men of all time.
Pitting baseball traditionalists against proponents of statistical
analysis makes for a spirited debate. But that’s a false dichotomy, not
conducive to a better understanding of the game. When the
Moneyball controversy was at its height, St. Louis Cardinals manager
Tony LaRussa wisely observed that no single approach was best:
“The ‘Moneyball’ kind of stuff has its place, but so does the human.
Really, the combination is the answer.”6
The same distinction applies to managers of all kinds. The question,
boiled down to its essence, is whether we are trying to predict
something we cannot influence or something we can control, at least
in part. Decision models are increasingly powerful for tasks
requiring the impartial analysis of vast amounts of data. When we
can and must shape outcomes, however, they do not suffice. An
executive may be wise to rely on decision models when estimating
consumer reactions to a promotion or meteorological conditions,
but motivating a team to achieve high performance is a different
matter. A combination of skills is the answer.
6 David Leonhardt, “Science and art at odds on the field of dreams,” the New York Times, August 29, 2005, nytimes.com.
Part of the appeal of decision models lies in their ability to make predictions, to compare those predictions with what actually happens, and then to evolve so as to make more accurate predictions.
113
Influence, direct and indirect
The use of decision models raises a third possibility, in addition to
direct influence and no influence: indirect influence. Even if we cannot
directly shape an outcome, a model’s prediction may be commu-
nicated in a way that alters behavior and indirectly shapes an outcome.
Indirect influence takes two forms. If it increases the chance
an event will occur, that’s a self-fulfilling prediction. If it lowers the
chance an event will occur, that’s a self-negating prediction.
Consider a bank that uses a decision model to review loan applications.
The model has no direct influence on a borrower’s behavior; it
can’t control spending habits or make sure that anyone saves enough
money each month to repay a loan. Suppose that instead of simply
turning down the application, however, a banker meets an aspiring
borrower and explains the reasons for concern. Such an inter-
vention could cause the applicant to behave differently, perhaps by
devising a monthly budget or by asking for direct payment via
payroll deduction. Even though the model had no direct influence on
the outcome, it could exert an indirect influence. The same goes
for one of the most impressive examples of decision models in recent
years: the electoral model. Models do not directly affect the out-
come of an election—they do not cast votes. But if the projections of
models are communicated broadly, they may embolden some sup-
porters and discourage others, and thereby have an indirect influence.
The crucial lesson for executives is not simply to marvel at the power
of decision analytics but also to understand the role these techniques
play in achieving a desired outcome. If that outcome is an accurate
prediction, models have unparalleled power. If we can shape it, then
concerted effort—aided by positive thinking—can be vital. And in
some instances, the output of a decision model can be communicated
to influence a desired outcome indirectly. Models are powerful
tools; keeping in mind the desired end is paramount.
Improving models over time
Part of the appeal of decision models lies in their ability to make
predictions, to compare those predictions with what actually
happens, and then to evolve so as to make more accurate predictions.
The benefits—and limits—of decision models
114 2014 Number 1
In retailing, for example, companies can run experiments with
different combinations of price and packaging, then rapidly obtain
feedback and alter their marketing strategy. Netflix captures
rapid feedback to learn what programs have the greatest appeal and
then uses those insights to adjust its offerings. Models are not
only useful at any particular moment but can also be updated over
time to become more and more accurate.
Using feedback to improve models is a powerful technique but is
more applicable in some settings than in others. Dynamic improve-
ment depends on two features: first, the observation of results
should not make any future occurrence either more or less likely and,
second, the feedback cycle of observation and adjustment should
happen rapidly. Both conditions hold in retailing, where customer
behavior can be measured without directly altering it and results
can be applied rapidly, with prices or other features changed almost
in real time. They also hold in weather forecasting, since daily
measurements can refine models and help to improve subsequent
predictions. The steady improvement of models that predict
weather—from an average error (in the maximum temperature) of
6 degrees Fahrenheit in the early 1970s to 5 degrees in the 1990s
and just 4 by 2010—is testimony to the power of updated models.
For other events, however, these two conditions may not be present.
As noted, executives not only estimate things they cannot affect
but are also charged with bringing about outcomes. Some of the most
consequential decisions of all—including the launch of a new
product, entry into a new market, or the acquisition of a rival—are
about mobilizing resources to get things done. Furthermore, the
results are not immediately visible and may take months or years to
unfold. The ability to gather and insert objective feedback into
a model, to update it, and to make a better decision the next time just
isn’t present.
None of these caveats call into question the considerable power of
decision analysis and predictive models in so many domains.
They help underscore the main point: an appreciation of decision
115
analytics is important, but an understanding of when these
techniques are useful and of their limitations is essential, too.
Most executives today would probably admit that they are over-
whelmed by the volume and complexity of the decisions they face
and are grateful when models may relieve some of the burden.
But they need to be careful. Decision models are often so impressive
that it’s easy to be seduced by them and to overlook the need to
use them wisely. As University of Calgary associate professor Jeremy
Fox observed, the growing popularity of “technically sophisticated,
computationally intensive statistical approaches” has an unfortunate
side effect: a “shut up and calculate the numbers” ethos, rather
than one that promotes critical thinking and stimulates ideas about
what the numbers actually mean.7 Before leaders and their teams
apply models, they should step back and consider their ability to
influence the outcome. When it is high, the answer isn’t to ignore
the data and fly blind, but to establish priorities for tipping the
scales through the strength and confidence that are hallmarks of
effective leadership.
The benefits—and limits—of decision models
Phil Rosenzweig is a professor of strategy and international business at the International Institute for Management Development (IMD), in Lausanne, Switzerland. This article is adapted from his new book, Left Brain, Right Stuff: How Leaders Make Winning Decisions (PublicAffairs, January 2014).
7 Oikos Online, “Frequentist vs. Bayesian statistics: Resources to help you choose,” blog entry by Jeremy Fox, October 11, 2011, oikosjournal.wordpress.com.
Copyright © 2014 McKinsey & Company. All rights reserved.
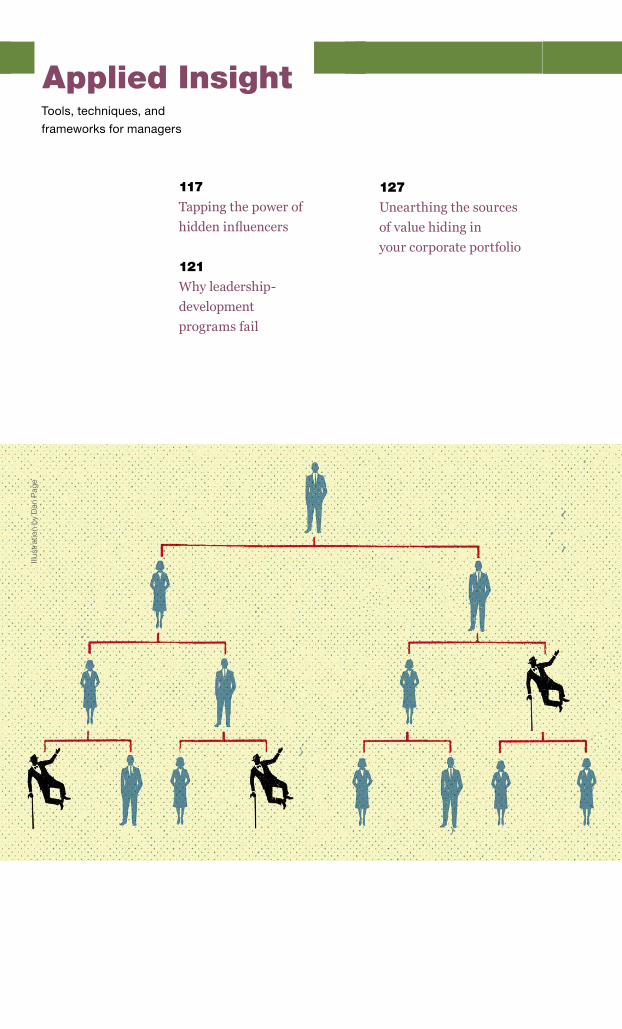
Applied InsightTools, techniques, and
frameworks for managers
127
Unearthing the sources
of value hiding in
your corporate portfolio
117
Tapping the power of
hidden influencers
121
Why leadership-
development
programs fail
Illus
trat
ion
by D
an P
age
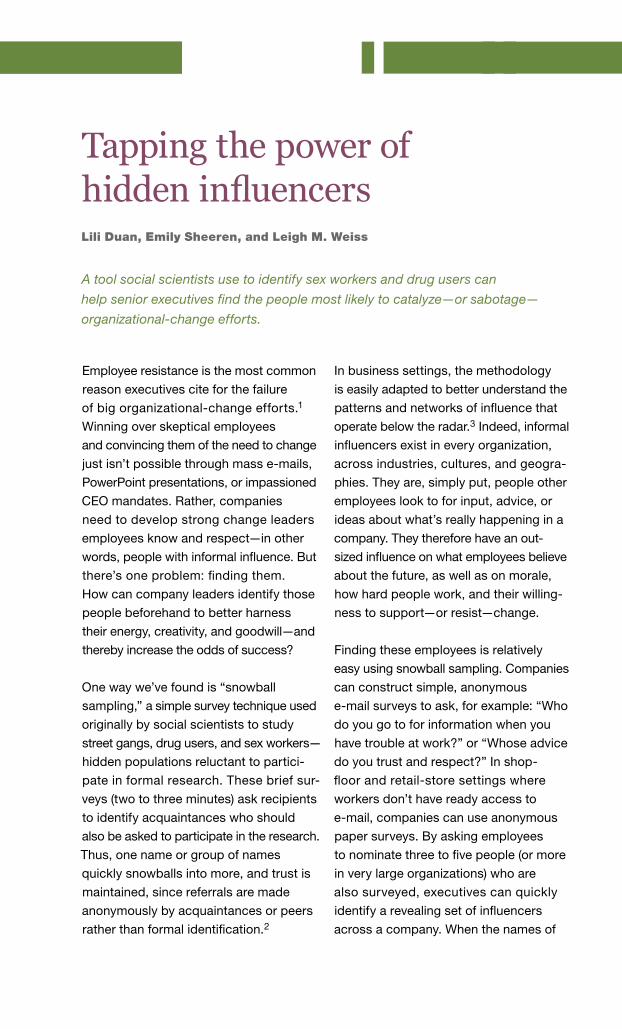
117
A tool social scientists use to identify sex workers and drug users can
help senior executives find the people most likely to catalyze—or sabotage—
organizational-change efforts.
Tapping the power of hidden influencersLili Duan, Emily Sheeren, and Leigh M. Weiss
In business settings, the methodology
is easily adapted to better understand the
patterns and networks of influence that
operate below the radar.3 Indeed, informal
influencers exist in every organization,
across industries, cultures, and geogra-
phies. They are, simply put, people other
employees look to for input, advice, or
ideas about what’s really happening in a
company. They therefore have an out-
sized influence on what employees believe
about the future, as well as on morale,
how hard people work, and their willing-
ness to support—or resist—change.
Finding these employees is relatively
easy using snowball sampling. Companies
can construct simple, anonymous
e-mail surveys to ask, for example: “Who
do you go to for information when you
have trouble at work?” or “Whose advice
do you trust and respect?” In shop-
floor and retail-store settings where
workers don’t have ready access to
e-mail, companies can use anonymous
paper surveys. By asking employees
to nominate three to five people (or more
in very large organizations) who are
also surveyed, executives can quickly
identify a revealing set of influencers
across a company. When the names of
Employee resistance is the most common
reason executives cite for the failure
of big organizational-change efforts.1
Winning over skeptical employees
and convincing them of the need to change
just isn’t possible through mass e-mails,
PowerPoint presentations, or impassioned
CEO mandates. Rather, companies
need to develop strong change leaders
employees know and respect—in other
words, people with informal influence. But
there’s one problem: finding them.
How can company leaders identify those
people beforehand to better harness
their energy, creativity, and goodwill—and
thereby increase the odds of success?
One way we’ve found is “snowball
sampling,” a simple survey technique used
originally by social scientists to study
street gangs, drug users, and sex workers—
hidden populations reluctant to partici-
pate in formal research. These brief sur-
veys (two to three minutes) ask recipients
to identify acquaintances who should
also be asked to participate in the research.
Thus, one name or group of names
quickly snowballs into more, and trust is
maintained, since referrals are made
anonymously by acquaintances or peers
rather than formal identification.2
2014 Number 1118
nominees start to be repeated—
often, after only three to four rounds—
the survey can end.
The results are often surprising. For
example, in our work using the method-
ology in the aerospace, financial-
services, health-care, manufacturing,
retailing, and trucking industries
(as well as in public-sector settings), we’ve
found that influencer patterns almost
never follow the organizational chart.
Informal influencers exist at all levels of a
company and aren’t easily identified
or predicted by role or tenure (although
relatively few are senior company
leaders, as might be expected given their
formal influence).
Moreover, we find that even when com-
pany leaders believe they know who
the influencers will be, they are almost
always wrong. At one large North
American retailer, for instance, we com-
pared a list of influencers that two
store managers created before the survey
with its actual results. Between them,
the managers overlooked almost two-
thirds of the influential employees
their colleagues named; worse, both man-
agers missed three of the top five
influencers in their own stores. The
retailer’s inability to recognize its influ-
encers is no anomaly; we’ve observed
a similar pattern in every other industry
and geography we’ve studied.
Armed with a better sense of how
influence operates, senior executives
can begin applying that knowledge
in useful ways. For example, they can
encourage influencers to help com-
municate necessary changes, convince
skeptical employees of the need for
change, or, best of all, do these things as
active architects of the program. Indeed,
the most powerful way to use hidden influ-
encers is to bring them into such efforts
in the earliest stages and to get their
input and guidance on planning and
direction—as well as help with execution.
Changes made with the support of
these influential employees are vastly more
likely to succeed in the long run than
changes delivered from on high.
Consider the experiences of an aerospace
company that used snowball sampling
to jump-start an operational-change pro-
gram across its factory network and
of a large manufacturer that used this
approach to support a major cultural-
change initiative. A close look at their
experiences suggests four principles
useful for other organizations looking to
tap into the power of hidden influencers.
1. Think broad, not deep. The manu-
facturer started with a pilot effort to
identify about two dozen influencers and
later expanded it to include an additional
75 or so. The company sought
influencers in a swath of regions, functions,
and roles (including frontline ones). The
diversity of opinion and experience not
only helped provide energy and good
ideas but also later proved important in
communicating the changes, in role-
modeling them across the company, and
in combating skepticism.
While there is no formula to determine
how many influencers a company should
include, the sample must be wide
enough to pull in a diversity of roles and
perspectives. For the aerospace
119Applied Insight
company, this meant identifying 60 or
so influencers working on different product
lines and in different roles (including
middle managers) on the shop floor. The
goal is finding enough people with
influence in enough roles to get a high
degree of connectivity across the
company through a relatively small number
of connections (out of the total number
possible). Some roles may prove to
be particularly important: a retailer we
studied, for example, found that its
cashiers were generally well connected—
most likely because they regularly
interacted with colleagues in many depart-
ments. Cashiers who were influencers
had considerable sway in the organization.
2. Trust, but verify. To build trust,
participants at the manufacturer received
letters of invitation explaining the
program’s goals, why these employees
had been nominated, and how the
company wanted them to help. It took
pains to make the initiative voluntary—an
approach the aerospace company
also used. Having influencers opt into
change efforts builds trust and encourages
high-quality results. Indeed, many
influencers will be eager to help and view
the experience as an honor worthy
of their best efforts.
But goodwill dissipates quickly if
employees feel coerced. Before extending
any invitations, the manufacturing
company discreetly vetted all participants
with Human Resources and local
managers. Vetting the participants helps
“screen in” influencers who are well
regarded by both peers and superiors,4
while acknowledging the reality that
not all influence is positive and not all
influencers want change. Although “bad
eggs” should be screened out of
important program roles, they still merit
attention—as valuable sources of
insight about how to convert skeptics.
3. Don’t dictate—cocreate. Both the
aerospace company and the manufacturer
engaged their influencers as thought
partners in the change effort, not just as
mouthpieces for change. That’s an
important point because the influencers’
informal authority dwindles if they seem
to be doing the bidding of management.
The manufacturer, for example, flew
the participants out to a central location,
where they contributed to a multiday
series of workshops. The aerospace com-
pany invited influencers from different
product lines to meet regularly for a
working lunch on the shop floor. In both
cases, the participants were organized in
teams addressing themes they helped
identify (for example, shop-floor safety,
incentives for employees to think more
innovatively, and actions to make the com-
pany more customer focused). Because
both efforts required sustained input from
the participants, the meetings inspired
and motivated them. As the programs
gathered steam, many of these employees
helped to spread feelings of empower-
ment in their usual roles as well.
4. Connect the dots. To boost the
odds of lasting change, the manufacturer
created an online forum, supported by
videoconferences, aimed at encouraging
the influencers to meet and support
one another periodically. In an effort to
make these interactions as meaningful
as possible, the company divided the
influencers into smaller, volunteer-led
2014 Number 1120
groups focused on common themes.
This approach not only helps to produce
more tangible actions and outcomes
but also makes it easier for the groups to
connect with colleagues working on
similar projects in other regions or busi-
ness units. The participants’ sense of
community, and of themselves as change
leaders, grows as they share best
practices, discuss new ideas, and address
the inevitable challenges. The com-
pany’s early commitment to in-person
gatherings has made subsequent
interactions by e-mail, telephone, or
videoconference far more meaningful. In
general, creating opportunities for
influencers to meet in person usually
pays big dividends.
Building on the themes identified by
the manufacturer’s pilot group, the
company’s full body of influencers is now
implementing more than 50 culture-
based initiatives. Some improvements
are cross-cutting: for example, a new
process to put employees’ creative ideas
in front of managers for rapid review
and, if warranted, deployment. Others
are targeted at business-level
improvements: for instance, a customer
dashboard that’s meant to increase
collaboration and has already dramatically
improved sales. Thus far, several of
the initiatives have led to promising
increases in orders, market share, and
margins. The aerospace company
has implemented initiatives that helped
to improve shop-floor safety, increase
the number of on-time customer deliveries,
and reduce plant inventory costs.
While the programs at both companies
are works in progress, these early
success stories have highlighted specific
activities and behavior that drive
performance. They are thus helping the
companies to further articulate
and accelerate the expected changes.
Employee-satisfaction scores have
also improved sharply at both companies,
in large part thanks to increased
levels of collaboration and empowerment.
1 See Scott Keller and Colin Price, Beyond Performance: How Great Organizations Build Ultimate Competitive Advantage, first edition, Hoboken, NJ: John Wiley & Sons, 2011.
2 For more about snowball sampling, see Rowland Atkinson and John Flint, “Accessing hidden and hard-to-reach populations: Snowball research strategies,” University of Surrey Department of Sociology, Social Research Update, 2001, Number 33, sru.soc.surrey.ac.uk.
3 See Lowell L. Bryan, Eric Matson, and Leigh M. Weiss, “Harnessing the power of informal employee networks,” McKinsey Quarterly, November 2007, mckinsey.com.
4 These influencers could well be future leaders of the company and are therefore particularly valuable.
The authors wish to thank Aaron
De Smet for his contribution to this article. Lili Duan is a specialist in McKinsey’s
Washington, DC, office; Emily Sheeren
is a consultant in the Houston office;
and Leigh Weiss is a senior expert in
the Boston office.
Copyright © 2014 McKinsey & Company. All rights reserved.
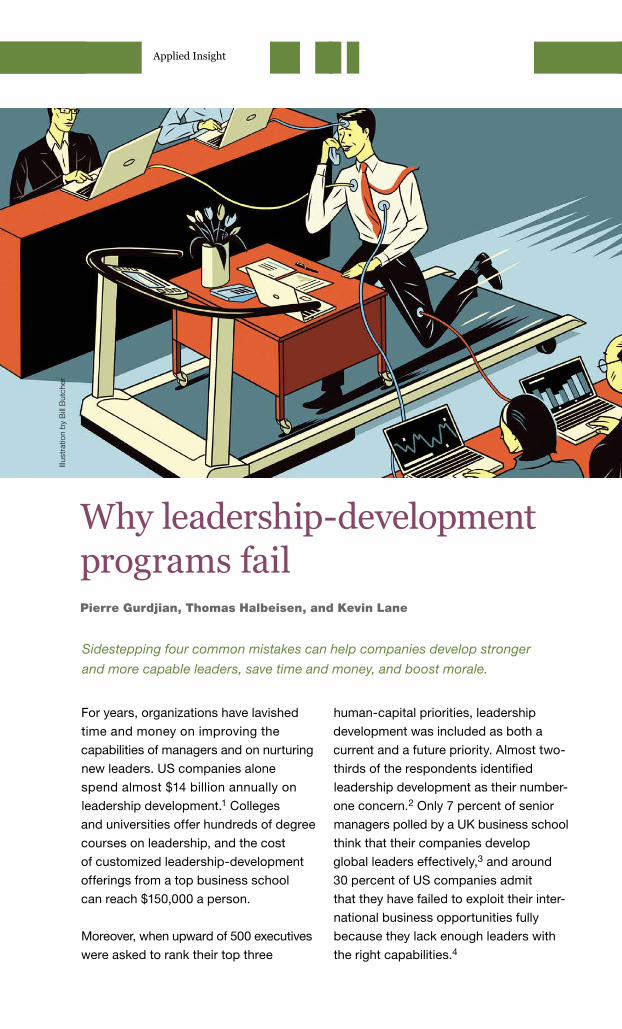
121Applied Insight
human-capital priorities, leadership
development was included as both a
current and a future priority. Almost two-
thirds of the respondents identified
leadership development as their number-
one concern.2 Only 7 percent of senior
managers polled by a UK business school
think that their companies develop
global leaders effectively,3 and around
30 percent of US companies admit
that they have failed to exploit their inter-
national business opportunities fully
because they lack enough leaders with
the right capabilities.4
Sidestepping four common mistakes can help companies develop stronger
and more capable leaders, save time and money, and boost morale.
For years, organizations have lavished
time and money on improving the
capabilities of managers and on nurturing
new leaders. US companies alone
spend almost $14 billion annually on
leadership development.1 Colleges
and universities offer hundreds of degree
courses on leadership, and the cost
of customized leadership-development
offerings from a top business school
can reach $150,000 a person.
Moreover, when upward of 500 executives
were asked to rank their top three
Why leadership-development programs failPierre Gurdjian, Thomas Halbeisen, and Kevin Lane
Illus
trat
ion
by B
ill B
utch
er
2014 Number 1122
We’ve talked with hundreds of chief
executives about the struggle, observing
both successful initiatives and ones
that run into the sand. In the process,
we’ve identified four of the most
common mistakes. Here we explain some
tips to overcome them. Together, they
suggest ways for companies to get more
from their leadership-development
efforts—and ultimately their leaders—as
these organizations face challenges
ranging from the next demanding phase
of globalization to disruptive tech-
nological change and continued macro-
economic uncertainty.
1. Overlooking context
Context is a critical component of
successful leadership. A brilliant leader
in one situation does not necessarily
perform well in another. Academic studies
have shown this, and our experience
bears it out. The CEO of a large European
services business we know had an
outstanding record when markets were
growing quickly, but he failed to pro-
vide clear direction or to impose financial
discipline on the group’s business
units during the most recent economic
downturn. Instead, he continued to
encourage innovation and new thinking—
hallmarks of the culture that had
previously brought success—until he
was finally replaced for underperformance.
Too many training initiatives we come
across rest on the assumption that one
size fits all and that the same group
of skills or style of leadership is appro-
priate regardless of strategy, organi-
zational culture, or CEO mandate.
In the earliest stages of planning a
leadership initiative, companies should
ask themselves a simple question:
what, precisely, is this program for? If the
answer is to support an acquisition-
led growth strategy, for example, the com-
pany will probably need leaders brim-
ming with ideas and capable of devising
winning strategies for new or newly
expanded business units. If the answer is
to grow by capturing organic oppor-
tunities, the company will probably want
people at the top who are good at
nurturing internal talent.
Focusing on context inevitably means
equipping leaders with a small number of
competencies (two to three) that will
make a significant difference to perform-
ance. Instead, what we often find is a
long list of leadership standards, a com-
plex web of dozens of competencies,
and corporate values statements. Each
is usually summarized in a seemingly
easy-to-remember way (such as the three
Rs), and each on its own terms makes
sense. In practice, however, what man-
agers and employees often see is an
“alphabet soup” of recommendations. We
have found that when a company
cuts through the noise to identify a small
number of leadership capabilities
essential for success in its business—
such as high-quality decision making
or stronger coaching skills—it achieves
far better outcomes.
In the case of a European retail bank
that was anxious to improve its sales
performance, the skill that mattered
most (but was in shortest supply) was
the ability to persuade and motivate
peers without the formal authority of
123Applied Insight
direct line management. This art of
influencing others outside formal reporting
lines runs counter to the rigid structures
of many organizations. In this company, it
was critical for the sales managers to
persuade the IT department to change
systems and working approaches that
were burdening the sales organization’s
managers, whose time was desperately
needed to introduce important sales-
acceleration measures. When managers
were able to focus on changing the
systems and working approaches, the
bank’s productivity rose by 15 percent.
Context is as important for groups and
individuals as it is for organizations
as a whole: the best programs explicitly
tailor a “from–to” path for each parti-
cipant. An Asian engineering and construc-
tion company, for example, was antici-
pating the need for a new cadre of skilled
managers to run complex multiyear
projects of $1 billion or more. To meet this
challenge, it established a leadership
factory to train 1,000 new leaders within
three years.
The company identified three important
leadership transitions. The first took
experts at tendering (then reactive and
focused on meeting budget targets)
and sought to turn them into business
builders who proactively hunted out
customers and thought more strategically
about markets. The second took proj-
ect executors who spent the bulk of their
time on site dealing with day-to-day
problems and turned them into project
directors who could manage relationships
with governments, joint-venture part-
ners, and important customers. The third
targeted support-function managers
who narrowly focused on operational
details and costs, and set out to transform
them into leaders with a broader range
of skills to identify—and deliver—more
significant contributions to the business.
2. Decoupling reflection from real work
When it comes to planning the program’s
curriculum, companies face a delicate
balancing act. On the one hand, there is
value in off-site programs (many in
university-like settings) that offer partici-
pants time to step back and escape
the pressing demands of a day job. On
the other hand, even after very basic
training sessions, adults typically retain
just 10 percent of what they hear in
classroom lectures, versus nearly two-
thirds when they learn by doing. Further-
more, burgeoning leaders, no matter
how talented, often struggle to transfer
even their most powerful off-site
experiences into changed behavior on
the front line.
The answer sounds straightforward: tie
leadership development to real on-
the-job projects that have a business
impact and improve learning. But
it’s not easy to create opportunities that
simultaneously address high-priority
needs—say, accelerating a new-product
launch, turning around a sales region,
negotiating an external partnership,
or developing a new digital-marketing
strategy—and provide personal-
development opportunities for the
participants.
A medical-device company got this bal-
ance badly wrong when one of its
employees, a participant in a leadership-
124 2014 Number 1
development program, devoted long hours
over several months to what he con-
sidered “real” work: creating a device
to assist elderly people during a
medical emergency. When he presented
his assessment to the board, he was
told that a full-time team had been working
on exactly this challenge and that the
directors would never consider a solution
that was a by-product of a leadership-
development program. Given the demoti-
vating effect of this message, the
employee soon left the company.
By contrast, one large international
engineering and construction player built
a multiyear leadership program
that not only accelerated the personal-
development paths of 300 midlevel
leaders but also ensured that projects
were delivered on time and on budget.
Each participant chose a separate
project: one business-unit leader, for
instance, committed his team to
developing new orders with a key client
and to working on a new contract
that would span more than one of the
group’s business lines. These proj-
ects were linked to specified changes in
individual behavior—for instance,
overcoming inhibitions in dealing with
senior clients or providing better
coaching for subordinates. By the end of
the program, the business-unit head
was in advanced negotiations on three
new opportunities involving two of
the group’s business lines. Feedback
demonstrated that he was now behaving
like a group representative rather
than someone defending the narrow
interest of his own business unit.
The ability to push training participants
to reflect, while also giving them
real work experiences to apply new
approaches and hone their skills, is a
valuable combination in emerging
markets. There, the gap between urgent
“must do” projects and the availability
of capable leaders presents an enormous
challenge. In such environments,
companies should strive to make every
major business project a leadership-
development opportunity as well, and to
integrate leadership-development
components into the projects themselves.
3. Underestimating mind-sets
Becoming a more effective leader often
requires changing behavior. But although
most companies recognize that this
also means adjusting underlying mind-
sets, too often these organizations are
reluctant to address the root causes of
why leaders act the way they do. Doing
so can be uncomfortable for participants,
program trainers, mentors, and bosses—
but if there isn’t a significant degree of
discomfort, the chances are that the
behavior won’t change. Just as a coach
would view an athlete’s muscle pain
as a proper response to training, leaders
who are stretching themselves should
also feel some discomfort as they struggle
to reach new levels of leadership
performance.
Identifying some of the deepest, “below
the surface” thoughts, feelings,
assumptions, and beliefs is usually a
precondition of behavioral change—
one too often shirked in development
programs. Promoting the virtues
of delegation and empowerment, for
example, is fine in theory, but success-
ful adoption is unlikely if the program par-
ticipants have a clear “controlling”
mind-set (I can’t lose my grip on the
125Applied Insight
business; I’m personally accountable and
only I should make the decisions). It’s
true that some personality traits (such as
extroversion or introversion) are diffi-
cult to shift, but people can change the
way they see the world and their values.
Take the professional-services business
that wanted senior leaders to initiate
more provocative and meaningful discus-
sions with the firm’s senior clients.
Once the trainers looked below the surface,
they discovered that these leaders,
though highly successful in their fields,
were instinctively uncomfortable and
lacking in confidence when conversations
moved beyond their narrow functional
expertise. As soon as the leaders realized
this, and went deeper to understand
why, they were able to commit themselves
to concrete steps that helped push
them to change.
A major European industrial company,
meanwhile, initially met strong resistance
after launching an initiative to delegate
and decentralize responsibility for capital
expenditures and resource allocation
to the plant level. Once the issues were
put on the table, it became clear that
the business-unit leaders were genuinely
concerned that the new policy would
add to the already severe pressures they
faced, that they did not trust their
subordinates, and that they resented the
idea of relinquishing control. Only
when they were convinced that the new
approach would actually save time
and serve as a great learning opportunity
for more junior managers—and when
more open-minded colleagues and men-
tors helped challenge the “heroic”
leadership model—did the original barriers
start to come down and decentrali-
zation start to be implemented.
Another company decided that difficult
market conditions required its senior
sales managers to get smarter about how
they identified, valued, and negotiated
potential deals. However, sending them
on a routine finance course failed to
prompt the necessary changes. The sales
managers continued to enter into
suboptimal and even uneconomic trans-
actions because they had a deeply
held mind-set that the only thing that
mattered in their industry was market
share, that revenue targets had to be
met, and that failing to meet those
targets would result in their losing face.
This mind-set shifted only when the
company set up a “control tower” for
reflecting on the most critical deals,
when peers who got the new message
became involved in the coaching,
and when the CEO offered direct feedback
to participants (including personal
calls to sales managers) applauding the
new behavior.
4. Failing to measure results
We frequently find that companies pay
lip service to the importance of developing
leadership skills but have no evidence
to quantify the value of their investment.
When businesses fail to track and
measure changes in leadership perfor-
mance over time, they increase the
odds that improvement initiatives won’t
be taken seriously.
Too often, any evaluation of leadership
development begins and ends with
participant feedback; the danger here is
that trainers learn to game the system
and deliver a syllabus that is more pleasing
than challenging to participants. Yet
targets can be set and their achievement
2014 Number 1126
monitored. Just as in any business-
performance program, once that assess-
ment is complete, leaders can learn
from successes and failures over time
and make the necessary adjustments.
One approach is to assess the extent
of behavioral change, perhaps through
a 360 degree–feedback exercise at
the beginning of a program and followed
by another one after 6 to 12 months.
Leaders can also use such tools to demon-
strate their own commitment to real
change for themselves and the organi-
zation. One CEO we know commissioned
his own 360 degree–feedback exercise
and published the results (good and
bad) for all to see on the company intranet,
along with a personal commitment
to improve.
Another approach is to monitor partici-
pants’ career development after the
training. How many were appointed to
more senior roles one to two years
after the program? How many senior
people in the organization went
through leadership training? How many
left the company? By analyzing
recent promotions at a global bank, for
example, senior managers showed
that candidates who had been through
a leadership-development program
were more successful than those who
had not.
Finally, try to monitor the business impact,
especially when training is tied to
breakthrough projects. Metrics might
include cost savings and the number
of new-store openings for a retail busi-
ness, for example, or sales of new
products if the program focused on the
skills to build a new-product strategy.
American Express quantifies the success
of some of its leadership programs by
comparing the average productivity
of participants’ teams prior to and after
a training program, yielding a simple
measure of increased productivity.
Similarly, a nonprofit we know recently
sought to identify the revenue increase
attributable to its leadership program by
comparing one group that had received
training with another that hadn’t.
Companies can avoid the most common
mistakes in leadership development and
increase the odds of success by matching
specific leadership skills and traits to
the context at hand; embedding leader-
ship development in real work; fearlessly
investigating the mind-sets that under-
pin behavior; and monitoring the impact
so as to make improvements over time.
1 Laci Loew and Karen O’Leonard, Leadership Development Factbook 2012: Benchmarks and Trends in U.S. Leadership Development, Bersin by Deloitte, July 2012, bersin.com.
2 See The State of Human Capital 2012—False Summit: Why the Human Capital Function Still Has Far to Go, a joint report from The Conference Board and McKinsey, October 2012, mckinsey.com.
3 Matthew Gitsham et al., Developing the Global Leader of Tomorrow, Ashridge Business School, July 2009, ashridge.org.uk.
4 Pankaj Ghemawat, “Developing global leaders,” McKinsey Quarterly, June 2012, mckinsey.com.
Copyright © 2014 McKinsey & Company. All rights reserved.
The authors wish to thank Nate Boaz,
Claudio Feser, and Florian Pollner for
their contributions to this article. Pierre Gurdjian is a director in
McKinsey’s Brussels office;
Thomas Halbeisen is an associate
principal in the Zurich office,
where Kevin Lane is a principal.

127Applied Insight
Illus
trat
ion
by G
erar
d D
uboi
s
Executives who rely on high-level metrics to manage will miss potential sources of
value creation. A finer-grained look can help.
The senior leaders of a diversified global
industrial company recently got a
major shock when they took a more fine-
grained look at corporate perfor-
mance. Rather than viewing the company
through the usual lens of the top-line
growth, economic profit, and return on
invested capital (ROIC) of its four
divisions, the members of the top team
broke things down much further—into
150 business segments. Two-thirds of
those segments were falling so short of
their economic-profit targets that they
alone would have made the company over-
all miss its targets by 40 percent. The
rest, however, were outperforming by
enough to skew the averages for the
company and each division, giving the
appearance of only a 7 percent shortfall.
Recognizing the performance disparities
Unearthing the sources of value hiding in your corporate portfolioMarc Goedhart, Sven Smit, and Alexander Veldhuijzen
2014 Number 1128
helped the company identify a more
significant set of opportunities to
reallocate resources and stimulate value
creation than anything that had been
on the table previously.
The problem of averages hiding outliers
is a common one, and it frequently
undermines the corporate center’s ability
to take a strategic look across the
organization and make selective course
corrections or trade-offs between
investments. That companies struggle
with this is clear from the typical
annual budgeting process, when many
routinely allocate their capital, R&D,
and marketing budgets to the same activ-
ities year after year, regardless of their
relative contribution to performance and
growth. The cost is high, since those
that more actively reallocate resources
generate, on average, 30 percent
higher total returns to shareholders.
Companies are unlikely to enjoy these
returns absent finer-grained insight
into pockets of value creation at the level
of individual businesses and market
segments. It’s also crucial to develop a
strong understanding of the reasons
those activities perform as they do and
of the alignment between their poten-
tial for value creation and corporate
investment priorities. Armed with this
information, executives—particularly the
CEO and CFO—become better able to
adapt performance targets, differentiate
where to drive growth or ROIC across
the portfolio, and monitor performance.
They also are better positioned to
overcome resistance from managers, who
may be protective of the people and
activities they manage and resistant to
what they see as micromanagement.
The best antidote, in our experience, is
fostering a shared commitment to
value creation as the decisive metric for
decisions on strategic priorities,
business targets, and budgeting.
The mechanics of identifying opportunities
at this level of detail are not new. Efforts
typically involve a standard discounted-
cash-flow valuation or analysis of
economic profit but for far more business
units than most companies currently
look at—often as many as 50 to 100. Man-
agers who find that their companies
lack the necessary financial data, such
as revenue, operating earnings, and
capital expenditures, will probably also
find that they rely too heavily on
averages when setting strategic priorities,
financial targets, and resource budgets.
Those who have the data will find that a
finer-grained perspective reveals more
opportunity to create value, as it dissects
average performance and growth
across the portfolio.
For example, when we analyzed four
divisions within a corporate group in a
consumer-durable-goods company, we
found that all were generating returns
well above the company’s cost of capital
and at fairly similar levels, between
12 and 18 percent. But at the next level
of business units, returns were much
more widely distributed—and even in the
division with the highest returns, there
was a unit earning less than its cost of
capital. At the level of individual activities
The full version of this article is available on mckinsey.com.
129Applied Insight
within business units, the improvement
potential was much larger than expected,
with weak performers even in the
strongest units.
The aggregate impact can be significant,
and analyses of both potential value
and current value are useful. Analyzing
the potential value projected by the
business plans of around 100 business
segments in another large company’s
profile, we found that more than
60 percent of the value improvement
would be generated by less than a third
of its product or market segments.
This was the case even though they had
contributed less than 40 percent
of the company’s current value. Once
executives identified those segments,
they were able to selectively evaluate the
underlying strategic rationale for each,
determine whether its business plan was
grounded in concrete, viable initiatives,
and assess whether it had sufficient
corporate resources to be successful.
Understanding why an activity creates value
It is important to understand why an
activity creates value when making
decisions on pushing growth or earnings—
or both. Executives at one consumer-
goods company, for example, had long
considered growth to be the key
to value creation and set incentives for
management that rewarded growth.
Yet a detailed analysis of the business
plans of over 150 segments in the
company’s corporate portfolio found that
more than 60 percent of expected
value creation would come from increases
in earnings margin. The plans did
foresee acceleration in growth for most
of the portfolio’s segments, but
it ultimately had far less impact on value,
and the company’s incentives
were misaligned.
The most useful insights won’t come
from the kinds of high-level metrics exec-
utives usually use to assess a business’s
value-creation potential, such as ROIC,
economic profit, and top-line growth.
Such metrics don’t reflect the underlying
causes of value creation and can be
unreliable indicators of value in the long
term. For example, a business might see
a near-term increase in ROIC or earnings
margin by lowering its advertising
budget. But it will also likely destroy value
in the long term by weakening its market
position. Top-line growth, too, can
be misleading. Executives at one global
company, for example, considered a
consumer-goods business in Asia to be
the most successful in the company’s
portfolio because it consistently delivered
double-digit growth. However, a more
detailed analysis revealed that this busi-
ness was losing market share because
the relevant local markets were growing
even faster—which would almost
inevitably lead to lower value creation in
the long term.
Instead, successful intervention requires
executives to understand the more
important leading indicators of growth
and returns that are often overlooked.
These include the growth of the relevant
market, in size as well as in market
share; changes in pricing and gross
margin; and R&D and sales, general, and
administrative expenses. For the
large company with around 100 business
segments, described earlier, this would
2014 Number 1130
in decisions on specific launches of
new products or entries into individual
markets, or even in individual R&D
projects, if the value at stake for the com-
pany is significant. And all strategic
resources should be considered, not just
investments in physical capital—
especially in companies where invest-
ments in R&D and brand advertising
exceed capital investments by a wide
margin, for instance, in sectors such
as consumer packaged goods, pharma-
ceuticals, and high tech.
When executives intervene, they should
budget resources in line with expected
value creation at the level of individual busi-
ness segments, since that’s where
the opportunities to create value are. For
example, one consumer-goods com-
pany analyzed the allocation of all its stra-
tegic resources by following the plans
of close to 100 business segments.
Plotting the resource investments
against the expected value of each seg-
ment’s business plan in a resource-
productivity chart, executives found that
some segments with very strong
value potential were allocated very limited
resources, while some of the largest
investments were made in segments that
returned much less value per dollar
of resources spent. How much of their
resources should be reallocated to the
more productive segments depends on
how much those segments can invest
at the same attractive returns—and
whether lower investments in the less
productive segments might lead to
significantly lower or negative returns.
But a company’s executives should
be aware of such large differences in
resource productivity and investigate
show that the most promising segment
offers its strong value improvement off
the tailwind of a doubling of local market
demand. On one hand, this may call for
a confirmation of that aggressive market
outlook, given that this is what mostly
drives the segment’s value improvement.
On the other hand, it may trigger a
question about whether such growth could
offer opportunities for capturing addi-
tional share beyond the three percentage
points projected in the business plan.
Having insights on underlying drivers could
also reveal inconsistencies in the plans.
Consider, for example, the experience of
one high-tech company, where the
executive board found that the business
plans for a segment in a maturing market
implied a value improvement of more
than 40 percent. At first glance, this
might not be an unreasonable target for
a fast-growing company in that sector.
But a closer look revealed an underlying
assumption that the business could
realize 10 percent annual top-line growth
over five years, even as its relevant
markets were shrinking. As this implied
almost a doubling of its market share
at stable prices, the board asked the
business to revise its plans.
Evaluating the allocation of resources
Armed with detailed insights into what
drives value creation in which segments
across the portfolio, executives can more
successfully intervene in the planning
process and budget allocations, chal-
lenging and revising business plans
and resource requirements for key seg-
ments. This could involve interventions
131Applied Insight
whether a reallocation of resources
could lead to higher value creation for
the company as a whole.
Gaining acceptance for intervention
Naturally, executives will need to explain
the benefits of selective intervention to
skeptical line managers—it creates more
value for the company as a whole and
enables a more fact-based and meaningful
dialogue about planning and perfor-
mance. By turning the conversation away
from one largely about changes in
growth and earnings to one that includes
concrete initiatives and their impact on
market share, gross margin, and capital
turnover, managers will have more
opportunities to develop new businesses,
exit less attractive markets, and initiate
promising R&D projects on their true merits.
One of the benefits of doing this well is
that it allows line managers to fully under-
stand where their businesses create
value and how much they create relative
to other businesses and activities in
the company. When managers can see
which trade-offs are being made and
why, it’s easier to get behind allocation
and budgeting decisions—and harder
to be defensive. It’s also easier to see
that this kind of selective intervention
doesn’t mean executives are microman-
aging the company’s businesses;
when confronted with detailed information
from so many business segments,
micromanaging would hardly be feasible
anyway, and it certainly would not
be productive. What counts is that
information is transparent so that
executives can intervene when and
where needed.
A second advantage of managing at this
level of detail is that it allows managers
to tailor a package of incentives and com-
pensation that reflects what each unit
is expected to accomplish. Instead of
rewarding just top-line growth, they
can combine measures of growth with,
for example, increases in market
share. Instead of rewarding just earnings
targets, they might consider earnings
growth combined with targets for specific
components, such as gross margin or
R&D spending.
Executives who manage at the level of
a few divisions are more likely to be
blinded by averages of top-line growth,
economic profit, and ROIC. A more
fine-grained review of what drives per-
formance and growth at the level of
50 or more business segments can help.
Copyright © 2014 McKinsey & Company. All rights reserved.
Marc Goedhart is a senior expert in
McKinsey’s Amsterdam office, where
Sven Smit is a director and Alexander Veldhuijzen is an associate principal.
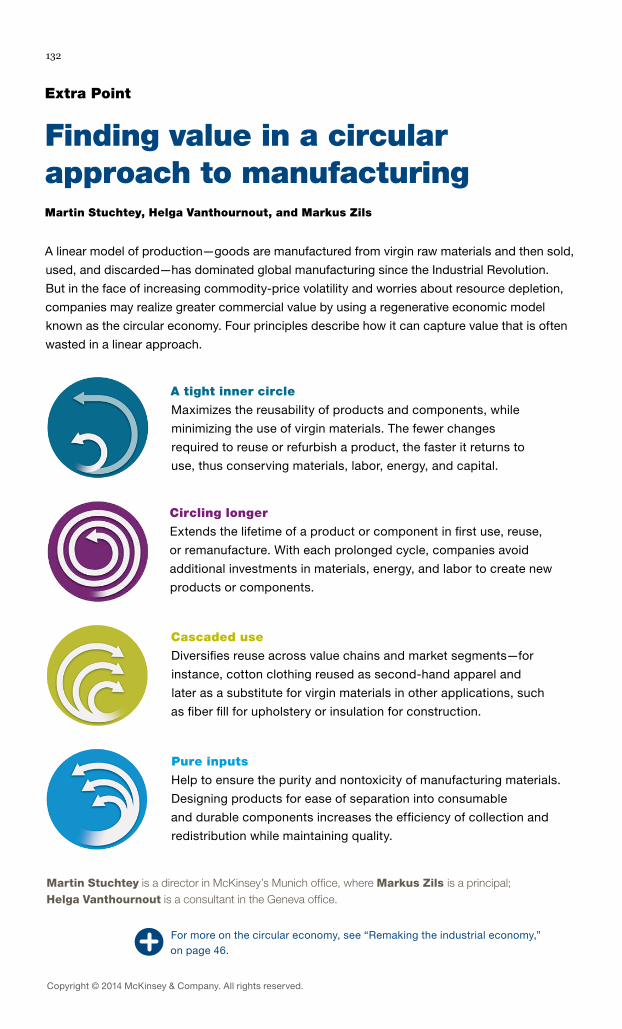
132
Copyright © 2014 McKinsey & Company. All rights reserved.
Finding value in a circular approach to manufacturing
Extra Point
For more on the circular economy, see “Remaking the industrial economy,” on page 46.
A linear model of production—goods are manufactured from virgin raw materials and then sold,
used, and discarded—has dominated global manufacturing since the Industrial Revolution.
But in the face of increasing commodity-price volatility and worries about resource depletion,
companies may realize greater commercial value by using a regenerative economic model
known as the circular economy. Four principles describe how it can capture value that is often
wasted in a linear approach.
Martin Stuchtey is a director in McKinsey’s Munich office, where Markus Zils is a principal; Helga Vanthournout is a consultant in the Geneva office.
Martin Stuchtey, Helga Vanthournout, and Markus Zils
A tight inner circle
Maximizes the reusability of products and components, while
minimizing the use of virgin materials. The fewer changes
required to reuse or refurbish a product, the faster it returns to
use, thus conserving materials, labor, energy, and capital.
Circling longer
Extends the lifetime of a product or component in first use, reuse,
or remanufacture. With each prolonged cycle, companies avoid
additional investments in materials, energy, and labor to create new
products or components.
Cascaded use
Diversifies reuse across value chains and market segments—for
instance, cotton clothing reused as second-hand apparel and
later as a substitute for virgin materials in other applications, such
as fiber fill for upholstery or insulation for construction.
Pure inputs
Help to ensure the purity and nontoxicity of manufacturing materials.
Designing products for ease of separation into consumable
and durable components increases the efficiency of collection and
redistribution while maintaining quality.


mckinsey.com/quarterly
Highlights:
Next-shoring: how proximity
to demand and innovation
will increasingly drive competitive
advantage
The circular economy:
restoring and reusing resources
across the value chain
Taking data analytics to the
next level: views from the
front lines, what you should
know about ‘open data,’
and IMD professor Phil
Rosenzweig on the benefits and
limits of decision models
Stanford’s Bob Sutton and
Huggy Rao on the path to scaling
up excellence
Reimagining India: the road
ahead for global companies
Why leadership-development
programs fail
How social media’s ‘weak
signals’ sometimes generate
surprisingly strong insights
Short takes on industry dynamics:
African private equity and mobile
money, natural gas, and software
start-ups