Embed Size (px)
Citation preview

Demand Spike at Schneider UNF
N I K H I L K E J R I WA L – N I K H I L K E J R I WA L . P G P 2 0 1 3 @ I I M K A S H I P U R . A C . I N - 8 1 9 1 8 9 8 0 9 9
P R A S H A N T G A U R - P R A S H A N T. P G P 2 0 1 3 @ I I M K A S H I P U R . A C . I N – 8 1 9 1 8 9 8 0 4 0
Team - LeanMeanMen
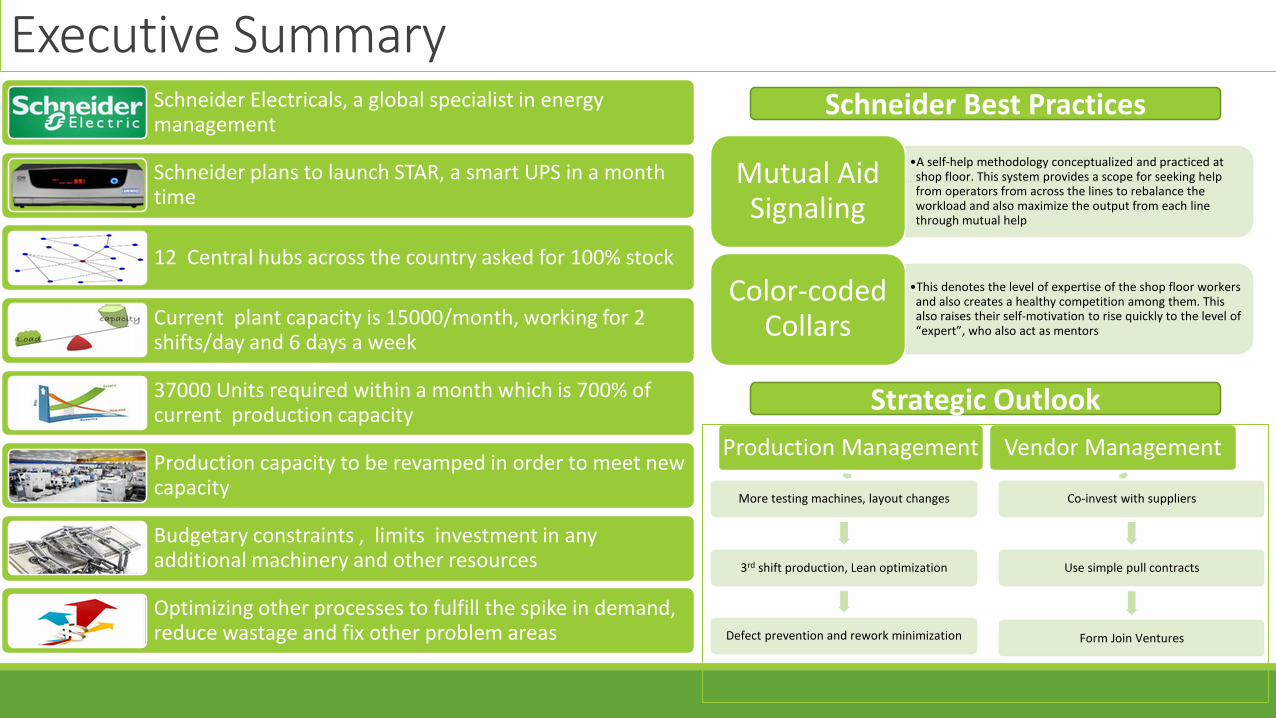
Schneider Electricals, a global specialist in energy management
Schneider plans to launch STAR, a smart UPS in a month time
12 Central hubs across the country asked for 100% stock
Current plant capacity is 15000/month, working for 2 shifts/day and 6 days a week
37000 Units required within a month which is 700% of current production capacity
Production capacity to be revamped in order to meet new capacity
Budgetary constraints , limits investment in any additional machinery and other resources
Optimizing other processes to fulfill the spike in demand, reduce wastage and fix other problem areas
Executive Summary
Production Management
More testing machines, layout changes
3rd shift production, Lean optimization
Defect prevention and rework minimization
Vendor Management
Co-invest with suppliers
Use simple pull contracts
Form Join Ventures
Strategic Outlook
Schneider Best Practices
•A self-help methodology conceptualized and practiced at shop floor. This system provides a scope for seeking help from operators from across the lines to rebalance the workload and also maximize the output from each line through mutual help
Mutual Aid Signaling
•This denotes the level of expertise of the shop floor workers and also creates a healthy competition among them. This also raises their self-motivation to rise quickly to the level of “expert”, who also act as mentors
Color-coded Collars
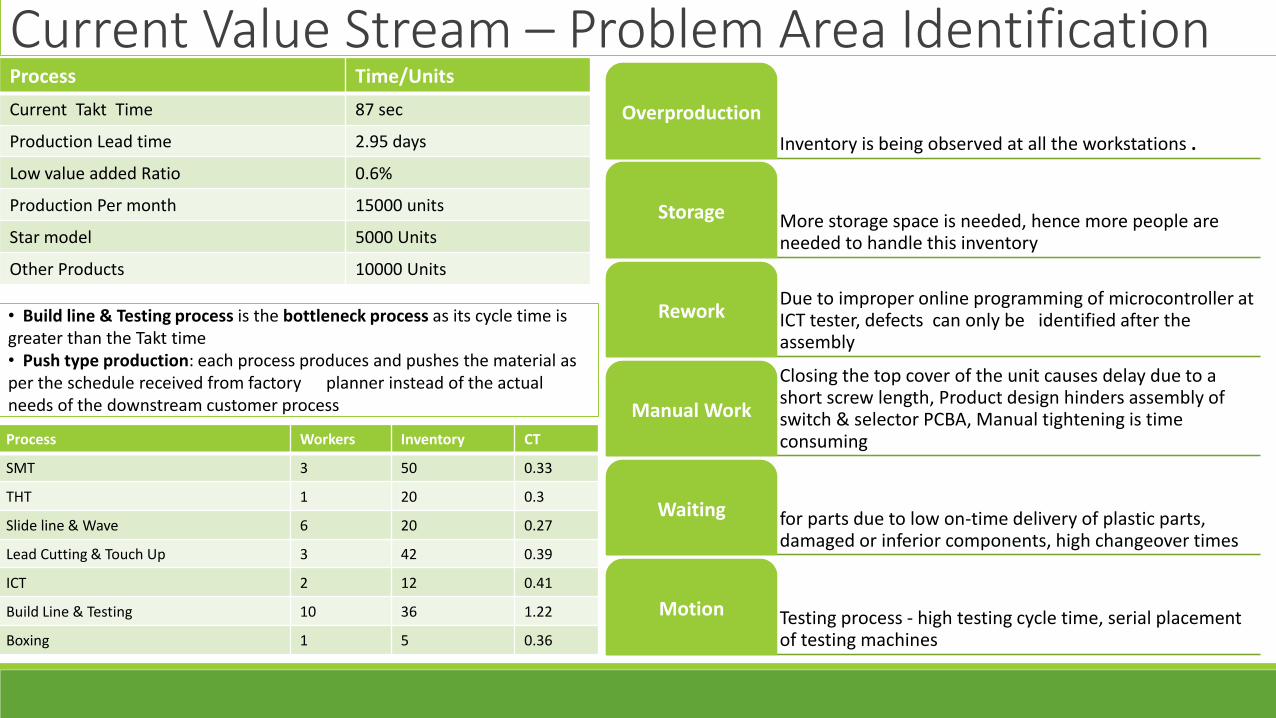
Current Value Stream – Problem Area Identification
• Build line & Testing process is the bottleneck process as its cycle time is greater than the Takt time • Push type production: each process produces and pushes the material as per the schedule received from factory planner instead of the actual needs of the downstream customer process
Inventory is being observed at all the workstations .
Overproduction
More storage space is needed, hence more people are needed to handle this inventory
Storage
Due to improper online programming of microcontroller at ICT tester, defects can only be identified after the assembly
Rework
Closing the top cover of the unit causes delay due to a short screw length, Product design hinders assembly of switch & selector PCBA, Manual tightening is time consuming
Manual Work
for parts due to low on-time delivery of plastic parts, damaged or inferior components, high changeover times
Waiting
Testing process - high testing cycle time, serial placement of testing machines
Motion
Process Time/Units
Current Takt Time 87 sec
Production Lead time 2.95 days
Low value added Ratio 0.6%
Production Per month 15000 units
Star model 5000 Units
Other Products 10000 Units
Process Workers Inventory CT
SMT 3 50 0.33
THT 1 20 0.3
Slide line & Wave 6 20 0.27
Lead Cutting & Touch Up 3 42 0.39
ICT 2 12 0.41
Build Line & Testing 10 36 1.22
Boxing 1 5 0.36
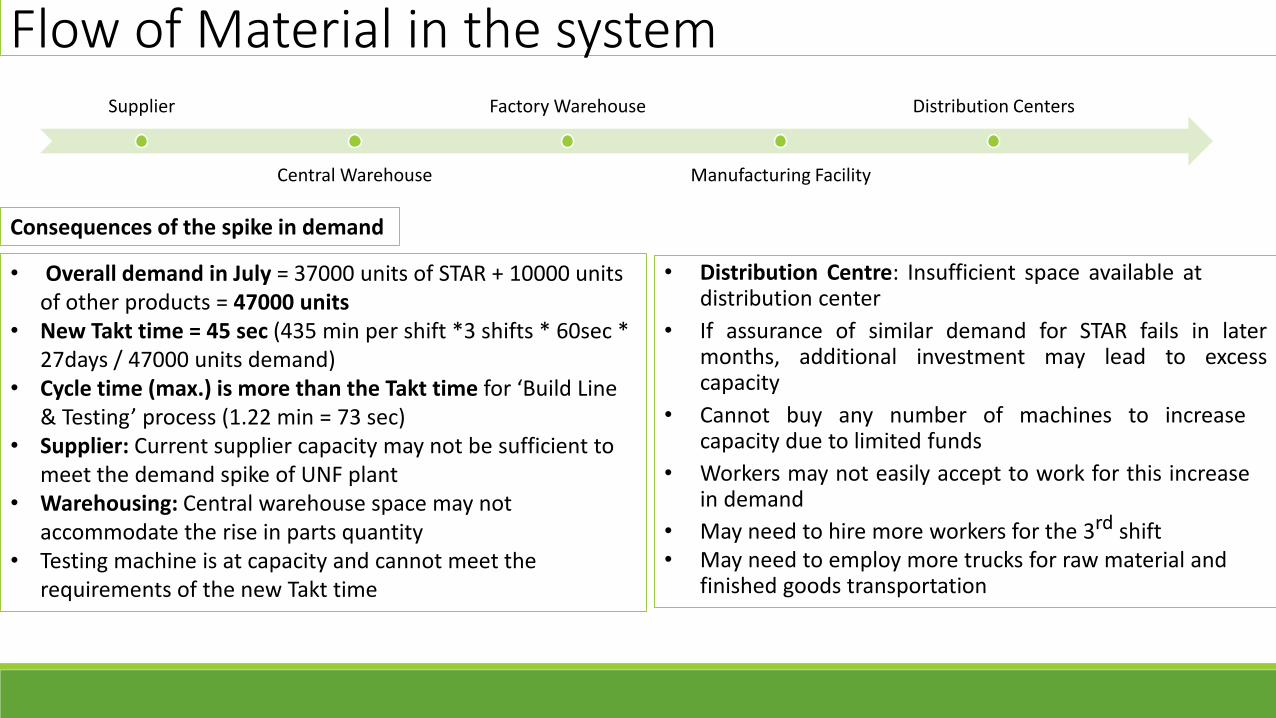
Supplier
Central Warehouse
Factory Warehouse
Manufacturing Facility
Distribution Centers
Consequences of the spike in demand
• Overall demand in July = 37000 units of STAR + 10000 units of other products = 47000 units
• New Takt time = 45 sec (435 min per shift *3 shifts * 60sec * 27days / 47000 units demand)
• Cycle time (max.) is more than the Takt time for ‘Build Line & Testing’ process (1.22 min = 73 sec)
• Supplier: Current supplier capacity may not be sufficient to meet the demand spike of UNF plant
• Warehousing: Central warehouse space may not accommodate the rise in parts quantity
• Testing machine is at capacity and cannot meet the requirements of the new Takt time
Flow of Material in the system
• Distribution Centre: Insufficient space available atdistribution center
• If assurance of similar demand for STAR fails in latermonths, additional investment may lead to excesscapacity
• Cannot buy any number of machines to increasecapacity due to limited funds
• Workers may not easily accept to work for this increasein demand
• May need to hire more workers for the 3rd shift• May need to employ more trucks for raw material and
finished goods transportation
Value Stream Mapping
0.018 days
2.87 days
2.89 days
0.62%
26*3 = 78
Value Added Time
Non-Value Added Time
Production Lead Time
Value Added Ratio
Manpower
Future State - 3 Shifts
LT : 3.4
PT : 1.3
CTMAX : 0.33
CO : 5
#Persons : 3
Supplier : A1 ChinaCapacity : 5000 units
Distribution Centre-Req/Month = 47000 units-Req/Shift = 581 units (27 working days, 3 shift) out of which 460 are of STAR-Task Time = 45 sec
50
ERP
Factory Warehouse
SMT THT
Daily
Weekly/Monthly
PO Weekly
Central Warehouse
Monthly
Daily
Size = 1400 units/day
600
20
LT : 0.9
PT : 0.4
CTMAX : 0.3
CO : 5
#Persons : 1
Slide Lineand Wave
20
LT : 2.1
PT : 1.6
CTMAX : 0.3
CO : 5
#Persons : 6
42
LT : 3.2
PT : 1.8
CTMAX : 0.39
CO : 0
#Persons : 3
ICT
12
LT : 2.5
PT : 0.8
CTMAX : 0.41
FPY : 94.2%
#Persons : 2
Lead Cutting, Touch-Up
36
LT : 9.3
PT : 6.3
CTMAX : 0.73
MDR : 12000
#Persons : 10
Building & Testing
5
LT : 2.6
PT : 1.8
CTMAX : 0.36
CO : 0
#Persons : 1
Boxing
150
Reduce changeover time to 5 min using SMED
Reduce defect rate using root cause analysis
Reduce CT to 44 sec (0.73 min) by procuring 2 more testing machines
MaterialTransfer = 460 units/shift
Once/Twice per shift
Order Management
Factory Planner
Weekly/MonthlyCall off Daily/ Weekly/ Bi-Weekly
Daily
Timeline 1.3 + 0.1 days3.4 min
0.04 days
0.9 min0.04 days
2.1 min 3.2 min 2.5 min 9.3 min 2.6 min0.09 days 0.02 days 0.06 days 0 0.32 days
Proposed VSM – Future State with 3 shifts
Old Bottleneck
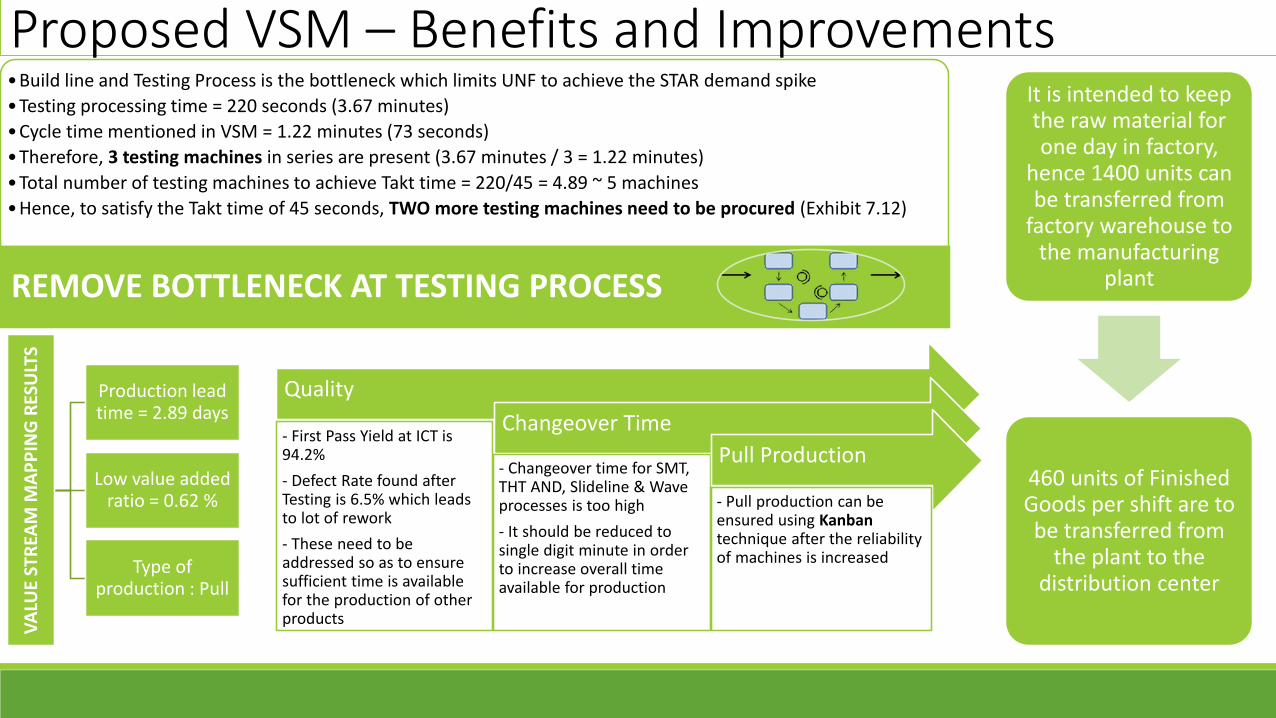
•Build line and Testing Process is the bottleneck which limits UNF to achieve the STAR demand spike
•Testing processing time = 220 seconds (3.67 minutes)
•Cycle time mentioned in VSM = 1.22 minutes (73 seconds)
•Therefore, 3 testing machines in series are present (3.67 minutes / 3 = 1.22 minutes)
•Total number of testing machines to achieve Takt time = 220/45 = 4.89 ~ 5 machines
•Hence, to satisfy the Takt time of 45 seconds, TWO more testing machines need to be procured (Exhibit 7.12)
REMOVE BOTTLENECK AT TESTING PROCESS
Quality
- First Pass Yield at ICT is 94.2%
- Defect Rate found after Testing is 6.5% which leads to lot of rework
- These need to be addressed so as to ensure sufficient time is available for the production of other products
Changeover Time
- Changeover time for SMT, THT AND, Slideline & Wave processes is too high
- It should be reduced to single digit minute in order to increase overall time available for production
Pull Production
- Pull production can be ensured using Kanban technique after the reliability of machines is increased
It is intended to keep the raw material for one day in factory,
hence 1400 units can be transferred from
factory warehouse to the manufacturing
plant
460 units of Finished Goods per shift are to be transferred from
the plant to the distribution center
VA
LUE
STR
EAM
MA
PP
ING
RES
ULT
S
Production lead time = 2.89 days
Low value added ratio = 0.62 %
Type of production : Pull
Proposed VSM – Benefits and Improvements
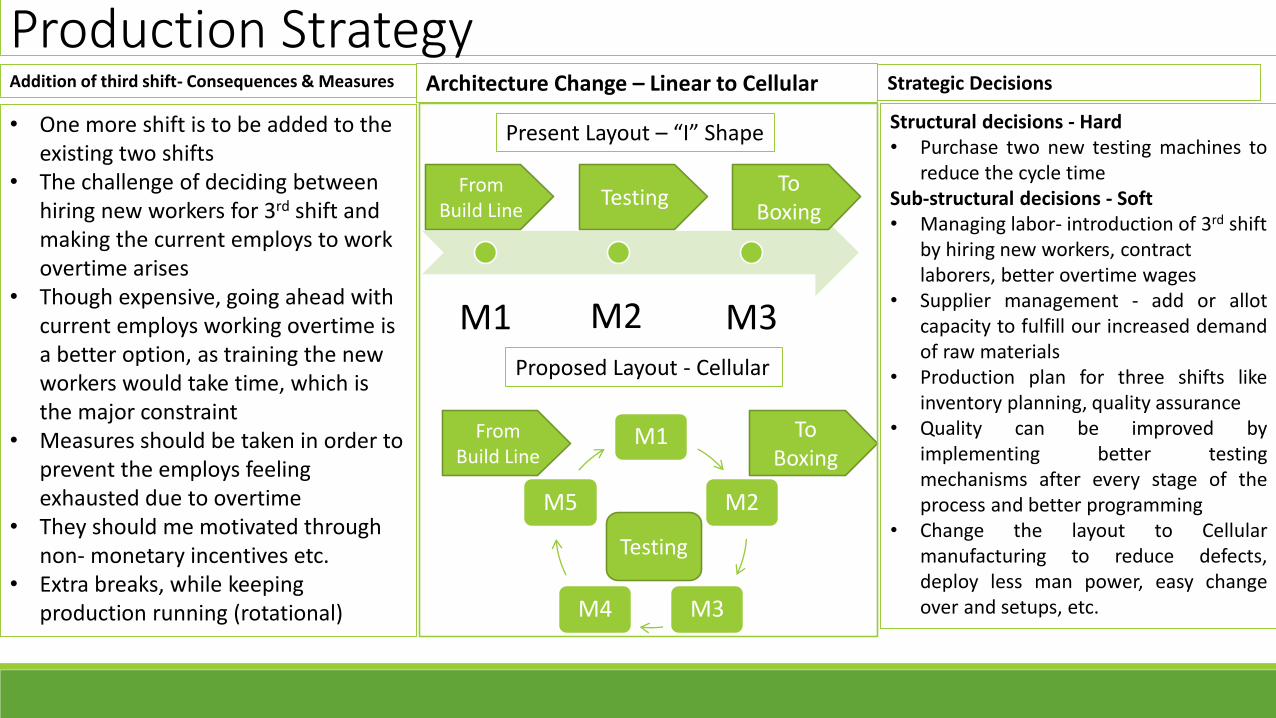
Addition of third shift- Consequences & Measures
• One more shift is to be added to the existing two shifts
• The challenge of deciding between hiring new workers for 3rd shift and making the current employs to work overtime arises
• Though expensive, going ahead with current employs working overtime is a better option, as training the new workers would take time, which is the major constraint
• Measures should be taken in order to prevent the employs feeling exhausted due to overtime
• They should me motivated through non- monetary incentives etc.
• Extra breaks, while keeping production running (rotational)
Production StrategyArchitecture Change – Linear to Cellular
M1 M2 M3
Present Layout – “I” Shape
From Build Line
To Boxing
M1
M2
M3M4
M5
Testing
Proposed Layout - Cellular
From Build Line
To Boxing
Testing
Structural decisions - Hard• Purchase two new testing machines to
reduce the cycle timeSub-structural decisions - Soft• Managing labor- introduction of 3rd shift
by hiring new workers, contract laborers, better overtime wages
• Supplier management - add or allotcapacity to fulfill our increased demandof raw materials
• Production plan for three shifts likeinventory planning, quality assurance
• Quality can be improved byimplementing better testingmechanisms after every stage of theprocess and better programming
• Change the layout to Cellularmanufacturing to reduce defects,deploy less man power, easy changeover and setups, etc.
Strategic Decisions
Vendor Management + Waste Management
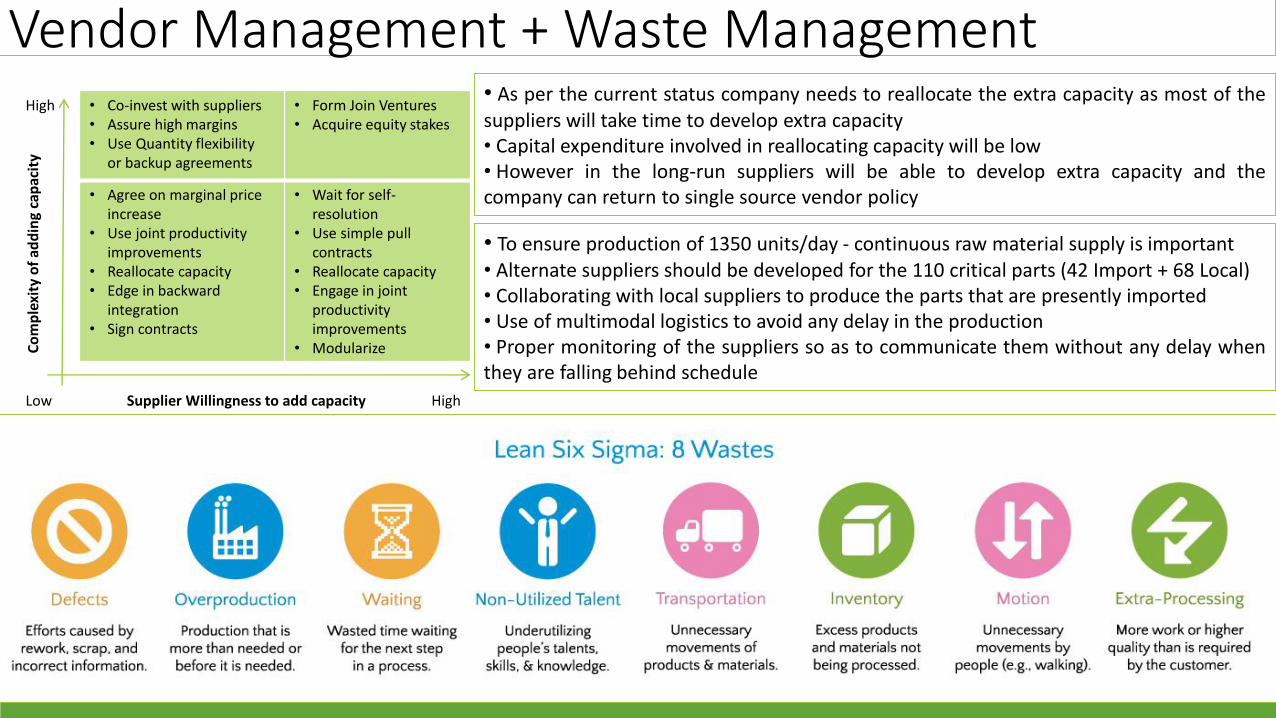
Supplier Willingness to add capacity High
Co
mp
lexi
ty o
f ad
din
g ca
pac
ity
High
Low
• Co-invest with suppliers• Assure high margins• Use Quantity flexibility
or backup agreements
• Form Join Ventures• Acquire equity stakes
• Agree on marginal price increase
• Use joint productivity improvements
• Reallocate capacity• Edge in backward
integration• Sign contracts
• Wait for self-resolution
• Use simple pull contracts
• Reallocate capacity • Engage in joint
productivity improvements
• Modularize
• To ensure production of 1350 units/day - continuous raw material supply is important• Alternate suppliers should be developed for the 110 critical parts (42 Import + 68 Local)• Collaborating with local suppliers to produce the parts that are presently imported• Use of multimodal logistics to avoid any delay in the production• Proper monitoring of the suppliers so as to communicate them without any delay whenthey are falling behind schedule
• As per the current status company needs to reallocate the extra capacity as most of thesuppliers will take time to develop extra capacity• Capital expenditure involved in reallocating capacity will be low• However in the long-run suppliers will be able to develop extra capacity and thecompany can return to single source vendor policy
Recommendations
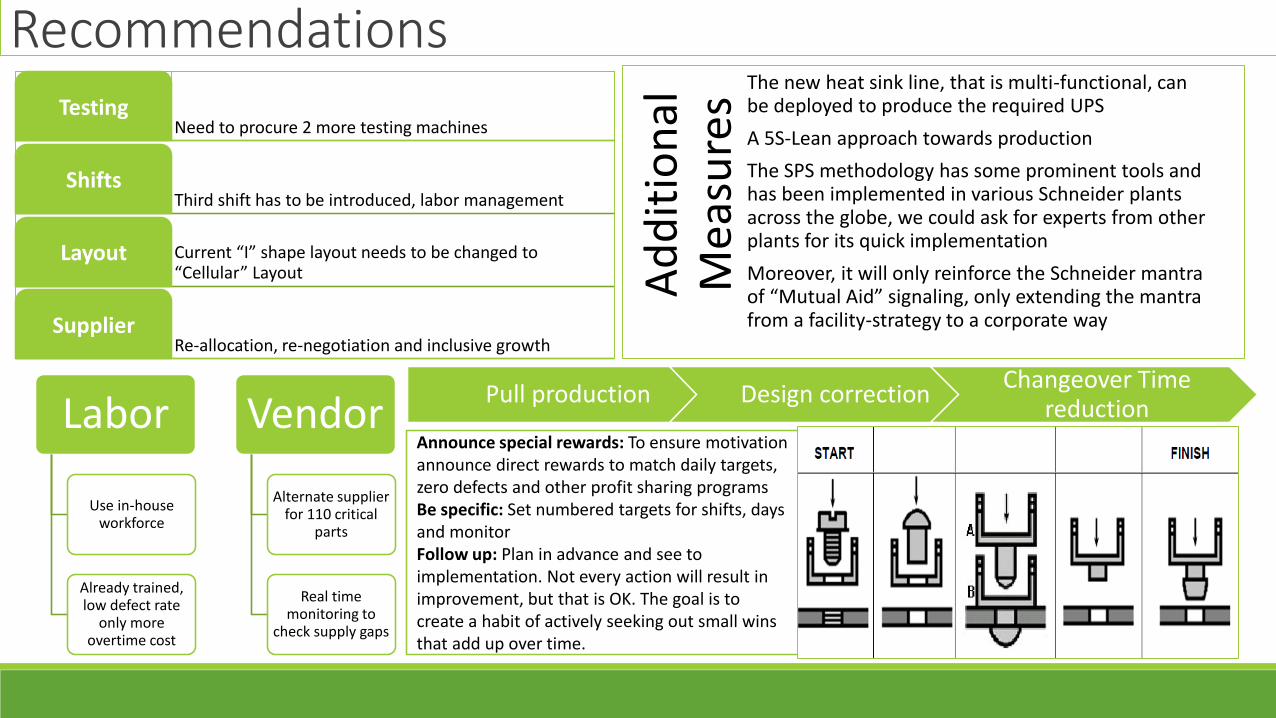
Need to procure 2 more testing machinesTesting
Third shift has to be introduced, labor managementShifts
Current “I” shape layout needs to be changed to “Cellular” Layout
Layout
Re-allocation, re-negotiation and inclusive growthSupplier
Ad
dit
ion
al
Mea
sure
s
The new heat sink line, that is multi-functional, can be deployed to produce the required UPS
A 5S-Lean approach towards production
The SPS methodology has some prominent tools and has been implemented in various Schneider plants across the globe, we could ask for experts from other plants for its quick implementation
Moreover, it will only reinforce the Schneider mantra of “Mutual Aid” signaling, only extending the mantra from a facility-strategy to a corporate way
Pull production Design correctionChangeover Time
reductionLabor
Use in-house workforce
Already trained, low defect rate
only more overtime cost
Vendor
Alternate supplier for 110 critical
parts
Real time monitoring to
check supply gaps
Announce special rewards: To ensure motivation announce direct rewards to match daily targets, zero defects and other profit sharing programsBe specific: Set numbered targets for shifts, days and monitorFollow up: Plan in advance and see to implementation. Not every action will result in improvement, but that is OK. The goal is to create a habit of actively seeking out small wins that add up over time.

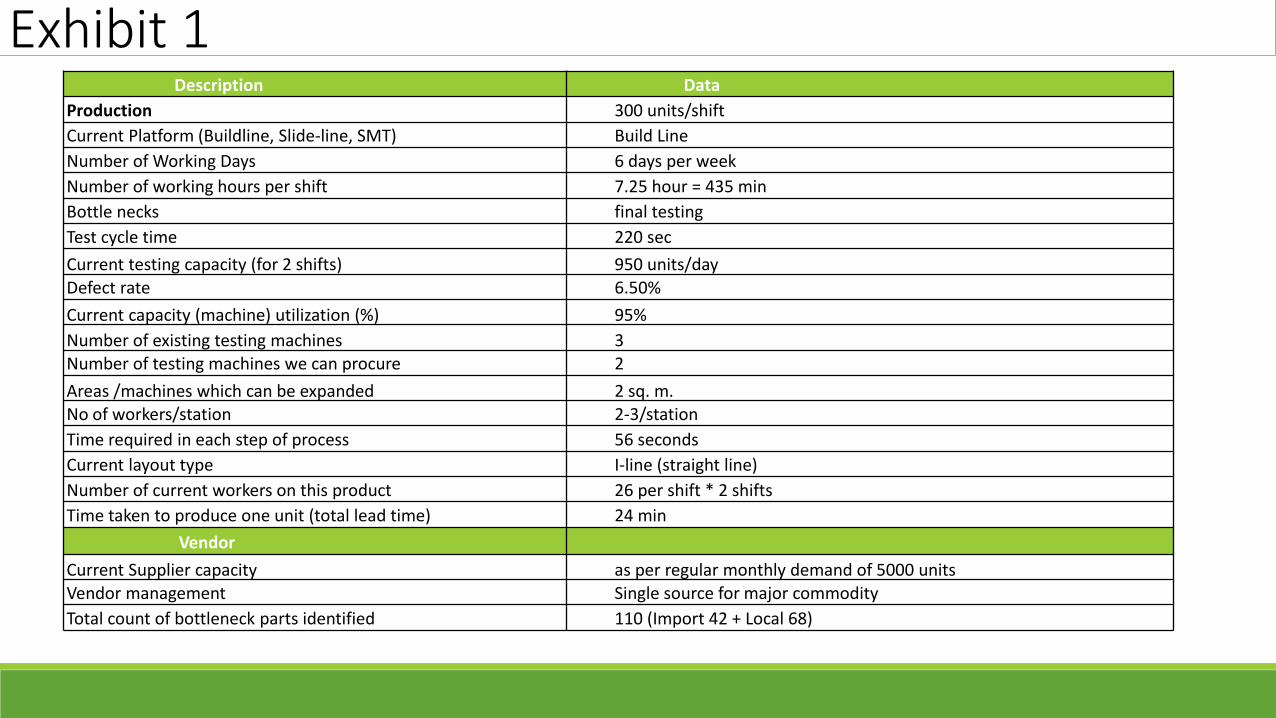
Description Data
Production 300 units/shift
Current Platform (Buildline, Slide-line, SMT) Build Line
Number of Working Days 6 days per week
Number of working hours per shift 7.25 hour = 435 min
Bottle necks final testing
Test cycle time 220 sec
Current testing capacity (for 2 shifts) 950 units/dayDefect rate 6.50%
Current capacity (machine) utilization (%) 95%
Number of existing testing machines 3Number of testing machines we can procure 2
Areas /machines which can be expanded 2 sq. m.No of workers/station 2-3/station
Time required in each step of process 56 seconds
Current layout type I-line (straight line)
Number of current workers on this product 26 per shift * 2 shifts
Time taken to produce one unit (total lead time) 24 min
Vendor
Current Supplier capacity as per regular monthly demand of 5000 unitsVendor management Single source for major commodity
Total count of bottleneck parts identified 110 (Import 42 + Local 68)
Exhibit 1
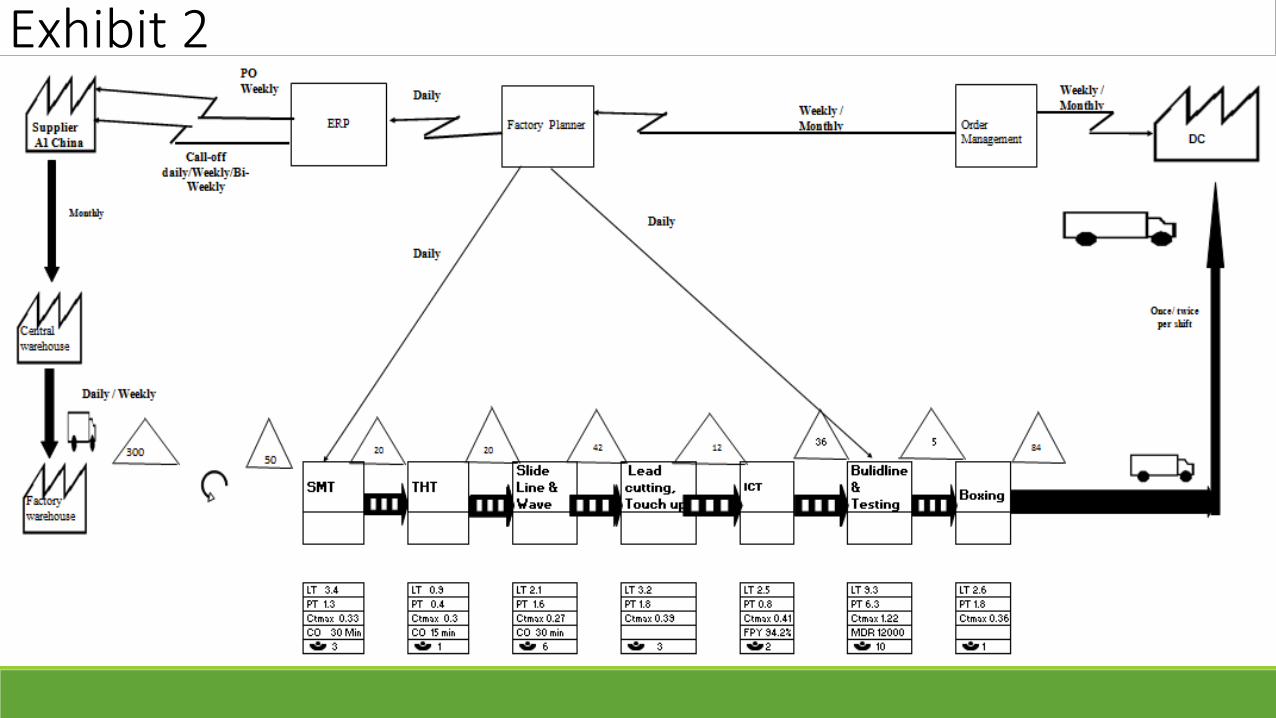
Exhibit 2