Embed Size (px)
Citation preview

Santander Latin America Santander Latin America Energy & Materials Energy & Materials
October 2009 October 2009 -- LondonLondon

2
This presentation contains forward-looking statements. Such statements are not
statements of historical facts, and reflect the beliefs and expectations of
Braskem’s management. The words “anticipates”, “wishes”, “expects”,
“estimates”, “intends”, “forecasts”, “plans”, “predicts”, “projects”, “targets”
and similar words are intended to identify these statements. Although Braskem
believes that expectations and assumptions reflected in the forward-looking
statements are reasonable based on information currently available to Braskem’s
management, Braskem cannot guarantee future results or events.
Forward-looking statements included in this presentation speak only as of the
date they were made (June 30, 2009), and the Company does not undertake any
obligation to update them in light of new information or future developments.
Braskem shall not be responsible for any transaction or investment decisions that
are taken based on information included in this presentation.
ForwardForward--looking Statementslooking Statements

3
� The Company & 2Q09 Financials
� Key Differentiators
3
� Petrochemical Industry
AgendaAgenda

4
� Leading petrochemical company in Latin America
� Third largest resins producer in the Americas
� Diversified portfolio of petrochemical products, with focus on PE, PP and PVC
� 18 facilities plants in Brazil and annual production capacity of 11 million tons of chemical and petrochemical products
� Key financials, 2008Gross revenue = US$ 12.8 billionNet revenue = US$ 10.0 billion (78% in Brazil)EBITDA = US$ 1.3 billionAssets = US$ 9.7 billion
� Listed at BM&F Bovespa, NYSE and LATIBEX100% tag along
Braskem in a snapshotBraskem in a snapshot
5
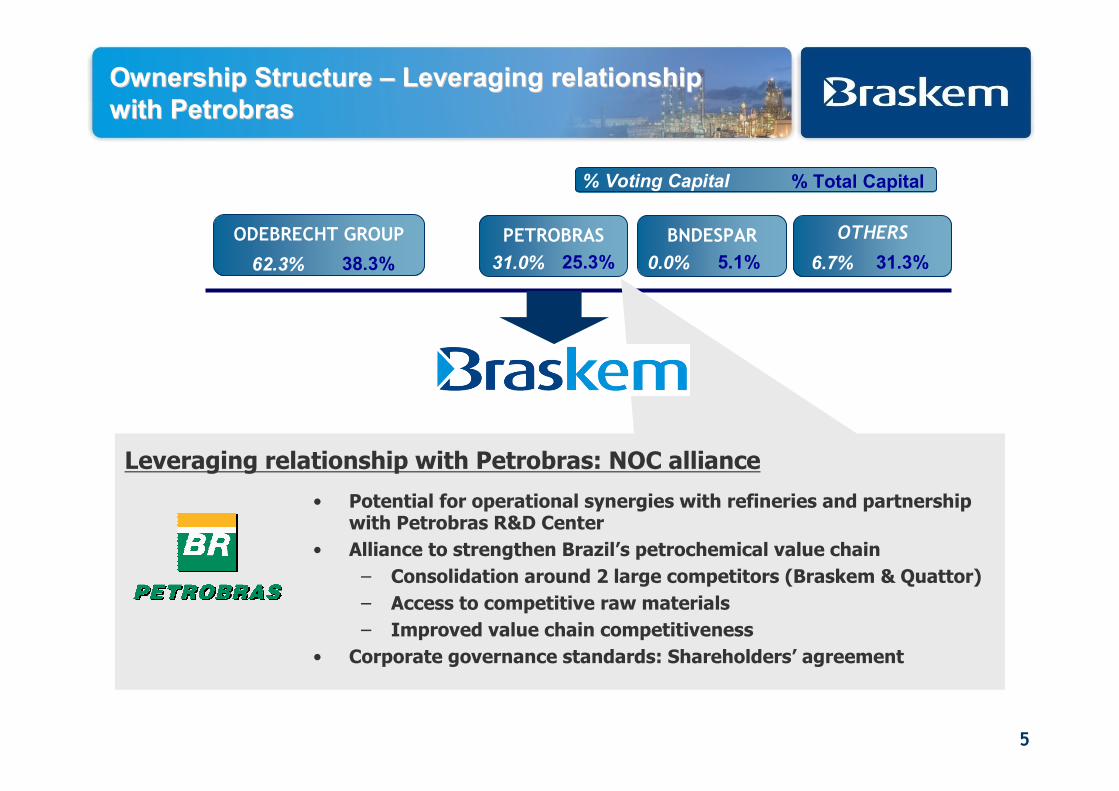
• Potential for operational synergies with refineries and partnership with Petrobras R&D Center
• Alliance to strengthen Brazil’s petrochemical value chain
– Consolidation around 2 large competitors (Braskem & Quattor)
– Access to competitive raw materials
– Improved value chain competitiveness
• Corporate governance standards: Shareholders’ agreement
Leveraging relationship with Petrobras: NOC alliance
ODEBRECHT GROUP
38.3%62.3%
PETROBRAS
25.3%31.0%
OTHERS
31.3%6.7%
BNDESPAR
5.1%0.0%
% Voting Capital % Total Capital
Ownership Structure Ownership Structure –– Leveraging relationship Leveraging relationship
with Petrobraswith Petrobras

6
ConvertersBasic petchem Resins
Industrial integration
PE/PP/PVCPE/PP/PVC
Oil/Gas-refineries
Naphtha/GasNaphtha/Gas
Source: Braskem / Abiquim
Resins Market Share Resins Market Share 20082008
51%51%
Enhanced competitiveness through value chain Enhanced competitiveness through value chain
integrationintegration

7
2012
2002
Rank amongst the Rank amongst the 10 10 largest petrochemical largest petrochemical companies companies in the worldin the world
measured bymeasured by EV*EV*
Become the Become the largestlargestthermoplastic resins thermoplastic resins producer in Latin producer in Latin
AmericaAmerica
2006TrikemTrikem
2007PolialdenPolialden
PolitenoPolitenoIPQ / CPSIPQ / CPS
2000 2002 2004 2005 2006 2007
1,734
3,045 3,2253,621
5,551
3,145
2008
5,901
Organic growth
Acquisitions
Braskem’s Ethylene and resins capacity (kt) 23% CAGR
2008
PauliniaPaulinia
* Enterprise Value
TriunfoTriunfo
2009
Track record of strong and consistent organic Track record of strong and consistent organic
growth and acquisitions growth and acquisitions
6,113
2009

8
Structured resource base to support client needs
�Over US$ 190 million in R&D assets
�> 170 researchers
�8 pilot plants
�> 240 patents filed
worldwide
�Partnership with universities and R&D centers in
Brazil and abroad
8
Applied Innovation and technology to strengthen Applied Innovation and technology to strengthen
value chain competitivenessvalue chain competitiveness
� Focus on product and application development
– 18% of resin sales derive from products developed in the last three years
– Focus on clients’ end users
� Targeted initiatives for breakthrough technology
– Intelligent packaging
– Renewables
Source: Braskem

9
� Venezuela:
� Polipropileno del Sur (Propilsur)
- Basic engineering and front end engineering design (FEED) concluded
- Program timetable altered: startup in 2013 and investments estimated at US$ 1.2 billion
� Polietilenos de America (Polimerica)
- Technology license agreements signed for the PE plants
- Program timetable altered: startup in 2014 and investments estimated at US$ 3.25 billion
� Peru:
− Braskem, Petrobras and PetroPerú concluded studies for the technical and economic pre-
feasibility phase of an integrated project to produce 700 kton to 1,200 kton of polyethylene using
the natural gas available in Peru as feedstock.
� Green PE:
− Cornerstone laid for its green ethylene plant in April/09
− Investments of R$488 million and startup expected for the end of 2010
− Financing package with BNDES approved in May/09
Growth combined withGrowth combined with
improved competitivenessimproved competitiveness
Source: Braskem

10
Global Scenario
� Oil price trend is still uncertain
− Economy recovery worldwide versus high inventory level
� Naphtha prices reflect the volatility of crude
� Petrochemical prices in the international market improved during 3Q09 but are expected to decrease for the 4Q09
− Commissioning of new plants
− Lower demand from converters
− Resin’s spread expected to be attractive
− Higher operating rates compared to 1H09
� Downturn cycle can last until 2011
Regional Scenario
� Braskem plants operating at full capacity
� Strong domestic demand during 3Q09 and favorable global scenario pressured prices upward
� Real appreciation and operational problems with Quattor lead imports to pick up again
� Inventory levels in the chain are still low
� Sales volume recovery for Mercosur, Bolivia and Andean countries
− Low consumer confidence and reduced liquidity still hurting Argentina’s economy
Global and Global and Regional Regional ScenarioScenario
Source: Braskem / CMAI / Quimax

11
100
500
900
1,300
1,700
Jan-08
Feb-08
Mar-08
Apr-08
May-08
Jun-08
Jul-08
Aug-08
Sep-08
Oct-08
Nov-08
Dec-08
Jan-09
Feb-09
Mar-09
Apr-09
May-09
Jun-09
Jul-09
Aug-09
Sep-09
PE PE US$/tonUS$/ton PPPP US$/tonUS$/ton
PVCPVC US$/tonUS$/ton
Source: CMAI (References PP, PE, PVC: Asia and Benzene: USA)
-31%
+55%
BenzeneBenzene US$/tonUS$/ton
-36%
+213%
+38%
-35%-44%
+48%
Recovery in resins and aromatics international Recovery in resins and aromatics international
prices till 3Q09prices till 3Q09
500
900
1,300
1,700
2,100
Jan-08
Feb-08
Mar-08
Apr-08
May-08
Jun-08
Jul-08
Aug-08
Sep-08
Oct-08
Nov-08
Dec-08
Jan-09
Feb-09
Mar-09
Apr-09
May-09
Jun-09
Jul-09
Aug-09
Sep-09
500
900
1,300
1,700
2,100
Jan-08
Feb-08
Mar-08
Apr-08
May-08
Jun-08
Jul-08
Aug-08
Sep-08
Oct-08
Nov-08
Dec-08
Jan-09
Feb-09
Mar-09
Apr-09
May-09
Jun-09
Jul-09
Aug-09
Sep-09
500
900
1,300
1,700
Jan-08
Feb-08
Mar-08
Apr-08
May-08
Jun-08
Jul-08
Aug-08
Sep-08
Oct-08
Nov-08
Dec-08
Jan-09
Feb-09
Mar-09
Apr-09
May-09
Jun-09
Jul-09
Aug-09
Sep-09

12
40
60
80
100
120
140
160
Dec-07
Jan-08
Feb-08
Mar-08
Apr-08
May-08
Jun-08
Jul-08
Aug-08
Sep-08
Oct-08
Nov-08
Dec-08
Jan-09
Feb-09
Mar-09
Apr-09
May-09
Jun-09
Jul-09
Aug-09
40
60
80
100
120
140
160
Dec-07
Jan-08
Feb-08
Mar-08
Apr-08
May-08
Jun-08
Jul-08
Aug-08
Sep-08
Oct-08
Nov-08
Dec-08
Jan-09
Feb-09
Mar-09
Apr-09
May-09
Jun-09
Jul-09
Aug-09
40
60
80
100
120
140
160
Dec-07
Jan-08
Feb-08
Mar-08
Apr-08
May-08
Jun-08
Jul-08
Aug-08
Sep-08
Oct-08
Nov-08
Dec-08
Jan-09
Feb-09
Mar-09
Apr-09
May-09
Jun-09
Jul-09
Aug-09
+37%
PE PE Dec07 = 100 basisDec07 = 100 basis PPPP
PVCPVC
Source: Quimax
-30%
-31%
+41%
+36%
-31%
Dec07 = 100 basisDec07 = 100 basis
Dec07 = 100 basisDec07 = 100 basis
FX impact on domestic pricesFX impact on domestic prices

13
27%18%
55%
29%
16%
PE PP PVC Total
Resins
Brazilian
Market *
Source: Braskem
Domestic Sales 1Q09 x 2Q09Domestic Sales 1Q09 x 2Q09 %%
Others
Imports
Resins Market Share 2Q09Resins Market Share 2Q09
* Braskem estimates: Domestic sales + imports
53%
28%
19%
Brazilian market showing significant evolutionBrazilian market showing significant evolution

14Source: Braskem
ResinsResins Sales Volume in the Sales Volume in the DomesticDomesticMarketMarket 3Q09 3Q09 TrendTrend in the in the DomesticDomestic MarketMarket
March performance shows trends for the March performance shows trends for the
upcoming quarterupcoming quarter
Volume Price Revenue Cost
PP
PE
PVC
BTX
Oct-08
Nov-08
Dec-08
Jan-09
Feb-09
Mar-09
Apr-09
May-09
Jun-09
Jul-09
Aug-09
Sep-09

15Source: Braskem
R$ million
EBITDA Higher basic petrochemicals prices and sales volume overcome exchange appreciation and raw material cost increase
EBITDA EBITDA Higher basic petrochemicals prices and sales volume Higher basic petrochemicals prices and sales volume overcome exchange appreciation and raw material cost increaseovercome exchange appreciation and raw material cost increase
FX Impact
on Costs
FX Impact
on Revenue
247
(334)
566
245787
96232
457
539 65
EBITDA
1Q09
Price Volume Raw
Material
Others
PIS/
COFINS
FX Other
Variable
Costs
Costs +
SG&A
EBITDA
2Q09
( ) ( )
( ) ( ) ( )

16Source: Braskem
R$ Million (06/30/09)
Gross DebtGross Debt: 10,583: 10,583
Net DebtNet Debt: 7,347: 7,347
Average TermAverage Term: 10.1 : 10.1 yearsyears
67% 67% of the debt are pegged to the USD of the debt are pegged to the USD
Net Debt / Net Debt / EbitdaEbitda (x) US$(x) US$Net Debt / Net Debt / EbitdaEbitda (x) R$(x) R$
526
1,091
1,6171,326 1,288 1,209
615
1,372976
1,768 610
1,468
PFICO
11% 10%
15%
13% 12%11%
6%
13%
9%
3,236
In US$
In R$Value related to the loan granted by a Petrobras subsidiary for the
delisting of Copesul, due in October 2009.
06/30/09 2009 2010 2011 2012 2013 2014/
20152016/
2017
2018/
20192020 onwards
Comfortable cash position, coveringComfortable cash position, covering
over 2 years of debt amortizationover 2 years of debt amortization

17
� The Company & 1Q09 Financials
� Key Differentiators
17
� Petrochemical Industry
AgendaAgenda
18
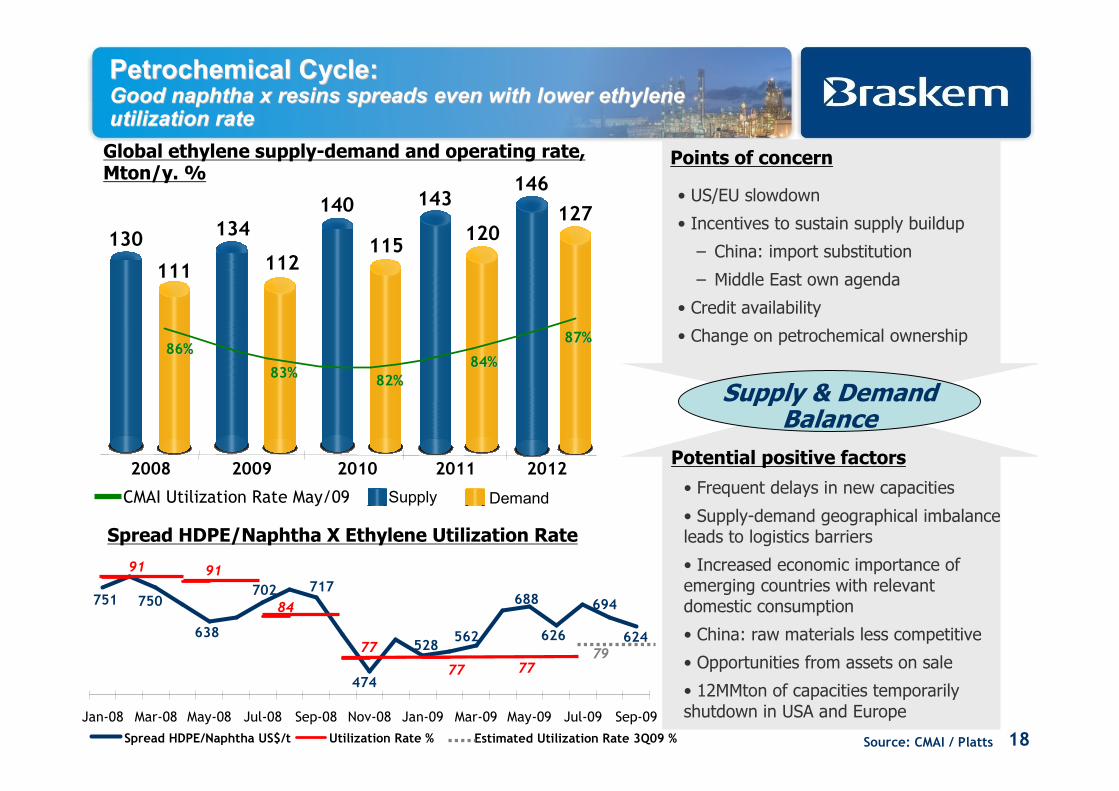
694
624562528
474
717751 750
638
702688
62677
91
84
91
77
Jan-08 Mar-08 May-08 Jul-08 Sep-08 Nov-08 Jan-09 Mar-09 May-09 Jul-09 Sep-09
Spread HDPE/Naphtha US$/t Utilization Rate %
79
Estimated Utilization Rate 3Q09 %
77
Supply
130134
140 143
111 112115
120
2008 2009 2010 2011
146
127
2012
1 2 3 5CMAI Utilization Rate May/09 Demand
86%86%
83%83%82%82%
84%84%
87%87%
Source: CMAI / Platts
Spread HDPE/Naphtha X Ethylene Utilization Rate
Global ethylene supply-demand and operating rate, Mton/y. %
Potential positive factors
• Frequent delays in new capacities
• Supply-demand geographical imbalance leads to logistics barriers
• Increased economic importance of emerging countries with relevant domestic consumption
• China: raw materials less competitive
• Opportunities from assets on sale
• 12MMton of capacities temporarily shutdown in USA and Europe
Points of concern
• US/EU slowdown
• Incentives to sustain supply buildup
– China: import substitution
– Middle East own agenda
• Credit availability
• Change on petrochemical ownership
Supply & Demand Balance
Petrochemical Cycle:Petrochemical Cycle:Good naphtha x resins spreads even with lower ethylene Good naphtha x resins spreads even with lower ethylene utilization rateutilization rate
19
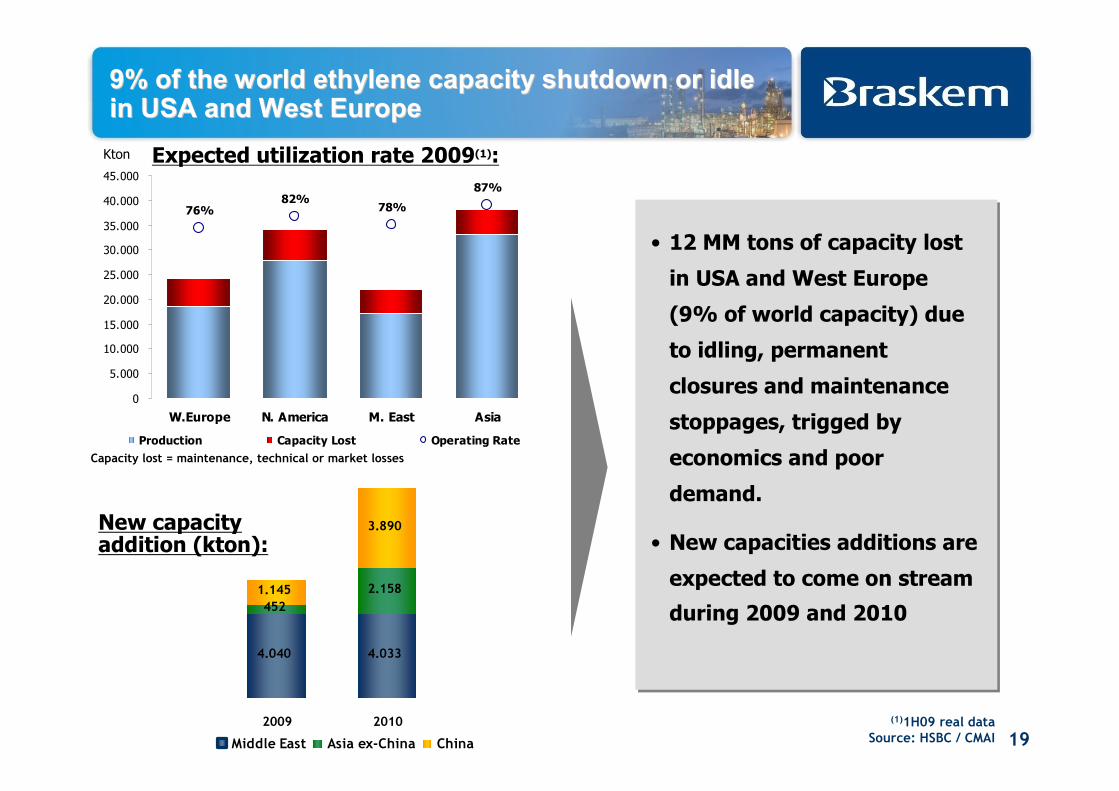
9% of the world ethylene capacity shutdown or idle 9% of the world ethylene capacity shutdown or idle in USA and West Europein USA and West Europe
76%82%
78%
87%
0
5.000
10.000
15.000
20.000
25.000
30.000
35.000
40.000
45.000
W.Europe N. America M. East Asia
Production Capacity Lost Operating Rate
(1)1H09 real dataSource: HSBC / CMAI
New capacity addition (kton):
Expected utilization rate 2009(1):
4.040 4.033
452
2.1581.145
3.890
2009 2010
Middle East Asia ex-China China
• 12 MM tons of capacity lost
in USA and West Europe
(9% of world capacity) due
to idling, permanent
closures and maintenance
stoppages, trigged by
economics and poor
demand.
• New capacities additions are
expected to come on stream
during 2009 and 2010
Kton
Capacity lost = maintenance, technical or market losses

20
� The Company & 2008 Financials
� Key Differentiators
20
� Petrochemical Industry
AgendaAgenda

21
-1
0
1
2
3
4
5
6
7
2007 2008 2009 2010
%
interest
-1
0
1
2
3
4
5
6
7
% GDP
GDP Inflation
Structural changes have prepared the country to the current environment
�Economic policy based on inflation target, fiscal responsibility and floating exchange rate
�Competitive, diversified and open economy
�Liquid financial system
�Mature democracy
�Broad and consumerist domestic market
�Greater competitiveness of Brazilian multinationals
�Focus on improving social conditions (health, education, income distribution)
�Sovereign debt in a record low, rated investment grade (S&P, Fitch)
Source: Tendências Consulting - Bradesco and Santander Perspectives (Sep/09)
GDP growth and inflation
Brazil: A stable economyBrazil: A stable economy

22
1994 1995 1996 1997 1998 1999 2000 2001 2002 2003 2004 2005 2006 2007 2008
PE PP PVC
Brazil: dynamic market with still low per capita Brazil: dynamic market with still low per capita
consumptionconsumption
• PE, PP and PVC per capita consumption (Kg per person)
22
*Compound annual growth rate Source: CMAI
11.112.5
13.6 14.5 15.4 16.2 16.6 16.1 17.8 17.518.7 18.0
20.2
22.7
76
68
57
USA Europe Japan
Brazil
5.2%CAGR*
21.9

23
In Brazil, companies are exposed to a dynamic In Brazil, companies are exposed to a dynamic
market with resilient growthmarket with resilient growth……
• Domestic demand for resins
Source: Abiquim – domestic sales + imports
PEPPPVC
2,880
3,435 3,3773,694
2001 2004 2005 2006
4,048
2007
1,695
990
692
1,833
1,114
1,964
1,228
856
5.4%CAGR
10%
9%
749
• USA demand for resins (Kton)
23,276
25,90424,749
25,020
2001 2004 2005 2006
24,212
2007
6,350
6,081
6,287
12,826
6,153
12,638
5,421
-1.2%CAGR
-3%1%
5,907
12,318
Source: NAD - CMAI
4,172
2008
3%
5,922
11,091
5,563
4,328
1,833
1,114
749
2008
21,341
-12%
1,972
1,218
982

24
24
• 2 Top producers share• Number of Producers
Source: Braskem / CMAI
…… and a high level of consolidationand a high level of consolidation
2 2 2
1311
9
PE PP PVC
93%100% 100%
42%30%
52%
PE PP PVC
BRAZIL USA

25
Assure regional low-cost raw
material and energy supplies
B
Expand access to attractive markets
C
• Operational and commercial excellence
• Relationship with Petrobras
• Value-chain virtual integration– Refineries and raw materials
– Logistics and services
– Innovation and technology
• Enhancement of aromatics and crackers’products
• Regional leadership
• Gas crackers in Latin America
• Brazilian sugar cane ethanol
• Expansion of Green-PE and renewable
• M&As
• Global Alliances
Increase and protect core Latin American business
A
Strengthen current position
Grow w
ith val
ue cre
ation
Braskem is prepared to seize the opportunities Braskem is prepared to seize the opportunities
offered by this environmentoffered by this environment
Source: Braskem

26
Greater operational and financial strengthGreater operational and financial strength
� Continuous strengthening of long-term relationship with Clients
� Priority over financial health and liquidity
� Productivity Program: cost reduction
� Support the sustainability of the Brazilian petrochemical chain
� Construction of the Green PE plant
� Projects in Venezuela
� Analysis of opportunities arising from crisis: selective
acquisitions in North America
� Operational renewal: over 500 employees by 2011
FocusFocus

Santander Latin America Santander Latin America Energy & Materials Energy & Materials
October 2009 October 2009 -- LondonLondon

Appendix IAppendix I
28

29
Ideal product for kitchen cutting boards and playground toys
Internally developed technology for the production of UHMWPE
Pioneer on the production of metallocene PE in Brazil
Bags for Bread
Replacing paper bags
Shrink Films
Replacing paperboard boxes
Cisterns
PE replacing concrete
PE Innovation: Cases of SuccessPE Innovation: Cases of Success

30
High performance for the frigorific market
Developments for agricultural silo structure
Developments for truck liners:
anti-stick properties and high abrasion resistance
PE Innovation: Cases of SuccessPE Innovation: Cases of Success

31
Braskem product approved in
high speed BOPP production lines.PP Replacing PS
BOPP sealant layer High clarity PP grades
for rigid packaging
Disposable glasses replacing PS glasses
PP Innovation: Cases of SuccessPP Innovation: Cases of Success

32
PP Developments: Customer PartnershipPP Developments: Customer Partnership
Replacing steel in washing machine developments
Partnership in new packaging developments

33
33
Source: CMAI
Quattor** Solvay EcopetrolMexichemBraskem*
3,561
1,895
722 521 438692
Dow
**JV between Unipar (60%) and Petrobras (40%). The production is segregated between 1,020 kt in PE and 875 kt in PP
PVC
PEPP
2,340
FormosaDow LyondellBasell
Braskem ShintechIneos
5,416
3,561
4,706
2.902
2,895
400
4040
4,9762,469
2,237
1,995
1,040
526526
995
815
1,0921,092
810
Capacity of resins in Latin America, kton
Capacity of resins in Americas, kton
Brazilian assets
* Includes Petroquimica Triunfo´s plant
Resins Capacity in the Americas Resins Capacity in the Americas
1,085

34
World indicative ethylene cash costsWorld indicative ethylene cash costs
Source: CMAI

35
Financial highlightsFinancial highlights
Main Economic Main Economic IndicatorsIndicators
2Q09 2Q09 (A)(A)
1Q09 1Q09 (B)(B)
2Q08 2Q08 ( C)( C)
ChangeChange
% % (A)/(B)(A)/(B)
ChangeChange
% % (A)/( C)(A)/( C)
1H091H09(D)(D)
1H08 1H08 (E)(E)
Change Change
% % (D)/(E)(D)/(E)
Net Revenue 3,688 3,260 4,628 13 (20) 6,948 9,175 (24)
EBITDA 566 457 557 24 2 1,023 1,183 (14)
EBITDA Margin 15.3% 14.0% 12.0% 1.3 p.p. 3.3 p.p. 14.7% 12.9% 1.8 p.p.
Net Financial Result 1,192 (208) 386 - - 984 167 490
Net Income / Loss 1,156 10 404 - - 1,166 500 133
Source: Braskem

36
Revenues breakdown Revenues breakdown –– 2Q092Q09
BTX * 9%
Others 10%
Propylene 5%
Ethylene 4%
Resins 57%Fuel 4%
Butadiene 2%
Solvents 1%
Caustic Soda
3%
ETBE/MTBE 4%
Net Revenue by Product 1
(2Q09)
1 Does not include condensate processing and Ipiranga Química sales2 BTX - Benzene, Toluene, Ortoxylene and Paraxylene

37
COGS breakdown COGS breakdown –– 2Q092Q09
Naphtha /
Condensate
67,3%
Natural Gas 1,3%Fuel 1,6% Others 1,7%
Services 2,9%
Eletric Energy
6,3%
Labor 4,6%
Deprec / Amort
6,9%
Other Variable
Costs 7,3%
COGS 2Q091
1 Does not include condensate processing and costs of Ipiranga Química
sales

38
Utilization RateUtilization Rate %%
Source: Braskem
Resins ProductionResins Production KtonKton Basic Petrochemicals Basic Petrochemicals Production*Production* KtonKton
* Ethylene, Propylene and BTX
807636656
2Q08 1Q09 2Q09
+27
1,134874870
2Q08 1Q09 2Q09
+30%
Capacity utilization rates at normal levelsCapacity utilization rates at normal levels
99%
76%92%
74% 73%
93%
74% 73%
92%89%
70%88%
2Q08 1Q09 2Q09 2Q08 1Q09 2Q09 2Q08 1Q09 2Q09 2Q08 1Q09 2Q09
PE PP PVCETHYLENE

39
Outstanding Bonds & Outstanding RatingsOutstanding Bonds & Outstanding Ratings
7.07.250Jun/2018US$500 MM
9.59.750PerpetualUS$150 MM
Perpetual
Jan/2017
Jun/2015
Jan/2014
MaturityMaturity
6.88.000US$275 MM
8.8
5.9
5.5
Yield * Yield * (% p.a.) (% p.a.)
Outstanding BondsOutstanding BondsCoupon Coupon (% p.a.)(% p.a.)
US$250 MM 11.750
US$250 MM 9.375
US$200 MM 9.000
Corporate Credit Rating Corporate Credit Rating –– Global ScaleGlobal Scale
Source: Braskem / Bloomberg
Ba1
BB+
BB+
RatingRating
StableMoody’s
AgencyAgency OutlookOutlook
Fitch Ratings Stable
S&P Stable
* As of September, 29th

40
CovenantsCovenants
US$725 MM
US$80 MM
US$250 MM
R$800 MM
AmountAmount
MaintenanceUS$Nippon Export and Nippon Export and Investment InsuranceInvestment Insurance
Maintenance
Incurrence*
Incurrence*
TypeTypeFacilityFacility CurrencyCurrency
2010 and 2011 Debentures2010 and 2011 Debentures R$
2014 Medium Term Notes2014 Medium Term Notes R$
EPP (Export PreEPP (Export Pre--Payment) Payment) US$
Net Debt / EBITDA
< 4.5X3.25
Jun09
* The company is prevented from issuing any new debt for the period if it overcomes the 4.5x Net debt / Ebitda
ratio.
Net Debt / Net Debt / EbitdaEbitda (x)(x)
3.16
Jun09
RATIORATIO
R$R$US$US$
Source: Braskem
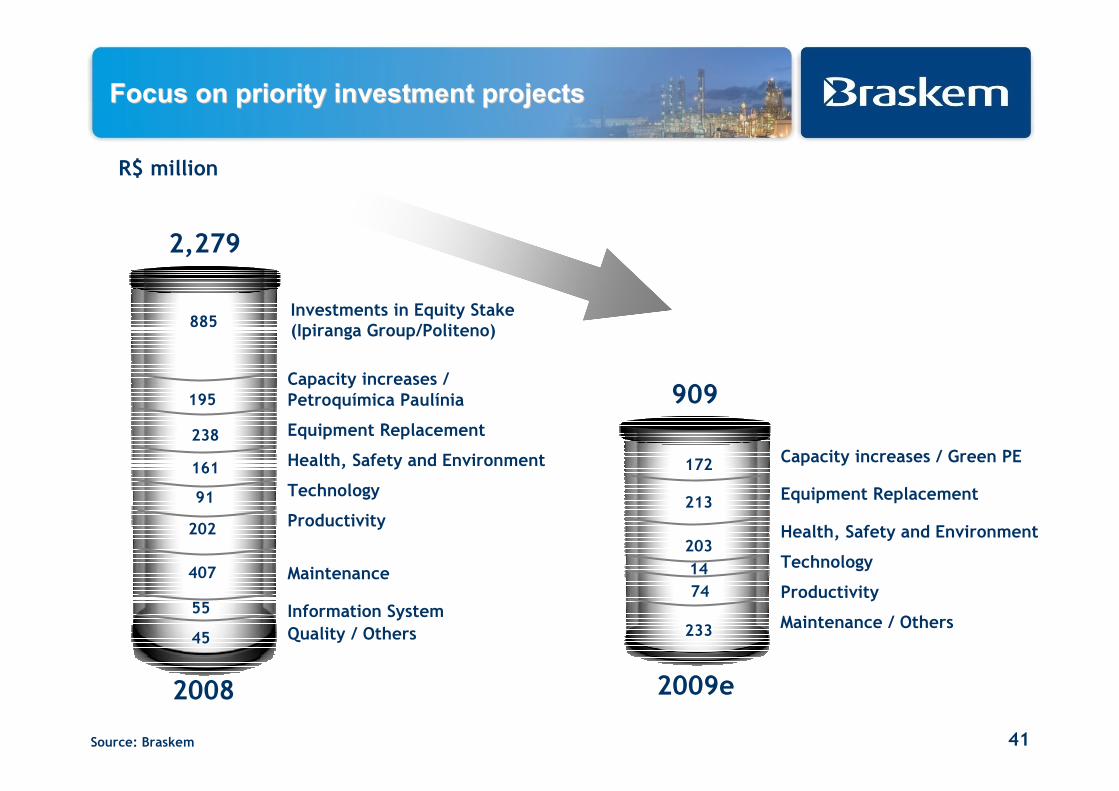
41
R$ million
Capacity increases /Petroquímica Paulínia
Health, Safety and Environment
Technology
Equipment Replacement
Productivity
Quality / Others
Information System
MaintenanceTechnology
Productivity
Maintenance / Others
Capacity increases / Green PE
Equipment Replacement
161
238
2,279
2008
45
195
91
202
407
55
885Investments in Equity Stake (Ipiranga Group/Politeno)
203
213
909
2009e
172
14
74
233
Source: Braskem
Health, Safety and Environment
Focus on priority investment projects Focus on priority investment projects