Embed Size (px)
Citation preview
1
Corporate Presentation
Santander Latin American Conference May/11
2
Disclaimer
� This presentation may contain forward-looking statements. Such forward-looking statements are and will be subject tomany risks and uncertainties relating to factors that are beyond Direcional’s ability to control or estimate precisely, suchas future market conditions, competitive environment, currency and inflation fluctuations, changes in governmental andregulatory policies and other factors relating to the operations of Direcional, which may cause actual future results ofDirecional to differ materially from those expressed or implied in such forward-looking statements
� You are cautioned not to place undue reliance on these forward-looking statements, which speak only as of the date ofthis presentation. Such forward-looking statements shall not be construed as guarantee of future performance.Direcional does not undertake to publicly review or update these forward-looking statements in view of events orcircumstances occurring after the date of this presentation
� This presentation does not constitute an offer, or invitation, or solicitation of an offer, to subscribe for or purchase anysecurities. Neither this presentation nor anything contained herein shall form the basis of any contract or commitmentwhatsoever
� This presentation and its contents are proprietary information and may not be reproduced or otherwise disseminated inwhole or in part without Direcional’s prior written consent.
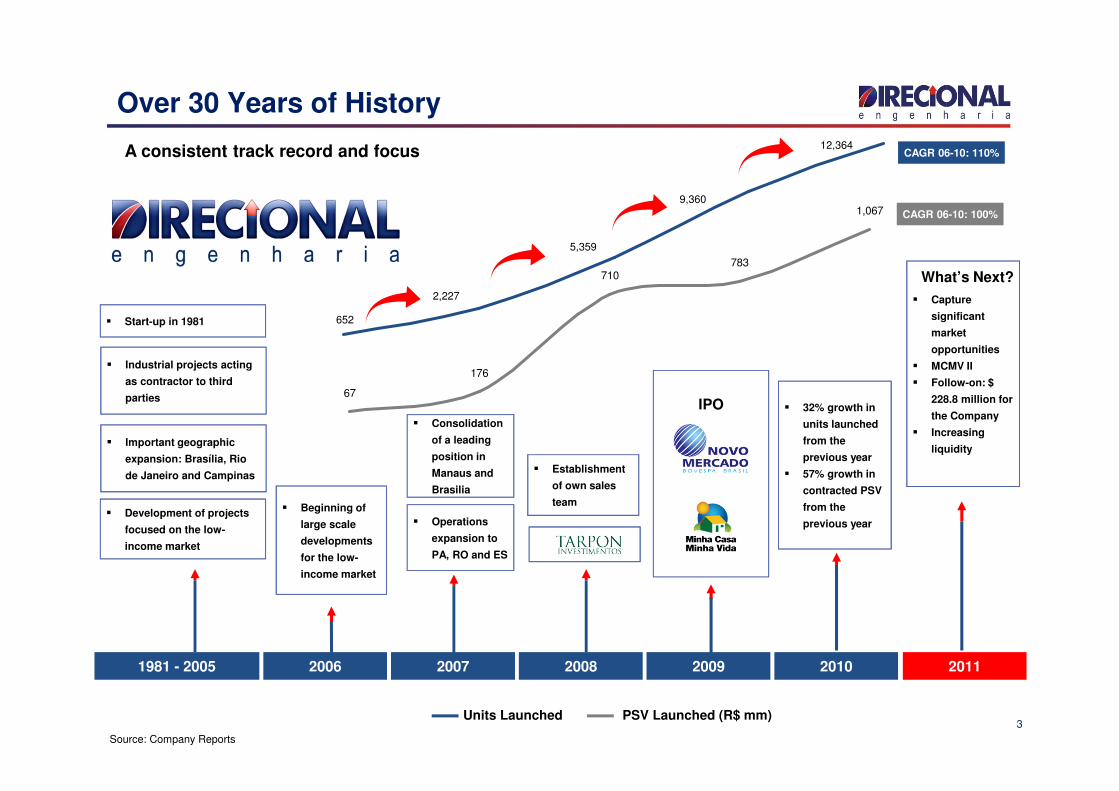
652
2,227
5,359
9,360
12,364
� Start-up in 1981
� Development of projects
focused on the low-
income market
� Industrial projects acting
as contractor to third
parties
� Beginning of
large scale
developments
for the low-
income market
� Operations
expansion to
PA, RO and ES
IPO � 32% growth in
units launched
from the
previous year
� 57% growth in
contracted PSV
from the
previous year
3
Over 30 Years of History
A consistent track record and focus
Source: Company Reports
Units Launched
� Consolidation
of a leading
position in
Manaus and
Brasilia
� Establishment
of own sales
team
� Important geographic
expansion: Brasília, Rio
de Janeiro and Campinas
1981 - 2005 2006 2007 2008 2009 2010 2011
� Capture
significant
market
opportunities
� MCMV II
� Follow-on: $
228.8 million for
the Company
� Increasing
liquidity
PSV Launched (R$ mm)
What’s Next?
CAGR 06-10: 110%
CAGR 06-10: 100%
67
176
710783
1,067
4
Management Team
Ricardo Valadares Gontijo
Chairman & CEO
Ricardo Valadares Gontijo
Chairman & CEO
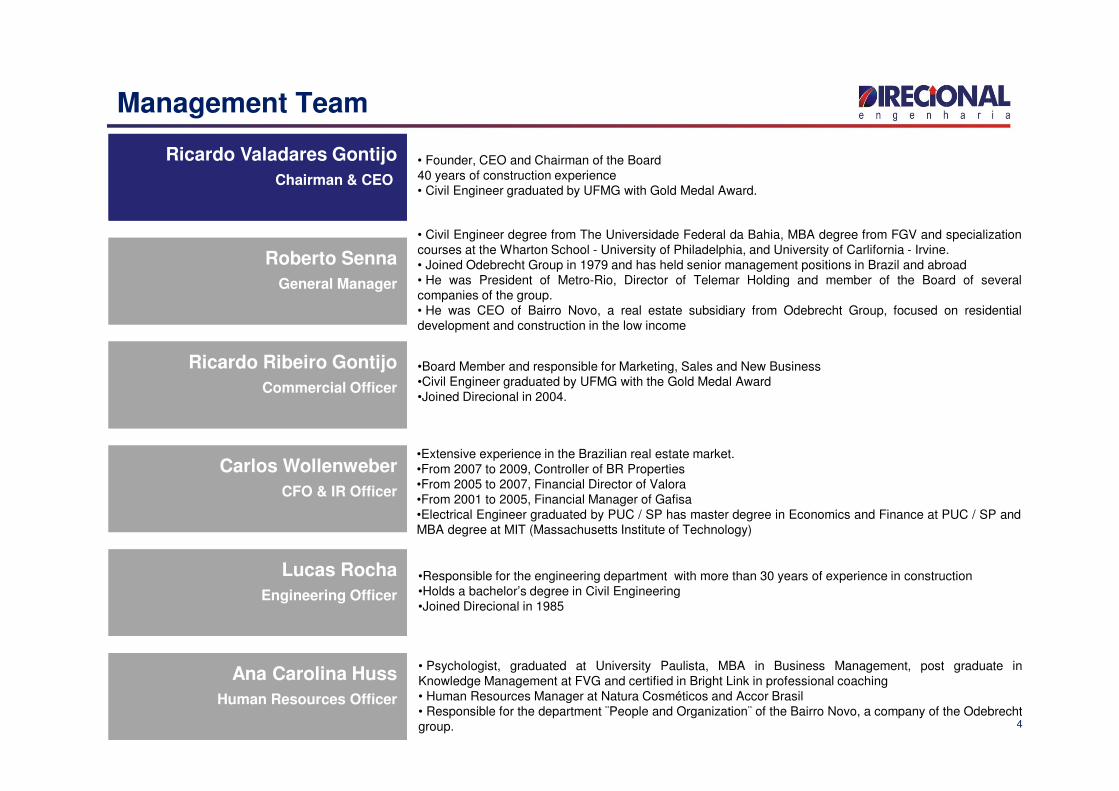
• Founder, CEO and Chairman of the Board40 years of construction experience• Civil Engineer graduated by UFMG with Gold Medal Award.
Ricardo Ribeiro Gontijo
Commercial Officer
Ricardo Ribeiro Gontijo
Commercial Officer
Carlos Wollenweber
CFO & IR Officer
Carlos Wollenweber
CFO & IR Officer
Lucas Rocha
Engineering Officer
Lucas Rocha
Engineering Officer
Roberto Senna
General Manager
Roberto Senna
General Manager
• Civil Engineer degree from The Universidade Federal da Bahia, MBA degree from FGV and specializationcourses at the Wharton School - University of Philadelphia, and University of Carlifornia - Irvine.• Joined Odebrecht Group in 1979 and has held senior management positions in Brazil and abroad• He was President of Metro-Rio, Director of Telemar Holding and member of the Board of severalcompanies of the group.• He was CEO of Bairro Novo, a real estate subsidiary from Odebrecht Group, focused on residentialdevelopment and construction in the low income
Ana Carolina Huss
Human Resources Officer
Ana Carolina Huss
Human Resources Officer
•Board Member and responsible for Marketing, Sales and New Business•Civil Engineer graduated by UFMG with the Gold Medal Award•Joined Direcional in 2004.
•Extensive experience in the Brazilian real estate market.•From 2007 to 2009, Controller of BR Properties•From 2005 to 2007, Financial Director of Valora•From 2001 to 2005, Financial Manager of Gafisa•Electrical Engineer graduated by PUC / SP has master degree in Economics and Finance at PUC / SP andMBA degree at MIT (Massachusetts Institute of Technology)
•Responsible for the engineering department with more than 30 years of experience in construction•Holds a bachelor’s degree in Civil Engineering•Joined Direcional in 1985
• Psychologist, graduated at University Paulista, MBA in Business Management, post graduate inKnowledge Management at FVG and certified in Bright Link in professional coaching• Human Resources Manager at Natura Cosméticos and Accor Brasil• Responsible for the department ¨People and Organization¨ of the Bairro Novo, a company of the Odebrechtgroup.
5
Shareholder’s Structure
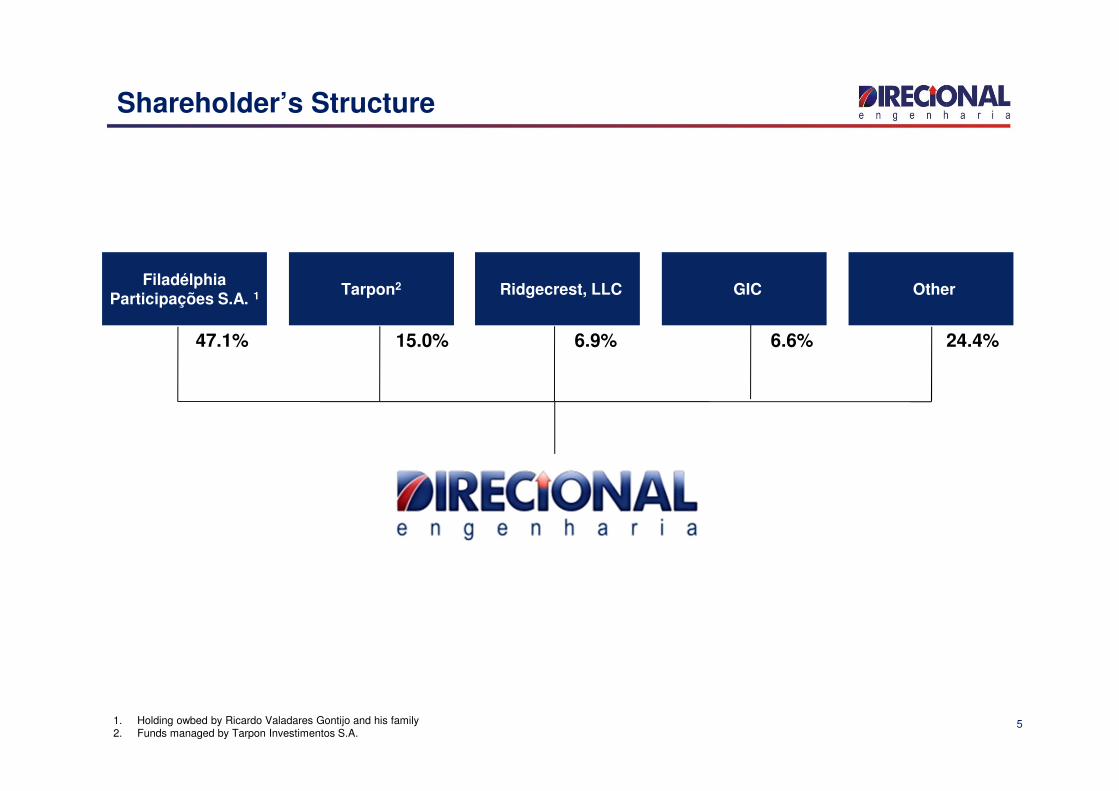
47.1% 15.0%
FiladélphiaParticipações S.A. 1 Ridgecrest, LLCTarpon2 Other
6.9% 24.4%
GIC
6.6%
1. Holding owbed by Ricardo Valadares Gontijo and his family2. Funds managed by Tarpon Investimentos S.A.

6
Business Model
6
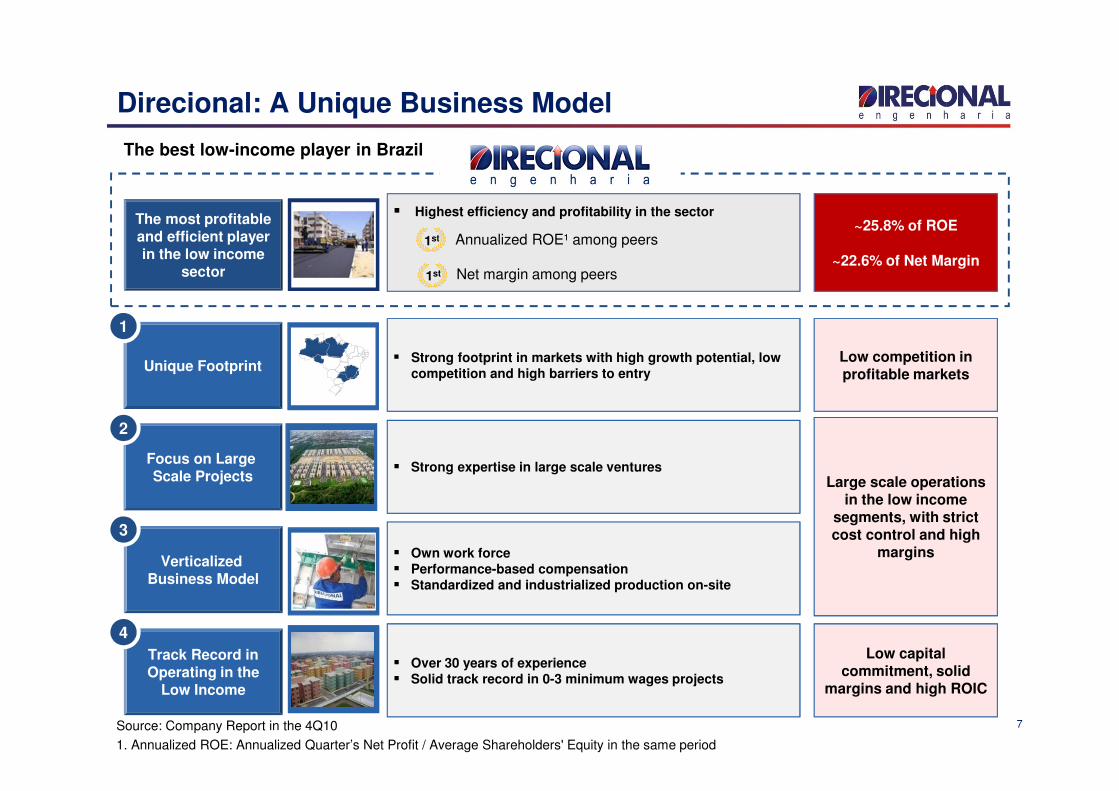
Unique Footprint� Strong footprint in markets with high growth potential, low
competition and high barriers to entry
Low competition in profitable markets
Track Record in Operating in the
Low Income
� Over 30 years of experience� Solid track record in 0-3 minimum wages projects
Low capital commitment, solid
margins and high ROIC
Focus on Large Scale Projects
Verticalized Business Model
� Strong expertise in large scale ventures
� Own work force� Performance-based compensation� Standardized and industrialized production on-site
Large scale operations in the low income
segments, with strict cost control and high
margins
7
Direcional: A Unique Business Model
The best low-income player in Brazil
Source: Company Report in the 4Q101. Annualized ROE: Annualized Quarter’s Net Profit / Average Shareholders' Equity in the same period
The most profitable and efficient player in the low income
sector
‘’’’‘
� Highest efficiency and profitability in the sector
1st Annualized ROE¹ among peers~25.8% of ROE
~22.6% of Net Margin1st Net margin among peers
1
2
3
4
8
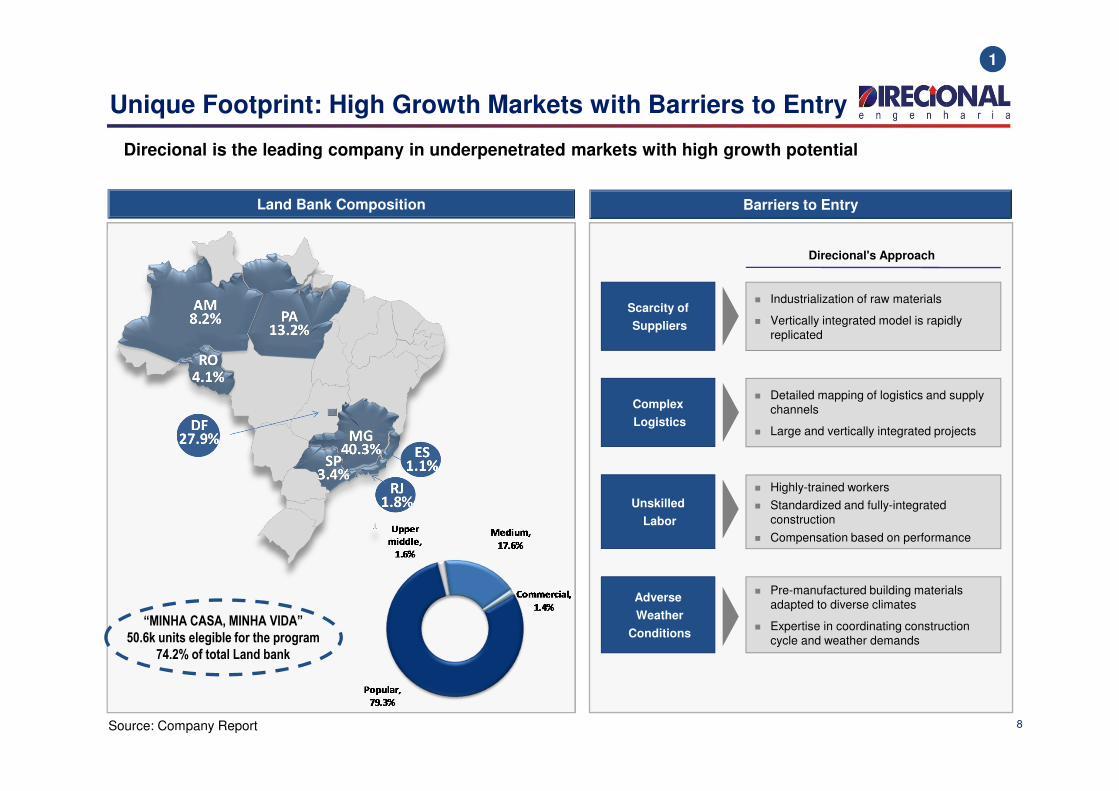
Unique Footprint: High Growth Markets with Barriers to Entry
Land Bank Composition Barriers to Entry
Complex
Logistics
� Detailed mapping of logistics and supply channels
� Large and vertically integrated projects
Scarcity of
Suppliers
� Industrialization of raw materials
� Vertically integrated model is rapidly replicated
Adverse
Weather
Conditions
� Pre-manufactured building materials adapted to diverse climates
� Expertise in coordinating construction cycle and weather demands
Direcional's Approach
Unskilled
Labor
� Highly-trained workers
� Standardized and fully-integrated construction
� Compensation based on performance
1
Direcional is the leading company in underpenetrated markets with high growth potential
“MINHA CASA, MINHA VIDA”
50.6k units elegible for the program
74.2% of total Land bank
Source: Company Report
9
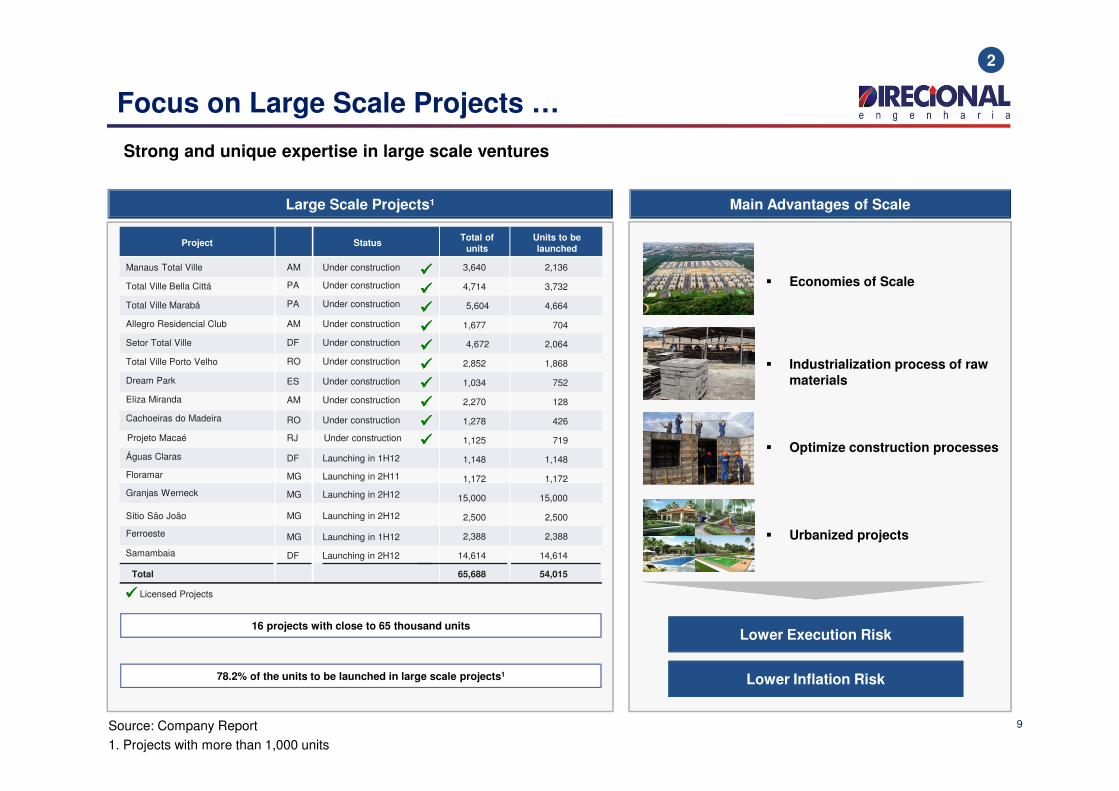
Focus on Large Scale Projects …
Strong and unique expertise in large scale ventures
Source: Company Report1. Projects with more than 1,000 units
2
Large Scale Projects¹
Project StatusTotal of
unitsUnits to belaunched
Main Advantages of Scale
� Economies of Scale
� Industrialization process of raw materials
� Optimize construction processes
� Urbanized projects
���� Licensed Projects
Lower Execution Risk
Lower Inflation Risk
Manaus Total Ville AM Under construction
Total Ville Bella Cittá PA Under construction
Total Ville Marabá PA Under construction
Allegro Residencial Club AM Under construction
Setor Total Ville DF Under construction
Total Ville Porto Velho RO Under construction
Dream Park ES Under construction
Eliza Miranda AM Under construction
Cachoeiras do Madeira RO Under construction
Águas Claras DF Launching in 1H12
Granjas Werneck MG Launching in 2H12
Floramar MG Launching in 2H11
Samambaia DF Launching in 2H12
Projeto Macaé RJ Under construction
Sítio São João MG Launching in 2H12
Ferroeste MG Launching in 1H12
Total
78.2% of the units to be launched in large scale projects1
16 projects with close to 65 thousand units
3,640 2,136
4,714 3,732
5,604 4,664
1,677 704
4,672 2,064
2,852 1,868
1,034 752
2,270 128
1,278 426
1,148 1,148
15,000 15,000
1,172 1,172
14,614 14,614
1,125 719
2,500 2,500
2,388 2,388
65,688 54,015
����
����
����
����
����
����
����
����
����
����
10
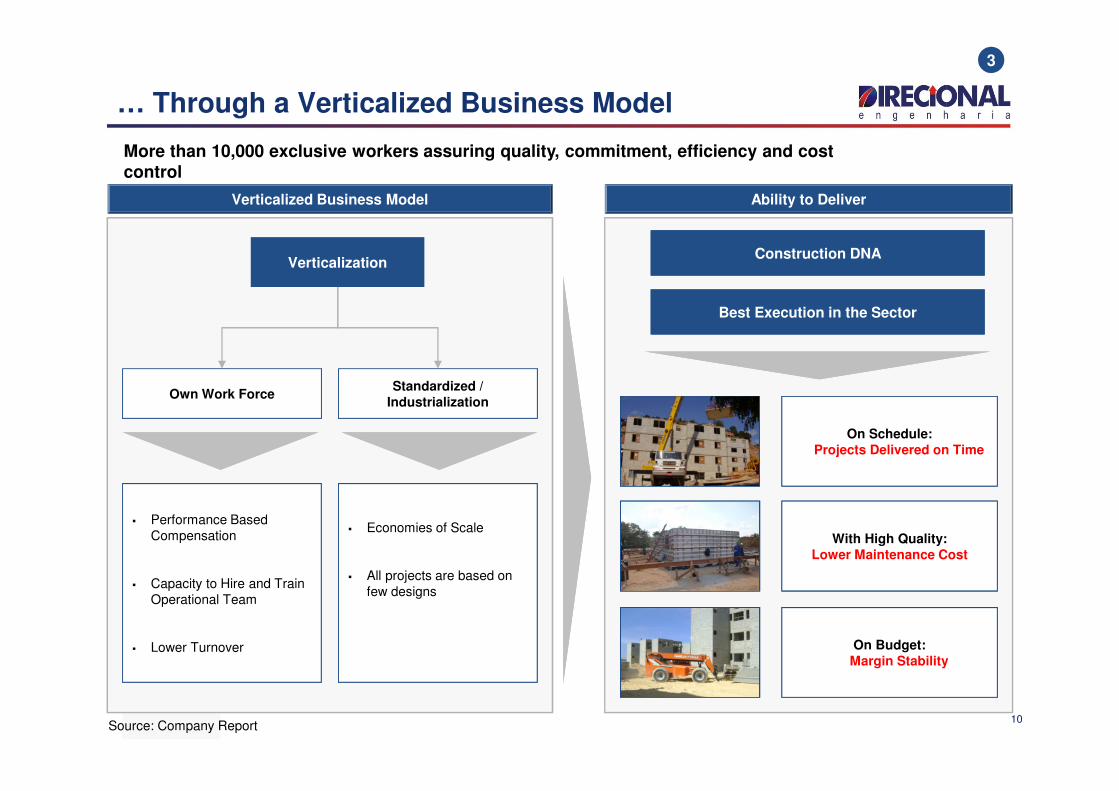
… Through a Verticalized Business Model
More than 10,000 exclusive workers assuring quality, commitment, efficiency and cost control
Verticalized Business Model
� Performance Based Compensation
� Capacity to Hire and Train Operational Team
� Lower Turnover
Ability to Deliver
3
Best Execution in the SectorBest Execution in the Sector
Construction DNAConstruction DNA
On Schedule:Projects Delivered on Time
With High Quality: Lower Maintenance Cost
On Budget: Margin Stability
Own Work Force
VerticalizationVerticalization
Standardized / Industrialization
� Economies of Scale
� All projects are based on few designs
Source: Company Report
11
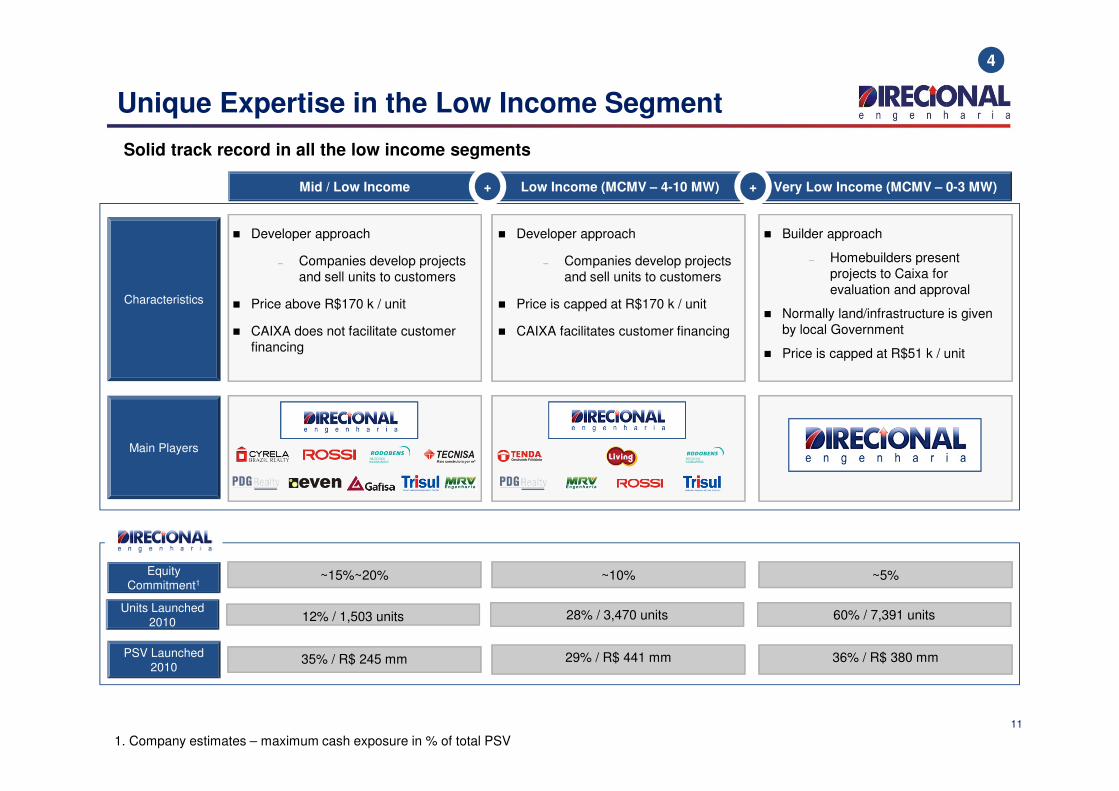
Unique Expertise in the Low Income Segment
1. Company estimates – maximum cash exposure in % of total PSV
Solid track record in all the low income segments
Characteristics
� Developer approach
Companies develop projects and sell units to customers
� Price above R$170 k / unit
� CAIXA does not facilitate customer financing
� Developer approach
Companies develop projects and sell units to customers
� Price is capped at R$170 k / unit
� CAIXA facilitates customer financing
� Builder approach
Homebuilders present projects to Caixa for evaluation and approval
� Normally land/infrastructure is given by local Government
� Price is capped at R$51 k / unit
Main Players
4
Equity Commitment1
Units Launched2010
~5%~15%~20% ~10%
60% / 7,391 units12% / 1,503 units 28% / 3,470 units
Mid / Low Income Low Income (MCMV – 4-10 MW) Very Low Income (MCMV – 0-3 MW)+ +
PSV Launched2010
36% / R$ 380 mm35% / R$ 245 mm 29% / R$ 441 mm
12
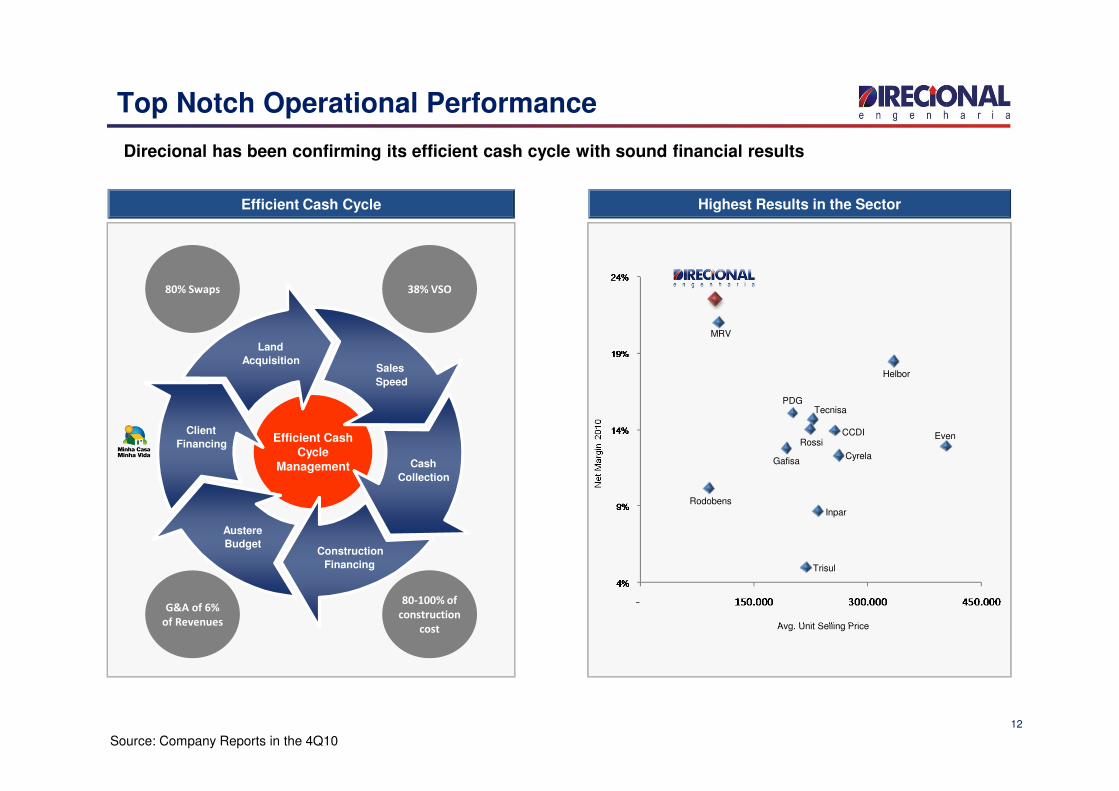
Top Notch Operational Performance
Direcional has been confirming its efficient cash cycle with sound financial results
Efficient Cash Cycle Highest Results in the Sector
Efficient CashCycle
Management
Land
AcquisitionSales
Speed
Cash
Collection
Austere
Budget
Client
Financing
Construction
Financing
Land
AcquisitionSales
Speed
Cash
Collection
Austere
Budget
Client
Financing
Construction
Financing
Avg. Unit Selling Price
Net
Mar
gin
2010
Source: Company Reports in the 4Q10
38% VSO
80-100% of
construction
cost
80% Swaps
G&A of 6%
of Revenues
MRV
CCDI
Rodobens
PDG
Even
Helbor
Inpar
Cyrela
Tecnisa
Rossi
Trisul
Gafisa
13
Growth Drivers
13
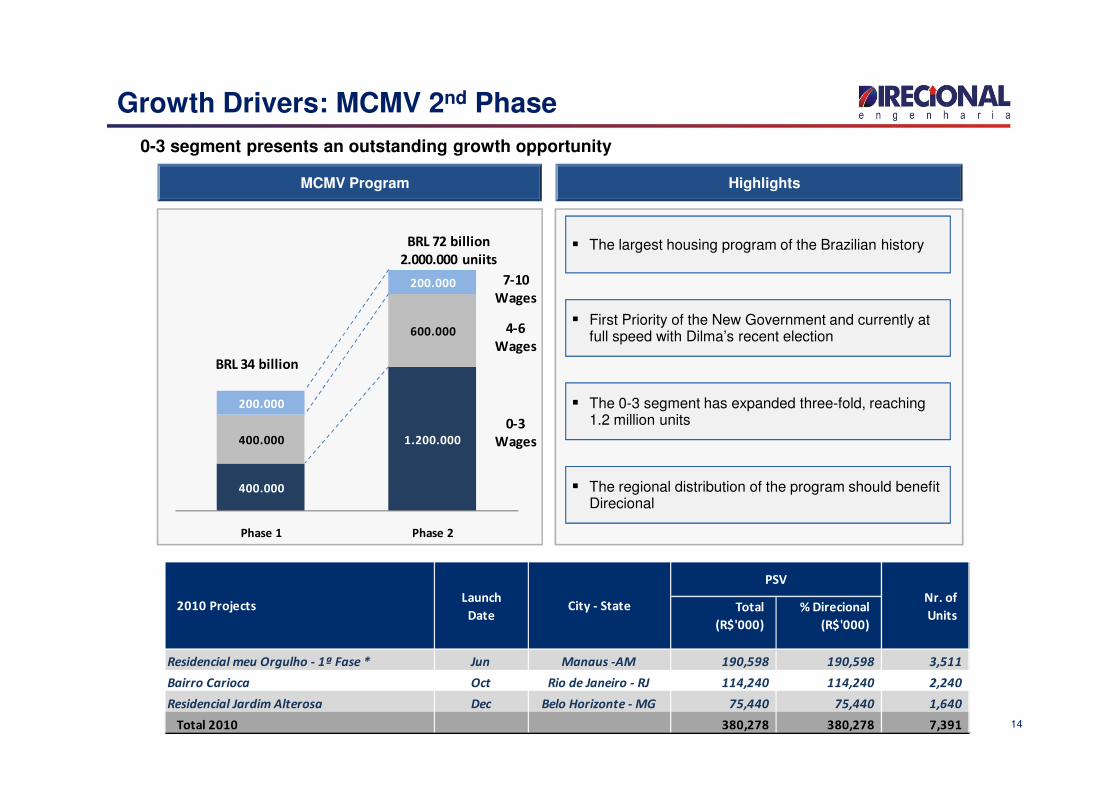
Total
(R$'000)
% Direcional
(R$'000)
Residencial meu Orgulho - 1ª Fase * Jun Manaus -AM 190,598 190,598 3,511
Bairro Carioca Oct Rio de Janeiro - RJ 114,240 114,240 2,240
Residencial Jardim Alterosa Dec Belo Horizonte - MG 75,440 75,440 1,640
Total 2010 380,278 380,278 7,391
2010 ProjectsLaunch
DateCity - State
PSV
Nr. of
Units
MCMV Program Highlights
� The largest housing program of the Brazilian history
� First Priority of the New Government and currently at full speed with Dilma’s recent election
� The 0-3 segment has expanded three-fold, reaching 1.2 million units
� The regional distribution of the program should benefit Direcional
400.000
1.200.000400.000
600.000
200.000
200.000
Phase 1 Phase 2
BRL 34 billion
BRL 72 billion
2.000.000 uniits
0-3
Wages
4-6
Wages
7-10
Wages
14
Growth Drivers: MCMV 2nd Phase
0-3 segment presents an outstanding growth opportunity
15
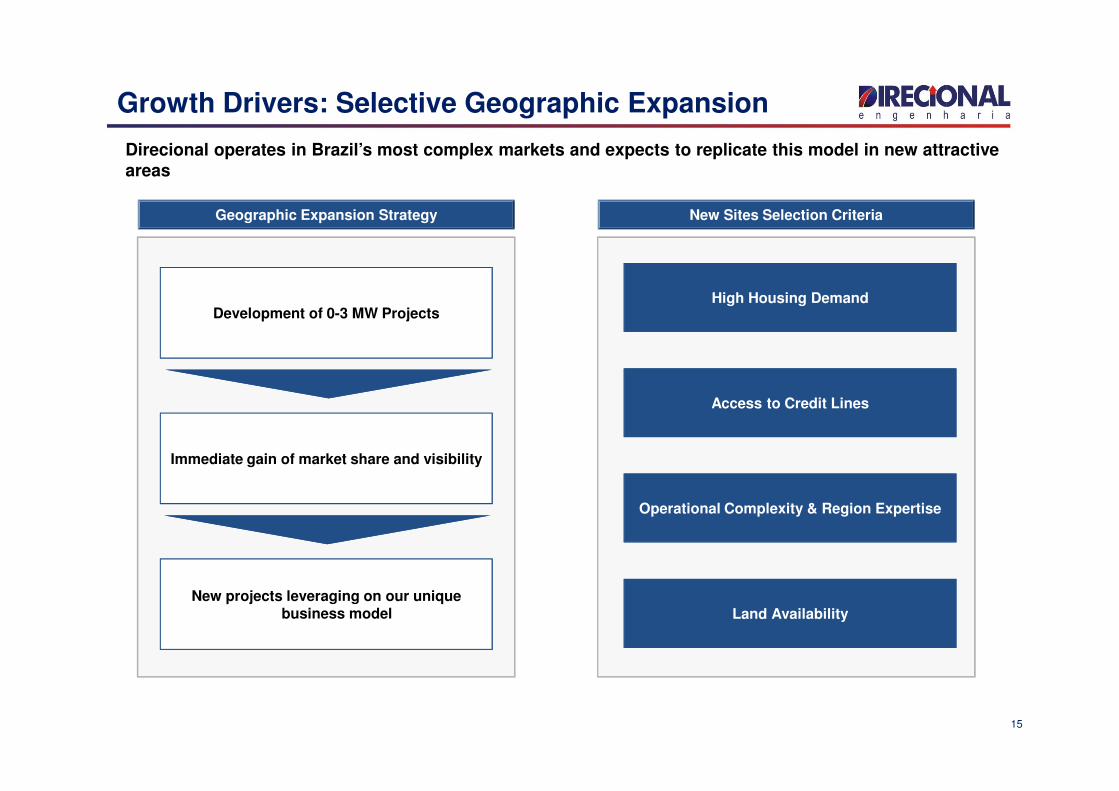
Growth Drivers: Selective Geographic Expansion
Direcional operates in Brazil’s most complex markets and expects to replicate this model in new attractive areas
Development of 0-3 MW Projects
Geographic Expansion Strategy
Immediate gain of market share and visibility
New projects leveraging on our unique business model
New Sites Selection Criteria
High Housing Demand
Access to Credit Lines
Operational Complexity & Region Expertise
Land Availability
16
Operating and Financials Highlights
2010 and 1Q11
16
17
Launches
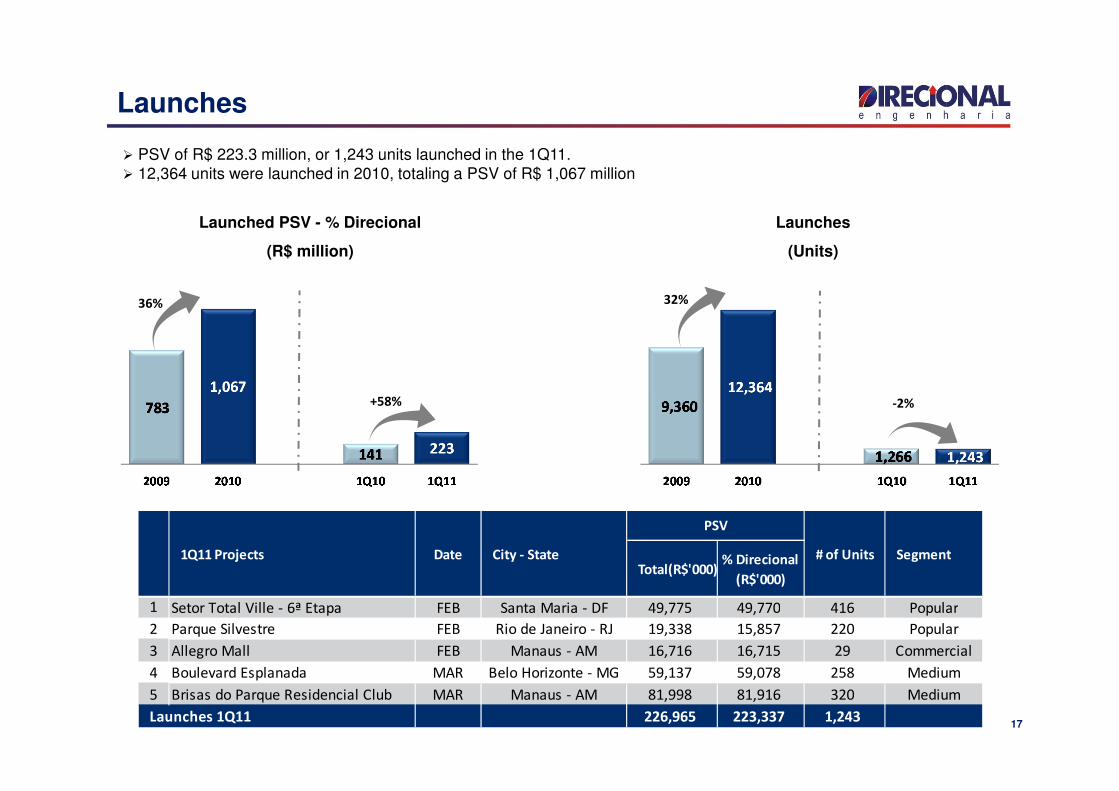
� PSV of R$ 223.3 million, or 1,243 units launched in the 1Q11.� 12,364 units were launched in 2010, totaling a PSV of R$ 1,067 million
Launched PSV - % Direcional
(R$ million)
Launches
(Units)
+58%
36%
-2%
32%
Total(R$'000)% Direcional
(R$'000)
1 Setor Total Ville - 6ª Etapa FEB Santa Maria - DF 49,775 49,770 416 Popular
2 Parque Silvestre FEB Rio de Janeiro - RJ 19,338 15,857 220 Popular
3 Allegro Mall FEB Manaus - AM 16,716 16,715 29 Commercial
4 Boulevard Esplanada MAR Belo Horizonte - MG 59,137 59,078 258 Medium
5 Brisas do Parque Residencial Club MAR Manaus - AM 81,998 81,916 320 Medium
Launches 1Q11 226,965 223,337 1,243
1Q11 Projects Date City - State Segment# of Units
PSV
18
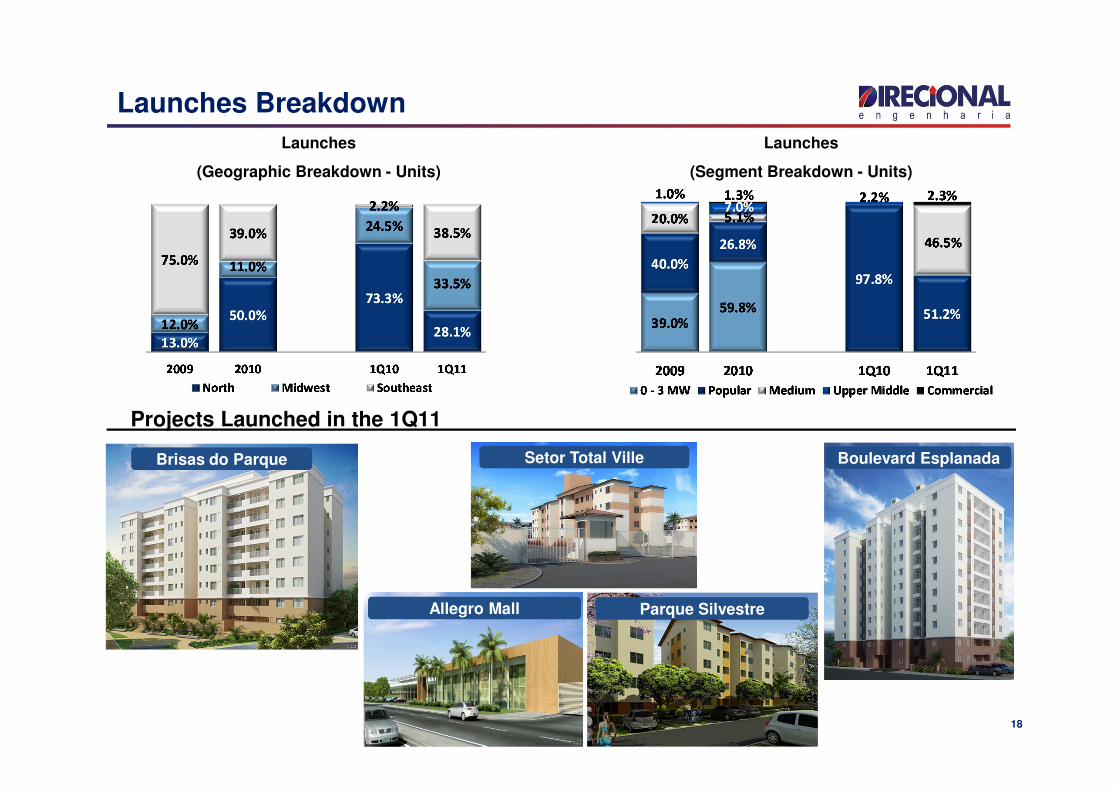
Launches Breakdown
Launches
(Segment Breakdown - Units)
Launches
(Geographic Breakdown - Units)
Boulevard EsplanadaSetor Total Ville
Parque Silvestre
Brisas do Parque
Allegro Mall
Projects Launched in the 1Q11 .
19
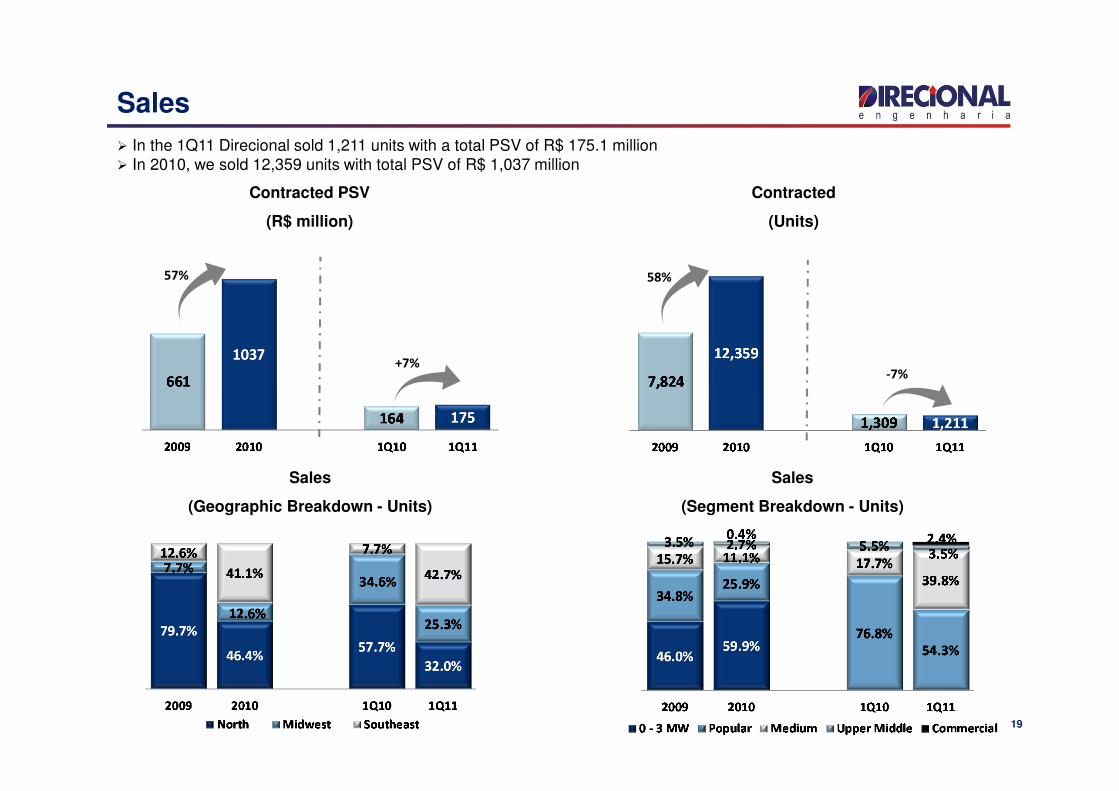
Sales
Contracted PSV
(R$ million)
Contracted
(Units)
Sales
(Geographic Breakdown - Units)
Sales
(Segment Breakdown - Units)
� In the 1Q11 Direcional sold 1,211 units with a total PSV of R$ 175.1 million� In 2010, we sold 12,359 units with total PSV of R$ 1,037 million
+7%
57%
-7%
58%
20
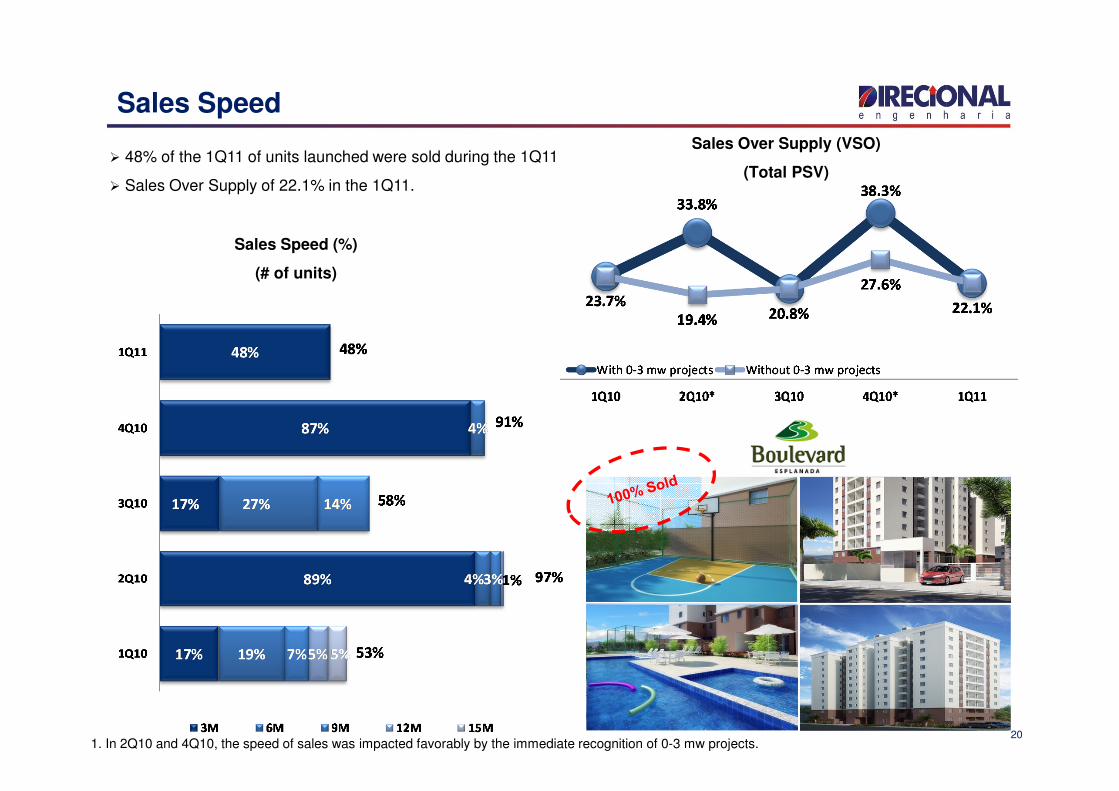
Sales Speed
� 48% of the 1Q11 of units launched were sold during the 1Q11
� Sales Over Supply of 22.1% in the 1Q11.
Sales Over Supply (VSO)
(Total PSV)
Sales Speed (%)
(# of units)
1. In 2Q10 and 4Q10, the speed of sales was impacted favorably by the immediate recognition of 0-3 mw projects.

Total % Direcional
Launches 1Q11 126,941 124,519 698 592 52.1%
Launches 4Q10 132,977 77,695 458 442 8.5%
Launches 3Q10 76,919 74,865 773 704 41.0%
Launches 2Q10 62,036 61,974 152 121 3.0%
Launches 1Q10 79,202 71,239 607 560 45.9%
Launches 4Q09 2,071 2,070 18 18 2.1%
Launches 3Q09 86,266 76,129 697 474 11.1%
Launches 2Q09 23,028 19,043 231 116 3.9%
Launches 1Q09 29,733 26,138 214 198 20.8%
Launches 4Q08 61,862 45,576 319 240 19.8%
Launches 3Q08 25,931 20,744 201 89 6.5%
Launches 2Q08 7,820 6,586 67 25 3.4%
Launches 1Q08 6,657 5,858 31 13 3.1%
Previous launches 6,151 3,058 39 13 2.8%
Under Construction 727,595 615,494 4,505 3,605 13.6%
Completed Units 42,467 20,096 224 199 3.8%
Total Inventory 770,062 635,590 4,729 3,804 11.9%
Inventory
PSV in Inventory (R$'000)Units in
Inventory
Units in
Inventory
(without swap)
% Units in
Inventory
21
Inventory
� PSV of R$ 636 million, or 3,804 units;� Inventory of completed units of R$ 20.1 million, or 199 units;� Projects under construction have an average of 86,4% units already sold.
Only 3.8% of completed units in the inventory
+107%
+64%
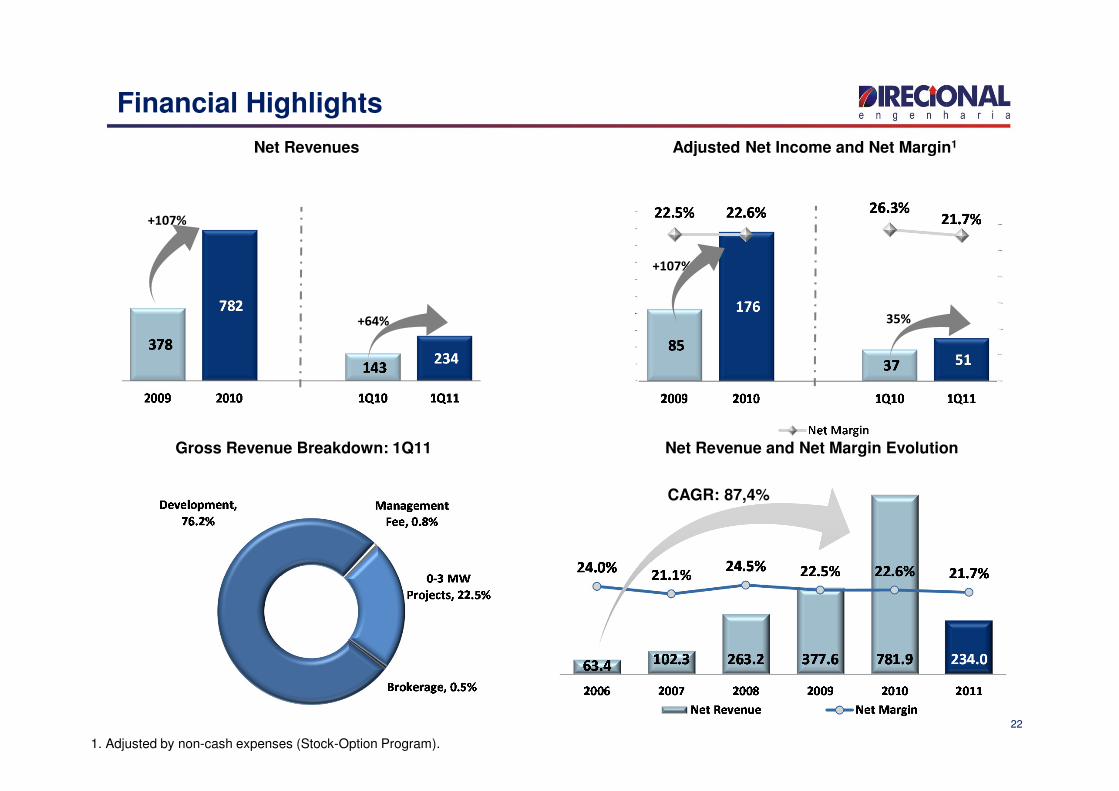
22
Financial Highlights
Adjusted Net Income and Net Margin1
1. Adjusted by non-cash expenses (Stock-Option Program).
Gross Revenue Breakdown: 1Q11
Net Revenues
+107%
35%
CAGR: 87,4%
Net Revenue and Net Margin Evolution
Revenue of Services Evolution
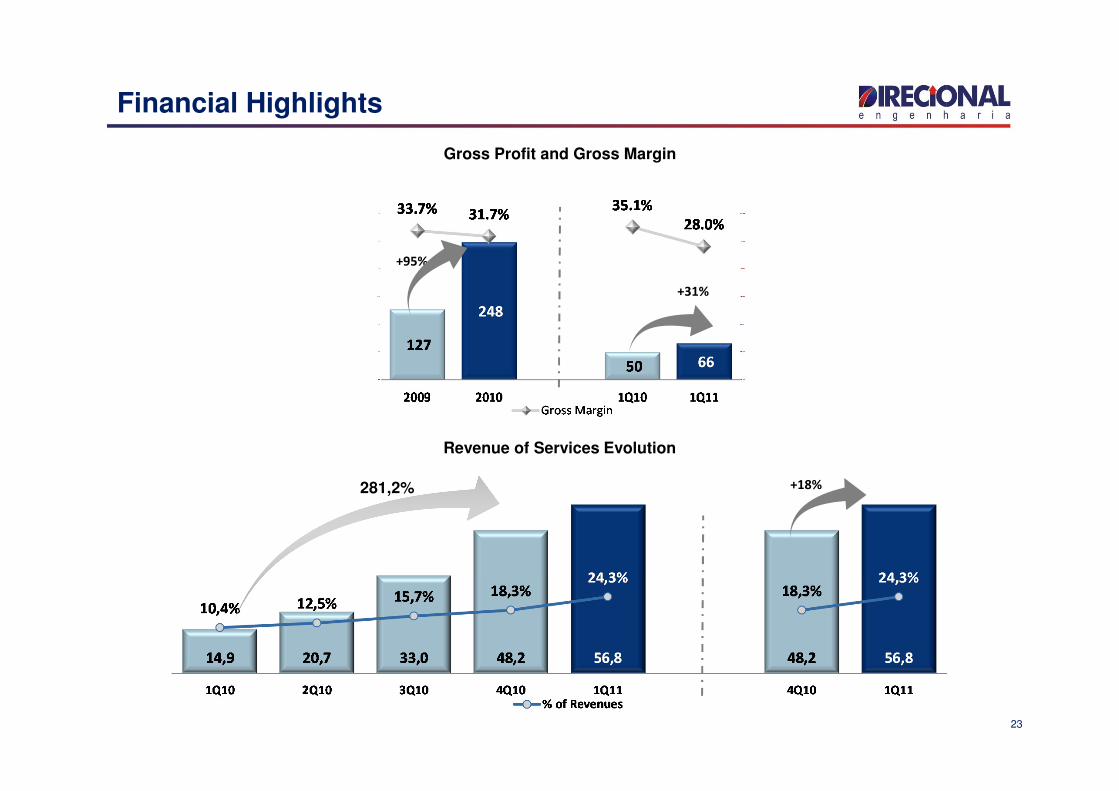
23
Financial Highlights
Gross Profit and Gross Margin
+95%
+31%
281,2% +18%
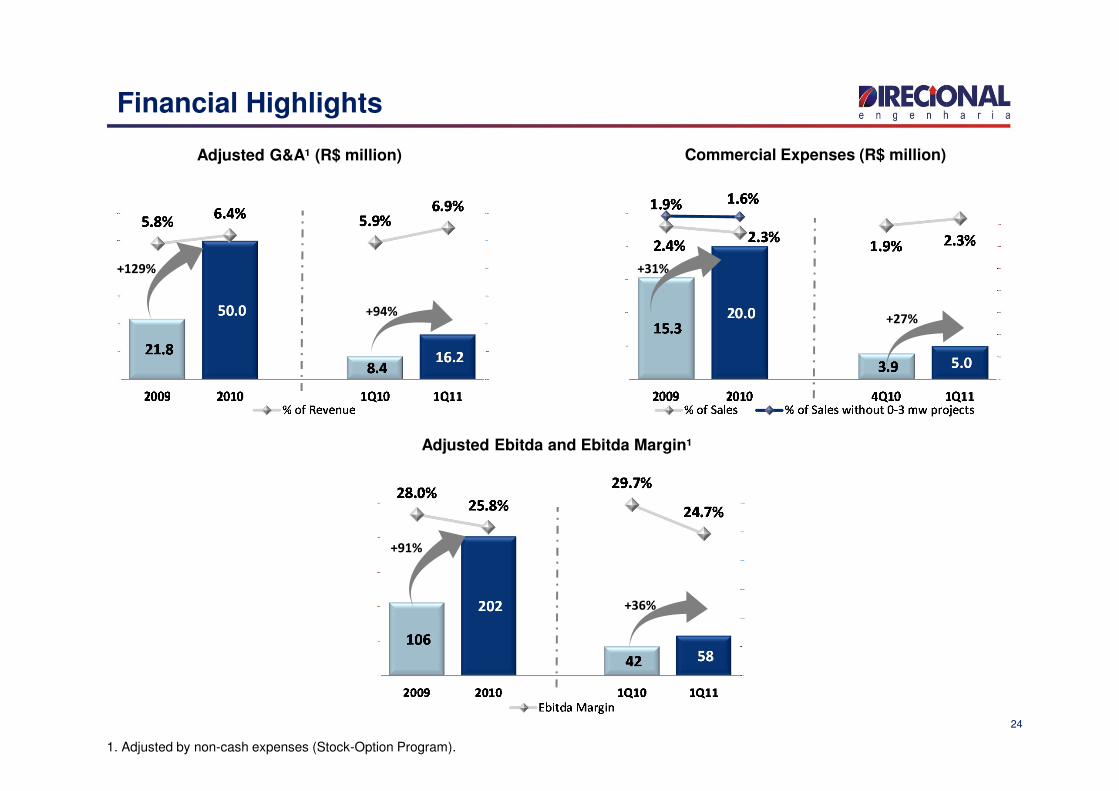
24
Financial Highlights
Adjusted Ebitda and Ebitda Margin¹
Adjusted G&A¹ (R$ million) Commercial Expenses (R$ million)
+129%
+94%
+31%
+27%
+91%
+36%
1. Adjusted by non-cash expenses (Stock-Option Program).
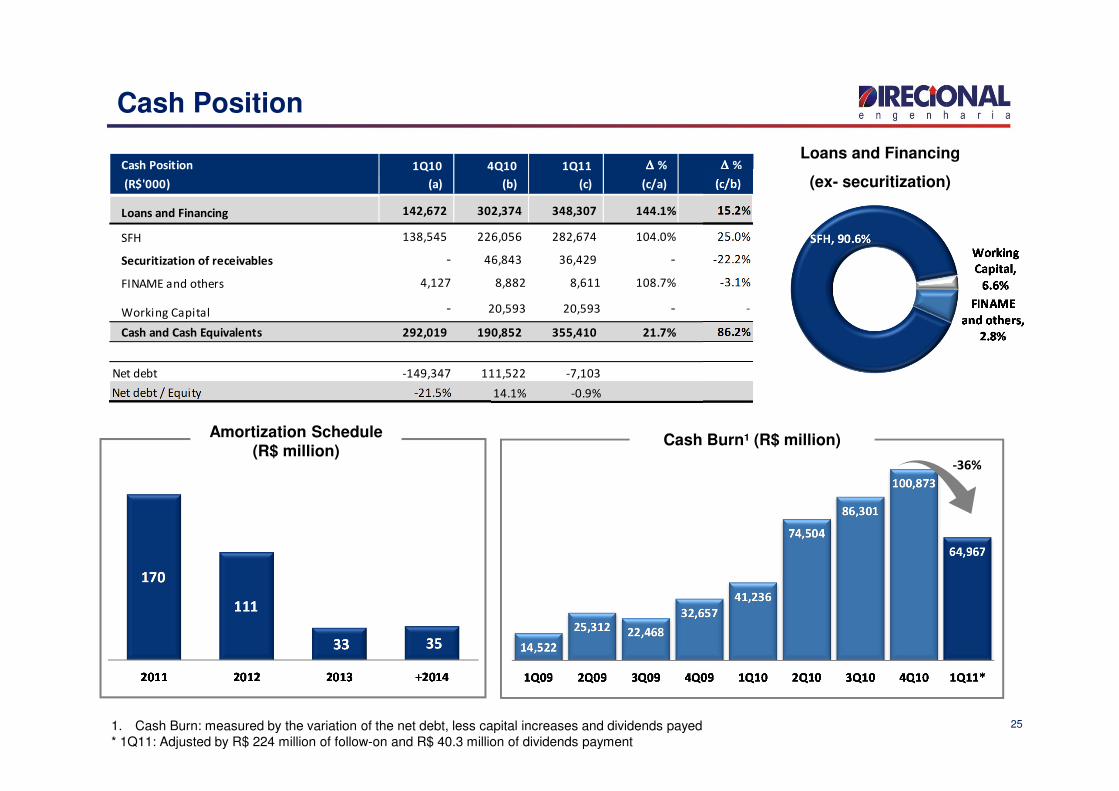
Cash Position 1Q10 4Q10 1Q11 ∆∆∆∆ % ∆∆∆∆ %
(R$'000) (a) (b) (c) (c/a) (c/b)
Loans and Financing 142,672 302,374 348,307 144.1% 15.2%
SFH 138,545 226,056 282,674 104.0% 25.0%
Securitization of receivables - 46,843 36,429 - -22.2%
FINAME and others 4,127 8,882 8,611 108.7% -3.1%
Working Capital - 20,593 20,593 - -
Cash and Cash Equivalents 292,019 190,852 355,410 21.7% 86.2%
Net debt -149,347 111,522 -7,103
Net debt / Equity -21.5% 14.1% -0.9%
1. Cash Burn: measured by the variation of the net debt, less capital increases and dividends payed* 1Q11: Adjusted by R$ 224 million of follow-on and R$ 40.3 million of dividends payment
25
Cash Position
Amortization Schedule (R$ million)
Cash Burn¹ (R$ million)
Loans and Financing
(ex- securitization)
-36%
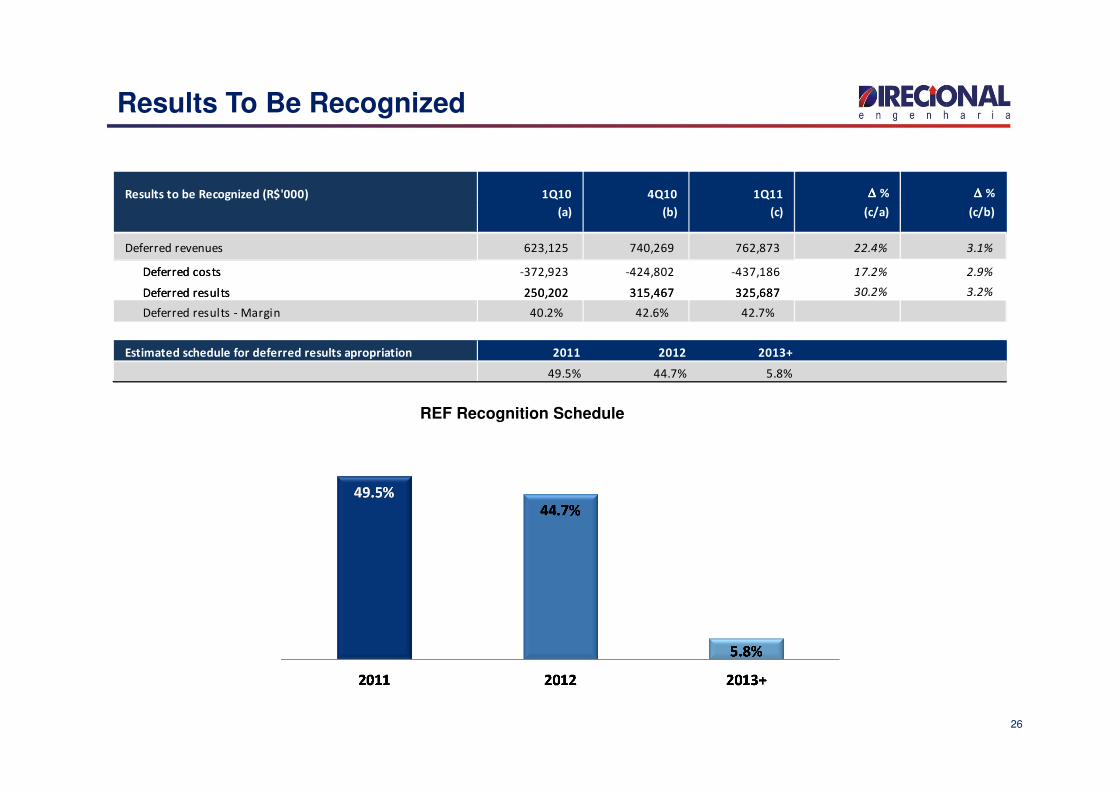
Results to be Recognized (R$'000) 1Q10 4Q10 1Q11 ∆∆∆∆ % ∆∆∆∆ %
(a) (b) (c) (c/a) (c/b)
Deferred revenues 623,125 740,269 762,873 22.4% 3.1%
Deferred costs -372,923 -424,802 -437,186 17.2% 2.9%
Deferred results 250,202 315,467 325,687 30.2% 3.2%
Deferred results - Margin 40.2% 42.6% 42.7%
Estimated schedule for deferred results apropriation 2011 2012 2013+
49.5% 44.7% 5.8%
26
Results To Be Recognized
REF Recognition Schedule
0
20
40
60
80
100
120
140
160
-
1,000
2,000
3,000
4,000
5,000
6,000
7,000
8,000
9,000
10,000
18
-No
v-0
9
1-D
ec-
09
11
-De
c-0
9
23
-De
c-0
9
8-J
an
-10
20
-Ja
n-1
0
2-F
eb
-10
12
-Fe
b-1
0
26
-Fe
b-1
0
10
-Ma
r-1
0
22
-Ma
r-1
0
1-A
pr-
10
14
-Ap
r-1
0
27
-Ap
r-1
0
7-M
ay-
10
19
-Ma
y-1
0
1-J
un
-10
15
-Ju
n-1
0
25
-Ju
n-1
0
7-J
ul-
10
21
-Ju
l-1
0
3-A
ug
-10
16
-Au
g-1
0
30
-Au
g-1
0
15
-Se
p-1
0
1-O
ct-1
0
14
-Oct
-10
26
-Oct
-10
8-N
ov-
10
23
-No
v-1
0
3-D
ec-
10
17
-De
c-1
0
30
-De
c-1
0
12
-Ja
n-1
1
24
-Ja
n-1
1
4-F
eb
-11
16
-Fe
b-1
1
28
-Fe
b-1
1
14
-Ma
r-1
1
24
-Ma
r-1
1
5-A
pr-
11
15
-Ap
r-1
1
29
-Ap
r-1
1
Pre
ço d
a A
ção
Vo
lum
e (
R$
mil
)
Volume (R$ '000)
0
20
40
60
80
100
120
140
160
-
1,000
2,000
3,000
4,000
5,000
6,000
7,000
8,000
9,000
10,000
18
-No
v-0
9
1-D
ec-
09
11
-De
c-0
9
23
-De
c-0
9
8-J
an
-10
20
-Ja
n-1
0
2-F
eb
-10
12
-Fe
b-1
0
26
-Fe
b-1
0
10
-Ma
r-1
0
22
-Ma
r-1
0
1-A
pr-
10
14
-Ap
r-1
0
27
-Ap
r-1
0
7-M
ay-
10
19
-Ma
y-1
0
1-J
un
-10
15
-Ju
n-1
0
25
-Ju
n-1
0
7-J
ul-
10
21
-Ju
l-1
0
3-A
ug
-10
16
-Au
g-1
0
30
-Au
g-1
0
15
-Se
p-1
0
1-O
ct-1
0
14
-Oct
-10
26
-Oct
-10
8-N
ov-
10
23
-No
v-1
0
3-D
ec-
10
17
-De
c-1
0
30
-De
c-1
0
12
-Ja
n-1
1
24
-Ja
n-1
1
4-F
eb
-11
16
-Fe
b-1
1
28
-Fe
b-1
1
14
-Ma
r-1
1
24
-Ma
r-1
1
5-A
pr-
11
15
-Ap
r-1
1
29
-Ap
r-1
1
Sto
ck P
rice
Vo
lum
e (
R$
'00
0)
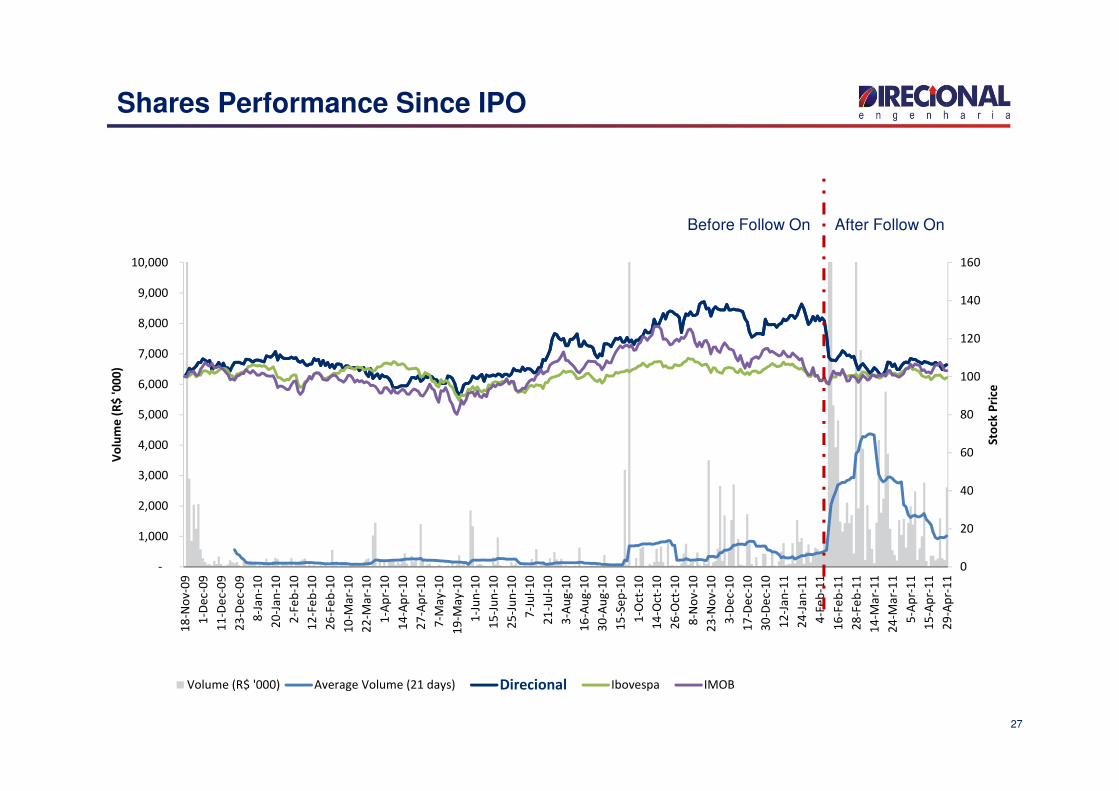
Average Volume (21 days) Direcional Ibovespa IMOB
27
Shares Performance Since IPO
Before Follow On After Follow On
28
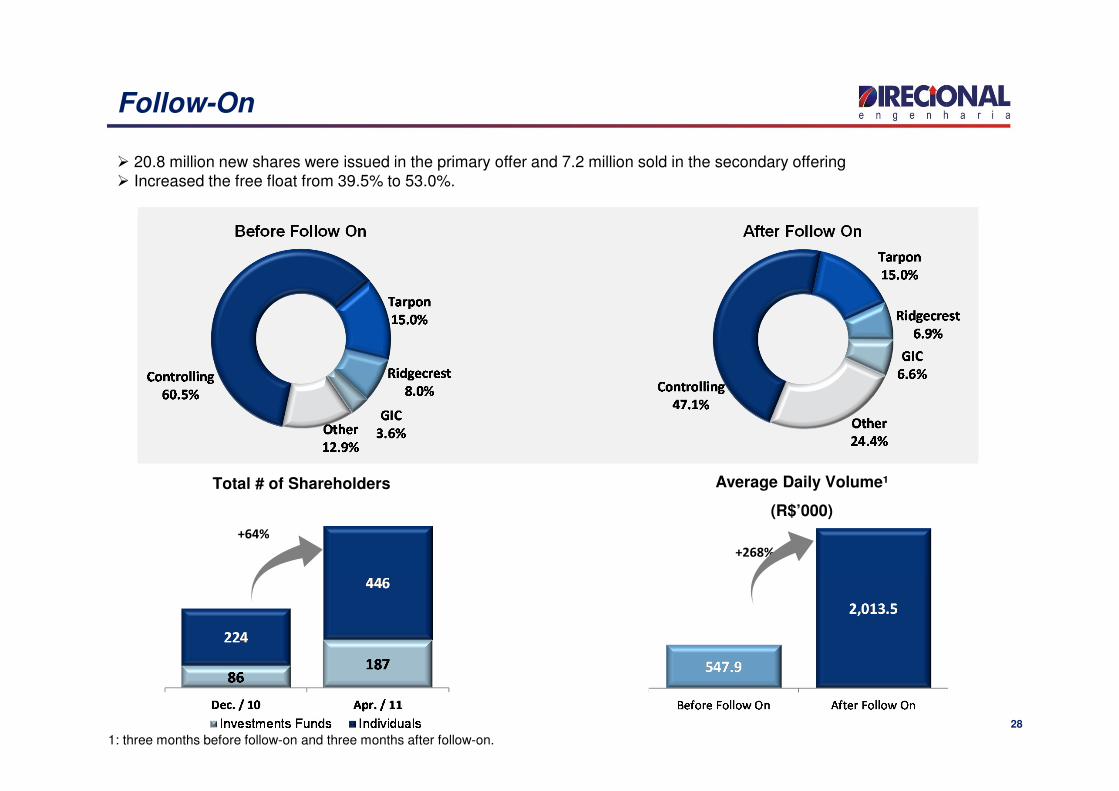
Follow-On
� 20.8 million new shares were issued in the primary offer and 7.2 million sold in the secondary offering� Increased the free float from 39.5% to 53.0%.
Before Follow On After Follow On
Average Daily Volume¹
(R$’000)
+268%
+64%
Total # of Shareholders
1: three months before follow-on and three months after follow-on.
29
Appendix
29
5.7%
3%
5%
7%
9%
11%
13%
15%
Jan-04 Aug-05 Apr-07 Nov-08 Jul-10
30
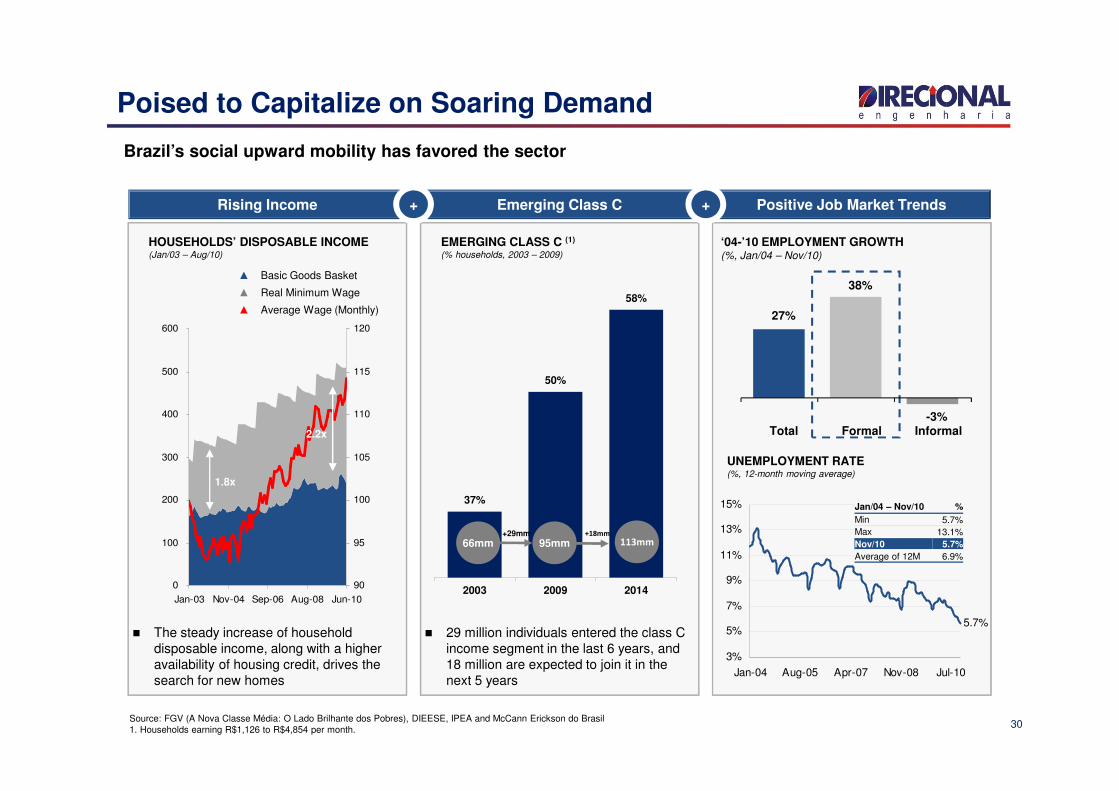
Rising Income
� The steady increase of household disposable income, along with a higher availability of housing credit, drives the search for new homes
▲ Basic Goods Basket
▲ Real Minimum Wage
▲ Average Wage (Monthly)
HOUSEHOLDS’ DISPOSABLE INCOME (Jan/03 – Aug/10)
Emerging Class C
� 29 million individuals entered the class C income segment in the last 6 years, and 18 million are expected to join it in the next 5 years
EMERGING CLASS C (1)
(% households, 2003 – 2009)
Positive Job Market Trends
Poised to Capitalize on Soaring Demand
Source: FGV (A Nova Classe Média: O Lado Brilhante dos Pobres), DIEESE, IPEA and McCann Erickson do Brasil1. Households earning R$1,126 to R$4,854 per month.
+ +
Brazil’s social upward mobility has favored the sector
0
100
200
300
400
500
600
Jan-03 Nov-04 Sep-06 Aug-08 Jun-10
90
95
100
105
110
115
120
2.2x
1.8x
Jan/04 – Nov/10 %
Min 5.7%Max 13.1%Nov/10 5.7%
Average of 12M 6.9%
UNEMPLOYMENT RATE(%, 12-month moving average)
‘04-’10 EMPLOYMENT GROWTH(%, Jan/04 – Nov/10)
37%
50%
58%
2003 2009 2014
66mm 95mm+29mm
113mm+18mm
27%
38%
-3%Total Formal Informal
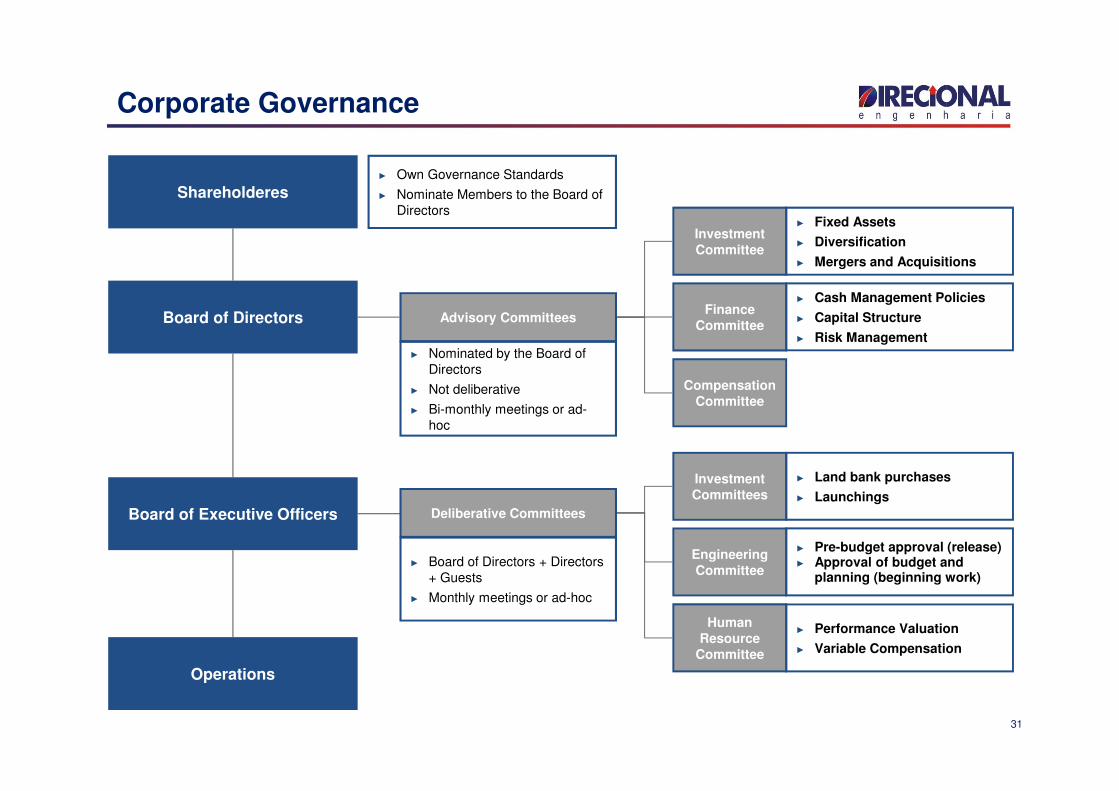
Corporate Governance
Board of Directors
Board of Executive Officers
Operations
Shareholderes► Own Governance Standards
► Nominate Members to the Board of Directors
Advisory Committees
► Nominated by the Board of Directors
► Not deliberative
► Bi-monthly meetings or ad-hoc
Deliberative Committees
► Board of Directors + Directors + Guests
► Monthly meetings or ad-hoc
Investment Committee
Finance Committee
Compensation Committee
► Fixed Assets
► Diversification
► Mergers and Acquisitions
► Cash Management Policies
► Capital Structure
► Risk Management
Investment Committees
Engineering Committee
Human Resource
Committee
► Land bank purchases
► Launchings
► Pre-budget approval (release)► Approval of budget and
planning (beginning work)
► Performance Valuation
► Variable Compensation
31
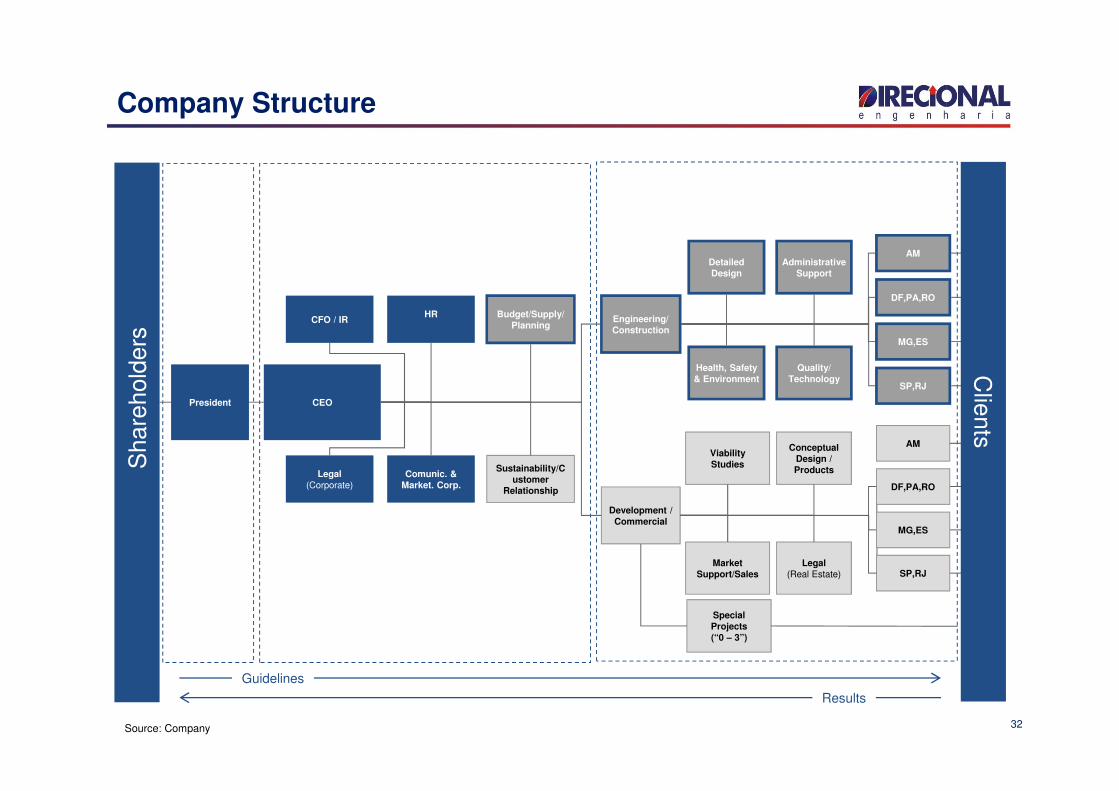
32
Company Structure
Source: Company
Engineering/Construction
Development / Commercial
Detailed Design
Health, Safety & Environment
Viability Studies
Market Support/Sales
AdministrativeSupport
Quality/Technology
Conceptual Design /Products
Legal (Real Estate)
AM
DF,PA,RO
MG,ES
SP,RJ
AM
Special Projects (“0 – 3”)
President CEO
CFO / IR
Legal(Corporate)
HR
Comunic. & Market. Corp.
Budget/Supply/Planning
Sustainability/Customer
Relationship
Guidelines
Results
Sha
reho
lder
s
MG,ES
DF,PA,RO
SP,RJ
Clients
33
Contacts
Carlos WollenweberCFO | IR Officer
Lucas BousasIR Analyst
Paulo SousaIR Assistant
www.direcional.com.br
(55 31) 3214-6200
(55 31) 3214-6450