Embed Size (px)
Citation preview
PRIVATE WATER INSIGHT SERVICE GREENFIELD + WATER = BLUEFIELD
FOCUS REPORT
Private Water U2li2es: Global Rankings & Company Strategies July 2015
Water Pressure // Flickr // Cropped // Hans Splinter // CC BY-ND 2.0
PRIVATE WATER INSIGHT SERVICE
MARKET INSIGHT Private Water U2li2es: Global Rankings & Company Strategies ANALYST PRESENTATION
About This Focus Report
2
Private Water Utilities: Global Rankings & Company Strategies Publication Date: July 2015 Key Report Takeaways:
1. The 65 major companies profiled in the report supply more than 20 billion cubic meters of drinking water annually, generating over US$53 billion in revenue.
2. Movers among the top five largest groups globally were Suez surpassing Veolia for the top ranking and Thames Water overtaking American Water in the 4th position.
3. Emerging market utilities’ large urban service areas place them for growth, entering the rankings by population served.
4. France, the UK, USA, and Brazil host the largest private water utility markets. The USA, Brazil, Chile, Italy, and Spain topping Bluefield's 2015 market attractiveness ranking.
Bluefield’s 110-page report is designed to support companies addressing opportunities for participation in water utilities globally with in-depth analysis, detailed company data, and multi-metric business ranking with a transparent methodology.
PRIVATE WATER INSIGHT SERVICE
MARKET INSIGHT Private Water U2li2es: Global Rankings & Company Strategies ANALYST PRESENTATION
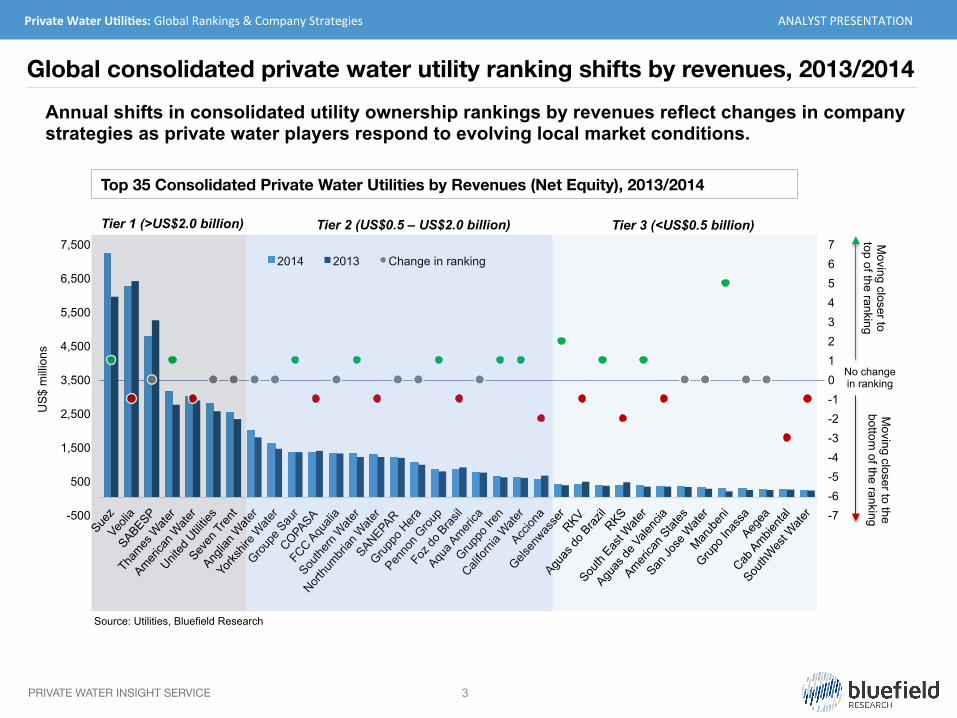
Top 35 Consolidated Private Water Utilities by Revenues (Net Equity), 2013/2014
3
Global consolidated private water utility ranking shifts by revenues, 2013/2014
-7 -6 -5 -4 -3 -2 -1 0 1 2 3 4 5 6 7
-500
500
1,500
2,500
3,500
4,500
5,500
6,500
7,500
US
$ m
illio
ns
2014 2013 Change in ranking
Source: Utilities, Bluefield Research
Tier 1 (>US$2.0 billion) Tier 2 (US$0.5 – US$2.0 billion) Tier 3 (<US$0.5 billion)
Moving closer to
top of the ranking M
oving closer to the bottom
of the ranking
No change in ranking
Annual shifts in consolidated utility ownership rankings by revenues reflect changes in company strategies as private water players respond to evolving local market conditions.
PRIVATE WATER INSIGHT SERVICE
MARKET INSIGHT Private Water U2li2es: Global Rankings & Company Strategies ANALYST PRESENTATION
Source: Utilities, Bluefield Research
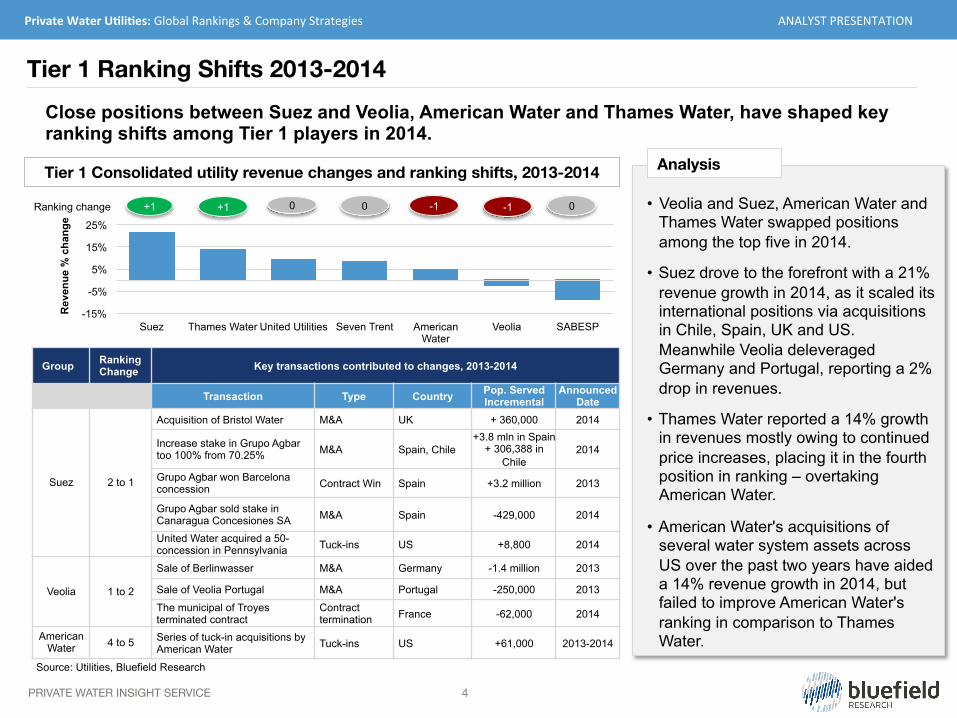
Tier 1 Consolidated utility revenue changes and ranking shifts, 2013-2014
Close positions between Suez and Veolia, American Water and Thames Water, have shaped key ranking shifts among Tier 1 players in 2014.
4
Tier 1 Ranking Shifts 2013-2014
• Veolia and Suez, American Water and
Thames Water swapped positions among the top five in 2014.
• Suez drove to the forefront with a 21% revenue growth in 2014, as it scaled its international positions via acquisitions in Chile, Spain, UK and US. Meanwhile Veolia deleveraged Germany and Portugal, reporting a 2% drop in revenues.
• Thames Water reported a 14% growth in revenues mostly owing to continued price increases, placing it in the fourth position in ranking – overtaking American Water.
• American Water's acquisitions of several water system assets across US over the past two years have aided a 14% revenue growth in 2014, but failed to improve American Water's ranking in comparison to Thames Water.
Analysis
-15%
-5%
5%
15%
25%
Suez Thames Water United Utilities Seven Trent American Water
Veolia SABESP
Rev
enue
% c
hang
e
-1 Ranking change 0 +1 -1 0 0
Group Ranking Change Key transactions contributed to changes, 2013-2014
Transaction Type Country Pop. Served Incremental
Announced Date
Suez 2 to 1
Acquisition of Bristol Water M&A UK + 360,000 2014
Increase stake in Grupo Agbar too 100% from 70.25% M&A Spain, Chile
+3.8 mln in Spain + 306,388 in
Chile 2014
Grupo Agbar won Barcelona concession Contract Win Spain +3.2 million 2013
Grupo Agbar sold stake in Canaragua Concesiones SA M&A Spain -429,000 2014
United Water acquired a 50-concession in Pennsylvania Tuck-ins US +8,800 2014
Veolia 1 to 2
Sale of Berlinwasser M&A Germany -1.4 million 2013
Sale of Veolia Portugal M&A Portugal -250,000 2013
The municipal of Troyes terminated contract
Contract termination France -62,000 2014
American Water 4 to 5 Series of tuck-in acquisitions by
American Water Tuck-ins US +61,000 2013-2014
+1
PRIVATE WATER INSIGHT SERVICE
MARKET INSIGHT Private Water U2li2es: Global Rankings & Company Strategies ANALYST PRESENTATION
Source: Utilities, Bluefield Research
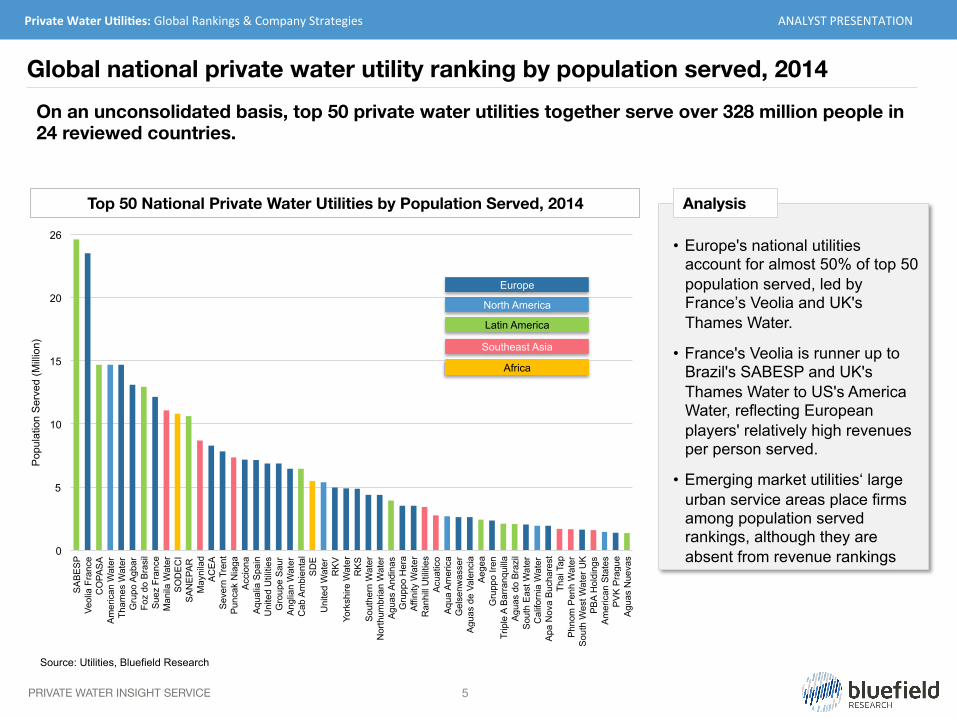
On an unconsolidated basis, top 50 private water utilities together serve over 328 million people in 24 reviewed countries.
Global national private water utility ranking by population served, 2014
5
0
5
10
15
20
26
SA
BE
SP
Veol
ia F
ranc
e C
OPA
SA
Am
eric
an W
ater
Th
ames
Wat
er
Gru
po A
gbar
Fo
z do
Bra
sil
Sue
z Fr
ance
M
anila
Wat
er
SO
DE
CI
SA
NE
PAR
M
ayni
lad
AC
EA
Sev
ern
Tren
t P
unca
k N
iaga
A
ccio
na
Aqu
alia
Spa
in
Uni
ted
Util
ities
G
roup
e S
aur
Ang
lian
Wat
er
Cab
Am
bien
tal
SD
E
Uni
ted
Wat
er
RK
V
York
shire
Wat
er
RK
S
Sou
ther
n W
ater
N
orth
umbr
ian
Wat
er
Agu
as A
ndin
as
Gru
ppo
Her
a A
ffini
ty W
ater
R
anhi
ll U
tiliti
es
Acu
atic
o A
qua
Am
eric
a G
else
nwas
ser
Agu
as d
e Va
lenc
ia
Aeg
ea
Gru
ppo
Iren
Trip
le A
Bar
ranq
uilla
A
guas
do
Bra
zil
Sou
th E
ast W
ater
C
alifo
rnia
Wat
er
Apa
Nov
a B
ucha
rest
Th
ai T
ap
Phn
om P
enh
Wat
er
Sou
th W
est W
ater
UK
P
BA
Hol
ding
s A
mer
ican
Sta
tes
PV
K P
ragu
e A
guas
Nue
vas
Pop
ulat
ion
Ser
ved
(Mill
ion)
Top 50 National Private Water Utilities by Population Served, 2014
Europe
North America
Latin America
Southeast Asia
Africa
• Europe's national utilities
account for almost 50% of top 50 population served, led by France’s Veolia and UK's Thames Water.
• France's Veolia is runner up to Brazil's SABESP and UK's Thames Water to US's America Water, reflecting European players' relatively high revenues per person served.
• Emerging market utilities‘ large urban service areas place firms among population served rankings, although they are absent from revenue rankings
Analysis

PRIVATE WATER INSIGHT SERVICE
MARKET INSIGHT Private Water U2li2es: Global Rankings & Company Strategies ANALYST PRESENTATION
6
Chile: Early-privatizing market, key regional entry point for European (Agbar), Japanese players (Marubeni)
The private water utility model is concentrated in four regions led by Europe, followed by Latin America, with an increasing level of private participation in Southeast Asia.
Brazil: Rapidly scaling private concession model led by Odebrecht Ambiental, Àguas do Brasil, Aegea
Central/Southern Europe: France, Spain hub for global leaders Veolia, Suez, Aqualia – trend towards increased municipalization
Eastern Europe: Select cities within EU licensed concessions (Prague, Ostrava, Bucharest, Gdansk)
Private Water Utility Model – Global Footprint Overview
England: Host of largest group of private utilities through monopoly market structure
Malaysia: Concession restructure solidifies position of Ranhill, PBA Holdings
Thailand: Bulk water supply concessions deliver scale to Thai Tap, Eastern Water Philippines: Manila private
concessions builds regional player Manila Water Co.
Western Africa: France’s Eranove holds beachhead positions in Senegal, Ivory Coast
USA: Led by American Water, six players account for over half the
investor-owned utility market
Mature (>20% Private)
Scaling (10-20% Private)
Nascent (<10% Private)
Colombia: EPM, Inassa scaling as domestic leaders expanding regionally
Indonesia: Acuatico positioned with major concessions in select provinces
Russia: Rosvodokanal, RKS, building concession portfolios
Source: Bluefield Research

PRIVATE WATER INSIGHT SERVICE
MARKET INSIGHT Private Water U2li2es: Global Rankings & Company Strategies ANALYST PRESENTATION
7
PRIVATE WATER: STRATEGIES & OPPORTUNITIES IN WATER ASSET OWNERSHIP & OPERATION INSIGHT SERVICE
CLIENT FOCUS: The Private Water Insight Service is designed for companies that need to track market trends, competitive shifts, and unique opportunities in private water asset ownership, including:
• Municipal water and wastewater operators with concessions/O&M contracts
• Independent water (and power) providers • Water infrastructure investors seeking to scale asset portfolios • Water service providers seeking new industrial wastewater
opportunities • Water technology providers targeting private water asset owners
RESEARCH COVERAGE: a 12-month cycle of data- and analytics-driven research provided in multiple formats to support client strategies, covering:
• Market environment attractiveness for private asset ownership • Historical trends and upcoming private sector opportunities for
concessions, PPPs, DBO, BOO, BOT, other contract types • Private water asset portfolio rankings in terms of equity ownership,
total revenues, connections, population served, location, project type • Player segmentation and expansion strategy analysis including entry
into emerging markets, vertical integration, and service/segment diversification initiatives
METRICS: primary research and analysis is supported by proprietary market, project and company databases updated continuously:
• Private water asset portfolio database (water, wastewater, desalination/concession, PPP, DBO, etc.)
• Comparative data driving private water valuations: tariffs, NRW, connections, volume, cost structures
• M&A transaction database tracking water asset deals • Country-specific private water sector data (PPPs, infrastructure
spending, private ownership penetration, tariffs)
Insight Service Description
SELECT LIST OF COMPANIES COVERED:
PRIVATE WATER SEGMENTS COVERED:
Ownership Structures
Valuation Drivers
M&A Activity
Regulatory Drivers Rankings
MARKET SEGMENTS COVERED:
Regional Analysis • Asia Pacific • China • Europe • Latin America • MENA • North America • Sub-Saharan Africa
Water Treatment
Desalination
Utility Concessions
Independent Water
Producers
Independent Water & Power
Producers
Wastewater Treatment
Water Reuse

PRIVATE WATER INSIGHT SERVICE
Private Water U2li2es: Global Rankings & Company Strategies ANALYST PRESENTATION
© 2015 BLUEFIELD RESEARCH, LLC.
Global companies across the value chain are developing strategies to capitalize on greenfield opportunities in water– new build, new business models, and private investment. Bluefield Research supports a growing roster of companies across key technology segments and industry verticals addressing risks and opportunities in the new water landscape. Companies are turning to Bluefield for in-depth, actionable intelligence into the water sector and the sector's impacts on key industries. The insights draw on primary research from the water, energy, power, mining, agriculture, financial sectors, and their respective supply chains. Bluefield works with key decision-makers at utilities, project development companies, independent water and power providers, EPC companies, technology suppliers, manufacturers, and investment firms. Bluefield’s services gives these companies tools to define and execute strategies.
Contact Bluefield Research
NORTH AMERICA 34 Farnsworth St // Floor 3 Boston, MA 02210 T +1 617 910 2540 EUROPE C/ de Santa Eulàlia 5-9 // 3a
08012 Barcelona Spain T +34 673 408 963 [email protected] www.bluefieldresearch.com
About Bluefield Research
PRIVATE WATER INSIGHT SERVICE GREENFIELD + WATER = BLUEFIELD