Embed Size (px)
Citation preview

APRIL 2013
PROMOTING PROSPERITY IN NORTHWEST ILLINOIS Regional Focus, Regional Results
IN PARTNERSHIP WITH
Outreach, Engagement, and Information Technologies
N O R T H E R N I L L I N O I S U N I V E R S I T Y
Center forGovernmental Studies


NIU Center for Governmental Studies
Brian Harger,
Melissa Henriksen,
Norman Walzer, and
Andy Blanke
PROMOTING PROSPERITY IN NORTHWEST ILLINOIS Regional Focus, Regional Results

ii NIU Center for Governmental Studies
Promoting Regional Prosperity in Northwest Illinois
Acknowledgements
This report represents a year-long collaboration among economic development and business leaders in Carroll, Lee, Ogle, Stephenson, and Whiteside counties to identify potential economic development strategies and projects. The findings are based on personal interviews with business leaders, electronic surveys of businesses regarding compensation issues, and phone interviews of residents about status and availability for employment changes. Considerable attention was paid to workforce characteristics and whether population changes will challenge the ability of employers to hire workers in the future. All of the information collected contributed to understanding the ways in which the region can position itself to start, retain, and attract businesses.
The authors thank the project advisory committee, including John Gvozdjak, Sandy Henrekin, Everett Pannier, Heather Sotelo, Betty Steinert, John Thompson, and Dave Young, who provided insights and kept the project on track. Theresa Wittenauer, Black Hills Regional Council, worked with the project advisory committee throughout the project and will incorporate the findings into the next CEDS update.
Two regional meetings were held with manufacturers and resource providers to identify the current and future skills, training, and education needed to create a competitive workforce. In addition, the meetings identified ways in which providers such as Sauk Valley Community College and Highland Community College could work with the Whiteside Area Career Center, CareerTech, and other regional higher education and training facilities to upgrade the capacity of the workforce in advanced manufacturing. The time and effort spent by businesses and resource providers in these discussions are invaluable and their contributions are appreciated.
Finally, this project was possible only with financial support from the U.S. Economic Development Administration, the Whiteside County Economic Development and Enterprise Zone, and the Northwest Illinois Development Alliance. In addition, many hours of donated time by the business community and others represented local match for the project. This investment was essential to the success of the project.
This report describes a path for the five counties to follow to revitalize the Region. The NIU Center for Governmental Studies team thanks everyone who participated in the overall effort. As always, any comments and/or interpretations in this report belong solely to the authors.
Produced by:
CENTER FOR GOVERNMENTAL STUDIES 148 N. THIRD STREET DEKALB, IL 60115 815-753-0914 WWW.NIUCGS.ORG
The findings and conclusions presented in this report are those of the NIU project team alone and do not necessarily reflect the views, opinions, or policies of the officers and/or trustees of Northern Illinois University.
First printing: April 2013
Outreach, Engagement, and Information Technologies
N O R T H E R N I L L I N O I S U N I V E R S I T Y
Center forGovernmental Studies

NIU Center for Governmental Studies iii
Promoting Regional Prosperity in Northwest Illinois
Table of Contents
Contents
Project Overview ............................................................................................................................................ 4
Methodology .............................................................................................................................................. 4
Framing the Issues ....................................................................................................................................5
Mapping Regional Assets ..........................................................................................................................5
Brainpower, 21st Century Talent ..........................................................................................................7
Innovation, Entrepreneurship Networks .............................................................................................7
Quality, Connected Places .....................................................................................................................7
New Narratives ......................................................................................................................................7
Geographic Scope ..................................................................................................................................... 8
Five-county Wage and Benefit Survey and Report .................................................................................. 8
Underemployment Survey and Report .................................................................................................... 8
Cluster Analysis ........................................................................................................................................ 9
Shift-Share Analysis ............................................................................................................................12
Description of Targeted Industry Clusters ......................................................................................... 13
Regional Overview ........................................................................................................................................15
Population Trends ....................................................................................................................................15
Employment Trends ................................................................................................................................. 17
Industry Employment Characteristics ....................................................................................................18
Occupational Employment Characteristics ........................................................................................... 20
Educational Characteristics .....................................................................................................................23
Workforce Commuter Trends ................................................................................................................. 24
Business Vitality Trends ......................................................................................................................... 24
Site Location Factors ............................................................................................................................... 28
Industry Cluster Profiles ..............................................................................................................................31
Industry Cluster Profile: Machinery Manufacturing .............................................................................31
Industry Cluster Profile: Fabricated Metal Products Manufacturing .................................................. 40
Industry Cluster Profile: Agribusiness, Food Processing, and Technology ......................................... 49
Industry Cluster Profile: Transportation Equipment Manufacturing ................................................. 60
Industry Cluster Profile: Transportation and Logistics ........................................................................ 70
Goals, Strategies, and Recommendations .................................................................................................. 80
Regional Vision ........................................................................................................................................ 80
Regional Goals ......................................................................................................................................... 80
Appendix: Major Themes Identified by Regional Manufacturers and Resource Providers .................... 98
Five-County Wage and Benefit Report .................................................................................................... TAB
Northwest Illinois Area Labor Availability Report ................................................................................. TAB


NIU Center for Governmental Studies 1
Promoting Regional Prosperity in Northwest Illinois
Executive Summary
EXECUTIVE SUMMARYFive counties in northwest Illinois—Carroll, Lee, Ogle, Stephenson, and Whiteside, referred to as the Region—engaged the Center for Governmental Studies (CGS) at Northern Illinois University (NIU) to explore how local economic, community, and business leaders can better promote business starts as well as expansion, attraction, and retention in the five-county region. This locally driven project is funded by the U.S. Economic Development Administration (EDA) and coordinated by the following:
» Whiteside County Economic Development and Enterprise Zone (serving Whiteside and Carroll counties)
» Northwest Illinois Development Alliance
» Rock Falls Community Development Corporation
» Greater Sterling Development Corporation
» Lee County Industrial Development Association
» Black Hawk Hills Regional Council
CGS helped create a regional advisory committee including an economic development representative from each coordinating organization and business leaders from the Region. The advisory committee held quarterly meetings to discuss the regional needs and the progress of the project.
Northwest Illinois’ traditional economic strengths are in agriculture and manufacturing. Despite the recent recession and long-term trends which have reduced employment in these sectors, they still account for approximately 39.0% of regional Gross Domestic Product (GDP) and 19.0% of regional employment. In comparison to other sectors, manufacturing jobs are among the highest paying in the Region, providing substantial support to other sectors of the economy in terms of consumer spending and local tax base. In addition, the Region has a strong competitive advantage in several related agricultural and manufacturing clusters based on a combination of industrial infrastructure and expertise, skilled workers, and access to suppliers and end-user markets.
The Region will face considerable challenges in its efforts to support the economic expansion. These include a below average rate of new business formation, chronic underemployment (as well as unemployment), and a looming demand for skilled workers to replace an expected wave of retiring Baby Boomers. Furthermore, the nature of industry is changing as companies incorporate new and more complex technologies into production processes which require a higher level of worker skill and training than ever before. In light of this situation, more innovative economic development strategies will be necessary to meet these challenges and to promote sustainable growth.
Previous studies of the Region, as well as past Comprehensive Economic Development Strategy (CEDS) documents, were reviewed to determine the additional research needed to build a sound base for development planning. CGS then organized an update of a past regional wage and benefit study and further regional analyses of the labor force by doing the following:
» Conducting personal interviews with 12 business leaders in the Region;
» Helping to organize two regional meetings with more than 75 representatives from manufacturing businesses, Workforce Investment Boards (WIBs), and educational service providers in the Region;
» Surveying residents and businesses regarding regional employment, unemployment, underemployment, and skills gaps;
2 NIU Center for Governmental StudiesExecutive Summary
Promoting Regional Prosperity in Northwest Illinois
» Evaluating regional strengths and assets; and
» Identifying new and emerging industry clusters suited for the Region.
Based on the regional analysis and input from business leaders, the advisory committee agreed on a regional vision, five regional goals, regional action strategies, potential regional partners, and recommendations for moving forward. The goals listed below are described in detail in the body of the report along with subsequent strategies and best practices which may be effective in implementing the strategies.
REGIONAL VISIONIn the next three years the five-county region will…
» Strongly encourage entrepreneurship with a highly supportive business environment;
» Invest in necessary local infrastructure to support current and future businesses;
» Leverage existing and emerging industrial assets and capabilities; and
» Market regional assets to attract and retain young professionals.
REGIONAL GOALSGoal I: Develop a competitive and highly productive workforce with up-to-date skills capable of using the latest technology in production processes.
Goal II: Support major existing and emerging growth industries such as transportation and aerospace component manufacturing to become a major Midwestern production/assembly region.
Goal III: Create an entrepreneurial region with a climate which supports new business formation and encourages existing businesses to invest and prosper.
Goal IV: Make better use of local (regional) inputs and specialties to develop a highly profitable agribusiness and food processing region integrated into Midwestern markets.
Goal V: Leverage and market existing regional assets to encourage growth, enhance the quality of life, and maximize the potential of the region.
TOP PRIORITIES FOR REGIONAL PROSPERITY » Support for manufacturers: Regional goals addressed: I, II, V
» Entrepreneurial and small business development: Regional goals addressed: II, III, V
» Value added agriculture: Regional goals addressed: III, IV, V

NIU Center for Governmental Studies 3
Promoting Regional Prosperity in Northwest Illinois
Executive Summary
SUMMARYThe five counties in northwestern Illinois are in a relatively unique position to participate in the pending economic recovery for several reasons. First, they have access to excellent logistics and transportation infrastructure including rail, highway, and fiber access. Some of the fiber facilities are still under development and construction, but have the potential to position the Region well for new industries.
Second, the five counties are very well positioned to access major regional, national, and global markets because of relative proximity to Chicago, Milwaukee, Madison, Minneapolis-St. Paul, Quad Cities, and St. Louis. The proximity to Chicago, with its global access, is a major strength of the Region.
Third, they are located in an area rich with natural resources for agricultural and food production and relative close proximity to major markets as noted above. Recent changes in preferences for local foods and other opportunities involving agricultural products place the Region in an excellent position to serve new markets rather than shipping unprocessed grain out of the area.
Perhaps the most valuable asset in the Region, however, is the long history of innovation and manufacturing expertise. While some of the past manufacturing operations in the Region have closed or moved away, a significant number of small machine shops and manufacturing operations remain and are positioned to do well in the future with the re-shoring and pending growth of manufacturing. The percentage growth in value added produced by manufacturing in the Region during the past decade surpassed both the U.S. and Illinois. The declines in employment may partly reflect productivity increases.
Not all of the news generated in this project is positive, however. The business starts in the Region are lower than in comparable areas in surrounding states. Population projections indicate a tightening of the job market in the next decade. Employers are experiencing more difficulties in filling positions with applicants who have the skills which are needed to operate the complex machinery used in advanced manufacturing techniques.
A positive outcome from this project is the collaboration of manufacturers, representatives of higher education, and labor market organizations who discussed ways to build a labor force with up-to-date skills and the potential to attract and retain businesses using advanced manufacturing techniques. These businesses will provide quality jobs at relatively high pay, which will be essential to attracting young adults into the workforce in the future. Working with educational institutions at all levels to provide curriculums which offer a future for graduates is also essential.
Discussions have started between businesses and education representatives. The data provided in this report can support decisions which will help the Region to participate effectively in the economic recovery and to prosper during the next decade.

4 NIU Center for Governmental StudiesProject Overview
Promoting Regional Prosperity in Northwest Illinois
PROJECT OVERVIEWAssessing and enhancing regional competitiveness is a critical component of economic development since fostering economic growth in a region involves linking regional assets to potential business opportunities. Economic development stakeholders in northwest Illinois (Carroll, Lee, Ogle, Stephenson, and Whiteside counties) initiated a regional collaboration to identify these linkages and opportunities with the goal of a long-term development strategy.
This project, funded by the U.S. Economic Development Administration (EDA) and local economic development agencies, includes a labor force availability analysis for the Region designed to help define the elements necessary to attract and retain area companies and/or launch establishments, leading to increased growth and prosperity in the Region. This analysis has three main components. The first component is a regional wage and benefit study based on data collected from an online survey in April 2012. This was an update and expansion of a wage and benefit study conducted by the Center for Governmental Studies (CGS) at Northern Illinois University (NIU) in January 2009.
The second component is a regional underemployment study conducted by Pathfinders, Inc., completed in July 2012. This project is designed to determine the extent to which labor force cohorts with specific skills are available in the Region and are willing to take jobs at various wage levels.
The third component, and primary objective of the regional report, is an analysis of industry clusters to determine the greatest potential for future growth by identifying business activities which could capitalize on the human, material, and locational assets in the Region. These potential industries are examined further to determine their importance for the Region if they were to locate in or around the area.
During the project, the CGS collaborated with the following organizations:
» Whiteside County Economic Development and Enterprise Zone (serving Whiteside and Carroll counties)
» Northwest Illinois Development Alliance (NIDA)
» Rock Falls Community Development Corporation (RFCDC)
» Greater Sterling Development Corporation
» Lee County Industrial Development Association
» Black Hawk Hills Regional Council
» Greater Rochelle Economic Development Corporation (GREDCO)
METHODOLOGYThe project, especially the industry cluster analysis, was shaped by a set of framing questions designed by the regional partners in consultation with CGS staff. These questions guided the researchers and advisory committee in their goal of designing and implementing regional development strategies. These strategies will help build regional capacity to stimulate entrepreneurship and business expansion based on private and public investments. The project advisory committee met over several months to analyze regional data and to explore regional development options.

NIU Center for Governmental Studies 5
Promoting Regional Prosperity in Northwest Illinois
Project Overview5
FRAMING THE ISSUES To better understand the potential in the Region from the perspectives of a diverse group of economic development and business leaders representing both their own county and the regional effort, CGS posed several issues to the project advisory committee.
How can the Northwest Illinois Region distinguish itself as a(n)...
» Region with a competitive and highly productive workforce with cutting-edge skills, a dependable work ethic, and educational programs which support using the latest technology in production processes?
» Highly profitable agribusiness and food processing center integrated into Midwestern markets using local (regional) inputs and specialties?
» Major Midwest production and assembly center for advanced manufactured components produced locally?
» Widely recognized source of talent, expertise, and input for the dominant manufacturing clusters in nearby metropolitan centers (Dubuque, Janesville-Beloit, Madison, Peoria, the Quad Cities, and Rockford)?
» Region successfully leveraging the Global III Intermodal Terminal (Rochelle) to retain, expand, and attract targeted manufacturing activities?
» Entrepreneurial region recognized for nurturing successful new businesses?
These questions were designed to elicit responses which could become goals and strategies for the Region. In conjunction with the wage and benefit study, uneremployment study, and additional research by CGS and other agencies, these questions shaped the regional action strategies.
MAPPING REGIONAL ASSETS In the past several decades, the U.S. economy has undergone major changes which affect the ways in which economic development is pursued. In the past, major corporations produced a variety of goods and purchased inputs from established suppliers. These tended to be long-term relationships as shown by the manufacturing experiences in the Sterling-Rock Falls area.
With the advent of the Internet, lower transportation costs, and information technology, the business relationships have relied more on networks of suppliers so that a product now is produced with inputs from numerous suppliers. These networks include many small companies spread over longer distances than in the past. Businesses in off-shore locations with lower wage costs are especially competitive in a network environment with almost instant communication. However, in recent years some difficulties have arisen in maintaining tight quality control, which has led companies to consider bringing some manufacturing jobs back to the U.S.
The “new environment” means that groups pursuing economic development strategies need to analyze the potential of the Region in light of four major characteristics, the approach used in this project. The Strategic Doing literature in recent years, led by Ed Morrison, Purdue Center for Regional Development at Purdue University, has addressed many of these questions and has produced a four-sector illustration (Figure 1). Each of these characteristics is briefly discussed next.
» 21st Century Workforce. The labor force must have the skills and knowledge to work with the latest technology needed for advanced manufacturing processes and/or other occupations. The rate of technological change has been such that production processes in start-up companies often differ substantially from older operations. Regions which are able to incorporate this training into their educational systems have a decided advantage.

6 NIU Center for Governmental StudiesProject Overview
Promoting Regional Prosperity in Northwest Illinois
» Places with High-Quality Connections. The importance of the global marketplace is such that successful companies must be able to make decisions using high-speed Internet access. Thus, the Region must have access to these high-speed connections at a cost which is affordable. The connectivity goes beyond Internet, however. Creative people need a location where they can congregate and share ideas. Young professionals are interested in living in a modern environment with high-speed access, so regions which have these locations will be more attractive to both businesses and youth. Educational institutions, technology centers, and small business support units are examples of places with this connectivity.
» Entrepreneurial Environment. To be competitive in the current environment, a region must work to create opportunities and to provide assistance for entrepreneurship efforts. New ideas must circulate among producers, and entrepreneurs who are interested in starting ventures need guidance and assistance in launching the businesses. Entrepreneurship is high among young adults, so the high-quality connectivity goes hand-in-hand with the entrepreneurial environment. These locations can include schools, universities, hospitals, or other institutions which are engaged in research and technology.
» Positive Narrative about Region. Too often, regions which have experienced economic reversals are prone to dwell on negative trends. Changing this narrative to a positive through communicating about available opportunities to potential business investors, young adults, and other key groups in the Region is not easy, but it is essential for the Region to succeed in attracting and retaining businesses as well as launching business ventures. The new narrative must be shared with youth so that they perceive the Region as a place to stay and prosper instead of feeling pressure to leave in search of a better future. Changing the narrative must be a group effort.
» Civic Leadership and Collaboration. The four essential innovation characteristics above, must in some way be linked and managed by a leadership group in the Region. This happens with a partnership of public and private agencies which collaborate to link the important assets of the Region and in some way market them to intended audiences. This group includes business leaders, public officials, professional associations, civic groups, and others working toward a common agenda, namely economic prosperity. The composition of the informal group may change over time but must remain credible in order to move the process along and manage the networks. The next section describes many of the assets and resources in the Region by innovation category; however, this list is not exhaustive.
Figure 1: Innovation Asset Map
Innovative Companies
Brainpower21 Century Talent
InnovationEntrepreneurship
Networks
New NarrativesQuality
ConnectedPlaces
Innovative Hot Spots
Inno
vati
ve P
eopl
e
Innovative Clusters
Source: Ed Morrison, Purdue Center for Regional Development, Purdue University.
Civic Leadership and
Collaboration
Figure 1. Innovation Asset Map

NIU Center for Governmental Studies 7
Promoting Regional Prosperity in Northwest Illinois
Project Overview
Brainpower, 21st Century Talent
» Highland Community College: Industrial manufacturing technology programs, Wind Turbine certification, and AAS programs
» Illinois Manufacturing Extension Center (IMEC)
» Kishwaukee Community College: Illinois Network for Advanced Manufacturing programs
» Morrison Institute of Technology (MIT)
» Northern Illinois University Outreach Programs: AgTech, College of Business, College of Engineering, Center for Governmental Studies
» Sauk Valley Community College: Manufacturing certification and AAS programs
» Whiteside Area Career Center
» Young Professionals Networks
» CareerTec
Innovation, Entrepreneurship Networks
» Blackhawk Hills Entrepreneurs and Inventors Club
» EIGER Lab
» Inventory process and production capabilities of existing business
» Kitchen Incubator programs in Sterling and Freeport
» Regional Manufacturing Technology Academy
» Small Business Development and Entrepreneurial Center
Quality, Connected Places
» Regional airports
» Foreign trade zones
» Global III Intermodal
» Healthcare facilities and services
» High-speed Internet access
» Mainline access to four Class I rail carriers
» Major interstate and highway connections
» Savanna Depot Local Redevelopment Authority (LRA)
New Narratives
» Blackhawk Hills Regional Council
» Chambers of commerce
» Economic Development organizations
» Regional business participation in Career Days at local middle and high schools
» Regional business engagement with local community colleges to create new training programs or improve existing programs.

8 NIU Center for Governmental StudiesProject Overview
Promoting Regional Prosperity in Northwest Illinois
GEOGRAPHIC SCOPE A review of reports, studies, and current comprehensive and economic development plans for the Region was conducted. It was imperative to the project that the strategic goals and actions align with the 2008-2012 Comprehensive Economic Development Strategy (CEDS). In addition to the CEDS, two previous industry cluster studies conducted by Vandewalle & Associates provided a background and broader geographic context to the current analysis since the labor shed for the five-county region extends well beyond its physical boundaries. The Reference Region cited in this report includes 32 counties in Illinois, Iowa, and Wisconsin (Figure 2) and represents an opportunity for the five-county area to strengthen existing economic synergies (as well as create new ones) with the dominant or emerging industries in the larger tri-state region. The leveraging of these relationships forms the basis for the economic development strategies presented here.
FIVE-COUNTY WAGE AND BENEFIT SURVEY AND REPORTThe compensation questionnaire collected information about the business practices, industry workforce composition, occupational wage ranges, and employee benefit information. The survey was sent via Survey Monkey and completed online.
A total of 295 businesses were invited to complete the survey on wages, benefits, and compensation practices. Between February and April 2012, 103 businesses responded, a return rate of 34.9%. Targeted industries in the survey included Manufacturing, Healthcare and Social Assistance, Agriculture, and Transportation and Warehousing. These industries were selected based on their presence in the Region and the interest of local development agencies in marketing the Region to specific industries. (See Five-County Wage and Benefit Report.)
UNDEREMPLOYMENT SURVEY AND REPORTLabor availability for hiring decisions includes unemployed workers; however, companies also staff new or expanded operations with individuals who are currently working but may desire better jobs and who seem to possess the skills, education, and experience to qualify for those higher-paying jobs. Those individuals can be considered “underemployed.” A study was completed to quantify the extent of both unemployment and underemployment in the five-county northwest Illinois area and a larger 15-county labor shed which included the targeted five counties1.
1This labor shed includes Bureau, Carroll, DeKalb, Henry, Jo Daviess, LaSalle, Lee, Ogle, Rock Island, Stephenson, Whiteside, and Winnebago Counties in Illinois; Clinton and Jackson Counties in Iowa; and Green County in Wisconsin.
Figure 2: Primary (Five-County) and Reference (32-County) Regions
Figure 2. Primary (Five-County) and Reference (32-County) Regions
Rock Island
Scott
Clinton
Cedar
Jones
Delaware Dubuque
Jackson
Jo Daviess Stephenson
Carroll
Whiteside
Henry
Bureau
Lee
OgleDe Kalb
Boone
Le Salle
Putnam
Winnebago
RockGreenLafayette
IowaDane
Grant
20
30 39
88
8074
90
43
90

NIU Center for Governmental Studies 9
Promoting Regional Prosperity in Northwest Illinois
Project Overview
Interviews were conducted with individuals throughout the Region. The sample was proportionally stratified by age, household income, and zip code. The purpose of the survey was to determine availability for work with a new employer, desired pay rates, and to collect information on other factors such as age, education, commuting patterns, experience, and skills. A total of 1,022 completed calls (both landline and cell phone) were made during the household survey—51.0% were males and 49.0% were females; 78.0% were employed; 22.0% were currently unemployed.
Interviews were also conducted with senior management and human resource professionals from companies located in the labor shed to develop a profile of current workers in the northwest Illinois region. Approximately 30.0% of the businesses called gave interviews. (See Northwest Illinois Area Labor Availability Report.)
Together, these two surveys and subsequent reports, provide a solid basis for workforce training and development initiatives in the Region. By identifying the skill levels of displaced workers, determining the transferability of skills to new jobs, and assessing underutilized skill sets, the project enables the business community and economic development leaders to assess the current regional business climate and then to transform it into an economy suited for the future.
CLUSTER ANALYSIS Since the Northwest Illinois Region is mostly rural with a relatively limited industrial base, this analysis tries to identify potential development opportunities by linking businesses in the Region to the dominant industry clusters in nearby metropolitan areas (Dubuque, Janesville-Beloit, Madison, the Quad Cities, Peoria, and Rockford). The industry clusters were selected using traditional economic tools (i.e., location quotients, shift-share, and contribution to Gross Regional Product), but are informed by inputs from regional economic development partners, local business interviews, staffing patterns, and projected workforce supply and demand indicators.
The project began by analyzing cluster data from the EDA sponsored work by the Purdue Center for Regional Development2 and work underway by Porter3. Also considered were the results and recommendations of two previous studies completed by Vandewalle & Associates4,5. These studies identified targeted industries for regional groupings which included the five-county area, as well as adjacent metropolitan areas in Illinois, Iowa, and Wisconsin. While the results of these studies yielded valuable insights about potential assets and synergies in a broad geographic context, the studies were mostly focused on the dominant industries in the metropolitan areas. As such, the opportunities for developing greater value chain relationships with the rural areas were not explored in detail.
Industry clusters are geographic concentrations of competing, complementary, or interdependent firms and industries which conduct business with each other and/or have common needs for talent, technology, and infrastructure. The firms included in the cluster may both compete and cooperate. An important characteristic of clusters is that they are centered on firms which sell outside the local, state, or even national market. These exporting firms are driving forces in a regional or state economy because they bring money into the area and support many local industries. It is important to note that a cluster does not represent an industry or a business; instead, it represents the potential of linking industries and businesses that share common elements.
2 Purdue Center for Regional Development, Purdue University, et. al., A Practitioner’s Guide to Economic Development Tools for Regional Competitive-ness in a Knowledge-Based Economy, October, 2009.3 U.S. Cluster Mapping Project led by Professor Michael E. Porter at the Institute for Strategy and Competitiveness, Harvard Business School. (http://mvp.clustermapping.us/)4 “50+ County Asset and Opportunity Analysis”. Vandewalle & Associates, July, 2011.5 “Quad Cities Region Global Growth Initiative”. Vandewalle & Associates, January, 2012.

10 NIU Center for Governmental StudiesProject Overview
Promoting Regional Prosperity in Northwest Illinois
Although all of the industry clusters have a presence in the five-county region, those with a significant concentration of establishments, employment, or wages were an important consideration in their selection for further research. These concentrations are measured by location quotients (LQ), which are the ratio of the percentage of establishments, employment, or wages in an industry in the Region compared to the U.S. A comparison of the LQ for industry clusters in the five-county region was one criterion for selecting targets for future development efforts. In selecting industry clusters with the greatest development potential, preference was given to those with high employment and wage concentration although factors such shift-share trends, supply chain relationships, and the dominant industries in the surrounding metro areas were also considered.
A dozen industries in the five-county region had concentrations above the national average. Figure 3 highlights the five industry clusters which were ultimately selected as development targets. Several other clusters had a higher LQ, but were not selected because of their presence in only one or two counties (rather than to the entire Region), or they were already a part of existing economic development efforts.
The Transportation Equipment Manufacturing cluster had only a minor presence in the Region, but was selected because of the dominance of Automobile, Truck, Farm, and Construction Machinery Manufacturing industries located in the surrounding metro areas (especially Rockford). There appears to be potential for developing or attracting new businesses in this cluster by building on regional supply chain relationships. In addition, the recent opening of the Nippon-Sharyo railcar manufacturing plant offers similar opportunities not only for supply chain development, but also the chance to attract other railroad equipment manufacturers.
Analyzing industry clusters helps development practitioners and policymakers identify the networks of businesses which create wealth in a local or regional economy. Industry clusters help to do the following: » Describe how industries in a region compare to each other;
» Identify growth trends through regional location quotient analysis;
» Reveal emerging industries in a region; » Analyze the mix of clusters in a diverse region which may include rural and urban areas;
» Rethink business expansion strategies; » Reveal groups of industries which have similar workforce needs;
» Prioritize groups of firms which have growth potential; and
» Create regional identities and improve marketing effectiveness.
Location Quotients (LQ) are commonly used to evaluate local development opportunities and to find businesses especially suited for the region. A LQ is the ratio of the employment percentage represented by a given industry in the county to the percentage that industry represents in the state or a representative area of interest. A ratio greater than one indicates a higher local concentration and a likelihood of exports from the county and ratio less than one may suggest that goods or services are being imported into the Region.
NIU Center for Governmental Studies 11
Promoting Regional Prosperity in Northwest Illinois
Project Overview
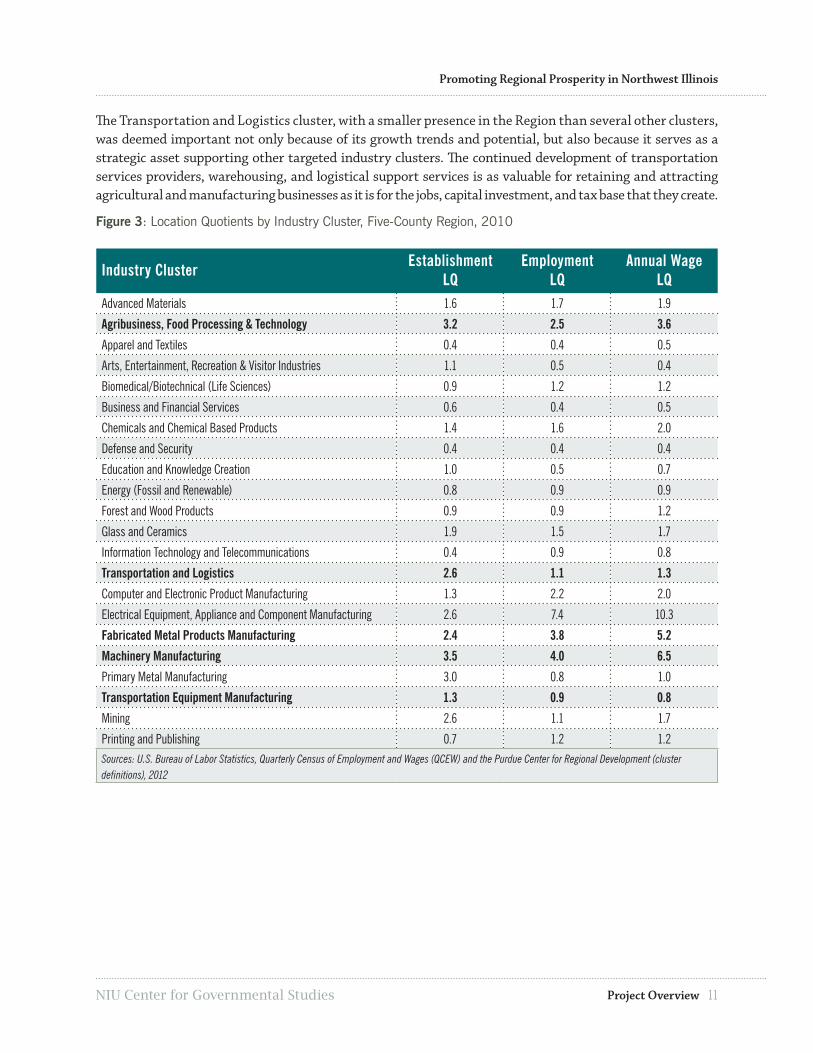
The Transportation and Logistics cluster, with a smaller presence in the Region than several other clusters, was deemed important not only because of its growth trends and potential, but also because it serves as a strategic asset supporting other targeted industry clusters. The continued development of transportation services providers, warehousing, and logistical support services is as valuable for retaining and attracting agricultural and manufacturing businesses as it is for the jobs, capital investment, and tax base that they create.
Figure 3: Location Quotients by Industry Cluster, Five-County Region, 2010
Industry Cluster Establishment LQ
Employment LQ
Annual Wage LQ
Advanced Materials 1.6 1.7 1.9
Agribusiness, Food Processing & Technology 3.2 2.5 3.6
Apparel and Textiles 0.4 0.4 0.5
Arts, Entertainment, Recreation & Visitor Industries 1.1 0.5 0.4
Biomedical/Biotechnical (Life Sciences) 0.9 1.2 1.2
Business and Financial Services 0.6 0.4 0.5
Chemicals and Chemical Based Products 1.4 1.6 2.0
Defense and Security 0.4 0.4 0.4
Education and Knowledge Creation 1.0 0.5 0.7
Energy (Fossil and Renewable) 0.8 0.9 0.9
Forest and Wood Products 0.9 0.9 1.2
Glass and Ceramics 1.9 1.5 1.7
Information Technology and Telecommunications 0.4 0.9 0.8
Transportation and Logistics 2.6 1.1 1.3
Computer and Electronic Product Manufacturing 1.3 2.2 2.0
Electrical Equipment, Appliance and Component Manufacturing 2.6 7.4 10.3
Fabricated Metal Products Manufacturing 2.4 3.8 5.2
Machinery Manufacturing 3.5 4.0 6.5
Primary Metal Manufacturing 3.0 0.8 1.0
Transportation Equipment Manufacturing 1.3 0.9 0.8
Mining 2.6 1.1 1.7
Printing and Publishing 0.7 1.2 1.2Sources: U.S. Bureau of Labor Statistics, Quarterly Census of Employment and Wages (QCEW) and the Purdue Center for Regional Development (cluster definitions), 2012

12 NIU Center for Governmental StudiesProject Overview
Promoting Regional Prosperity in Northwest Illinois
Shift-Share Analysis
The development potential of the Region’s industry clusters was also assessed using shift-share analyses. The technique is based on the assumption that local economic growth is explained by the combined effect of three components: national share, industry mix, and competitive share. The national share component represents growth and/or decline in the study area due to national economic changes. The industry mix component represents the change in a given industry in the study area attributable to conditions in the individual industry. This is only to suggest that a specific industry has done well or poorly on a broader level. The third component of employment change, competitive share, is what remains after the other two components are subtracted. It approximates the job growth or decline of an industry attributable to local business conditions. Local industry sectors which experienced greater job growth than at the national level have a positive competitive share.
Three of the five targeted industry clusters had positive employment associated with competitive share 2007-2010 periods (Figure 4). These trends suggest that the Region has an advantage in terms of market access, cost of inputs, or other factors which could allow further expansions. The Agribusiness, Food Processing, and Technology; Transportation and Logistics; and Transportation Equipment Manufacturing clusters experienced competitive job growth between 2007 and 2010 in spite of the recent recession and in addition to suffering significant losses earlier in the decade.
Figure 4: Competitive Share of Employment Change, Five-County Region, 2007-2010
Industry Cluster National Share
Industry Mix
Competitive Share
Competitive Share (%)
Agribusiness, Food Processing, and Technology -214 134 486 7.1%
Transportation and Logistics -120 -69 259 0.1
Fabricated Metal Products Manufacturing -188 -361 -647 -0.2
Machinery Manufacturing -155 -223 -480 -0.2
Transportation Equipment Manufacturing -34 -100 26 0.0Sources: IMPLAN; U.S. Bureau of Labor Statistics, Quarterly Census of Employment and Wages (QCEW) and the Purdue Center for Regional Development (cluster definitions), 2012.
The two strongest regional clusters, Fabricated Metal Products and Machinery Manufacturing, had employment declines. Interviews with local businesses, which were conducted as part of this project, indicated that companies are being cautious in creating new positions or replacing existing positions because of the uncertainty about the strength of the recovery and the impact of healthcare reform. Instead, most are offering overtime to current employees, outsourcing, or making more use of temps or contract workers, who are counted differently in most private (e.g., Dun & Bradstreet) or government employment statistics.
NIU Center for Governmental Studies 13
Promoting Regional Prosperity in Northwest Illinois
Project Overview
When compared with National Employment Time Series (NETS) data (cited in the Business Vitality Trends section of this report), most job losses appear to come from the downsizing or closure of larger companies. At the same time, many smaller companies held steady or expanded employment, which contributed to net job increases or mitigated job losses at the larger firms. In the Fabricated Metal Products and Machinery Manufacturing clusters, larger employers accounted for largest shares of total employment.
The competitive share analysis suggests the Region may have less of an advantage in industries which are growing more slowly (or declining more rapidly) than the national average. It is also possible that the recent recession may have exaggerated the results to a degree. Beyond this, a more detailed examination of individual companies is needed to determine why the Region is disadvantaged when compared to other areas and what changes could make the area more competitive.
Description of Targeted Industry Clusters
Since the purpose of the project is to formulate regional strategies, it is important to address the industry analyses from the perspectives of each county and its assets, as well as the entire Region to identify assets and potential that any one county alone would not see as important. Thus, all components of the project and related action strategies are designed to complement each locality’s economic development efforts by leveraging limited resources and directing them toward a set of common development objectives to benefit the region. This approach will generate opportunities for the counties to pursue some projects independently and also to collectively pursue other projects as a Region. Based on this information, the committee narrowed the focus of the project to a specific set of clusters and subsectors within those clusters6.
Agribusiness, Food Processing, and Technology generally refers to increasing the economic value of a commodity through particular production processes. Examples of this include the production of organic fruit and vegetable crops and non-traditional crops or through regionally branded products which increase consumer appeal and willingness to pay a premium over similar but undifferentiated products. It also encompasses the development of processing commodities or alternative fuels, as well as the industries which support agricultural production (including farm machinery, fertilizer, and pesticide manufacturing). While the traditional crop and livestock production has a strong presence in the Region, value added activities are a small (but growing) component of the cluster. Food Processing also has a significant presence, particularly in dairy products (such as cheese), snack foods, and processed meats.
Fabricated Metal Products Manufacturing transforms purchased metals into intermediate or end-use products through forging, stamping, bending, forming, welding, machining, and/or assembly. Because of the special manufacturing processes involved for individual parts, most companies make a limited range of products. Major segments of the Fabricated Metal Products Manufacturing cluster include architectural and structural products; forging and stamping; machining; cutlery, tools, and kitchenware; boilers, tanks, and containers; hardware; springs and wires; coating, plating, and polishing; and valve and pipe manufacturing. The five-county region, as well as the surrounding metro area, has a strong and well-established presence in these industries, and many products or components supply other important industries in the Region such as motor vehicles, aerospace industrial machinery, and appliance manufacturers.
6 Statistical profiles of each of the targeted clusters are included at the end of the report.
14 NIU Center for Governmental StudiesProject Overview
Promoting Regional Prosperity in Northwest Illinois
Machinery Manufacturing is comprised of a broad and diverse range of machinery or components which are used in agriculture, mining, construction, or manufacturing. Major products of companies in the five-county region include farm and construction machinery, metalworking and other manufacturing machinery, HVAC and commercial refrigeration equipment, and general-use machinery such as engines and pumps. While some products, such as tractors or heaters, are finished products, others like motors are components used in further production, and some are custom-designed for a specific manufacturing process. Machinery Manufacturing involves producing and assembling components. Companies either make or buy components and various types of mechanical, hydraulic, and electrical control systems. Manufacturing often involves forging, machining, and welding activities which require skilled labor. Products have a high engineering content, and product design usually involves computer-aided design (CAD) systems, which are integrated directly into a computer-aided manufacturing (CAM) process.
Transportation Equipment Manufacturing includes companies which manufacture transportation equipment for commercial and personal use, such as aircraft, automobiles, railroad rolling stock, and water craft. Companies which make parts or components for transportation equipment also are included in the industry. Although this cluster is relatively small in the five-county region, the surrounding metro area, especially Rockford, has a strong concentration of aerospace- and automotive-related industries, and many companies in the Fabricated Metal Products and Machinery Manufacturing clusters are part of the supply chain. The Rockford area also has existing economic development initiatives to further expand the regional supply chain for these industries. These initiatives may potentially benefit the five-county region. In addition, the recent opening of the Nippon-Sharyo railcar production facility presents an opportunity for new or existing companies to become a part of this industry’s supply chain.
Transportation and Logistics includes road, rail, and air freight transportation companies, as well as warehousing, parcel couriers, and related logistics services. This cluster has a relatively small, but growing presence in the five-county region, which is driven by transportation access and proximity to the Chicago area and other regional markets. The Region not only benefits from excellent highway and rail access, but also has several large commercial airports, two foreign trade zones, a major UPS air hub (in Rockford), and the Global III Intermodal facility (in Rochelle). The former Savanna Army Depot also has the potential for rail and communications-related development, if necessary infrastructure improvements are made.

NIU Center for Governmental Studies 15
Promoting Regional Prosperity in Northwest Illinois
Regional Overview
REGIONAL OVERVIEWThe future of the Northwest Illinois Region will be determined by its ability to successfully address several demographic and economic transitions; the most significant will be an overall aging of the population during a period of population stagnation or decline. The increasing demands for younger workers to replace older ones as they retire will be crucial in this Region, as well as other areas. In short, competition for a well-trained, highly skilled workforce will be substantial.
Concurrently, technological advancements in many industries, especially manufacturing, demand a higher level of education and/or training to fill the jobs which will become available. A desired outcome of this collaborative project is that employers and educational institutions in the area can work together to deliver a set of training programs which will meet the needs of industries being recruited into the Region.
To set the stage for more complete analyses of industrial structure and strategies to implement, a discussion of major demographic and economic trends in the region follows. The section includes population trends, employment trends, occupation employment characteristics, educational characteristics, and business vitality trends.
POPULATION TRENDSImportant demographic trends will reshape the workforce over the next several decades and impact the Region’s economic competitiveness. The aging of the population combined with the projected slow rate of growth will result in fewer workers and types of workers available and an uncertainty of worker’s ability and willingness to participate in the labor force. Between 2000 and 2010, the total population in the five-county region declined by 2,637 persons (1.2%); however, the loss is projected to regain between 2010 and 2020 (Figure 5).
Figure 5: Population Trend 2000-2011, Five-County Region
213,513
210,876
212,895
210,000
211,000
212,000
213,000
214,000
2000 2010 2020
Source: Woods & Poole Economics, Inc., 2012.
Figure 5. Population Trend 2000-2011, Five County Region
The future of northwest Illinois will be determined by its ability to successfully address several demographic and economic transitions; the most significant will be an overall aging of the population during a period of population stagnation or decline.
16 NIU Center for Governmental StudiesRegional Overview
Promoting Regional Prosperity in Northwest Illinois
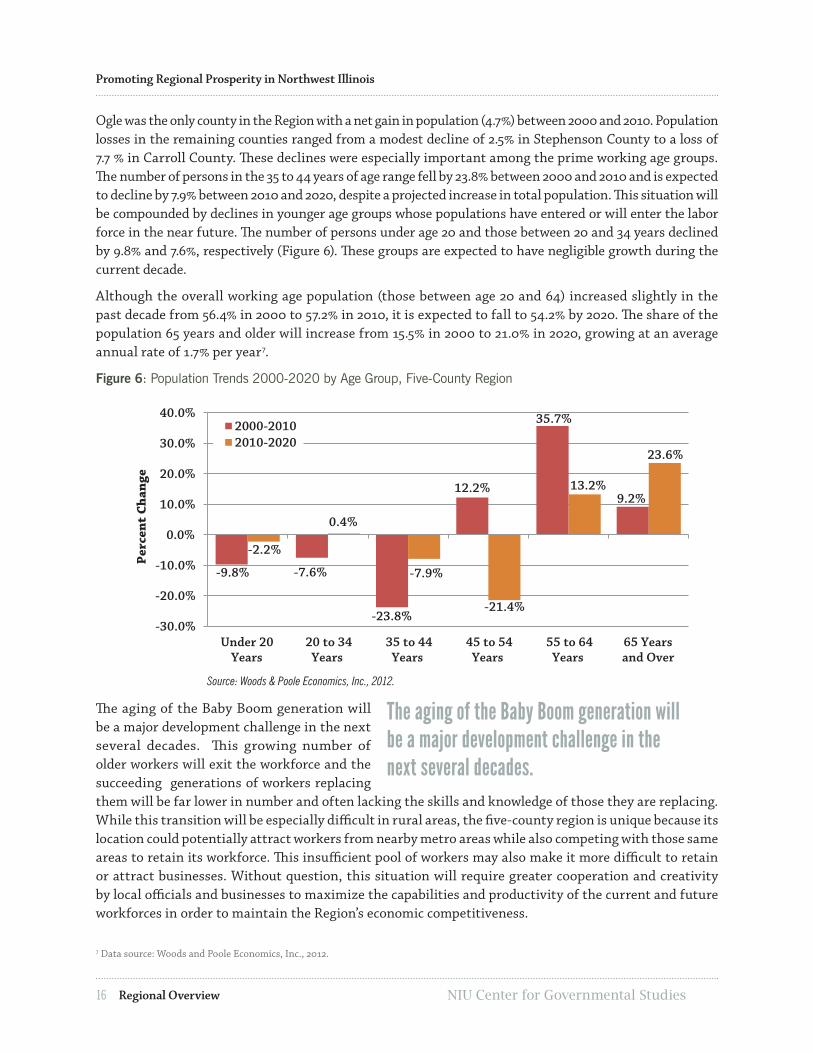
Ogle was the only county in the Region with a net gain in population (4.7%) between 2000 and 2010. Population losses in the remaining counties ranged from a modest decline of 2.5% in Stephenson County to a loss of 7.7 % in Carroll County. These declines were especially important among the prime working age groups. The number of persons in the 35 to 44 years of age range fell by 23.8% between 2000 and 2010 and is expected to decline by 7.9% between 2010 and 2020, despite a projected increase in total population. This situation will be compounded by declines in younger age groups whose populations have entered or will enter the labor force in the near future. The number of persons under age 20 and those between 20 and 34 years declined by 9.8% and 7.6%, respectively (Figure 6). These groups are expected to have negligible growth during the current decade.
Although the overall working age population (those between age 20 and 64) increased slightly in the past decade from 56.4% in 2000 to 57.2% in 2010, it is expected to fall to 54.2% by 2020. The share of the population 65 years and older will increase from 15.5% in 2000 to 21.0% in 2020, growing at an average annual rate of 1.7% per year7.
Figure 6: Population Trends 2000-2020 by Age Group, Five-County Region
-9.8% -7.6%
-23.8%
12.2%
35.7%
9.2%
-2.2%
0.4%
-7.9%
-21.4%
13.2%
23.6%
-30.0%
-20.0%
-10.0%
0.0%
10.0%
20.0%
30.0%
40.0%
Under 20Years
20 to 34Years
35 to 44Years
45 to 54Years
55 to 64Years
65 Yearsand Over
Perc
ent
Chan
ge
2000-20102010-2020
Figure 6. Population Trends 2000-2020 by Age Group, Five-County Region
Source: Woods & Poole Economics, Inc., 2012.
The aging of the Baby Boom generation will be a major development challenge in the next several decades. This growing number of older workers will exit the workforce and the succeeding generations of workers replacing them will be far lower in number and often lacking the skills and knowledge of those they are replacing. While this transition will be especially difficult in rural areas, the five-county region is unique because its location could potentially attract workers from nearby metro areas while also competing with those same areas to retain its workforce. This insufficient pool of workers may also make it more difficult to retain or attract businesses. Without question, this situation will require greater cooperation and creativity by local officials and businesses to maximize the capabilities and productivity of the current and future workforces in order to maintain the Region’s economic competitiveness.
The aging of the Baby Boom generation will be a major development challenge in the next several decades.
7 Data source: Woods and Poole Economics, Inc., 2012.

NIU Center for Governmental Studies 17
Promoting Regional Prosperity in Northwest Illinois
Regional Overview
EMPLOYMENT TRENDSEmployment trends in the five-county region have lagged behind the state and U.S. during the past two decades, experiencing greater declines during recessions and growing slower during expansions. However, the proximity of the counties to other employment centers such as Clinton, Dubuque, Rockford, and the Quad Cities has offset some the effects of local job losses.
Non-farm employment in the five-county region declined 10.0% or 10,511 employees between the year 2000 and the first half of 20128 (Figure 7). Although the unemployment rate improved overall in 2011 and 2012, it is still higher than the state and national averages. The continued decline in numbers employed also suggests that the recent drop in the unemployment rate may have more to do with the decline in the labor force participation rate9. The participation rate refers to the number of people who are either employed or are actively looking for work. Those who are no longer actively searching for work are not included in the participation rate. The decline in participation in the Region mirrors national trends since the onset of the recent recession and is due to long-term shifts related to demographic trends and to the protracted cyclical downturn in the labor market10. Increasing labor force participation among unemployed or discouraged workers, as well as continuing to engage retirement-age workers (those 65 and older) will be of critical importance as the supply of younger workers decreases.
Figure 7: Non-Farm Employment and Unemployment Rate Comparison, Five-County Region
4.7
5.8 6.5
7.0 6.5
5.6 5.2 5.6
7.2
11.1 12.0
10.6 10.2
4.0
6.0
8.0
10.0
12.0
14.0
92,000
94,000
96,000
98,000
100,000
102,000
104,000
106,000
108,000
2000 2001 2002 2003 2004 2005 2006 2007 2008 2009 2010 2011 2012U
nem
ploy
men
t R
ate
Non
-Far
m E
mpl
oym
ent
Non-Farm Employment
Unemployment Rate
Note: Figures for 2012 are the average of the months of January through July.Source: Illinois Department of Employment Security, 2012.
Figure 7. Non-Farm Employment and Unemployment Rate Comparison, Five-County Region
Local figures are not available, but labor participation figures for the U.S. and Illinois have declined steadily since 2007 and are currently near levels experienced in the recessions of the early 1980s. The findings of the underemployment study and the business interviews conducted for this report show untapped or underutilized human resources which could be fully engaged in order to move the regional economy forward.
8 Figures for 2012 are based on the average of the months of January through July.9 Labor force participation (LFP) is the ratio of those holding or looking for work to the total working age population. A decline in the LFP can reflect people who are discouraged from looking for work but who would rejoin the labor force if job opportunities improved.10 Van Zandweghe, Willem. “Interpreting the Recent Decline in Labor Force Participation”. Economic Review, Federal Reserve Bank of Kansas City. First Quarter 2012.

18 NIU Center for Governmental StudiesRegional Overview
Promoting Regional Prosperity in Northwest Illinois
Although the five-county region experienced a lower rate of job loss in the recent recession than Illinois as a whole, it has continued to suffer a net loss of employment in the three years following the end of the recession in June 200911. This decline in employment may reflect several factors including retirements of older workers, out-migration of workers, and unemployed workers dropping out of the labor force. It may also reflect an increase in the number of people employed in the five-county region but residing elsewhere. Certainly, the recent recession and the subsequent slow recovery also affected job growth in the Region as businesses faced static or shrinking markets.
INDUSTRY EMPLOYMENT CHARACTERISTICSThe Region’s manufacturing sector declined sharply in the past decade, continuing a long-term trend (Figure 8). In 2000, about one in five jobs (21.5%) in the Region was in manufacturing, but by 2010 this sector represented only 13.5% of total employment, about the same share as the government sector. At the same time, the services sector employment grew rapidly during the past decade, but these gains were insufficient to offset the losses in manufacturing. In addition, many jobs in this sector (with the exception of some healthcare and professional or administrative occupations) have below average earnings and slower rates of earnings growth than manufacturing.
Figure 8: Employment by Major Industry Sector, Five-County Region
28.9%
27.0%
23.4%21.5%
16.5% 19.0%
26.7% 28.1%
15.2%13.3% 12.9% 12.3%
10.0%
15.0%
20.0%
25.0%
30.0%
35.0%
40.0%
1970 1980 1990 2000 2010
Perc
ent
of T
otal
Em
ploy
men
t
Services 32.0%
Manufacturing 13.5%
Government13.6%
Figure 8. Employment by Major Industry Sector, Five-County Region
ManufacturingServicesGovernment
Source: Woods & Poole Economics, Inc., 2012.
The decline in manufacturing reflects, in part, the productivity improvements which have allowed companies to meet or exceed past production levels with fewer employees. However, manufacturing jobs typically pay more, and regional strategies are needed to replace reductions in this employment sector. For example, the average earnings per employee for manufacturing in 2010 were $54,332, more than one and a half times the average for all industries in the Region ($35,701). In addition, manufacturing earnings increased 16.1% between 2000 and 2010 and are projected to increase 16.2% from 2010 to 2020.
11 The duration of business cycles is determined by the Business Cycle Dating Committee of the National Bureau of Economic Research. The dura-tion of the recent recession was December 2007 through June 2009.
NIU Center for Governmental Studies 19
Promoting Regional Prosperity in Northwest Illinois
Regional Overview
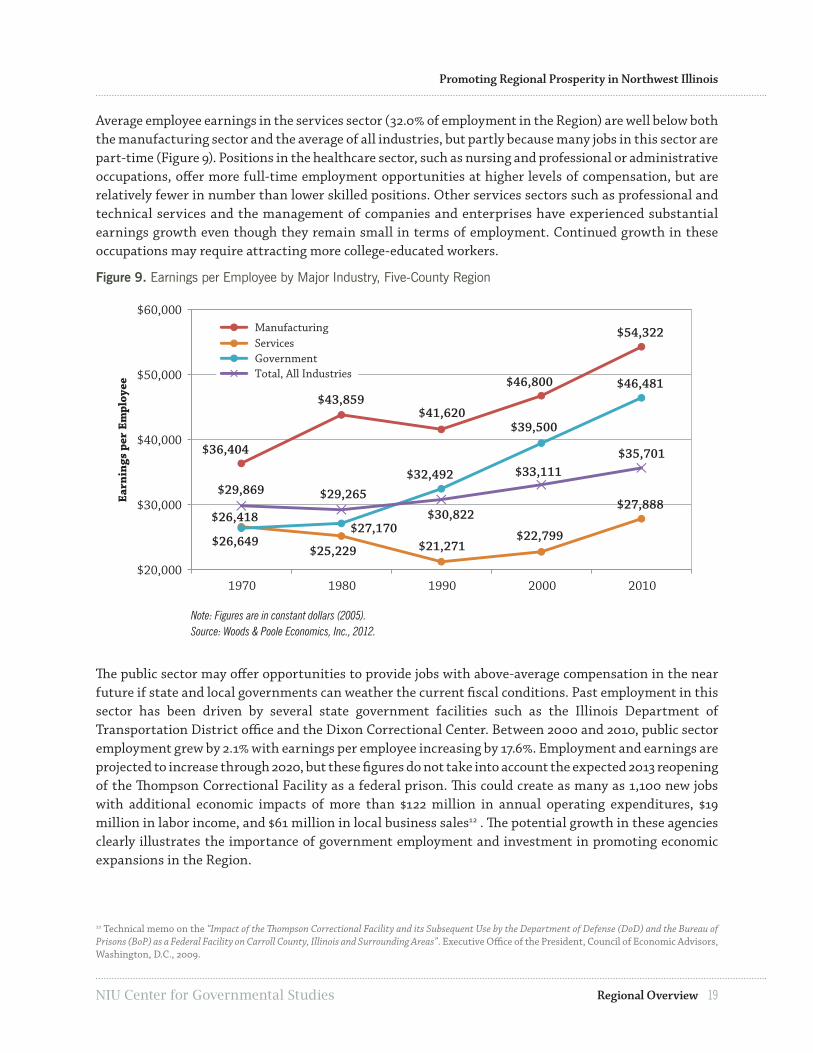
Average employee earnings in the services sector (32.0% of employment in the Region) are well below both the manufacturing sector and the average of all industries, but partly because many jobs in this sector are part-time (Figure 9). Positions in the healthcare sector, such as nursing and professional or administrative occupations, offer more full-time employment opportunities at higher levels of compensation, but are relatively fewer in number than lower skilled positions. Other services sectors such as professional and technical services and the management of companies and enterprises have experienced substantial earnings growth even though they remain small in terms of employment. Continued growth in these occupations may require attracting more college-educated workers.
Figure 9. Earnings per Employee by Major Industry, Five-County Region
$36,404
$43,859 $41,620
$46,800
$54,322
$26,649 $25,229 $21,271 $22,799
$27,888 $26,418 $27,170
$32,492
$39,500
$46,481
$29,869 $29,265 $30,822
$33,111
$35,701
$20,000
$30,000
$40,000
$50,000
$60,000
1970 1980 1990 2000 2010
Earn
ings
per
Em
ploy
ee
ManufacturingServicesGovernmentTotal, All Industries
Note: Figures are in constant dollars (2005).Source: Woods & Poole Economics, Inc., 2012.
Figure 9. Earnings per Employee by Major Industry, Five-County Region
The public sector may offer opportunities to provide jobs with above-average compensation in the near future if state and local governments can weather the current fiscal conditions. Past employment in this sector has been driven by several state government facilities such as the Illinois Department of Transportation District office and the Dixon Correctional Center. Between 2000 and 2010, public sector employment grew by 2.1% with earnings per employee increasing by 17.6%. Employment and earnings are projected to increase through 2020, but these figures do not take into account the expected 2013 reopening of the Thompson Correctional Facility as a federal prison. This could create as many as 1,100 new jobs with additional economic impacts of more than $122 million in annual operating expenditures, $19 million in labor income, and $61 million in local business sales12 . The potential growth in these agencies clearly illustrates the importance of government employment and investment in promoting economic expansions in the Region.
12 Technical memo on the “Impact of the Thompson Correctional Facility and its Subsequent Use by the Department of Defense (DoD) and the Bureau of Prisons (BoP) as a Federal Facility on Carroll County, Illinois and Surrounding Areas”. Executive Office of the President, Council of Economic Advisors, Washington, D.C., 2009.

20 NIU Center for Governmental StudiesRegional Overview
Promoting Regional Prosperity in Northwest Illinois
OCCUPATIONAL EMPLOYMENT CHARACTERISTICSOccupational employment characteristics both influence and are influenced by the industrial makeup of the regional economy, population trends, and education attainment. The skills, aptitudes, and competence of the workforce govern to a large degree the type of industry which can be developed or attracted to a region. The five-county region, as well as the surrounding areas, has a long standing specialization in agriculture and manufacturing which is reflected in the composition of the workforce. Production; Transportation and Material Moving; and Installation Maintenance, and Repair occupations represented 23.0% of all employment in 2008 (Figure 10).
Figure 10: Occupation Employment by Class, Workforce Investment Board Region#4, 2010-2018*
Occupation Class 2008 2018Number Percent Number Percent
Total, All Occupations 81,379 100.0% 84,696 100.0%
Office and Administrative Support 11,256 13.8 11,371 13.4
Production 9,653 11.9 8,806 10.4
Management 7,959 9.8 7,693 9.1
Sales and Related Occupations 7,815 9.6 8,049 9.5
Transportation and Material Moving 6,297 7.7 6,479 7.6
Food Preparation and Serving 5,735 7.0 6,443 7.6
Education, Training and Library 5,154 6.3 5,852 6.9
Construction and Extraction 4,047 5.0 4,188 4.9
Healthcare Practitioners and Technical 3,472 4.3 4,097 4.8
Business and Financial Operations 3,110 3.8 3,385 4.0
Installation, Maintenance, and Repair 2,798 3.4 2,930 3.5
Building, Grounds Cleaning, and Maintenance 2,735 3.4 2,913 3.4
Healthcare Support 2,020 2.5 2,557 3.0
Personal Care and Service 1,929 2.4 2,234 2.6
Protective Service 1,759 2.2 1,861 2.2
Community and Social Services 1,254 1.5 1,430 1.7
Architecture and Engineering 1,116 1.4 1,073 1.3
Computer and Mathematical 956 1.2 967 1.1
Art, Design, Entertainment, Sports, and Media 796 1.0 821 1.0
Farming, Fishing, and Forestry 687 0.8 633 0.7
Life, Physical and Social Science 434 0.5 490 0.6*Workforce Investment Board (WIB) Region #4 consists of Carroll, JoDaviess, Ogle, Stephenson, and Whiteside counties. Source: Illinois Department of Employment Security, 2012.
The five-county region, as well as the surrounding areas, has a long standing specialization in agriculture and manufacturing which is reflected in the composition of the workforce.

NIU Center for Governmental Studies 21
Promoting Regional Prosperity in Northwest Illinois
Regional Overview
Although their share of employment is expected to fall to 21.5% by 2018, these occupation classes will continue to play a critically important role in the Region’s economic development. The agricultural, manufacturing, and transportation sectors rely heavily upon these occupational skills and, despite anticipated declines the aggregate number of jobs in these sectors over the next decade, the demand for replacement workers will more than offset them. The staffing patterns for the targeted industry clusters identified in this report show that between one-half and three-quarters of the jobs in these clusters are classified as production related (Figure 11).
Figure 11: Industry Cluster Staffing Patterns: Production and Related Occupations
Production and Related Occupations* Share of Employment
Transportation Equipment Manufacturing 76.1%
Fabricated Metal Products Manufacturing 71.1
Transportation and Logistics 64.1
Machinery Manufacturing 64.1
Agribusiness, Food Processing and Technology 58.9*Includes the Production; Transportation and Material Moving; and Installation, Maintenance, and Repair Occupation Groups. Source: U.S. Bureau of Labor Statistics and the Purdue Center for Regional Development (cluster definitions), 2012.
Although the regional manufacturing sector has declined steadily in the past several decades and is projected to decline further over the next decade, the demand for younger workers to replace retiring Baby Boomers is expected to more than offset these losses. As Figure 12 illustrates, the job openings for Production workers in the WIB Region #4 are expected to be 196 persons per year, almost all of them due to replacement demands. Another closely related occupation group, Transportation and Material Moving, is projected to have 178 openings per year, with 86.0% of those resulting from replacement needs.
Figure 12: Occupation Employment by Class, Workforce Investment Board Region #4, 2008-2018*
Occupation Class Average Annual Job Openings
Average Annual Change
New Jobs Replacement Total Percent
Total, All Occupations 531 1,830 2,361 0.40%
Office and Administrative Support 46 242 288 0.10
Food Preparation and Serving 71 203 274 1.17
Sales and Related 27 241 268 0.30
Production 5 191 196 -0.91
Education, Training and Library 70 123 193 1.28
Transportation and Material Moving 25 153 178 0.29
Management 13 123 136 -0.34
Healthcare Practitioners and Technical 63 73 136 1.67
Business and Financial 28 64 92 0.85
Construction and Extraction 16 68 84 0.34
Personal Care and Service 31 47 78 1.48

22 NIU Center for Governmental StudiesRegional Overview
Promoting Regional Prosperity in Northwest Illinois
Occupation Class, continued Average Annual Job Openings
Average Annual Change
New Jobs Replacement Total Percent
Total, All Occupations 531 1,830 2,361 0.40%
Healthcare Support 54 22 76 2.39
Installation, Maintenance, and Repair 15 55 70 0.46
Building and Grounds Cleaning and Maintenance 18 46 64 0.63
Protective Service 10 53 63 0.57
Community and Social Services 18 27 45 1.32
Architecture and Engineering 3 25 28 -0.39
Art, Design, Entertainment, Sports, and Media 4 20 24 0.31
Computer and Mathematical 5 18 23 0.11
Life, Physical and Social Science 6 13 19 1.22
Farming, Fishing, and Forestry 0 18 18 -0.82
*Workforce Investment Board (WIB) Region #4 consists of Carroll, JoDaviess, Ogle, Stephenson, and Whiteside counties. Source: Illinois Department of Employment Security, 2012.
This situation will create an increasing competition for employers as the number of younger, skilled workers will be limited, not just within the five-county region, but also in the surrounding metro areas. Based on some of the findings of the 2012 Wage and Benefit Report, the five-county region may be at a competitive disadvantage since the surrounding metro areas offer a greater number and variety of employment opportunities, as well as higher compensation within a reasonable commuting distance. For example, the projected demand for production workers between 2008 and 2018 will be 196 openings per year while the surrounding metro areas are expected to have 2,398 openings per year13. Two meetings of regional manufacturers and resource providers held in January and February 2013 confirmed that competition for employees is a major issue for manufacturers in the five-county region. (See Appendix for Major Themes Identified by Regional Manufacturers and Resource Providers.) Given the expected demands for qualified replacement workers, it is essential that employers, educators, and local officials work together to address the worker skill gaps in order to ensure the Region’s continued economic competitiveness.
13Surrounding areas included Illinois WIA Area #3 (Boone and Winnebago counties), Illinois WIA Area #12 (Bureau, LaSalle, Lee and Putnam counties), Illinois WIA Area #13 (Henry, Mercer and Rock Island counties), Wisconsin Southwest Area (Grant, Green, Iowa, Lafayette, Richland and Rock counties), Iowa WIA #1 (Allamakee, Chickasaw, Clayton, Delaware, Dubuque, Fayette, Howard and Winneshiek counties), and Iowa WIA #9 (Clinton, Jackson, Muscatine and Scott counties).
Given the expected demands for qualified replacement workers, it is essential that employers, educators, and local officials work together to address the worker skill gaps in order to ensure the Region’s continued economic competitiveness.

NIU Center for Governmental Studies 23
Promoting Regional Prosperity in Northwest Illinois
Regional Overview
EDUCATIONAL CHARACTERISTICSEducational attainment often reflects the investment that a state or region has made in developing and attracting human capital. This indicator provides a broad assessment of a region’s workforce preparedness and economic potential, which are increasingly recognized as key to the ability of an area to attract and retain industry.
Educational attainment trends in the five-county region have mirrored those of the state and national trend, with the notable exception of college graduates (Figure 13). The share of persons living in the Region with a Bachelor’s degree or higher is nearly half of the state or national average and has declined steadily from 1990 to 2010. This presents a challenge to local businesses as they try to compete with other regions to recruit and retain professional, technical, and managerial positions. This creates a conundrum for economic development efforts in the five-county region since growing or attracting white collar employers is difficult because of the low number of college graduates, while attracting or retaining college graduates is equally challenging because of the limited job market.
The share of the population with some college education (but no degree) in the five-county region is roughly equivalent with the state. While this group may have the skills which are appropriate for some front-line production or supervisory occupations, a systematic assessment of the skill and potential of these individuals would be necessary to determine what education or training is needed in order to help them realize their job market potential. Based on the business interviews and focus groups conducted for this project, data indicated that most employers are struggling to find competent workers at all levels because applicants often have significant skills gaps regardless of their educational background.
Although high school completion rates remain a concern14, the decline in the number of high school graduates is probably more indicative of the growing proportion of high school graduates pursing education or training beyond high school. Unfortunately, information on residents with Associate degrees and technical certifications is not available for the entire time series, but the demographic forecasting firm, EASI Analytics, estimates that 9.2% of residents 25 years of age and older held an Associate or equivalent degree in 2010.
Figure 13: Education Attainment, as a Percent of the Population 25 Years of Age and Older
Attainment Level by Year Five-County Region U.S.
High School Graduate or higher
1990 86.2% 86.0% 84.8%
2000 81.9 81.4 80.4
2010 76.0 76.2 75.2
Some College (no degree)
1990 23.4 20.7 20.4
2000 29.9 27.6 21.0
2010 24.5 25.2 16.8
Bachelor’s Degree or higher
1990 16.2 30.1 27.7
2000 14.1 26.1 24.4
2010 11.6 21.0 20.3Source: U.S. Census Bureau, Census of Population and Housing, 1990, 2000, 2010.
14 “Education and the Economy: Boosting Illinois’s Economy by Improving High School Graduation Rates”, Alliance for Excellent Education. March, 2011. (http://www.all4ed.org/files/Illinois_seb.pdf)

24 NIU Center for Governmental StudiesRegional Overview
Promoting Regional Prosperity in Northwest Illinois
WORKFORCE COMMUTER TRENDSWorker commuting patterns can be indicators of the true size and scope of the regional labor markets, and in rural environments they can indicate the degree of economic interdependency with nearby metropolitan areas. The five-county region’s ability to pursue industrial development depends in part on the supply and mobility of workers.
Commuting patterns are best described as worker outflow (employed residents in the Region who work outside the area) and worker inflow (workers living in other areas but employed in the Region). The regional labor force consists of those who live in the five-county region but are employed outside the Region, those who are employed in the five-county region but live outside the Region, and those who both live and work in the Region. Labor market data for the five-county region indicates a substantial and growing number of workers commute to jobs outside the Region.
In 2010, out of 87,186 workers living in the five-county region, 65,032 actually lived and worked within the Region, resulting in a net outflow of 22,154 to jobs in the surrounding areas (Figure 14). The most popular destinations for those commuting to jobs outside the five-county region were Rockford (Winnebago County), the Chicago area (Cook, DeKalb, and DuPage counties), and Clinton County, Iowa. This outflow of employees suggests that the Region may lack the number and variety of job opportunities at competitive rates of compensation.
Figure 14: Inflow and Outflow of Available Workforce, Five-County Region
Five-County Region 2010 2006 2002Living in the Five-County Region 87,186 89,282 89,440
Living and Employed in the Five-County Region 65,032 67,709 69,377
Net Job Inflow (+) or Outflow (-) -22,154 -21,573 -20,063
Source: U.S. Census Bureau, Local Employment Dynamics, 2012 .
BUSINESS VITALITY TRENDSEconomic analyses are often based on changes in the number of businesses and jobs which are affected by many factors. This section examines business and employment trends by the size of the business with particular attention to those with fewer than 10 employees. It also considers business starts, closures, and migration and what they may mean for the economic vitality of the Region. Business starts are essential to a vibrant economy even though a majority of small businesses never become large employers15 .
Between 2000 and 2009, the employment data showed a decrease of 10.1% (a net loss of 11,201 jobs) in the five-county region (Figure 15)16. This trend is not a positive sign given that much of this decrease occurred during a period of national economic expansion. Resident firms (those owned or managed locally) with fewer than 10 employees were the sole sources of job growth, but that was insufficient to offset the job losses in larger firms. Some of the job growth in smaller firms is possibly due to downsizing by larger firms, outsourcing of work to self-employed contractors, or expansions by smaller firms.
15 “Norman Walzer and Brian Harger, “The Rural Midwest: How Is It Faring?”, Rural Research Report 23 (1). Macomb: Illinois Institute for Rural Affairs. 2012 (http://www.iira.org/pubs/publications/IIRA_RRR_740.pdf)16 The National Establishment Time Series (NETS) data presented in this section includes business establishments and employment. It groups establishments into non-commercial and commercial categories, with the latter group further subdivided into those within the Region, and branch sites of multi-units firms or otherwise owned or managed by firms outside of the county. The NETS data are reported by business location or place of employment rather than residence as in the case of the Census. It is possible for employment changes described by the NETS data to differ from those of other sources.

NIU Center for Governmental Studies 25
Promoting Regional Prosperity in Northwest Illinois
Regional Overview
The growth of locally owned small businesses, especially those classified as Self-Employed and Stage 1 (2 to 9 employees) is a positive sign because it suggests that entrepreneurs and small businesses had confidence in the local economy and were willing to hire. It may also suggest that resident firms, especially the smaller businesses, are more resilient in terms of job creation or retention, which underscores the importance of including them in local development strategies.
Figure 15: Employment Changes by Size and Ownership Class, 2000-2009
Five-County Region 2000 2009 Numeric Change
Percent Change
Total 110,437 99,236 -11,201 -10.1%
Non-commercial 15,075 14,082 -993 -6.6
Non-resident 24,675 18,963 -5,712 -23.1
Resident 70,687 66,191 -4,496 -6.4
Self-Employed (1) 4,100 5,564 1,464 35.7
Stage 1 (2-9) 20,170 20,540 370 1.8
Stage 2 (10-99) 23,024 21,340 -1,684 -7.3
Stage 3 (100-499) 11,936 9,003 -2,933 -24.6
Stage 4 (500+) 11,457 9,744 -1,713 -15.0Note: Resident establishments are either stand-alone businesses in the area or businesses with headquarters in the same state. These include non-profit entities such as hospitals and healthcare-related companies. Source: National Employment Time-Series (NETS) database, 2012.
Important to note are the major employment declines (2,933 employees) which occurred in Stage 3 companies (100-499 employees), with an additional decline of 1,713 employees in Stage 4 (500 and more employees) companies. Losses of this magnitude are difficult to replace with small businesses, so major attraction efforts are necessary. Nevertheless, the importance and vitality of small companies should be an integral part of the Region’s economic development strategy.
In terms of business activity, the five-county region gained 2,258 establishments (a 17.6% increase) between 2000 and 2009 (Figure 16). As with employment, the primary sources of business growth were resident firms with fewer than 10 employees. Although this increase more than offsets the loss of larger businesses, those losses reported among larger firms had a far greater impact on the regional economy because of the number of jobs lost from their departure. Non-commercial establishments (those engaged in health or social service facilities, public agencies, non-profits, or similar activities) also contributed to regional business growth, showing a net increase of 3.3% (37 establishments). While these are non-profits and sometimes overlooked in terms of economic contributions, they nevertheless are important employers in the Region.
The net increase in the number of resident establishments is especially important because most of them are small (fewer than 10 employees) but they are also responsible for much of the job growth (2,242 jobs) in the Region during the past decade. Small businesses are especially important in rural areas because they often provide services which are essential in retaining or attracting residents. Non-resident establishments reported a decline (-3.8%) and represent a relatively small proportion of business establishments, but they accounted for slightly more than half of the job losses in the Region. An important take away from this finding is the importance of starting and supporting locally owned and managed businesses (resident companies), which requires an environment that encourages business startups and entrepreneurship.

26 NIU Center for Governmental StudiesRegional Overview
Promoting Regional Prosperity in Northwest Illinois
Figure 16: Establishment Changes by Size and Ownership Class, 2000-2009
Five-County Region 2000 2009 Numeric Change
Percent Change
Total 12,832 15,090 2,258 17.6%
Non-commercial 1,119 1,156 37 3.3
Non-resident 559 538 -21 -3.8
Resident 11,154 13,396 2,242 20.1
Self-Employed (1) 4,100 5,564 1,464 35.7
Stage 1 (2-9) 5,943 6,823 880 14.8
Stage 2 (10-99) 1,029 944 -85 -8.3
Stage 3 (100-499) 69 54 -15 -21.7
Stage 4 (500+) 13 11 -2 -15.4Note: Resident establishments are either stand-alone businesses in the area or businesses with headquarters in the same state. These include non-profit entities such as hospitals and healthcare-related companies. Source: National Employment Time-Series (NETS) database, 2012.
The Region experienced considerable churning between 2000 and 2009 resulting in a net increase in the number of firms but an overall loss of jobs in the Region. Without question, part of the job losses can be attributed to the recession. Although business openings exceeded the number of business closings, they did not translate into job growth. Instead, nearly 13,000 jobs were lost because of business closures over those created by business openings (Figure 17).
Fewer businesses came into the Region than left (546 moving in versus 568 moving out), but the result was a net increase of 868 jobs. Most of this employment came from non-resident businesses and resident Stage 2 firms. This is consistent with other research touting the importance of Stage 2 company expansions17. This data suggests that the Region could benefit from an entrepreneurial and supportive business environment.
Jobs created by the expansion of existing firms exceeded by 875 those lost in businesses which contracted. Again, the contribution of these firms to job growth is a positive sign, but was insufficient to offset losses in other businesses. It is also important to note that much of the net job creation from business expansion came from Self-Employed and Stage 1 (2 to 9 employees) firms, further underscoring the contribution of smaller locally based businesses to the Region’s economic vitality.
17 Edward Lowe Foundation. (2012). “The Significance of Second Stage.” http://edwardlowe.org/edlowenetwp/wp-content/themes/implementpro-gram/downloads/infosheets/SecondStage.pdf
NIU Center for Governmental Studies 27
Promoting Regional Prosperity in Northwest Illinois
Regional Overview
Figure 17: Business “Churn” 2000-2009 in the Five-County Region
Figure 17. Business “Churn” 2000-2009 in the Five-County Region
Source: National Employment Time Series (NETS) database, www.youreconomy.org, 2012
Jobs: 3,893
Firms: 546
Stephenson
Carroll
Whiteside
Lee
Ogle
Moved In
Jobs: -3,025
Firms: -568
Moved Out
Jobs: -3,025
Firms: -568Expanded
Jobs: 28,973
Firms: 9,372Opened
Jobs: -41,917
Firms: -7,092Closed
Jobs: -26,750
Firms: -3,482Contracted
Source: National Employment Time Series (NETS) database, www.youreconomy.org, 2012.
Another key indicator of local business vitality is new business starts. An examination of business starts in the five-county region not only illustrates their contribution to the economy, but also reveals that the Region lags behind its peers within Illinois and surrounding states (Figure 18). This is troubling since smaller businesses are the primary source of new job growth, and the data reflected a period of economic expansion. Although more recent figures were not available at the local level, current national studies of new business starts have indicated a much lower level of business formation both during and after the recent recession.18
Figure 18: Business Starts by Region, 2004-2007
Area Name Business Starts Business Start Rate (% 2004 Firms)
Business Starts per 1,000 Population
Five-County Region 342 3.5% 1.61
Illinois Non-Metro Counties 2,947 4.0 1.74
Iowa Non-Metro Counties 3,783 4.6 2.81
Wisconsin Non-Metro Counties 1,605 6.1 3.12
Source: BizMiner, 2010.
Although the data do not offer further insights on the issue of business turnover, conducting further research would be worthwhile in order to determine the reasons why local companies open, close, expand, or migrate in and out of the Region, and also whether the local economic development climate and/or environment has any influence on these events. The five-county region must compete with the other regions across the country, so the local policies, incentives, and support services for start-ups and expansion must be suitable for local needs.
18 Kane, Tim. “The Collapse of Startups in Job Creation.” Hudson Institute. September, 2012. http://www.hudson.org/files/publications/Kane--TheCollapseofStartupsinJobCreation0912web.pdf

28 NIU Center for Governmental StudiesRegional Overview
Promoting Regional Prosperity in Northwest Illinois
SITE LOCATION FACTORSNorthwestern Illinois is well situated to attract manufacturing and other industries as reflected by the concentration of manufacturing firms and employment. Nevertheless, industrial location preferences change as new industries start and/or move from using and producing heavy products to focusing more on information technology, services, distribution logistics, or other outputs.
Thus, it is important to examine surveys of corporate executives and location consultants regarding the important factors considered in recommending and/or making location decisions. The basic sources for these analyses are the Annual Site Selection Consultants Survey and the Annual Survey of Corporate Executives conducted by Area Development Magazine19. The latest results reported in 2012 are for surveys conducted in 2011 and are used in this report.
The businesses surveyed by Area Development Magazine involved manufacturing firms (nearly half) and distribution and logistics operations (approximately 20.0%) with a substantial number of data center operations, financial services and insurance firms, and healthcare and retail sector businesses. The survey results represent the views of mid-size companies (100 to 499 employees) with approximately half of the survey responses from companies in this size category, which is appropriate for much of northwest Illinois.
The overall responses by corporate executives are not optimistic in terms of business expansions (40.0% plan to expand in the next two years), and the expected job creations will be relatively small (86.0% of the planned expansions will be less than 100 jobs). At the same time, however, the factors considered “very important or important” play to the strengths of the Region.
Specifically, highway accessibility ranked highest with 93.8% of the respondents rating it as “very important or important” in location decisions (Figure 19). The importance of highway access indicates that access to major markets is also a high priority. In the 2011 survey of corporate executives, access to major markets showed the highest increase in importance, moving from 17th place in 2010 to 9th in 2011. These results are positive for the northwestern Illinois region, with the possible exception of Carroll County. As noted previously, I-88 connects Sterling-Rock Falls, Dixon, and Rochelle to the Chicago and Quad Cities markets. A four-lane segment of U.S. Highway 20 connects Freeport to Rockford and then Chicago, Madison, and other large markets.
The second most important factor in location decisions was labor costs which was rated “very important or important” by 88.4% of the 2011 respondents. It is not only a question of labor costs, however, because availability of skilled labor was tied for second place at 88.4%. A review of the findings from the wage and benefit survey conducted in this project showed that wages in the Region were in many cases, if not most, competitive with the U.S. and/or the State of Illinois.
Northwestern Illinois is well situated to attract manufacturing and other industries as reflected by the concentration of manufacturing firms and employment.
19 “8th Annual Site Selection consultants Survey Results”. 2012. Halcyon Business Publications, downloaded at: http://www.areadevelopment.com/AnnualReports/Winter2012/8th-site-selection-consultants-RE-survey-results-28282888.shtml and “26th Annual Survey of Corporate Executives Results”. 2012. Halcyon Business Publications, downloaded at: http://www.areadevelopment.com/AnnualReports/Winter2012/26th-Corporate-Ex-ecutive-RE-survey-results-287123.shtml.

NIU Center for Governmental Studies 29
Promoting Regional Prosperity in Northwest Illinois
Regional Overview
Figure 19: 2011 Ranking of Site Location Factors
Ranking as “very important or important” Score1. Highway accessibility 93.8
2. Labor costs 88.4
3. Availability of skilled labor 88.4
4. Corporate tax rate 86.0
5. Occupancy or construction costs 85.9
6. State and local incentives 85.9
7. Energy availability and costs 84.8
8. Tax exemptions 83.6
9. Proximity to major markets 83.0
10. Low union profile 81.0
11. Inbound/outbound shipping costs 79.2
12. Right-to-work state 77.5
13. Availability of advanced ICT services 76.6
14. Environmental regulations 76.4
15. Available buildings 76.3
16. Available land 73.9
17. Expedited or “fast-track” permitting 72.4
18. Availability of long-term financing 70.0
19. Proximity to suppliers 67.8
20. Availability of unskilled labor 58.9
21. Accessibility to major airport 55.7
22. Raw materials availability 52.8
23. Training programs 50.6
24. Proximity to technical college/training 40.2
25. Railroad service 33.6
26. Waterway or ocean port accessibility 24.5Source: “26th Annual Survey of Corporate Executives,” 2012. Area Development Magazine. Halcyon Business Publications.
During interviews with local employers, they expressed some concern regarding the availability of career-ready labor with specialized skills. To help provide work experiences which make graduates more career ready, efforts are underway to collaborate with the Whiteside Area Career Center, secondary schools, and community colleges. If businesses participate in these programs to improve the labor availability issue, and some have made that commitment already, then the Region could be in a solid position to market itself to prospective businesses.
During interviews with local employers, they expressed some concern regarding the availability of career-ready labor with specialized skills.

30 NIU Center for Governmental StudiesRegional Overview
Promoting Regional Prosperity in Northwest Illinois
The availability of labor with previous experience in various industries was also confirmed in the underemployment survey showing that respondents are willing to change jobs at pay levels competitive with U.S. or state levels. Training programs, which reach out to these residents and help them build the skills to qualify for jobs at higher pay, will benefit the residents, businesses, and the entire Region.
The importance of skilled labor availability, however, also emphasizes the impact that population trends will have on the Region as the Baby Boom generation retires. Strong efforts are needed to encourage young adults to remain in the Region and/or return after they complete higher education. An effective program of entrepreneurship training or support agencies and/or internships could increase this age group’s attraction to the Region.
Occupancy and construction costs ranked fifth in importance among location factors with 85.9% reporting them as “very important or important.” Comparative business operation costs for the targeted industry clusters are included in this report. They indicate that the five-county region is very competitive with other locations in the Midwest and Northeast, especially with regard to site acquisition, property tax, and outbound shipping costs. Although the five-county region was found to be less competitive with similar locations in the Southeastern states, the Region maintained its advantage over other parts of the U.S. This is due to its central location and proximity to Chicago, which is a primary hub in the ground and air transportation network of the continental U.S.
The importance of quality of life considerations was asked in the 2011 survey but typically rated lower than factors affecting business operations directly. The quality of public schools and crime rates may be more important for companies relocating executives and staff. However, schools also have a direct impact on operations because they strongly affect the qualifications of the labor pool available for business expansions, which might be covered under labor availability.
The list of important location considerations also includes taxes, incentives, and other factors but they are farther down the list. These area characteristics can be affected by local policies or actions. Thus, it is important for governments in the Region to examine their competitiveness regarding incentives, tax rates, and other factors affecting the business operating environment. Local public officials working with business leaders can explore opportunities to design or modify programs to improve the business climate in the region.
While much of the Region seems reasonably well positioned in highway access and labor availability, aggressive marketing of the Region as a region is equally important. The I-88 Corridor web site (www.i88west.com) offers one opportunity to link the counties in the Region and make current information available in a timely way at reasonably low cost. The website might be reviewed and/or revised using the information generated in this report to appeal more specifically to the targeted industries. The Region could benefit from a review of current city websites to make sure that they have been updated and linked to the regional site. Likewise, the Region will benefit from an aggressive marketing plan to prospective businesses both in the U.S. and overseas.
While much of the Region seems reasonably well positioned in highway access and labor availability, aggressive marketing of the Region is equally important.
NIU Center for Governmental Studies 31
Promoting Regional Prosperity in Northwest Illinois
Machinery Manufacturing
INDUSTRY CLUSTER PROFILESThe industry cluster profiles presented in the next section are designed in the form of briefing documents which may be used by the economic development community to advise their clients and constituents on the importance and competitive advantages of these industries in the regional economy. The information can also be excerpted and used in economic development retention and recruiting efforts, highlighting the competitive advantages of the five-county region.
The profiles include general characteristics of the cluster and its constituent sectors, industry trends, and market opportunities. They also identify business opportunities for the five-county region based on gaps in the industry’s regional supply chain and provide a snapshot of the workforce requirements and occupational trends for the cluster. Finally, they compare the significant business operating cost factors of the Region with comparable locations in the U.S.
INDUSTRY CLUSTER PROFILE: MACHINERY MANUFACTURING
Cluster Summary
The Machinery Manufacturing industry cluster is comprised of a broad and diverse range of machinery or components used in agriculture, mining, construction, or manufacturing. Major products of companies in the five-county region include farm and construction machinery, metalworking and other manufacturing machinery, HVAC and commercial refrigeration equipment, and general-use machinery such as engines and pumps. While some products, such as tractors or heaters, are finished products, others like motors are components used in further production, and some are custom-designed for a specific manufacturing process. Machinery Manufacturing involves producing and assembling components including forging, machining, and welding activities which require skilled labor. Products have a high engineering content, and product design usually involves computer-aided design (CAD) systems, which are integrated directly into a computer-aided manufacturing (CAM) process.
Cluster Definition
An industry cluster is a group of similar industries which are closely connected by supply chains and/or similar labor pools located within the same region. The core strength of the Machinery Manufacturing industry cluster comes from the production of tools, structural components, and parts which are either sold as finished products or are incorporated into other manufactured goods. These core industries drive employment and inputs in other industries which supply them (e.g., agricultural, construction, and food processing machinery), as well as those which support the core industries by providing business finance and various industrial services and component manufacturers (Figure 20).

32 NIU Center for Governmental StudiesMachinery Manufacturing
Promoting Regional Prosperity in Northwest Illinois
Figure 20: Machinery Manufacturing, Cluster Components
Core Industries• Farm, lawn, garden machinery, & equipment mfg.• Construction machinery mfg.• Sawmill and woodworking machinery• Plastics and rubber industry machinery mfg.• Paper and textile industry machinery mfg.• Food product machinery mfg.• Comercial and service machinery mfg.
Support Industries• Machine shops• Metal heat treating• Metal coating and nonprecious engraving• Electroplating, anodizing, and coloring metal• Business finance• Intellectual property attorneys
Specialized Infrastructure• Clean Water Supply• Hazardous waste disposal• Wholesale and distribution services
Suppliers• Iron and steel forging• Nonferrous forging• Custom roll forming• Crown and closure mfg.• Metal stamping• Powder metallurgy parts mfg.• Bolt, nut, screw, rivet, and washer mfg.• Ball and roller bearing manufacturing• Fabricated pipe and pipe fitting mfg.• Industrial vavle mfg.• Fluid power valve mfg.
Consumers• Wholesale merchants and exporters• Military• Other industries
Figure 20. Machinery Manufacturing, Cluster Components
Source: The Purdue Center for Regional Development (cluster definitions), 2012.
Regional Overview
A larger 32-county region (hereafter referred to as the Reference Region) in northwest Illinois, northeast Iowa, and southwest Wisconsin including the five-county region was used to identify clusters for this project. This Reference Region had 757 establishments in 2010 and employed 26,182 people. The majority of businesses in this cluster are small in terms of employment (67.0% of firms have fewer than 10 employees) with the few large employers concentrated in the metropolitan areas (Figure 21).
The cluster also has had a consistently high concentration of employment in the five-county region with location quotients (LQ) of 2.9 in 2001, 3.9 in 2007, and 3.6 in 2010. Most industry subsectors are represented in the five-county region, with five subsectors having a strong presence in the Region based on the concentration of employment. The top five are listed in Figure 22.
Figure 21: Machinery Manufacturing: Firms by Employment Size Class
Rock Island
Scott
Clinton
Cedar
Jones
Delaware
Dubuque
Jackson
Jo Daviess Stephenson
Carroll
Whiteside
Henry
Stark
Bureau
Lee
Ogle
De Kalb
Boone
Le Salle
Putnam
Marshall
PeoriaWoodford
Tazewell
Winnebago
RockGreen
Lafayette
Iowa Dane
Grant
Figure 21. Machinery Manufacturing Firms by Employment Size Class
Self Employed
2 to 9 Employees
10 to 99 Employees
100 to 499 Employees
Over 500 Employees
Source: DecisionData.net, 2011.

NIU Center for Governmental Studies 33
Promoting Regional Prosperity in Northwest Illinois
Machinery Manufacturing33
Figure 22: Machinery Manufacturing: Subsectors Based on Employment Concentration
IndicatorLocation Quotient (2010)
Mechanical power transmission equipment manufacturing 21.0
Construction machinery manufacturing 18.9
Speed changer, industrial high-speed drive, and gear manufacturing 11.0
Fluid power process machinery manufacturing 8.5
Farm machinery and equipment manufacturing 7.7Source: IMPLAN, 2010.
In 2010, the five-county region had 60 establishments and employed 2,145 people in direct cluster jobs. This cluster has a higher than average concentration of economic activity , as defined by firm and employment LQ, in both the Reference Region and the five-county region, when compared to the nation’s economic activity in this cluster overall (Figure 23).
Figure 23: Machinery Manufacturing: Economic Activity Summary
Indicator Five-County Region Reference Region (32 Counties)
Number of Firms (2010) 60 757
Percent Change in Number of Firms (2007-2010) 9.8% -1.9%
Firm Location Quotient (LQ) 3.5 2.5
Employment (2010) 2,145 20,796
Percent Change in Employment (2007-2010) -22.8% -23.6%
Employment Location Quotient (LQ) 4.0 4.3Sources: U.S. Bureau of Labor Statistics, Quarterly Census of Employment and Wages (QCEW) and the Purdue Center for Regional Development (cluster definitions), 2012.
Although there are few large employers within the five-county region (only four firms have 100 or more employees), the surrounding metropolitan areas have major national and global companies in this industry cluster (Figure 24). Companies in the Region manufacture parts and components for the agricultural equipment, mining, and construction industries as well as finished products.
Location Quotients (LQ) are used to evaluate local development opportunities and find businesses which are especially suited for the Region. A LQ is the ratio of the employment percentage represented by a given industry in the county to the percentage which that industry represents in the state or a representative area of interest. A ratio greater than one indicates a higher local concentration and a likelihood of exports from the county; a ratio less than one may suggest that goods or services are being imported into the Region.

34 NIU Center for Governmental StudiesMachinery Manufacturing
Promoting Regional Prosperity in Northwest Illinois
Figure 24: Machinery Manufacturing: Major Employers, Five-County Region
Company Name # of Employees NAICS Industry Description* City
Sauer-Danfoss Company 150 Fluid Power Pump and Motor Manufacturing Freeport
Seaga Manufacturing, Inc. 131 Automatic Vending Machine Manufacturing Freeport
TNT Steel Industries, Inc. 128 All Other Industrial Machinery Manufacturing Freeport
IFH Group, Inc. 100 Fluid Power Pump and Motor Manufacturing Rock Falls
Frantz Manufacturing Company 95 Conveyor and Conveying Equipment Manufacturing Sterling
Star Forge, Inc. 80 Farm Machinery and Equipment Manufacturing Freeport
Imeco, Inc. 70Air-Conditioning and Warm Air Heating Equip. and Commercial and Industrial Refrigeration Equip. Manufacturing
Dixon
Astec Mobile Screens, Inc. 68 Conveyor and Conveying Equipment Manufacturing Sterling
Sewer Equipment Company of America 35 Other Commercial and Service Industry Machinery Manufacturing Chadwick
Bonnell Industries, Inc. 35 Construction Machinery Manufacturing Dixon*North American Industry Classification System. Source: Dun & Bradstreet, Inc., 2012.
Industry Trends20
Concentration of Industry Segments: Although the industry in general is fragmented, some segments are highly concentrated. In farm machinery production, the top four manufacturers have nearly 60.0% of the market. Other segments, such as industrial machinery and metalworking machinery, are fragmented.
Globalization of Multiple Sectors: U.S. machinery manufacturers face greater competition in export markets both from makers of sophisticated machinery (Japan and Germany) and from producers of low-cost, low-technology machinery (China and Mexico). The transfer of some U.S. manufacturing capacity to other countries has expanded the international trade in machinery.
More Computer Controls: Industrial applications are the largest consumers of computer chips. New versions of standard machinery feature advanced electronic applications. The greater use of computer components requires manufacturers to develop new engineering skills.
New Factory Designs Require Versatile Machinery: To respond to changing customer demand, more manufacturers prefer machinery which can easily be reconfigured in production work. With metalworking machinery, for example, manufacturers prefer machinery which can easily switch between different types of cutting heads.
20 Source: Hoovers, Inc., 2013. (www.hoovers.com)

NIU Center for Governmental Studies 35
Promoting Regional Prosperity in Northwest Illinois
Machinery Manufacturing
Market Opportunities21
Renewed Emphasis on Energy Efficiency: Unstable energy prices have created a need for more efficient industrial machinery. Deere, one of the world’s largest industrial machinery manufacturers, has recently expanded its line of fuel efficient six-cylinder tractors. Caterpillar uses lightweight materials such as titanium alloys to increase fuel efficiency for many models.
Improving Design Processes: New machinery design and manufacturing technologies have greatly improved machinery effectiveness and lowered costs. New CAD simulation software can provide a virtual prototype of the product or machine before a physical model is built and reduce costly product design and physical testing. Rapid prototyping, a new type of manufacturing process, is used to make small machinery parts.
Potential Growth in Selected Segments: Some segments of the Machinery Manufacturing industry have grown more rapidly than others. Government incentives could boost HVAC equipment sales, and farm machinery exports have the potential to increase as populations in developing countries grow. Recent technological innovations have increased the demand for the machinery used in extracting oil and gas from shale formations. Manufacturers who are able to operate in multiple niches may have advantages.
Supply Chain
The supply chain analysis provides insight into the value of supply chain inputs, the amount of inputs produced in a region for the industry clusters studied (represented in most cases by an absorption rate), and the stages along the supply chain which stand out as areas of competitive advantage. High absorption represents areas along the Machinery Manufacturing supply chain which allow the Region to capture the most value from a specific stage in the production or delivery of products and services within the supply chain.
Conversely, stages along the supply chain which are underperforming offer opportunities for business attraction and/or entrepreneurship. When reviewing data relating to industry inputs, comparing both the absorption rate and the total value of inputs is important since services or components which maintain a high absorption rate may be of low value to the regional economy. Similarly, certain inputs, regardless of value or absorption, may be of high strategic importance to the Region in its efforts to build a stronger industry cluster.
21 Source: Hoovers, Inc., 2013. (www.hoovers.com)
Supply Chain
An essential component for an industry cluster is the local supply chain. While not all inputs (goods or services) which an industry cluster needs can be produced in the local economy, it is desirable to meet as many of the cluster’s needs locally as possible. This analysis reveals the source and amount of purchases among the unique niches within an industry. By identifying the total industry economic outputs and areas where goods and services are purchased from outside the regional economy, one can better determine which areas of the industry supply chains are strongest, as well as those which present the best opportunities for growth within the five-county region.

36 NIU Center for Governmental StudiesMachinery Manufacturing
Promoting Regional Prosperity in Northwest Illinois
The supply chain information provided here indicates the flows of trade which support Machinery Manufacturing-related industries both within the five-county region and outside the Region. The key sectors which may be appropriate targets for expansion are imports (gaps) from outside the Region, but still within the industry cluster. These gaps are then analyzed in terms of regional strengths and potential areas for targeting and support and are placed into a supply chain model in order to determine the stages of the supply chain with the strongest regional presence. To fully develop a Machinery Manufacturing cluster, the Region can make the most progress by focusing on sectors which do not yet have a strong regional presence, but which have significant development potential (Figure 25).
Figure 25: Machinery Manufacturing: Largest Supply Chain Gaps
Industry Regional Supply Gap
Regional Inputs
Gross Inputs
% Purchased Outside Region
Other engine equipment -$54,614,232 $319,343 $54,933,575 99.4%
Motor vehicle parts -$38,664,092 364,104 39,028,196 99.1
Valves and fittings other than plumbing -$19,486,760 202,006 19,688,766 99.0
Fluid power process machinery -$16,939,335 265,524 17,204,859 98.5
Motor and generators -$16,230,766 11,850 16,242,616 99.9
Machine shops -$8,341,666 17,745 8,359,411 99.8
Speed changers, industrial high-speed drives, and gears -$8,265,635 111,003 8,376,638 99.0
Relay and industrial controls -$8,014,944 12,326 8,027,271 99.9Source: IMPLAN, 2010
For example, the regional Machinery Manufacturing cluster requires $54.9 million in inputs (i.e., the products or services which are required to create a finished product) from the “other engine equipment” industry. However, only $319,000 of the required inputs from this industry are produced within the Region with the balance being purchased from outside the five-county region. This indicates an opportunity for an existing firm or new business to satisfy the regional demand for these products.
The supply chain gap for “machine shops” also presents a unique opportunity for existing business development. In general, machine shops produce a wide variety of parts or components based on customer requirements. Since most machine shops specialize in low-volume, fast-turnaround orders, they are quite versatile and are limited only by their production equipment and the skills and capabilities of their workers. Therefore, a regional initiative aimed at expanding the capabilities of machine shops could help meet the supply chain needs of several key manufacturing sectors.
Regional Supply Gap
Difference between Gross and Regional Inputs: a large gap value indicates that a large amount of inputs are imported into the Region, rather than produced within the five-county region.
Regional Inputs
The dollar value of gross inputs which are produced within the Region.
Gross Inputs
Total dollar amount of inputs used by the industry within each sector.
Other Engine Equipment
(NAICS Sector 33631)
Firms in this industry manufacture internal combustion engines (except automotive gasoline and aircraft). Subsectors include the following: » Diesel and semi-diesel engines » Gasoline engines (except aircraft, automotive, truck)
» Natural gas engines » Governors

NIU Center for Governmental Studies 37
Promoting Regional Prosperity in Northwest Illinois
Machinery Manufacturing
Workforce Requirements, Supply and Demand
Even as employment in Machinery Manufacturing has declined during the past decades (a trend that is projected to continue) the supply of potential new workers is comparatively low because of demographic trends and the propensity of younger workers to pursue careers outside of manufacturing. More than half of the workers employed in the industry in 2010 were 45 years of age or older, with only 6.6% under the age of 25 (Figure 26).
Figure 26: Machinery Manufacturing: Employment and Wages by Age Group, Five-County Region, 2010
Age Group Employment (% of Total) Average Annual Wage
Under 25 Years 6.6% $23,816
25-44 Years 39.6 42,032
45-64 Years 51.2 51,818
65 Years & Older 2.7 55,826
Total/Average 100.0% $39,372
Source: U.S. Bureau of Labor Statistics, Quarterly Census of Employment and Wages, 2011.
Over 60.0% of the employment, as well as over 50.0% of the wages, in the Machinery Manufacturing cluster are concentrated in Production; Installation, Maintenance, and Repair; or Transportation and Material Moving occupations (Figure 27). The production and the related employment classifications account for the largest single share of the jobs in the five-county region. Ensuring that appropriately skilled production workers are available at competitive rates of compensation will be critical to maintaining the Region’s Manufacturing sector22.
Figure 27: Machinery Manufacturing: Staffing Patterns, Five-County Region
Occupational Classification Share of Employment
Share of Wages
Average Annual Wage
Production 55.7% 44.0% $36,253
Office and Administrative Support 10.5 8.3 36,227
Architecture and Engineering 8.5 12.1 65,117
Management 5.7 13.9 111,236
Installation, Maintenance, and Repair 4.2 4.0 44,311
Transportation and Material Moving 4.2 2.7 30,352
Business and Financial Operations 3.7 5.0 62,106
Sales and Related Occupations 3.4 5.1 69,258
Computer and Mathematical 1.5 2.3 68,343
Construction and Extraction 1.1 1.1 44,096 Sources: U.S. Bureau of Labor Statistics, Quarterly Census of Employment and Wages (QCEW) and the Purdue Center for Regional Development (cluster definitions), 2012.
22 In 2008, Production; Installation, Maintenance, and Repair; and Transportation and Material Moving occupations accounted for 23.0% of all occupational employment in Workforce Investment Board Region #4.

38 NIU Center for Governmental StudiesMachinery Manufacturing
Promoting Regional Prosperity in Northwest Illinois
The challenge for employers is the looming demand for replacement workers as older workers retire. According to the Illinois Department of Employment Security, 196 openings for production workers will become available annually between 2008 and 2018, mainly from the demand for replacement workers (Figure 28).
Figure 28: Occupational Employment, Projected Demand by Worker Classification, Workforce Investment Board Region #4, 2008-2018*
Occupational Classification Employment Employment Change 2008-2018 Average Annual Job Openings
2008 2018 Number % Growth Replacement Total
Production 9,653 8,806 -847 -8.8 5 191 196
Transportation and Material Moving 6,297 6,479 182 2.9 25 153 178
Management 7,959 7,693 -266 -3.3 13 123 136
Architecture and Engineering 1,116 1,073 -43 -3.9 3 25 28
Installation, Maintenance, and Repair 2,798 2,930 132 4.7 15 55 70
*Workforce Investment Board (WIB) Region #4 consists of Carroll, JoDaviess, Ogle, Stephenson, and Whiteside counties. Source: Illinois Department of Employment Security, 2012.
Compensation levels are a concern for local businesses because the surrounding metro areas compete for workers with specific skills or experience23. For example, the projected demand for production workers in the metro areas around the five-county region is estimated to be 2,398 openings per year between 2008 and 201824. The estimated average annual wage for production workers is $36,20025. While this matches the wages for the five-county region, the surrounding metro areas have the added advantage of a greater number of employers and more job opportunities from which to choose within a reasonable commuting distance. Given the expected intense competition for skilled workers, companies will have to monitor compensation trends in order to recruit and to retain qualified employees.
Business Operating Costs
Annual operating costs are provided solely for comparisons. Only major geographically variable operating costs are included for a series of seven county sites in the U.S. These consist of the five counties in the Region along with two additional counties which have significant concentrations of businesses in the Machinery Manufacturing cluster. One of the two out-of-state counties is located in the Midwest region, and the second is located in an alternative U.S. region. Costs which did not vary significantly with geography, including relocation and start-up expenses, were not considered (Figure 29).
23 Northern Illinois University, Center for Governmental Studies, “Promoting Regional Prosperity in Northwest Illinois: Wage and Benefit Report”, August, 2012, p. 23.24 Source: Illinois Department of Employment Security, 2012.25 Sources: U.S. Bureau of Labor Statistics, Quarterly Census of Employment and Wages (QCEW) and the Purdue Center for Regional Develop-ment (cluster definitions), 2012.

NIU Center for Governmental Studies 39
Promoting Regional Prosperity in Northwest Illinois
Machinery Manufacturing
Figure 29: Machine Manufacturing: Total Geographically Variable Operating Cost Comparison
County Name Total Annual Operating Costs
Snohomish County, WA $18,965,960
Racine County, WI 15,678,227
Stephenson County, IL 15,436,093
Ogle County, IL 15,386,337
Whiteside County, IL 15,317,486
Lee County, IL 15,125,935
Carroll County, IL 15,053,989Source: The Boyd Company, Inc., 2012.
The five-county region was the most competitive with its peers in terms of labor costs and site acquisition and property tax costs. The Region was also more cost-effective in terms of shipping costs versus the comparative counties, highlighting the importance of northwest Illinois’ transportation assets and its access to national and global markets.
Key Takeaways
» The Machinery Manufacturing cluster in the Region has a concentration of firms which is 3.5 times the national average, and an employment concentration that is 4.0 times the national average. The Region has maintained these advantages despite the impact of the recent recession and the long-term decline in the number of manufacturing businesses and employment.
» The Machinery Manufacturing cluster is diverse and several subsectors are represented in the five-county region. Some have the potential for further development based on supply chain relationships with other industries in the Region and the surrounding metro areas.
» Opportunities likely exist for companies to develop new supply chain relationships with companies in the nearby metro areas or outside the industries that they already serve, but more research is needed to identify and develop those opportunities.
» The supply chain gap for machine shops presents a unique opportunity for the expansion of existing businesses. A regional initiative aimed at expanding the capabilities of machine shops could benefit the supply chain needs of several key Machinery Manufacturing sectors.
» Small niche manufacturers (such as machine shops) can be supported as part of a strategy to support small businesses and entrepreneurship in the Region.
» Production and related employment accounts for 23.0% of the jobs in the Region. Ensuring that appropriately skilled production workers are available at competitive compensation rates will be critical to maintaining the Region’s Machinery Manufacturing cluster.
» The expected wave of retiring Baby Boomers will create most of the demand for new workers, despite static, or even declining, overall employment in the industry. Other manufacturing sectors will experience the same challenges making the competition for workers even more intense.
Costs of Doing Business
Since most businesses operate in a real-time global marketplace, their focus is on maintaining a comparative advantage through sourcing and supplying products profitably. Cost components such as labor, taxes, real estate, and utilities are the key measures which most companies use to decide where to locate or expand their operations.
Operating cost analysis focuses on those key geographically variable cost elements which are considered to be the most pivotal within the corporate site selection process and overall target industry competitiveness.

40 NIU Center for Governmental StudiesFabricated Metal Products Manufacturing
Promoting Regional Prosperity in Northwest Illinois
INDUSTRY CLUSTER PROFILE: FABRICATED METAL PRODUCTS MANUFACTURING
Cluster Summary
The Fabricated Metal Products industry cluster transforms purchased metals into intermediate or end-use products through forging, stamping, bending, forming, welding, machining, and/or assembly. Because of the specialized processes involved for individual parts, most companies make a limited range of products. Major segments of the Fabricated Metal Products Manufacturing industry cluster include architectural and structural products; forging and stamping; machining; cutlery, tools, and kitchenware; boilers, tanks, and containers; hardware; springs and wires; coating, plating, and polishing; and valve and pipe manufacturing. The five-county region, as well as the surrounding metro area, has a strong and well-established presence in these industries, and many products or components supply other important industries in the Region, such as motor vehicles, aerospace industrial machinery, and appliance manufacturing.
Cluster Definition
An industry cluster is a group of similar industries which are closely connected by supply chains and/or similar labor pools located within the same region. The core strength of the Fabricated Metal Products industry cluster comes from the production of tools, structural components, and parts which are either sold as finished products or are incorporated into other manufactured goods. These core industries drive employment and inputs in other industries which supply them (e.g., metal forging, forming or stamping, crown, closure, fastener, and valve manufacturing), as well as those which support the core industries by providing business finance and industrial process services (Figure 30).
Figure 30: Fabricated Metal Products Manufacturing, Cluster Components
Core Industries
Support Industries• Metal heat treating• Metal coating and nonprecious engraving• Electroplating, anodizing, and coloring metal• Intellectual property attorneys
Figure 30. Fabricated Metal Products Manufacturing, Cluster Components
• Cutlery and flatware mfg.• Saw blade and handsaw mfg.• Prefabricated metal buildings and components• Fabricated structural metal mfg.• Plate work and sheet metal work mfg.• Metal tank, can, and container mfg.• Spring and other fabricated wire product mfg.• Enameled iron and metal sanotaru ware mfg.
Specialized Infrastructure• Clean Water Supply• Hazardous wast disposal• Wholesale and distribution services
Suppliers• Iron and steel forging• Nonferrous forging• Custom roll forming• Crown and closure mfg.• Metal stamping• Bolt, nut, screw, rivet, and washer mfg.• Ball and roller bearing manufacturing• Fabricated pipe and pipe fitting mfg.• Industrial valve mfg.
Consumers• Wholesale merchants and exporters• Military• Other industries
Source: The Purdue Center for Regional Development (cluster definitions), 2012.

NIU Center for Governmental Studies 41
Promoting Regional Prosperity in Northwest Illinois
Fabricated Metal Products Manufacturing
Regional Overview
The Fabricated Metal Products Manufacturing cluster in the Reference Region, a group of 32 counties in northwest Illinois, northeast Iowa, and southwest Wisconsin which includes the five-county region, had 806 establishments in 2010 and employed 20,796 people. The majority of businesses in this cluster are small in terms of employment (63.0% of firms have fewer than 10 employees) with the few large employers concentrated in the metropolitan areas (Figure 31).
The cluster also has had a consistently higher average, but declining, concentration of employment in the five-county region with location quotients (LQ) of 4.7 in 2001, 4.0 in 2007, and 3.8 in 2010. Not all of the industries in the cluster are represented in the five-county region, and some have a weak presence. There are 14 industry subsectors in the cluster which have a strong presence in the Region based on concentration of employment (Figure 32).
Figure 32: Fabricated Metal Products Manufacturing: Subsectors Based on Employment Concentration
Indicator Location Quotient (2010)Crown and closure manufacturing and metal stamping 21.6
Plumbing fixture fitting and trim manufacturing 7.7
All other forging, stamping, and sintering 5.9
Ornamental and architectural metal products manufacturing 5.1
Turned product and screw, nut, and bolt manufacturing 4.8
Ball and roller bearing manufacturing 4.4
Spring and wire product manufacturing 4.1
Metal can, box, and other metal container (light gauge) manufacturing 3.9
Coating, engraving, heat treating, and allied activities 3.9
Other fabricated metal manufacturing 3.8
Valve and fittings other than plumbing manufacturing 3.0
Plate work and fabricated structural product manufacturing 1.7
Nonferrous metal foundries 1.3
Hand tool manufacturing 1.2
Source: IMPLAN, 2010.
Figure 31: Fabricated Metal Products Manufacturing: Firms by Employment Size Category
Figure 31. Firms in the Fabricated Metal Products Manufacturing Cluster by Employment Size Category
Source: DecisionData.net, 2011.
Self Employed
2 to 9 Employees
10 to 99 Employees
100 to 499 Employees
Over 500 Employees
Rock Island
Scott
Clinton
Cedar
Jones
Delaware
Dubuque
Jackson
Jo DaviessStephenson
Carroll
Whiteside
Henry
Stark
Bureau
Lee
Ogle
De Kalb
Boone
Le Salle
Putnam
Marshall
Peoria Woodford
Tazewell
Winnebago
RockGreen
Lafayette
Iowa Dane
Grant

42 NIU Center for Governmental StudiesFabricated Metal Products Manufacturing
Promoting Regional Prosperity in Northwest Illinois
In the five-county region, the cluster includes 75 establishments and employed 2,539 people in direct cluster jobs in 2010. This cluster has a higher than average concentration of economic activity, as defined by firm and employment LQ, in both the Reference Region and the five-county region, when compared to the nation’s economic activity in this cluster overall (Figure 33).
Figure 33: Fabricated Metal Products Manufacturing: Economic Activity Summary
Indicator Five-County Region
Reference Region (32 Counties)
Number of Firms (2010) 75 806
Percent Change in Number of Firms (2007-2010) 5.6 -1.9
Firm Location Quotient (LQ) 2.4 2.0
Employment (2010) 2,539 20,796
Percent Change in Employment (2007-2010) -24.7 -23.6
Employment Location Quotient (LQ) 3.8 1.9Sources: U.S. Bureau of Labor Statistics, Quarterly Census of Employment and Wages (QCEW) and the Purdue Center for Regional Development (cluster definitions), 2012.
Although few large employers are within the five-county region (only seven firms have 100 or more employees), the surrounding metropolitan areas host major national and global companies in this industry cluster (Figure 34). Companies usually manufacture metal parts or components used by customers, such as the automotive, aerospace, industrial machinery, agricultural implement, and construction industries. Some companies produce finished products like building components, tools, and industrial valves.
Location Quotients (LQ) are used to evaluate local development opportunities and find businesses which are especially suited for the Region. A LQ is the ratio of the employment percentage represented by a given industry in the county to the percentage which that industry represents in the state or a representative area of interest. A ratio greater than one indicates a higher local concentration and a likelihood of exports from the county; a ratio less than one may suggest that goods or services are being imported into the Region.

NIU Center for Governmental Studies 43
Promoting Regional Prosperity in Northwest Illinois
Fabricated Metal Products Manufacturing
Figure 34: Fabricated Metal Products Manufacturing: Major Employers, Five-County Region
Company Name # of Employees NAICS Industry Description* City
Neisewander Enterprises, Inc. (Raynor Mfg. Company) 1,000 Metal Window and Door Manufacturing Dixon
Elkay Manufacturing Company 300 Plate Work Manufacturing Savanna
Metform LLC 190 Iron and Steel Forging Savanna
Irwin Industrial Tool Company 150 Hand and Edge Tool Manufacturing Freeport
Swenson Spreader LLC 125 Sheet Metal Work Manufacturing Lindenwood
Anchor Coupling, Inc. 100 Fluid Power Valve and Hose Fitting Manufacturing Dixon
Modern Plating Corporation 100Electroplating, Plating, Polishing, Anodizing, and Coloring
Freeport
Anchor-Harvey Components LLC 97 Nonferrous Forging Freeport
J T Cullen Company, Inc. 70 Plate Work Manufacturing Fulton *North American Industry Classification System. Source: Dun & Bradstreet, Inc., 2012.
Industry Trends26
Varying Demand Cycles: The demand for metal products is affected by varying needs in customer industries. Production of industrial equipment can vary 10.0% to 20.0% in a year. Spending in the aerospace, automotive, and construction sectors is also volatile.
Customers Moving Overseas: Many metal products customers, such as auto companies and appliance manufacturers, have moved their production abroad to take advantage of lower labor costs and to position themselves to sell products to a growing international market, pushing suppliers to move with them or face losing business to foreign manufacturers (especially if they use just-in-time inventory management). However, the recent growth in labor and transportation costs in key foreign production sites, such as China, may blunt this effect and return some manufacturing back to the U.S.
New Powder Metal Applications: Powder metal parts are often cheaper to produce and, in some cases, are lighter or have better performance characteristics than traditional metal parts. The light weight of powder metal parts is especially attractive in automotive applications.
Market Opportunities27
New Manufacturing Materials: New metal alloys with desirable physical properties allow manufacturers to upgrade existing products and introduce new ones. Such alloys have been especially useful for products which must operate in extreme conditions, such as inside engines and in cooling applications. However, the use of new materials requires a large prior investment in engineering and testing.
26 Source: Hoovers, Inc., 2013. (www.hoovers.com)27 Source: Hoovers, Inc., 2013. (www.hoovers.com)

44 NIU Center for Governmental StudiesFabricated Metal Products Manufacturing
Promoting Regional Prosperity in Northwest Illinois
Greater Complexity of Final Products: As machinery and other products become more sophisticated in function and design, the parts used to build them typically also become more complicated, requiring more engineering and tighter manufacturing specifications. Manufacturers who can invest in modern fabricating technology can increase market share.
New Production Methods: New rapid prototyping methods produce delicate parts good for sizing and ergonomic studies. Lasers have increasing applications in metal parts manufacturing, such as laser cutters used in sheet metal industries. New fabrication technology for metal parts, like laser-assisted arc welding, can rapidly produce part molds directly from CAD files, thus bypassing the traditional need for tooling. New metal casting technology can reduce the time from initial design to production.
Increased Customer Outsourcing: Equipment manufacturers are increasingly outsourcing the production of parts that they formerly made themselves. Much of the sheet steel and steel plate bought by manufacturers from metal service centers is processed by a fabricator under an outsourcing arrangement before delivery.
Nonmetal Product Line Additions: Many companies are expanding their product line, sometimes adding nonmetal items. Manufacturers of metal windows and doors may also manufacture vinyl and wooden products. Manufacturers of industrial metal valves may also produce plastic versions for certain applications.
Supply Chain
The supply chain analysis provides insight into the value of supply chain inputs, the amount of inputs produced in a region for the industry clusters studied (represented in most cases by an absorption rate), and the stages along the supply chain which stand out as areas of competitive advantage. High absorption represents areas along the Fabricated Metals Products Manufacturing supply chain which allow the Region to capture the most value from a specific stage in the production or delivery of products and services within the supply chain. Several of the clusters are represented by the same supplier types because they have similar supplier needs.
Conversely, stages along the supply chain which are underperforming offer opportunities for business attraction and/or entrepreneurship. When reviewing data relating to industry inputs, comparing both the absorption rate and the total value of inputs is important because certain services or components which maintain a high absorption rate may be of low value to the regional economy. Similarly, certain inputs, regardless of value or absorption, may be of high strategic importance to the Region in its efforts to build a stronger industry cluster.
Supply Chain
An essential component for an industry cluster is the local supply chain. While not all inputs (goods or services) which an industry cluster needs can be produced in the local economy, it is desirable to meet as many of the cluster’s needs locally as possible. This analysis reveals the source and amount of purchases among the unique niches within an industry. By identifying the total industry economic outputs and areas where goods and services are purchased from outside the regional economy, one may be in a better position to determine which areas of the industry supply chains are strongest, as well as those which present the best opportunities for growth within the five-county region.

NIU Center for Governmental Studies 45
Promoting Regional Prosperity in Northwest Illinois
Fabricated Metal Products Manufacturing
The supply chain information provided indicates the flows of trade which support the Fabricated Metal Products Manufacturing-related cluster both within the five-county region and outside the Region. The key sectors which may be appropriate targets for expansion are imports (gaps) from outside the Region, but still within the industry. These gaps are then analyzed in terms of regional strengths and potential areas for targeting and support and are placed into a supply chain model in order to determine the stages of the supply chain with the strongest regional presence. To fully develop a Fabricated Metals Products Manufacturing cluster, the five-county region can make the most progress by focusing on sectors which do not yet have a strong regional presence, but which have significant development potential (Figure 35).
Figure 35: Fabricated Metal Products Manufacturing: Largest Supply Chain Gaps
Industry Regional Supply Gap
Regional Inputs
Gross Inputs
% Purchased from Outside the Region
Aluminum products from purchased aluminum -$15,549,126 $12,038 $15,561,164 99.9%
Machined shops -$8,666,884 $18,437 $8,685,322 99.8
Steel products from purchased steel -$7,404,186 $216,558 $7,620,744 97.2
Motor vehicle parts -$6,788,906 $63,932 $6,852,838 99.1
Coated, engraved, heat treated products -$5,101,853 $104,318 $5,206,171 98.0
Turned products and screws, nuts, and bolts -$4,729,290 $160,638 $4,889,928 96.7
Plates and fabricated structural products -$3,855,082 $117,477 $3,972,559 97.0
Source: IMPLAN, 2010.
For example, the regional Fabricated Metals Products Manufacturing cluster requires $15.5 million in inputs (i.e., the products or services required to create a finished product) from the “aluminum products from purchased aluminum” industry. However, only $12,000 of the required inputs from this industry is produced within the region, with the balance being purchased from outside the five-county region. This indicates that there may be an opportunity for an existing firm or new business to satisfy the regional demand for these products.
The supply chain gap for “machine shops” also presents a unique opportunity for existing business development. In general, machine shops produce a wide variety of parts or components based on customer requirements. Since most specialize in low-volume, fast-turnaround orders, they are quite versatile and are only limited by their production equipment and the skills and capabilities of their workers. Therefore, a regional initiative aimed at expanding the capabilities of machine shops could benefit the supply chain needs of several key manufacturing sectors.
Aluminum products from purchased aluminum (NAICS Sectors 331315, 331316, 331319)
Subsectors include the following: » Aluminum flat rolled sheet, plate, foil, and welded tube
» Extruded aluminum rod, bar, pipe, tube, and tube blooms or drawing tube
» Nails made in aluminum wire drawing plants
» Wire, bare, or cable made in aluminum wire drawing plants
Regional Supply Gap
Difference between Gross and Regional Inputs: a large gap value indicates that a large amount of inputs are imported into the Region, rather than produced within the five-county region.
Regional Inputs
The dollar value of gross inputs which are produced within the Region.
Gross Inputs
Total dollar amount of inputs used by the industry within each sector.

46 NIU Center for Governmental StudiesFabricated Metal Products Manufacturing
Promoting Regional Prosperity in Northwest Illinois
Workforce Requirements, Supply and Demand
Even as employment in the cluster has declined during the past decades (a trend that is projected to continue) the supply of potential new workers is comparatively low because of demographic trends and the propensity of younger workers to pursue careers outside of manufacturing. Over half of workers employed in the industry in 2010 were 45 year of age or older, with only 5.9% under the age of 25 (Figure 36).
Figure 36: Fabricated Metal Products Manufacturing: Employment by Age Group, Five-County Region, 2010
Age Group Employment (Percent of Total)
Average Annual Wage
Under 25 Years 5.9% $16,658
25-44 Years 35.9 41,135
45-64 Years 55.2 53,686
65 Years & Older 2.9 71,042Source: U.S. Bureau of Labor Statistics, Quarterly Census of Employment and Wages, 2011.
Over two-thirds of the employment, as well as 59.3% of the wages, in the Fabricated Metal Products Manufacturing cluster are concentrated in Production; Installation, Maintenance, and Repair; or Transportation and Material Moving occupations (Figure 37). The production and related employment classification account for the largest single share of the jobs in the Region. Ensuring that appropriately skilled production workers are available at competitive rates of compensation will be critical to maintaining the Region’s manufacturing sector28.
Figure 37: Fabricated Metal Products Manufacturing: Staffing Patterns, Five-County Region
Occupational Classification Share of Employment
Share of Wages
Average Annual Wage
Production 61.5% 51.3% $34,348
Office and Administrative Support 10.5 9.0 35,023
Transportation and Material Moving 5.9 4.1 28,851
Management 5.2 13.8 107,876
Architecture and Engineering 3.9 6.1 64,279
Installation, Maintenance, and Repair 3.7 3.9 42,617
Business and Financial Operations 2.8 3.9 59,039
Sales and Related Occupations 2.4 3.8 64,522
Construction and Extraction 2.0 2.1 43,909Sources: U.S. Bureau of Labor Statistics, Quarterly Census of Employment and Wages (QCEW) and the Purdue Center for Regional Development (cluster definitions), 2012.
The challenge for employers is the looming demand for replacement workers as older workers retire. The Illinois Department of Employment Security estimates that nearly 200 openings for production workers will become available per year between 2008 and 2018, most of this resulting from the demand for replacement workers (Figure 38). 28 In 2008, Production; Installation, Maintenance, Repair; or Transportation and Material Moving occupations accounted for 23.0% of all occupational employment in Workforce Investment Board Region #4.

NIU Center for Governmental Studies 47
Promoting Regional Prosperity in Northwest Illinois
Fabricated Metal Products Manufacturing
Figure 38: Occupational Employment, Projected Demand by Worker Classification Workforce Investment Board Region #4, 2008-2018*
Occupational Classification Employment Employment Change 2008-2018
Average Annual Job Openings
2008 2018 Number % Growth Replacement Total
Production 9,653 8,806 -847 -8.8 5 191 196
Office and Administrative Support 11,256 11,371 115 1.0 46 242 288
Transportation and Material Moving 6,297 6,479 182 2.9 25 153 178
Management 7,959 7,693 -266 -3.3 13 123 136
Architecture and Engineering 1,116 1,073 -43 -3.9 3 25 28
Installation, Maintenance, and Repair 2,798 2,930 132 4.7 15 55 70
Business and Financial Operations 3,110 3,385 275 8.8 28 64 92
Sales and Related Occupations 7,815 8,049 234 3.0 27 241 268
Construction and Extraction 4,047 4,188 141 3.5 16 68 84*Workforce Investment Board (WIB) Region #4 consists of Carroll, JoDaviess, Ogle, Stephenson, and Whiteside counties. Source: Illinois Department of Employment Security, 2012.
Because of the competition with surrounding metro areas for workers with specific skills or experience, compensation levels are a concern for local businesses29. For example, the projected demand for production workers in the metro areas around the five-county region is estimated to be 2,398 openings per year between 2008 and 201830. The estimated average annual wage for production workers is $36,20031. While this matches the wages for the five-county region, the surrounding metro areas have the added advantage of a greater number of employers and more job opportunities from which to choose within a reasonable commuting distance. Given the expected intense competition for skilled workers, companies will need to monitor compensation trends in order to recruit and to retain qualified employees.
Business Operating Costs
Annual operating costs are provided solely for comparisons. Only major geographically variable operating costs are included for a series of seven county sites in the U.S. These consist of the five counties in the Region along with two additional counties which have significant concentrations of businesses in the Fabricated Metal Products Manufacturing cluster. One of the two out-of-state counties is located in the Midwest region, and the second is located in an alternative U.S. region. Costs which did not vary significantly with geography, including relocation and start-up expenses, were not considered (Figure 39).
29 Northern Illinois University, Center for Governmental Studies, “Promoting Regional Prosperity in Northwest Illinois: Wage and Benefit Report”, August, 2012, p.23.30 Source: Illinois Department of Employment Security, 2012.31 Sources: U.S. Bureau of Labor Statistics, Quarterly Census of Employment and Wages (QCEW) and the Purdue Center for Regional Develop-ment (cluster definitions), 2012.

48 NIU Center for Governmental StudiesFabricated Metal Products Manufacturing
Promoting Regional Prosperity in Northwest Illinois
Figure 39: Fabricated Metal Products Manufacturing: Total Geographically Variable Operating Cost Comparison
County Name Total Annual Operating Costs
Medina County, OH $17,904,627
Whiteside County, IL 17,195,799
Ogle County, IL 17,192,102
Stephenson County, IL 17,094,735
Lee County, IL 16,900,999
Carroll County, IL 16,857,808
Anderson County, SC 15,826,732Source: The Boyd Company, Inc., 2012.
The five-county region was the most competitive with its peers in terms of shipping costs versus the comparative counties, highlighting the importance of northwest Illinois’ transportation assets and its access to national and global markets. The Region was also cost competitive with its peers in the Great Lakes region in terms of labor costs and site acquisition and property tax costs.
Key Takeaways
» The Fabricated Metal Products Manufacturing cluster in the five-county region has a concentration of firms which is 2.4 times the national average, and an employment concentration which is 3.8 times the national average.
» The competitive advantage has declined in the past, possibly due to the effects of the recent recession and a long-term term decline in manufacturing. Intervention with existing companies, as well as with the regional workforce will be necessary to stem this decline.
» The Fabricated Metal Products Manufacturing cluster is diverse. Several subsectors have the potential for further development based on supply chain relationships with other industries in the Region and surrounding metro areas including aluminum and steel components; motor vehicle parts; coated, engraved or heat-treated products; and machine shops.
» Opportunities likely exist for companies to develop new supply chain relationships with companies in nearby metro areas or outside the industries they already serve, but more research is needed to identify and develop those opportunities.
» The supply chain gap for machine shops presents a unique opportunity for the expansion of existing businesses. A regional initiative aimed at expanding the capabilities of machine shops could benefit the supply chain needs of several key manufacturing sectors.
» Small niche manufacturers (such as machine shops) can be supported as part of a strategy to support small business and entrepreneurship in the Region.
Costs of Doing Business
Since most businesses operate in a real-time global marketplace, their focus is on maintaining a comparative advantage through sourcing and supplying products profitably. Cost components such as labor, taxes, real estate, and utilities are the key measures which most companies use to decide where to locate or expand their operations.
Operating cost analysis focuses on those key geographically variable cost elements which are considered to be the most pivotal within the corporate site selection process and overall target industry competitiveness.

NIU Center for Governmental Studies 49
Promoting Regional Prosperity in Northwest Illinois
Agribusiness, Food Processing, and Technology
INDUSTRY CLUSTER PROFILE: AGRIBUSINESS, FOOD PROCESSING, AND TECHNOLOGY
Cluster Summary
The Agribusiness, Food Processing and Technology industry cluster enhances the food production value chain by increasing the economic value of raw commodities as they move through the stages of production to consumers. This report concentrates on two distinct but complementary subsectors that share common inputs--value-added agriculture and food manufacturing.
Value-added agriculture is defined as changes made to primary agriculture products (crops and livestock) that increase the product’s value and create new economic activity and jobs. These could include process activities that create value for the product and/or introduce the product to new markets; diversification and/or modification of primary agriculture products; or pre-production modifications that increase yields, quality, and uses.
The first component is value added agriculture which may also include the production of innovative crop or livestock based commodities (e.g., organic or heirloom meats or fruits, vegetables, or grains), as well as regionally branded products that increase consumer appeal and willingness to pay a premium over similar but undifferentiated products. Currently, traditional agriculture has a strong presence in the five-county region while innovative value added activities are a small, but growing subsector of the industry.
The second component is food manufacturing or processing agricultural produce including meat, dairy products, fruits and vegetables, milled grains and oilseeds, baked goods, and candy. The Region supports a few large processors and several smaller firms specializing in dairy products (such as cheese), snack foods, and processed meats. Food manufacturing also supports the agricultural sector through the production of livestock feed components.
Cluster Definition
An industry cluster is a group of related industries which are connected by supply chains and/or common labor pools within the same region. The core strength of the Agribusiness, Food Processing, and Technology industry cluster comes from the manufacturing of food from raw produce either sold as finished products or incorporated into other manufactured goods. These core industries drive employment and inputs in other industries which supply them (e.g., crop or livestock production, farm equipment manufacturing, and food processing machinery manufacturing), as well as those which support the core industries by providing business finance and various business services (Figure 40).
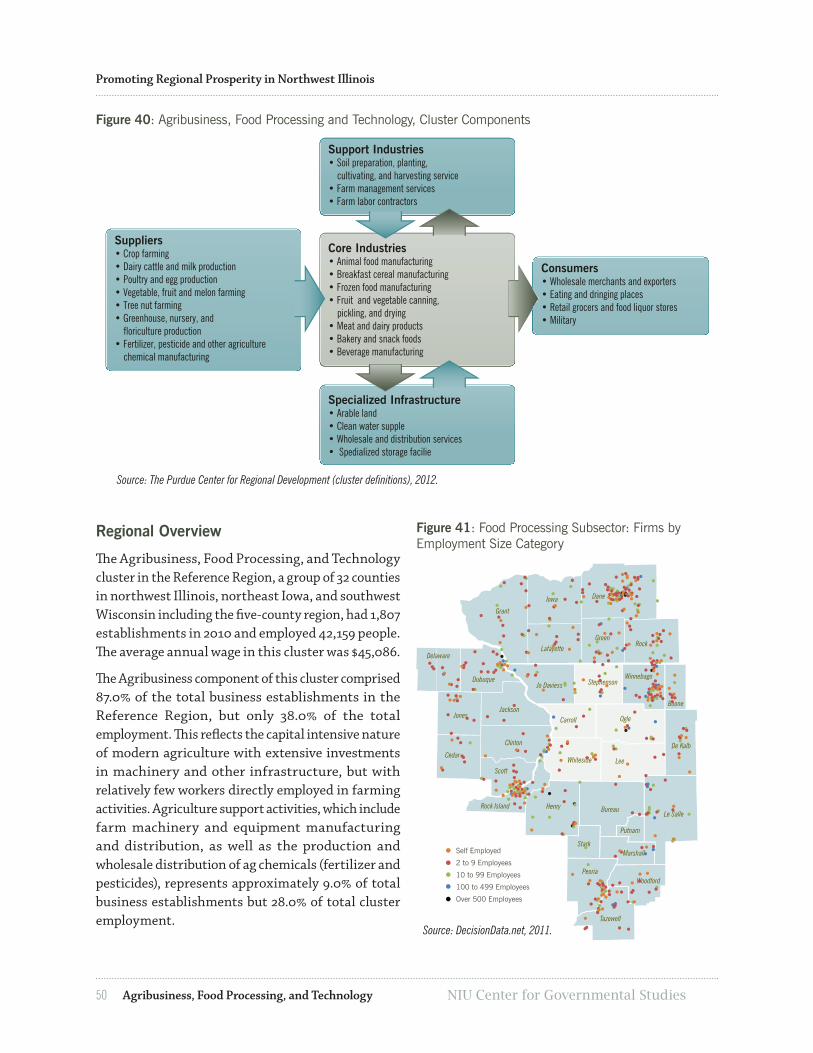
50 NIU Center for Governmental StudiesAgribusiness, Food Processing, and Technology
Promoting Regional Prosperity in Northwest Illinois
Figure 40: Agribusiness, Food Processing and Technology, Cluster Components
Figure 40. Agribusiness, Food Processing and Technology, Cluster Components
Support Industries• Soil preparation, planting, cultivating, and harvesting service• Farm management services• Farm labor contractors
Core Industries• Animal food manufacturing• Breakfast cereal manufacturing• Frozen food manufacturing• Fruit and vegetable canning, pickling, and drying• Meat and dairy products• Bakery and snack foods• Beverage manufacturing
Specialized Infrastructure• Arable land• Clean water supple• Wholesale and distribution services• Spedialized storage facilie
Suppliers• Crop farming• Dairy cattle and milk production• Poultry and egg production• Vegetable, fruit and melon farming• Tree nut farming• Greenhouse, nursery, and floriculture production• Fertilizer, pesticide and other agriculture chemical manufacturing
Consumers• Wholesale merchants and exporters• Eating and dringing places• Retail grocers and food liquor stores• Military
Source: The Purdue Center for Regional Development (cluster definitions), 2012.
Regional Overview
The Agribusiness, Food Processing, and Technology cluster in the Reference Region, a group of 32 counties in northwest Illinois, northeast Iowa, and southwest Wisconsin including the five-county region, had 1,807 establishments in 2010 and employed 42,159 people. The average annual wage in this cluster was $45,086.
The Agribusiness component of this cluster comprised 87.0% of the total business establishments in the Reference Region, but only 38.0% of the total employment. This reflects the capital intensive nature of modern agriculture with extensive investments in machinery and other infrastructure, but with relatively few workers directly employed in farming activities. Agriculture support activities, which include farm machinery and equipment manufacturing and distribution, as well as the production and wholesale distribution of ag chemicals (fertilizer and pesticides), represents approximately 9.0% of total business establishments but 28.0% of total cluster employment.
Figure 41: Food Processing Subsector: Firms by Employment Size Category
Figure 41. Firms in the Food Processing Subsector by Employment Size Category
Self Employed
2 to 9 Employees
10 to 99 Employees
100 to 499 Employees
Over 500 Employees
Source: DecisionData.net, 2011.
Rock Island
Scott
Clinton
Cedar
Jones
Delaware
Dubuque
Jackson
Jo Daviess Stephenson
Carroll
Whiteside
Henry
Stark
Bureau
Lee
Ogle
De Kalb
Boone
Le Salle
Putnam
Marshall
PeoriaWoodford
Tazewell
Winnebago
RockGreen
Lafayette
Iowa Dane
Grant

NIU Center for Governmental Studies 51
Promoting Regional Prosperity in Northwest Illinois
Agribusiness, Food Processing, and Technology
The Food Processing component accounts for less than 4.0% of the firms operating in the Reference Region, but has approximately one-third of total cluster employment. The majority of Food Processing firms are small in employment (68.0% of firms have fewer than 10 employees) with the 22 largest companies (those with 100 or more employees) representing about 56.0% of total employment. Food processors are dispersed throughout the Region with many larger firms concentrated near metro areas (Figure 41).
The cluster also has had a consistently high concentration of employment in the five-county region with location quotients (LQ) of 2.6 in 2001, 2.2 in 2007, and 2.5 in 2010. Many industry subsectors are represented in the five-county region. Five subsectors have a strong presence in the Region based on the concentration of employment. The top five are listed in Figure 42.
Figure 42: Agribusiness, Food Processing, and Technology: Subsectors Based on Employment Concentration
Indicator Location Quotient (2010)Flavoring syrup and concentrate manufacturing 37.0
Cheese manufacturing 16.0
Grain farming 11.0
Soybean and other oilseed processing 9.8
Farm machinery and equipment manufacturing 7.7Source: IMPLAN, 2010.
In the five-county region, the cluster had 239 establishments and employed 4,117 people in direct cluster jobs in 2010. The average annual wage for direct cluster jobs is $41,709. This cluster has a higher than average concentration of economic activity, as defined by firm and employment LQ, in both the Reference Region and the five-county region,when compared to the nation’s economic activity in this cluster overall (Figure 43).
The Agribusiness component of this cluster comprises 87.0% of the total business establishments in the Region, but only 38.0% of the total employment. This reflects the capital intensive nature of modern agriculture with heavy use of machinery and other infrastructure, but with relatively few workers directly employed in farming activities. Agriculture support activities, which include farm machinery and equipment manufacturing and distribution, as well as the production and wholesale distribution of ag chemicals (fertilizer and pesticides) represents about 9.0% of total business establishments but 28.0% of the total cluster employment.
The Food Processing component accounts for 2.2% of the firms operating in the Region, but has 28.0% of total cluster employment. The majority of food processors are small in employment (half of the firms in the Region have fewer than 10 employees) with the six largest employers (those with 100 or more employees) representing about 69.0% of total employment.
Location Quotients (LQ) are used to evaluate local development opportunities and find businesses which are especially suited for the Region. A LQ is the ratio of the employment percentage represented by a given industry in the county to the percentage which that industry represents in the state or a representative area of interest. A ratio greater than 1.0 indicates a higher local concentration and a likelihood of exports from the county; a ratio less than 1.0 may suggest that goods or services are imported into the Region.
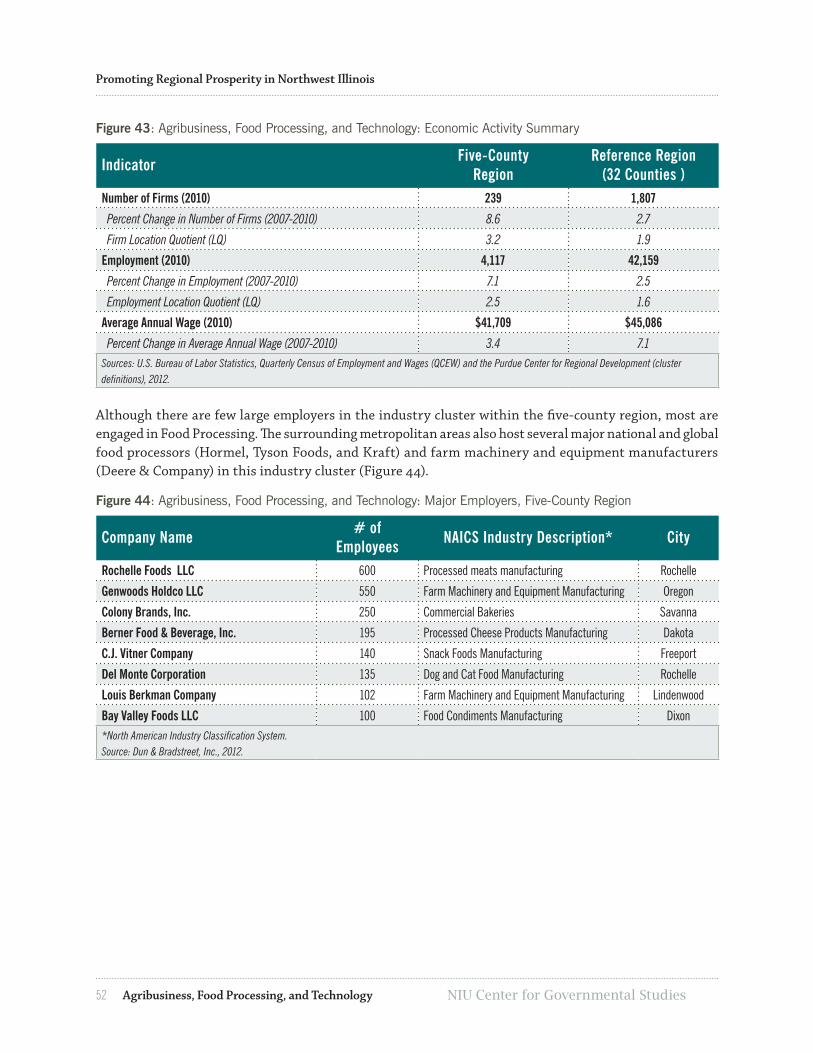
52 NIU Center for Governmental StudiesAgribusiness, Food Processing, and Technology
Promoting Regional Prosperity in Northwest Illinois
Figure 43: Agribusiness, Food Processing, and Technology: Economic Activity Summary
Indicator Five-County Region
Reference Region (32 Counties )
Number of Firms (2010) 239 1,807
Percent Change in Number of Firms (2007-2010) 8.6 2.7
Firm Location Quotient (LQ) 3.2 1.9
Employment (2010) 4,117 42,159
Percent Change in Employment (2007-2010) 7.1 2.5
Employment Location Quotient (LQ) 2.5 1.6
Average Annual Wage (2010) $41,709 $45,086
Percent Change in Average Annual Wage (2007-2010) 3.4 7.1Sources: U.S. Bureau of Labor Statistics, Quarterly Census of Employment and Wages (QCEW) and the Purdue Center for Regional Development (cluster definitions), 2012.
Although there are few large employers in the industry cluster within the five-county region, most are engaged in Food Processing. The surrounding metropolitan areas also host several major national and global food processors (Hormel, Tyson Foods, and Kraft) and farm machinery and equipment manufacturers (Deere & Company) in this industry cluster (Figure 44).
Figure 44: Agribusiness, Food Processing, and Technology: Major Employers, Five-County Region
Company Name # of Employees NAICS Industry Description* City
Rochelle Foods LLC 600 Processed meats manufacturing Rochelle
Genwoods Holdco LLC 550 Farm Machinery and Equipment Manufacturing Oregon
Colony Brands, Inc. 250 Commercial Bakeries Savanna
Berner Food & Beverage, Inc. 195 Processed Cheese Products Manufacturing Dakota
C.J. Vitner Company 140 Snack Foods Manufacturing Freeport
Del Monte Corporation 135 Dog and Cat Food Manufacturing Rochelle
Louis Berkman Company 102 Farm Machinery and Equipment Manufacturing Lindenwood
Bay Valley Foods LLC 100 Food Condiments Manufacturing Dixon*North American Industry Classification System. Source: Dun & Bradstreet, Inc., 2012.

NIU Center for Governmental Studies 53
Promoting Regional Prosperity in Northwest Illinois
Agribusiness, Food Processing, and Technology
Industry Trends32
Volatile Commodity Prices: The price of critical commodity inputs such as corn, soybeans, wheat, dairy, coffee beans, beef, poultry, vegetables, sugars, and oils can change significantly due to farm yields, unpredictable weather patterns, and market reactions to government farm subsidies. Commodity price increases raise raw material and operating costs, which can be difficult to pass on to consumers in higher product prices. Many companies hedge against commodity price increases to limit volatility.
Dependence on Large Customers: Consolidation in the grocery and restaurant industries and the rise of mass food merchandisers such as Costco and Walmart have funneled demand through fewer but larger customers. Local and regional processors may depend on just a few customers for the bulk of their business. Even national processors depend on large national accounts for much of their business.
Highly Competitive Industry: Due to the proliferation of product choices in many food segments, competition in the manufacturing industry is intense. Companies compete over products within their specific industry. For example, seafood processors compete with cheaper proteins like chicken; cereal makers compete with breakfast alternatives which can be easily consumed on-the-go. Food companies vie for shelf space and compete on value and brand reputation. Pressure from competitors and consumers can force manufacturers to lower prices or increase marketing expenditures. Branded items compete with private-label products which are generally sold at lower prices.
Shifting Consumer Tastes: Manufacturers must stay informed about continually changing consumer preferences in the highly competitive food industry. Companies often spend millions of dollars to reformulate products or develop new brands to capitalize on dietary fads (low carb, fat free, sugar free). Dietary trends can quickly become passé or be overtaken by new health concerns, which may conflict with a manufacturer’s health claims. Customers often embrace a brand and concept only to abandon it within a few years.
Private-Label Products: The private-label food business has grown rapidly in the past decade, as grocers have found private-label products profitable. Grocers frequently stock just one or two branded products in a food category along with their own private-label product. Private labels have benefited by going upscale with gourmet offerings, blurring the traditional distinction between private-label and branded products. For some foods, the price gap between branded and private-label goods is also shrinking, as branded products struggle to compete with more competitively priced private-label products. Some manufacturers have capitalized on this trend by making both branded and private-label goods, sometimes in the same plant.
Market Opportunities33
Healthier Offerings: Many manufacturers are reformulating products to include healthier ingredients or those perceived as healthier by consumers. New offerings are often made with organic wheat flour, cane sugar, rice syrup, and corn starch, for example. Dairy products are one of the fastest growing segments of the organic food industry. Low-sodium, whole wheat, and gluten-free product options have gained in popularity. To attract consumers, manufacturers often advertise the heart-healthy or low-cholesterol benefits of their products.
32 Source: Hoovers, Inc., 2013. (www.hoovers.com)33 Source: Hoovers, Inc., 2013. (www.hoovers.com)
54 NIU Center for Governmental StudiesAgribusiness, Food Processing, and Technology
Promoting Regional Prosperity in Northwest Illinois
New Packaging: New food packaging often focuses on convenience and eco-friendly designs. Meat processors now cut, package, price, and label fresh meat products for immediate display on supermarket shelves. Manufacturers also sell premeasured meal kits with the necessary ingredients and seasonings included. Resealable and single-serving packages have also become common. Many smaller packages, such as 100-calorie sizes, are designed to help dieting consumers with portion control.
International Expansion: Large U.S. food processors are expanding into international markets. Emerging markets like Latin America and Asia have consumers with rising incomes and growing interest in Western foods. Companies have forged joint ventures with European and Asian food manufacturers intending to take advantage of strong local consumer brands. U.S. manufacturers often tweak ingredients, flavors, and brand messaging to appeal to the culture of a target market.
Supply Chain
The supply chain analysis provides insight into the value of supply chain inputs, the amount of inputs produced in a region for the industry clusters studied (represented in most cases by an absorption rate), and the stages along the supply chain which stand out as areas of competitive advantage. Areas of high absorption represent areas along the Food Processing supply chain which allow the Region to capture the most value from a specific stage in the production or delivery of products and services within the supply chain. This may inform strategy by indicating where along the value chain an investment will have the highest impact on the regional economy and may indicate opportunities for business retention or expansion. Again, several of the industries have similar suppliers because of the similarities in their supply needs.
Conversely, stages along the supply chain which are underperforming also offer opportunities for business attraction and/or entrepreneurship. When reviewing data relating to industry inputs, comparing both the absorption rate and the total value of inputs is important because certain services or components which maintain a high absorption rate may be of low value to the regional economy. Similarly, certain inputs, regardless of value or absorption, may be of high strategic importance to the Region in efforts to build a stronger industry cluster.
Supply Chain
An essential component for an industry cluster is the local supply chain. While not all inputs (goods or services) that an industry cluster needs can be produced in the local economy, it is desirable to meet as many of the cluster’s needs locally as possible. This analysis reveals the source and amount of purchases among the unique niches within an industry. By identifying the total industry economic outputs and areas where goods and services are purchased from outside the regional economy, one may be in a better position to determine which areas of the industry supply chains are strongest, as well as those that present the best opportunities for growth within the five-county region.

NIU Center for Governmental Studies 55
Promoting Regional Prosperity in Northwest Illinois
Agribusiness, Food Processing, and Technology
The supply chain information provided shows the flows of trade which support the Agribusiness, Food Processing, and Technology-related cluster both within the five-county region and from outside the Region. The key sectors that may be appropriate targets for expansion appear as imports (gaps) from outside the Region, but still within the industry cluster (Figure 45). These gaps are then analyzed in terms of regional strengths and potential areas for targeting and support and are placed into a supply chain framework to determine the stages of the supply chain which enjoy the strongest regional presence. In order to fully develop an Agribusiness, Food Processing, and Technology cluster, the five-county region can best achieve progress by focusing on those sectors without a strong regional presence , but which have significant development potential for the Region.
Figure 45: Food Processing Component: Largest Supply Chain Gaps, Five-County Region
Industry Regional Supply Gap
Regional Inputs Gross Inputs % Purchased
Outside RegionOilseeds -$116,127,493 $11,479,942 $127,607,434 91.0%
Processed animal meat and rendered byproducts (except poultry) -71,135,787 2,255,589 73,391,376 96.9
Soybean oil, cakes and other oilseed products -42,532,405 56,966 42,589,371 99.9
Fruit -25,834,327 1,508,974 27,343,301 94.5
Other basic organic chemicals -23,741,083 55,781 23,796,864 99.8
Canned, pickled and dried fruits and vegetables -11,629,367 5,887 11,635,254 99.9
Motor vehicle parts -13,239,328 124,676 13,364,005 99.1
Other engine equipment -9,502,151 55,561 9,557,712 99.4
Plastics bottles -9,363,026 0 9,363,026 100.0Source: IMPLAN, 2010.
For example, the regional Food Processing component requires $127.6 million in inputs (i.e., the products or services required to create a finished product) from the “oilseeds” production. However, only $11.5 million of this material is produced in the Region with the balance being purchased elsewhere. This suggests an opportunity for an existing firm or new business to satisfy the regional demand for this crop. Another closely related opportunity is “soybean oil, cakes, and other oilseed products.” Companies in this sector mill soybeans and other oilseeds (such as cottonseeds, linseeds, peanuts, and sunflower seeds) into oil, cakes, or meal products.
Regional Supply Gap
Difference between Gross and Regional Inputs: a large gap value indicates that a large amount of inputs are imported into the region, rather than produced within the five-county Region.
Regional Inputs
The dollar value of gross inputs which are produced within the Region.
Gross Inputs
Total dollar amount of inputs used by the industry within each sector.
Oilseeds Farming
(NAICS Sector 111110, 1111120)
This industry comprises establishments engaged primarily in growing soybeans and/or producing soybean seeds. It also includes the production of fibrous oilseed producing plants and/or producing oilseed seeds, such as sunflower, safflower, flax, rape, canola, and sesame.

56 NIU Center for Governmental StudiesAgribusiness, Food Processing, and Technology
Promoting Regional Prosperity in Northwest Illinois
Workforce Requirements, Supply and Demand
Even as employment in the cluster has declined during the past decades (a trend that is projected to continue) the supply of potential new workers is comparatively low because of demographic trends and the propensity of younger workers to pursue careers outside of manufacturing. There are significant differences in age and wage profiles of the agribusiness and Food Processing components of the cluster. The Agribusiness component has a high proportion of younger (15.3% are under age 25), as well as older workers (9.4% are age 65 or older) (Figure 46). Wages also vary from the Food Processing sector due in part to a higher number of part-time and seasonal workers employed in agriculture. Also, many of those engaged in Agribusinesses are either self-employed or operate as a business, receiving compensation in the form of business income or profits, rather than from wages.
Figure 46: Agribusiness Component: Employment and Wages by Age Group, Five-County Region
Age Group Employment (Percent of Total)
Average Annual Wage
Under 25 Years 15.3% $11,966
25-44 Years 41.3 34,513
45-64 Years 34.0 33,627
65 Years & Older 9.4 18,409Source: U.S. Bureau of Labor Statistics, Quarterly Census of Employment and Wages, 2011.
The age profile in food processing more closely resembles manufacturing in general, but with below average wages. This may reflect more part-time, seasonal, or contract workers. Over half of the workers in the sector are 45 years of age or older, but only 6.8% are under the age of 25 (Figure 47).
Figure 47: Food Processing Component: Employment and Wages by Age Group, Five-County Region
Age Group Employment (Percent of Total)
Average Annual Wage
Under 25 Years 6.8% $19,861
25-44 Years 41.1 42,900
45-64 Years 45.1 51,085
65 Years & Older 7.0 40,966
Source: U.S. Bureau of Labor Statistics, Quarterly Census of Employment and Wages, 2011.
Over 58.0% of the employment and 48.0% of the wages in the cluster are in Production; Installation, Maintenance, and Repair; or Transportation and Material Moving occupations (Figure 48). Production and related employment classifications account for the largest single share of the jobs in the Region. Ensuring that appropriately skilled production workers are available at competitive compensation rates will be critical to maintaining the manufacturing sector in the Region34.
34 In 2008, Production, Installation, Maintenance, Repair or Transportation and Material Moving occupations were 23.0% of all occupational employment in Workforce Investment Board Region #4.

NIU Center for Governmental Studies 57
Promoting Regional Prosperity in Northwest Illinois
Agribusiness, Food Processing, and Technology
Figure 48: Agribusiness, Food Processing, and Technology: Staffing Patterns, Five-County Region
Occupational Classification Share or Employment
Share of Wages
Average Annual Wage
Production 35.2% 28.0% $31,329
Transportation and Material Moving 16.9 12.6 29,489
Office and Administrative Support 14.2 11.6 32,350
Sales and Related Occupations 10.7 14.3 52,619
Installation, Maintenance, and Repair 6.8 7.3 42,448
Management 4.5 12.2 107,551
Business and Financial Operations 2.7 4.1 61,024
Farming, Fishing, and Forestry 2.6 1.6 24,326
Architecture and Engineering 2.2 3.7 67,216Sources: U.S. Bureau of Labor Statistics, Quarterly Census of Employment and Wages (QCEW) and the Purdue Center for Regional Development (cluster definitions), 2012.
A challenge for employers is the looming demand for replacement workers as older workers retire. The Illinois Department of Employment Security claims that 196 openings for production workers will become available per year between 2008 and 2018, mostly replacement workers (Figure 49).
Figure 49: Occupational Employment, Projected Demand by Worker Classification Workforce Investment Board Region #4, 2008-2018*
Occupational Classification Employment Employment Change 2008-2018
Average Annual Job Openings
2008 2018 Number % Growth Replacement Total
Production 9,653 8,806 -847 -8.8 5 191 196
Transportation and Material Moving 6,297 6,479 182 2.9 25 153 178
Office and Administrative Support 11,256 11,371 115 1.0 46 242 288
Sales and Related Occupations 7,815 8,049 234 3.0 27 241 268
Installation, Maintenance, and Repair 2,798 2,930 132 4.7 15 55 70
Management 7,959 7,693 -266 -3.3 13 123 136
Business and Financial Operations 3,110 3,385 275 8.8 28 64 92
Farming, Fishing, and Forestry 687 633 -54 -7.9 0 18 18
Architecture and Engineering 1,116 1,073 -43 -3.9 3 25 28*Workforce Investment Board (WIB) Region #4 consists of Carroll, JoDaviess, Ogle, Stephenson, and Whiteside counties. Source: Illinois Department of Employment Security, 2012.
58 NIU Center for Governmental StudiesAgribusiness, Food Processing, and Technology
Promoting Regional Prosperity in Northwest Illinois
Because of the competition with surrounding metro areas for workers with specific skills or experience, compensation levels are a concern for local businesses35. For example, the projected demand for production workers in the metro areas around the Region is estimated to be 2,398 openings per year between 2008 and 201836. The estimated average annual wage for production workers is $31,32937. Wages are not only lower than the other manufacturing-related sectors in the Region, they are also lower than the surrounding metro areas. This could put local employers at a competitive disadvantage relative to other industries offering comparable jobs at higher wages. Given the intense competition for skilled workers, companies will need to monitor compensation trends in order to recruit and retain qualified employees.
Business Operating Costs
The operating cost analysis focuses on those key geographically variable cost elements which are considered the most pivotal within the corporate site selection process and overall target industry competitiveness. The format of the cost exhibits allows a site selection professional or corporate facility planner to further tailor the cost data, plant specifications, and shipping patterns.
Annual operating costs are projected solely for comparative purposes with only major geographically variable operating costs included for seven county sites in the U.S. These include the five-county region along with two additional counties which have significant concentrations of businesses in the Agribusiness, Food Processing, and Technology cluster. One of the two out-of-state counties is in the Midwest region, and the second is located in an alternative U.S. region. Costs which did not vary significantly with geography, including relocation and start-up expenses, were not considered (Figure 50).
Figure 50: Agribusiness, Food Processing, and Technology: Geographically-Variable Operating Cost Comparison
County Name Total Annual Operating Costs
Lancaster County, PA $20,579,638
Butler County, OH 19,464,390
Whiteside County, IL 19,001,860
Ogle County, IL 18,962,010
Stephenson County, IL 18,769,038
Carroll County, IL 18,677,786
Lee County, IL 18,630,286Source: The Boyd Company, Inc., 2012.
Costs of Doing Business
Since most businesses operate in a real-time global marketplace, their focus is on maintaining a comparative advantage through sourcing and supplying products profitably. Cost components such as labor, taxes, real estate, and utilities are the key measures which most companies use to decide where to locate or expand their operations.
Operating cost analysis focuses on those key geographically variable cost elements which are considered to be the most pivotal within the corporate site selection process and overall target industry competitiveness.
35 Northern Illinois University, Center for Governmental Studies, “Promoting Regional Prosperity in Northwest Illinois: Wage and Benefit Report”, August, 2012, p. 23.36 Source: Illinois Department of Employment Security, 2012.37 Sources: U.S. Bureau of Labor Statistics, Quarterly Census of Employment and Wages (QCEW) and the Purdue Center for Regional Development (cluster definitions), 2012.

NIU Center for Governmental Studies 59
Promoting Regional Prosperity in Northwest Illinois
Agribusiness, Food Processing, and Technology
The five-county region was the most competitive with its peers in terms of labor costs and site acquisition and property tax costs. However, the labor cost differential with related industries and the nearby metro areas could be a drawback, given the competition for skilled workers. The Region was also more cost- effective in terms of shipping costs versus the comparative counties. Estimated outbound shipping costs from the five-county region were 3.0% to 23.0% below the comparison areas, highlighting the importance of northwest Illinois’ transportation assets and its access to national and global markets.
Key Takeaways
» The Agribusiness, Food Production, and Technology cluster in the five-county region has a concentration of firms which is 3.2 times the national average and an employment concentration 2.5 times the national average. The Reference Region also ranks above in both categories.
» The Region has maintained these advantages despite the impact of the recent recession and the long-term term decline in the number of manufacturing businesses and employment.
» The Agribusiness component of the cluster is relatively specialized in the types of agricultural commodities produced with corn and soybeans being the dominant crops. Livestock operations are primarily involved in the production of beef and dairy cattle, as well as hogs.
» The Food Processing component, specializing in five product groups (food additives, cheese and dairy products, processed meats, snack foods, and livestock feed), has the potential for further development based on their supply chain relationships to other industries in the Region or the surrounding metro areas.
» Opportunities likely exist for grain and livestock producers to work with food processors to develop new value added products or to process more locally grown produce. However, more work will be necessary to identify and develop those opportunities.
» Alternative value-added opportunities, such as organic food production or the conversion of grain, oilseeds, or by-products into fuel from the bio-based materials of products is an emerging opportunity. Further research is required to determine the viability of such opportunities.
» The expected wave of retiring Baby Boomers will create most of the demand for new workers, despite static, or even declining, overall employment in the industry. Since other industries will experience the same challenges, competition for skilled workers will be brisk given the relatively limited number of potential younger workers.

60 NIU Center for Governmental StudiesTransportation Equipment Manufacturing
Promoting Regional Prosperity in Northwest Illinois
INDUSTRY CLUSTER PROFILE: TRANSPORTATION EQUIPMENT MANUFACTURING
Cluster Summary
The Transportation Equipment Manufacturing industry cluster produces equipment for transporting people and goods. Major industries in this cluster have production processes similar to those in other machinery manufacturing establishments: bending, forming, welding, machining, and assembling metal or plastic parts into components and finished products. However, the assembly of components and subassemblies and further assembly into finished vehicles are more common in this cluster than in the Machinery Manufacturing industry cluster.
The five-county region has a relatively small presence in this industry cluster, but is well positioned to take advantage of development opportunities based on the capabilities and expertise of its Machinery and Fabricated Metal Products Manufacturing clusters. In addition, the Rockford metro area has a strong and well-established presence in two important subsectors of the Transportation Equipment Manufacturing cluster: motor vehicle production and aerospace components.
The Rockford metro area’s motor vehicle industry has developed around the Chrysler Belvidere Assembly Facility plus Tier I and Tier II suppliers which produce parts and services for the plant and other auto makers. The Rockford area also has five Tier I suppliers to the aerospace industry, including UTC Aerospace Systems and Woodward. In addition, some parts and components produced by this industry are used by farm and construction equipment manufacturers with a strong presence in the five-county region, as well as the Quad Cities and Peoria metro areas.
Based on this concentration of automotive and aerospace related firms and employment, the five-county region is be well-positioned to take advantage of the growth opportunities in these industries.

NIU Center for Governmental Studies 61
Promoting Regional Prosperity in Northwest Illinois
Transportation Equipment Manufacturing
Cluster Definition
An industry cluster is a group of similar industries which are closely connected by supply chains and/or similar labor pools located within the same region. The core strength of the Transportation Equipment Manufacturing industry cluster comes from the production of tools, structural components, and parts which are either sold as finished products or are incorporated into other manufactured goods. These core industries drive employment and inputs in other industries supplying them (e.g., the final assembly of vehicles for sale or delivery to market), as well as those which provide support through business finance, research and development, or industrial process services (Figure 51).
Figure 51: Transportation Equipment Manufacturing, Cluster ComponentsFigure 51. Transportation Equipment Manufacturing, Cluster Components
Support Industries• Machine shops• Machine tool manufacturers• Industrial fabrication machinery mfg.• Research and developmnet activities• Business investment and finance• Intellectual property attorneys
Core Industries• Automobile manufacturing• Motor vehicle body mfg.• Motor home, travel trailer, and camper mfg.• Aircraft, guided missile, and space vehicle mfg.• Railroad rolling stock mfg.• Ship and boat building and repairing• Motorcycle and bicycle mfg.• Military armored vehicles and tank parts mfg.
Consumers• Wholesale merchants and exporters• Retail merchants• Military• Other industries
Suppliers• Carburetor, piston, ring, and valve mfg.• Gasoline engine and engine parts mfg.• Vehicular lighting equipment mfg.• Motor vehicle steering and suspension parts• Motor vehicle power train components mfg.• Motor vehicle air-conditioning mfg.• Aircraft engine and engine parts mfg.• Space vehicle propulsion units and parts mfg.• Motorcycle and bicycle parts mfg.• Military armored vehicles and tank parts mfg.
Specialized Infrastructure• Clean Water Supply• Hazardous waste disposal• Wholesale and distribution services
Source: The Purdue Center for Regional Development (cluster definitions), 2012.

62 NIU Center for Governmental StudiesTransportation Equipment Manufacturing
Promoting Regional Prosperity in Northwest Illinois
Regional Overview
The Transportation Equipment Manufacturing cluster in the Reference Region, a group of 32 counties in northwest Illinois, northeast Iowa, and southwest Wisconsin including the five-county region, had 105 establishments in 2010 and employed 9,452. A majority of businesses in this cluster are small in employment (70.0% of firms have fewer than 10 employees), but the five largest employers account for 64.0% of total employment in the cluster (Figure 52).
In the five-county region, the cluster includes nine establishments and employed 611 people in direct cluster jobs in 2010. The cluster also has had a consistently high concentration of employment in the Region with location quotients (LQ) of 2.9 in 2001, 3.9 in 2007, and 3.6 in 2010. Only three industry subsectors had a strong presence in the Region based on concentration of employment (Figure 53).
Figure 53: Transportation Equipment Manufacturing: Subsectors Based on Employment Concentration
Indicator Location Quotient (2010)Truck trailer manufacturing 4.9
All other transportation equipment manufacturing 3.4
Motor vehicle parts manufacturing 1.3Note: This does not reflect the Nippon-Sharyo railcar production facility in Rochelle that opened in 2012. Source: IMPLAN, 2010.
However, the automotive and aerospace industries have a strong presence in the nearby metro areas, especially Rockford. In addition, the recent location of the Nippon-Sharyo railcar manufacturing facility in Rochelle is not reflected in any recent statistics. The development of the railroad equipment manufacturing supply chain is an additional opportunity for the Region, since some parts and components used in the automotive and aerospace industries are similar.
Location Quotients (LQ) are used to evaluate local development opportunities and find businesses which are especially suited for the Region. A LQ is the ratio of the employment percentage represented by a given industry in the county to the percentage which that industry represents in the state or a representative area of interest. A ratio greater than 1.0 indicates a higher local concentration and a likelihood of exports from the county; a ratio less than 1.0 may suggest that goods or services are imported into the Region.
Figure 52: Transportation Equipment Manufacturing: Firms by Employment Size Category
Figure 52. Firms in the Transportation Equipment Manufacturing Cluster by Employment Size Category
Self Employed
2 to 9 Employees
10 to 99 Employees
100 to 499 Employees
Over 500 Employees
Source: DecisionData.net, 2011.
Rock Island
Scott
Clinton
Cedar
Jones
DelawareDubuque
Jackson
Jo DaviessStephenson
Carroll
Whiteside
Henry
Stark
Bureau
Lee
Ogle
De Kalb
Boone
Le Salle
Putnam
Marshall
Peoria Woodford
Tazewell
Winnebago
RockGreen
Lafayette
Iowa Dane
Grant
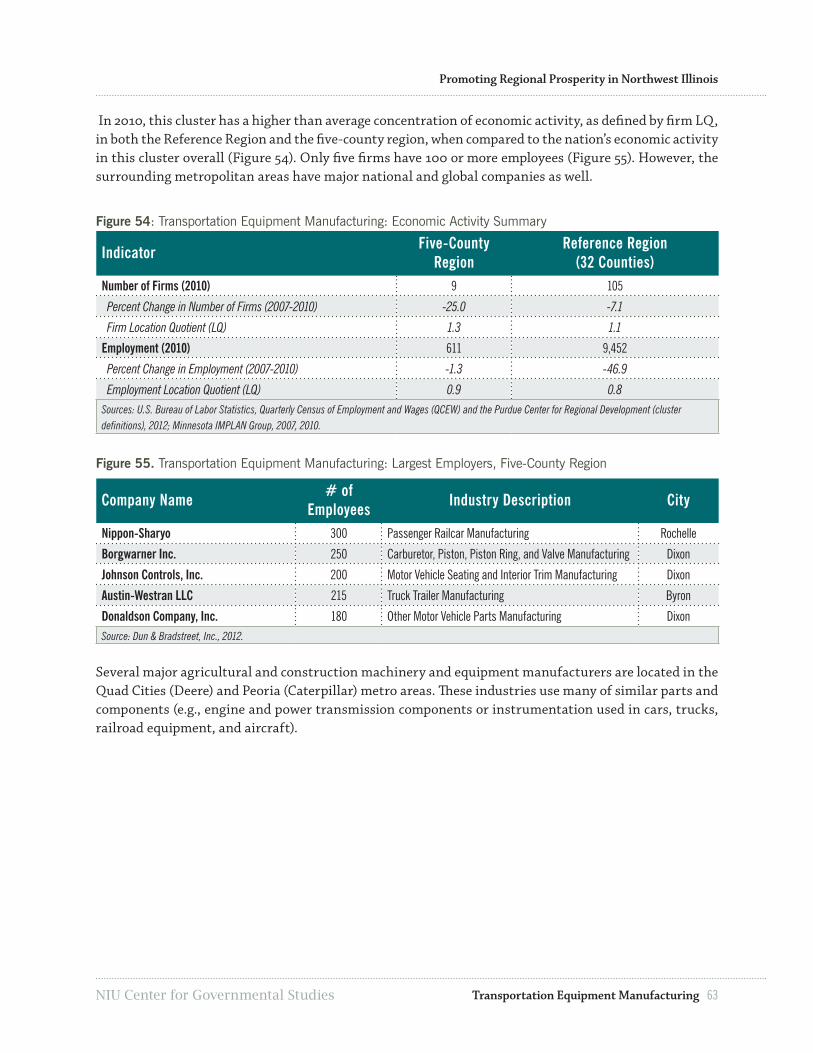
NIU Center for Governmental Studies 63
Promoting Regional Prosperity in Northwest Illinois
Transportation Equipment Manufacturing
In 2010, this cluster has a higher than average concentration of economic activity, as defined by firm LQ, in both the Reference Region and the five-county region, when compared to the nation’s economic activity in this cluster overall (Figure 54). Only five firms have 100 or more employees (Figure 55). However, the surrounding metropolitan areas have major national and global companies as well.
Figure 54: Transportation Equipment Manufacturing: Economic Activity Summary
Indicator Five-County Region
Reference Region (32 Counties)
Number of Firms (2010) 9 105
Percent Change in Number of Firms (2007-2010) -25.0 -7.1
Firm Location Quotient (LQ) 1.3 1.1
Employment (2010) 611 9,452
Percent Change in Employment (2007-2010) -1.3 -46.9
Employment Location Quotient (LQ) 0.9 0.8Sources: U.S. Bureau of Labor Statistics, Quarterly Census of Employment and Wages (QCEW) and the Purdue Center for Regional Development (cluster definitions), 2012; Minnesota IMPLAN Group, 2007, 2010.
Figure 55. Transportation Equipment Manufacturing: Largest Employers, Five-County Region
Company Name # of Employees Industry Description City
Nippon-Sharyo 300 Passenger Railcar Manufacturing Rochelle
Borgwarner Inc. 250 Carburetor, Piston, Piston Ring, and Valve Manufacturing Dixon
Johnson Controls, Inc. 200 Motor Vehicle Seating and Interior Trim Manufacturing Dixon
Austin-Westran LLC 215 Truck Trailer Manufacturing Byron
Donaldson Company, Inc. 180 Other Motor Vehicle Parts Manufacturing DixonSource: Dun & Bradstreet, Inc., 2012.
Several major agricultural and construction machinery and equipment manufacturers are located in the Quad Cities (Deere) and Peoria (Caterpillar) metro areas. These industries use many of similar parts and components (e.g., engine and power transmission components or instrumentation used in cars, trucks, railroad equipment, and aircraft).

64 NIU Center for Governmental StudiesTransportation Equipment Manufacturing
Promoting Regional Prosperity in Northwest Illinois
Industry Trends38
Aerospace Components
Tighter OEM Control: To make production more efficient, Boeing and other large aircraft OEMs are exercising greater control over their contractors by specifying quality control inspection programs for suppliers, requiring that suppliers buy metals like aluminum and titanium from designated providers and reducing the number of suppliers.
Air Cargo Expansion: Air cargo traffic is growing faster than passenger traffic, causing more passenger airplanes to be converted into freight-carrying aircraft. Both major commercial aircraft manufacturers, Boeing and Airbus, are aggressively seeking to expand their roles in the freighter conversion market, pushing out the once dominant third-party freight conversion companies. The global freighter fleet is expected to increase 150 percent by 2025, according to Airbus.
Direct Pricing: Although many contracts are awarded after competitive bidding, especially for Department of Defense business, some large Original Equipment Manufacturers (OEM) are awarding more contracts based on direct pricing. These contracts are offered to a manufacturer at a specific, nonnegotiable price. The effect is to reduce the number of contractors that OEMs deal with, simplifying the production process.
Offset Manufacturing Agreements: With increasing competition from European aircraft manufacturers like Airbus, U.S. commercial aerospace manufacturers are beginning to see offsets as necessary to compete internationally. Offsets are manufacturing or sales agreements between U.S. aerospace companies and foreign governments which typically involve establishing an overseas production facility. Aircraft part manufacturers either have to link themselves to these offset expansions or slowly lose business to overseas production. China is a main location for offsets with the U.S. aerospace industry.
Composite Materials: More aircraft components are now made from a composite of plastics, fibers, and glue rather than from metal. The aircraft parts industry has concerns that using composites, which offer several important advantages to manufacturers, will be restricted by safety concerns.
Automotive Components
Globalization: To compete globally, auto parts companies are merging and forming partnerships and joint ventures with worldwide auto companies. Partnerships are often created for the mutual exchange of ideas. Large suppliers have expanded operations overseas, wherever U.S. or foreign OEMs assemble cars. To keep or add business, smaller suppliers have followed suit, either by manufacturing abroad or expanding their international distribution system.
More Older Vehicles Operating: The demand for auto parts is increasing due to Americans owning more vehicles and keeping them longer. The average light vehicle on the road is nearly eight years old and requires more maintenance and repairs than newer ones, according to the National Automobile Dealers Association (NADA).
Aftermarket Sales Grow Slowly: Sales of aftermarket replacement parts and products are expected to increase slowly. Used car sales are increasing as the U.S. economy remains tepid and motorists either want to spend less on a vehicle or have difficulty securing new car financing. While better engineering is producing cars which last longer without major overhauls, consumers are shifting to spending more on maintenance to improve fuel efficiency, since they keep their older cars for longer periods.
38 Source: Hoovers, Inc., 2013. (www.hoovers.com)

NIU Center for Governmental Studies 65
Promoting Regional Prosperity in Northwest Illinois
Transportation Equipment Manufacturing
R & D Shifts to Suppliers: As big car companies concentrate on styling, marketing, and engines, part suppliers are advancing technology in many car components. Just as anti-lock brakes are now standard on many cars, parts companies believe that the computer-controlled, electronically operated systems they’re developing will be popular for transmissions, suspensions, safety systems, and steering.
Railroad Equipment
Sales to Shippers, Leasing Companies: More rolling stock is now leased or owned by shippers than sold directly to railroads. Some leasing companies are managed by the rolling stock manufacturers, and one major leasing company, TTX, is owned by a cooperative of railroads. The share of railroad ownership in freight rolling stock has steadily declined and now stands at about 40 percent, according to the Association of American Railroads.
Corporate Restructuring: The last decade brought corporate restructurings in railroad equipment manufacturing. General Motors sold EMD to a consortium of private investors (which later sold it to Caterpillar), GE Transportation is a result of GE’s corporate merging of several divisions, and Trinity sold its European operations. Companies which divest or restructure seek to gain internal efficiencies. Diversification and realignment can help companies reduce the risk inherent in the cyclical rolling stock industry.
Low-Floor Light Rail: Light rail manufacturers are increasingly designing passenger cars with floors that are just over one foot high. Low-floor cars allow regional light rail systems to implement easy-to-access boarding stations. This new design often eliminates the need for steps and helps light rail systems meet federal standards for persons with disabilities.
Market Opportunities39
Aerospace Components
Avionics: Electronic sensing, communications, and control systems are becoming more important to the aircraft business, especially the military. Boeing is developing communications systems to allow commercial fliers to access the Internet in flight. The FAA has also begun development of a national NextGen air traffic control system which relies on satellites rather than a ground-based system. Avionics systems can be more profitable than regular aircraft parts, but are more difficult and expensive to develop.
Automotive Parts and Components
Telematics: Integration of automotive telematics, technology which provides in-car access to communication networks, is expected to increase in the near future. Employing computers and wireless communication networks, automotive telematics applications range from vehicle tracking and navigation systems to mobile television and email access. Growing interest in Internet-enabled automotive features could provide growth opportunities for parts and accessory manufacturers.
Green Technologies: Growing concern over climate change and energy dependency in the U.S. has accelerated the development of environmentally friendly and alternative energy technologies. Demand for hybrid, electric, and alternative fuel-powered cars is growing, along with consumer expectations about the use of renewable, non-toxic materials. Some parts suppliers have created environmental initiatives to guide their product development and manufacturing practices.
39 Source: Hoovers, Inc., 2013. (www.hoovers.com)

66 NIU Center for Governmental StudiesTransportation Equipment Manufacturing
Promoting Regional Prosperity in Northwest Illinois
Growing Market in China: With growing vehicle and parts sales and the WTO agreement opening the market, China has become a growing target market for motor vehicle parts and products, according to the Motor and Equipment Manufacturers Association (MEMA). Between 2000 and 2010, U.S. exports of auto parts to China increased almost 400.0%.
Railroad Equipment
Acquiring Component and Parts Manufacturers: In recent years, locomotive and railcar companies have acquired or bought stakes in components and parts makers, which can increase access to key parts such as airbrakes, wheelbases, and couplers. Bringing component manufactures into the company can help to control costs. These acquisitions also help shorten the supply chain and may lead to fewer bottlenecks in the production of rolling stock.
Internal Leasing: Railcar manufacturers are finding value in leasing the cars they make. Railcar leases are typically for one to 20 years in length. Internal leasing creates the interesting dilemma of a company’s backlog resulting from its own orders.
New Export Markets: Exports to countries such as India, Kazakhstan, South Korea, and Ukraine have risen significantly over the past few years. Although Canada and Mexico continue to represent the bulk of rolling stock exports, nations with growing infrastructure needs have greatly increased demand for U.S. locomotives, railcars, and passenger cars.
Ethanol Demand Drives Increase in Tank Car Production: Freight car manufacturers are seeing a significant increase in demand for 30,000-gallon tank cars. Government incentives for ethanol production have led some manufacturers to switch from grain car to tank car production to meet demand. Some industry insiders believe the demand for ethanol carloads could increase by 30.0% or more.
Supply Chain
The supply chain analysis provides insight into the value of supply chain inputs, the amount of inputs produced in a region for the industry clusters studied (represented in most cases by an absorption rate), and the stages along the supply chain which stand out as areas of competitive advantage. Areas of high absorption are areas in the Transportation Equipment Manufacturing supply chain which allow the Region to capture the most value from a specific stage in the production or delivery of products and services within the supply chain. This tool supports an economic development strategy by indicating where an investment will have the highest impact on the regional economy and may indicate opportunities for business retention or expansion.
Conversely, stages along the supply chain which are underperforming also offer opportunities for business attraction and/or entrepreneurship. When reviewing data relating to industry inputs, comparing both the absorption rate and the total value of inputs is important because certain services or components which maintain a high absorption rate may be of low value to the regional economy. Similarly, certain inputs, regardless of value or absorption, may be of high strategic importance to the Region in efforts to build a stronger industry cluster.
Supply Chain
An essential component for an industry cluster is the local supply chain. While not all inputs (goods or services) that an industry cluster needs can be produced in the local economy, it is desirable to meet as many of the cluster’s needs locally as possible. This analysis reveals the source and amount of purchases among the unique niches within an industry. By identifying the total industry economic outputs and areas where goods and services are purchased from outside the regional economy, one may be in a better position to determine which areas of the industry supply chains are strongest, as well as those which present the best opportunities for growth within the five-county region.

NIU Center for Governmental Studies 67
Promoting Regional Prosperity in Northwest Illinois
Transportation Equipment Manufacturing
The supply chain information in this report presents the flows of trade which support the Transportation Equipment Manufacturing-related cluster both within the five-county region and from outside the Region. Key sectors which may be appropriate targets for expansion appear as imports (gaps) from outside the Region, but still within the industry cluster. These gaps are then analyzed in terms of regional strengths and potential areas for targeting and support and are placed within a supply chain model to determine the stages of the supply chain with the weakest and strongest regional presence. In order to fully develop the Transportation Equipment Manufacturing cluster, the five-county region can make the most progress by focusing on those sectors without a strong regional presence currently, but which have significant development potential (Figure 56).
Figure 56: Transportation Equipment Manufacturing: Largest Supply Chain Gaps
Industry Regional Supply Gap
Regional Inputs
Gross Inputs
% Purchased from Outside the Region
Motor vehicle parts -$5,217,569 $49,134 $5,266,704 99.1%
Aluminum products from purchased aluminum -$1,365,102 $1,057 $1,366,159 99.9
Valves and fittings other than plumbing -$1,070,403 $11,096 $1,081,499 99.0
Fluid power process machinery -$1,060,583 $16,625 $1,077,208 98.5
Machine shops -$911,441 $1,939 $913,380 99.8
Paints and coatings -$811,493 $2 $811,496 100.0
Motor and generators -$779,389 $569 $779,958 99.9
Semiconductor and related devices -$649,054 $2 $649,056 100.0
Relay and industrial controls -$641,560 $987 $642,547 99.8
Plastics packaging materials and unlaminated films and sheets -$626,284 $1,394 $627,678 99.8
Source: IMPLAN, 2010.
For example, the regional Transportation Equipment Manufacturing cluster requires nearly $5.3 million in inputs (i.e., the products or services required to create a finished product) from the “motor vehicle parts” industry. However, only $49,000 of the required inputs from this industry is produced within the Region, with the balance purchased elsewhere. This finding indicates opportunities for an existing firm or new business to satisfy the regional demand for these products.
The supply chain gap for “machine shops” also presents a unique opportunity for existing business development. In general, machine shops produce a wide variety of parts or components based on customer requirements. Since most specialize in low-volume,
Regional Supply Gap
Difference between Gross and Regional Inputs: a large gap value indicates that a large amount of inputs are imported into the region, rather than produced within the five-county region.
Regional Inputs
The dollar value of gross inputs which are produced within the Region.
Gross Inputs
Total dollar amount of inputs used by the industry within each sector.
Motor vehicle parts (NAICS Sector 333618)
Firms in this industry manufacture and/or rebuild motor vehicle gasoline engines and engine parts, whether or not for vehicular use. Subsectors include the following: » Carburetor, Piston, Piston Ring, and Valve Manufacturing Natural gas engines
» Gasoline Engine and Engine Parts Manufacturing

68 NIU Center for Governmental StudiesTransportation Equipment Manufacturing
Promoting Regional Prosperity in Northwest Illinois
fast-turnaround orders, they are quite versatile and are only limited by their production equipment and the skills and capabilities of their workers. Therefore, a regional initiative aimed at expanding the capabilities of machine shops could help meet the supply chain needs of several key manufacturing sectors.
Workforce Requirements, Supply and Demand
The local skilled workforce for the Transportation Equipment Manufacturing cluster has been an ongoing issue, as it has for all industries. The shortage of skilled workers is largely the result of a wave of retirements from the Baby Boomer generation of workers. Even as industry employment has experienced net declines over the past decades (a trend that is projected to continue) the succeeding generation of potential workers is comparatively small because of recent demographic trends and the propensity of younger workers to pursue careers outside of manufacturing. Because of its relatively small presence in the five-county region, data specific to the Transportation Equipment Manufacturing industry is not available. However, in the manufacturing sector overall, nearly half of workers in 2010 were 45 year of age or older (Figure 57).
Figure 57: Transportation Equipment Manufacturing: Employment by Age Group, Five-County Region, 2010
Age Group Employment (Percent of Total)
Under 25 Years 13.9%
25-44 Years 38.0
45-64 Years 43.5
65 Years & Older 5.1Source: U.S. Bureau of Labor Statistics, Quarterly Census of Employment and Wages, 2010.
Over three-fourths of the employment, as well as 70.0% of the wages, in the Transportation Equipment Manufacturing cluster is concentrated in Production; Installation, Maintenance, and Repair; or Transportation and Material Moving occupations (Figure 58).
Figure 58: Transportation Equipment Manufacturing: Staffing Patterns, Five-County Region
Occupational Classification Share of Employment
Share of Wages
Average Annual Wage
Production 64.5% 58.3% $39,514
Transportation and Material Moving 5.8 4.9 36,920
Office and Administrative Support 5.8 4.9 36,863
Installation, Maintenance, and Repair 5.8 7.0 52,463
Architecture and Engineering 4.9 7.9 69,787
Management 3.5 8.5 106,642
Business and Financial Operations 2.8 2.9 46,434
Construction and Extraction 1.4 1.8 54,421
Sales and Related Occupations 1.1 1.6 63,264Sources: U.S. Bureau of Labor Statistics, Quarterly Census of Employment and Wages (QCEW) and the Purdue Center for Regional Development (cluster definitions), 2012.

NIU Center for Governmental Studies 69
Promoting Regional Prosperity in Northwest Illinois
Transportation Equipment Manufacturing
The challenge for employers is the looming demand for replacement workers as older workers retire. The Illinois Department of Employment Security estimates that nearly 200 openings for production workers will become available per year between 2008 and 2018, most resulting from the demand for replacement workers (Figure 59).
Figure 59: Occupational Employment, Projected Demand by Worker Classification Workforce Investment Board Region #4, 2008-2018*
Occupational Classification Employment Employment Change 2008-2018 Average Annual Job Openings
2008 2018 Number Percent Growth Replacement Total
Production 9,653 8,806 -847 -8.8 5 191 196
Transportation and Material Moving 6,297 6,479 182 2.9 25 153 178
Office and Administrative Support 11,256 11,371 115 1.0 46 242 288
Installation, Maintenance, and Repair 2,798 2,930 132 4.7 15 55 70
Architecture and Engineering 1,116 1,073 -43 -3.9 3 25 28
Management 7,959 7,693 -266 -3.3 13 123 136
Business and Financial Operations 3,110 3,385 275 8.8 28 64 92
Construction and Extraction 4,047 4,188 141 3.5 16 68 84
Sales and Related Occupations 7,815 8,049 234 3.0 27 241 268*Workforce Investment Board (WIB) Region #4 consists of Carroll, JoDaviess, Ogle, Stephenson, and Whiteside counties. Source: Illinois Department of Employment Security, 2012.
Key Takeaways
» The Transportation Equipment Manufacturing cluster has a small presence in the five-county region, but the automotive and aerospace industries in the Rockford area are major employers.
» A small number of companies in the five-county region produce parts or provide services to these sectors, but there may be potential to develop new or expanded businesses based on existing supply chain relationships with companies in the Rockford area.
» A recent study of the development potential of the aerospace industry found that while business operation costs in Rockford were competitive with their peers in other parts of the U.S., site acquisition and property tax costs were the metro area’s primary weaknesses40 . These results may offer the five-county region a competitive advantage to attract these companies when combined with the expertise available in the Rockford area.
» The recent opening of the Nippon-Sharyo railcar production facility in Rochelle offers the opportunity for new or existing companies to supply parts and components, not only to this company, but to the railroad equipment industry in general.
» Small niche manufacturers can be supported as part of a strategy to support small business and entrepreneurship in the Region. Machine shops are of special interest because they typically do not have a standard product, but rather specialize in a range of fabrication processes or services based on customer needs.
» The expected wave of retiring Baby Boomers represents most of the demand for new workers, despite static, or even declining, overall employment in the industry. Since other manufacturing sectors will experience the same challenges, competition for skilled workers will be brisk given the relatively limited number of potential younger workers.
40 “Rockford Regional Strategic Diversification Plan: Aerospace and Defense Industry Analysis”, Angelou Economics, 2012.

70 NIU Center for Governmental StudiesTransportation and Logistics
Promoting Regional Prosperity in Northwest Illinois
INDUSTRY CLUSTER PROFILE: TRANSPORTATION AND LOGISTICS
Cluster Summary
The Transportation and Logistics industry cluster encompasses the transportation of passengers and freight, related support services (e.g., freight forwarding and supply chain management), warehousing, and the management transportation infrastructure (e.g., ports and terminal facilities). Providers of air, water, road, and rail transportation and related services are also included in this cluster. The cluster has a relatively small, but growing presence in the five-county region, driven by transportation access and the proximity to the Chicago area and other regional markets.
For this report, the Transportation and Logistics cluster is considered to be a grouping of physical and strategic assets which should be developed and maintained to support other targeted industries. The Region not only benefits from excellent highway and rail access, but also from several large commercial airports, two foreign trade zones, a major UPS air hub (in Rockford), and the Global III rail-truck intermodal facility (in Rochelle). The former Savanna Army Depot also has the potential for rail and communications-related development if necessary infrastructure improvements are made.
Cluster Definition
An industry cluster is a group of similar industries which are closely connected by supply chains and/or common labor pools in the same region. The core strength of the cluster comes from the transportation of people or goods by air, road, rail, or water. These core industries drive employment and inputs in the other industries which supply them, as well as those which support the core industries by providing business finance and various business services (Figure 60).
Figure 60: Transportation and Logistics, Cluster ComponentsFigure 60. Transportation and Logistics, Cluster Components
Support Industries• Business investment, finance and legal• Process, physical distribution, and logistics consulting• Navigational services to shipping• Air traffic control and airport operations• Other support activities for transportation
Consumers• Wholesale merchants and exporters• Retail dealerships• Other industries
Suppliers• Couriers and local messengers and delivery• Warehousing and storage• Commercial air, rail, and water transportation equipment retal and leasing• Freight transportation arrangement• Packing and crating• Packaging and labeling services
Core Industries• Scheduled air passenger and air freight• Line-haul, short line, and terminal railroads• Scheduled intercity and charter bus industry• Coastal and Great Lakes freight and passenger transportation• Inland water freight and passenger transportation• General freight trucking, local and long-distance• Household and office goods moving• Pipeline transportation of crude oil, natural gas or other refined petroleum products
Specialized Infrastructure• Airports• Port facilities and inland waterways facilities• Intermodal terminal facilities (freight and passenger)• Interstate, freeway and local roads network• High-speed communications access
Source: The Purdue Center for Regional Development (cluster definitions), 2012.

NIU Center for Governmental Studies 71
Promoting Regional Prosperity in Northwest Illinois
Transportation and Logistics
Regional Overview
The Transportation and Logistics cluster in the Reference Region, a group of 32 counties in northwest Illinois, northeast Iowa, and southwest Wisconsin including the five-county region, had 2,353 establishments and employed 35,054 people in 2010. The average annual wage in this cluster was $40,524, slightly below the average for all industries.
The passenger and freight transportation component (trucking, railroads, airlines, and barge or other shipping operations) represents 59.7% of the total business establishments in the Reference Region and 54.5% of the total employment. Transportation support activities including facilities operations and transportation brokerage services accounts are 24.0% of total business establishments and 23.0% of total cluster employment. The warehousing and storage services component accounts for 14.7% of the firms operating in the Reference Region and 20.4% of total cluster employment (Figure 61).
The cluster has had a growing concentration of employment in the five-county region with location quotients (LQ) of 0.6 in 2001, 0.9 in 2007, and 1.1 in 2010 with many industry subsectors represented in the five-county region. Four subsectors have a strong presence in the Region as measured by concentration of employment (Figure 62).
Figure 62: Transportation and Logistics: Subsectors Based on Employment Concentration
Indicator Location Quotient (2010)
Warehousing and storage 3.6
Transit and ground passenger transportation 1.9
Transport by truck 1.6
Transport by rail 1.4
Source: IMPLAN, 2010.
In the five-county region, the cluster includes 300 establishments and employed 2,298 people in direct cluster jobs in 2010. The average annual wage for direct cluster jobs is $41,559. This cluster has a higher than average concentration of economic activity, as defined by employment and firm LQ, in both the Reference Region and the five-county region, when compared to the nation’s economic activity in this cluster (Figure 63).
Figure 61:Transportation and Logistics: Firms by Employment Size CategoryFigure 61. Firms in the Transportation and Logistics Cluster by Employment Size Category
Self Employed
2 to 9 Employees
10 to 99 Employees
100 to 499 Employees
Over 500 Employees
Source: DecisionData.net, 2011.
Rock Island
Scott
Clinton
Cedar
Jones
Delaware
Dubuque
Jackson
Jo Davies Stephenson
Carroll
Whiteside
Henry
Stark
Bureau
Lee
Ogle
De Kalb
Boone
Le Salle
Putnam
Marshall
Peoria
Woodford
Tazewell
Winnebago
RockGreenLafayette
Iowa
Dane
Grant
Location Quotients (LQ) are used to evaluate local development opportunities and find businesses which are especially suited for the Region. A LQ is the ratio of the employment percentage represented by a given industry in the county to the percentage which that industry represents in the state or a representative area of interest. A ratio greater than one indicates a higher local concentration and a likelihood of exports from the county; a ratio less than one may suggest that goods or services are being imported into the Region.

72 NIU Center for Governmental StudiesTransportation and Logistics
Promoting Regional Prosperity in Northwest Illinois
The transportation component of the cluster includes 64.5% of the total business establishments in the five-county region, but only 39.5% of the total employment. Transportation services accounts for 20.7% of the total business establishments but has 19.6% of the total employment in the cluster.
The warehousing and distribution component includes 14.9% of the firms operating in the five-county region, but has 40.9% of total cluster employment. The majority of companies have small employment with 95.0% having fewer than 100 employees, but they represent about one-third of total employment.
Figure 63: Transportation and Logistics: Economic Activity Summary
Indicator Five-County Region
Reference Region (32 Counties)
Number of Firms (2010) 300 2,353
Percent Change in Number of Firms (2007-2010) 14.5 0.4
Firm Location Quotient (LQ) 2.6 1.6
Employment (2010) 2,298 35,054
Percent Change in Employment (2007-2010) 6.4 -8.4
Employment Location Quotient (LQ) 1.1 1.1
Average Annual Wage (2010) $41,559 $40,524
Percent Change in Average Annual Wage (2007-2010) -- 4.3Sources: U.S. Bureau of Labor Statistics, Quarterly Census of Employment and Wages (QCEW) and the Purdue Center for Regional Development (cluster definitions), 2012.
Although there are few large employers in the industry cluster in the five counties, most engage in warehousing and distribution activities. The surrounding metropolitan areas also contain many large general warehousing companies, corporate distribution centers, and parcel couriers (e.g., Lowes, Nestle, Target, Caterpillar Logistics, and United Parcel Service) (Figure 64).
Figure 64: Transportation and Logistics: Major Employers, Five-County Region
Company Name # of Employees Industry Description City
Walmart Distribution Center 300 Regional Distribution Center Sterling
Total Logistic Control LLC 200 Refrigerated Warehousing and Storage Rochelle
Americold Logistics LLC 140 Refrigerated Warehousing and Storage Rochelle
Dohrn Transfer Company 100 General Freight Trucking - Long-Distance Rock Falls
Canadian National Railway 75 Rail Transportation Freeport
First Student, Inc. 54 Charter Bus Industry Dixon
Sterling Rail Services LLC 33 Support Services for Rail Transportation SterlingSource: Dun & Bradstreet, Inc., 2012.

NIU Center for Governmental Studies 73
Promoting Regional Prosperity in Northwest Illinois
Transportation and Logistics
Industry Trends41
Decline in Small Carriers, Owner-Operators: Rising fuel costs have led to a decline in small and mid-size trucking companies. Unable to negotiate bulk fuel rates, smaller carriers are more vulnerable to price increases. Owner-operators also have less leverage when collecting fuel surcharges, and some brokers fail to pass the surcharges, which they collected, on to the drivers.
Air Cargo Declining; Stronger Demand for Alternative Transportation: Rising costs have caused many U.S. shippers to migrate from air shipping to other modes of transportation. Fewer flights and the high fuel costs associated with air transport have made ship, rail, and truck transport more competitive options to air transport. Joint ventures between ship and truck carriers have succeeded in improving shipment reliability and shortening delivery times. Advances in information systems and innovations in intermodal transport have caused a resurgence in the use of railroads. Railroads are also one of the most cost-effective, environmentally friendly forms of freight transportation.
Increasing Intermodal Revenue: The transfer of containers from ship to truck or intermodal service is one of the largest revenue-generators for Class I railroads, second only to coal. Containers can now be stacked on railcars due to advances in terminal loading and unloading. Shippers seeking cheaper transportation largely drive demand for intermodal services. Intermodal rail accounts for about 20.0% of Class I railroad revenue, according to the Association of American Railroads (AAR).
Logistics Services: From being a passive provider of storage space, the warehousing industry has evolved to providing logistics services which enable customers to identify, track, and expedite individual items through the supply chain. Many warehouse facilities are considered high throughput distribution (HTD) facilities rather than long-term storage buildings.
Larger Warehouses, Electronically Equipped: To provide sophisticated distribution functions for customers, new warehouses are bigger: 1 million square feet is now a common size. With computer systems now controlling the identification and throughput of individual items, special wiring and outlets are installed in warehouses. In some warehouses, a grid of wires in the floor allows computer-guided forklifts to find stored items.
Specialized Equipment: As more warehousing and logistics companies specialize, they require more customized material handling equipment. More site-specific, comfortable, and safe products are especially in demand.
41 Source: Hoovers, Inc., 2013. (www.hoovers.com)

74 NIU Center for Governmental StudiesTransportation and Logistics
Promoting Regional Prosperity in Northwest Illinois
Market Opportunities42
Conserving Fuel: Carriers and owner-operators can maximize profits by managing fuel consumption. New power management technologies allow a truck cab to be warmed or cooled without the engine idling. New aerodynamic body designs, advanced tire technology, and GPS routing can help truckers reduce fuel costs.
Longer Combination Vehicles (LCV): Trucking companies can increase efficiency and save on labor costs by using longer trucks. Federal regulations limit the size of combination vehicles, trucks with two or three trailers, and states limit their use on certain routes.
Increased Productivity through Information Technology: Large carriers are among the most sophisticated users of transportation technology. Many in-cab systems include basic management and dispatching software. New systems incorporate bar code readers, signature capture, and radio frequency identification (RFID) tagging, allowing drivers to quickly manage the transfer of goods. Experience with computer systems has led some truckers to expand into courier and logistics services for large shippers.
In the rail industry, positive train control (PTC) is a highly advanced integrated system of digital data links, GPS, and on-board computers. PTC represents a paradigm shift for railroad operators as routes can be managed by centralized systems, not conventional track signaling.
Capacity Improvements on Key Routes: Railroads are doubling track on key commodity routes, such as coal, to keep up with increased demand. Doubling track on high-volume routes improves traffic flow and reliability. On lines used by Amtrak and regional commuter railroads, double tracks also improve capacity by allowing freight and passenger trains to quickly maneuver around each other.
Public-Private Partnerships (PPP): Public-private partnerships between railroads and local governments can help railroads address public rail infrastructure improvements. The railroad industry has traditionally been wary of PPPs, but the demand for more rail capacity has made them more receptive to investment help from local governments.
Alternative Fuels: Alternative fuels, such as biodiesel, can substantially reduce carbon emissions in the transportation industry compared to standard fuels. Biodiesel has the highest energy content of any alternative fuel and can be used in trucks or locomotives with minor modifications. However, the cost and efficiency of biodiesel has yet to match that of regular diesel fuel. Switching to biodiesel may make it easier for transportation companies to meet the EPA’s requirement to reduce sulfur emissions and may qualify them for alternative fuel tax credits, but may not fully offset higher biodiesel costs.
Outsourcing Warehouse/Distribution Functions: Recognizing the importance of efficient storage and distribution functions, more companies are outsourcing to logistics specialists, known as third-party logistics providers, or 3PLs. In addition to higher efficiency, companies can lower their capital investment and the risk of being stuck with poorly sited facilities. Outside logistics firms are more likely to use public warehousing to meet local distribution needs.
Electronic Record Storage: Some record storage firms are expanding their capabilities from paper documents to electronic records by building computer server farms in secure locations. By providing secure, online storage offsite for customers’ critical computer applications, storage companies are gradually transforming their business from paper to electronic storage.
42 Source: Hoovers, Inc., 2013. (www.hoovers.com)

NIU Center for Governmental Studies 75
Promoting Regional Prosperity in Northwest Illinois
Transportation and Logistics
Supply Chain
This approach examines the value of supply chain inputs, the amount of inputs produced inside the five-county region (represented in most cases by an absorption rate) for the industry clusters studied, and the stages along the supply chain which represent areas of competitive advantage as well as those which present opportunities to attract businesses. Areas of high absorption represent areas along the Transportation and Logistics supply chain which allow the Region to capture the most value from a specific stage in the production or delivery of products and services within the supply chain.
Findings from a supply chain can inform local development strategies by indicating where along the value chain an investment will produce the highest impact on the regional economy and may indicate opportunities for business retention or expansion. Conversely, stages along the supply chain which are underperforming also offer opportunities for business attraction and/or entrepreneurship. When reviewing data relating to industry inputs it is important to compare both the absorption rate and the total value of inputs since certain services or components which maintain a high absorption rate may be of low value to the regional economy. Similarly, certain inputs, regardless of value or absorption, may be of high strategic importance to the Region in efforts to build a stronger industry cluster.
The supply chain information provided presents the flows of trade which support Transportation and Logistics companies both within the five-county region and from outside the Region. The key sectors, which may be appropriate targets for expansion, appear as imports (gaps) from outside the Region, but still within the industry cluster (Figure 65). These gaps are then analyzed in terms of regional strengths and potential areas for targeting and support and are placed into a supply chain analysis to identify stages of the supply chain with the strongest regional presence. In order to fully develop the Transportation and Logistics cluster, the five-county region can make the best progress by focusing on those sectors which do not currently have a strong regional presence, but have significant potential to develop in the Region.
Supply Chain
An essential component for an industry cluster is the local supply chain. While not all inputs (goods or services) that an industry cluster needs can be produced in the local economy, it is desirable to meet as many of the cluster’s needs locally as possible. This analysis reveals the source and amount of purchases among the unique niches in an industry. By identifying the total industry economic outputs and areas where goods and services are purchased from outside the regional economy, one may be in a better position to determine which areas of the industry supply chains are strongest, as well as those that present the best opportunities for growth in the five-county region.
Regional Supply Gap
Difference between Gross and Regional Inputs: a large gap value indicates that a large amount of inputs are imported into the Region, rather than produced within the five-county region.
Regional Inputs
The dollar value of gross inputs which are produced within the Region.
Gross Inputs
Total dollar amount of inputs used by the industry within each sector.

76 NIU Center for Governmental StudiesTransportation and Logistics
Promoting Regional Prosperity in Northwest Illinois
Figure 65: Transportation and Logistics: Key Supply Chain Gaps, Five-County Region
Industry Regional Supply Gap
Regional Inputs
Gross Inputs
% Purchased Outside Region
Motor vehicle parts -$9,402,335 $88,543 $9,490,877 99.1%
Management of companies and enterprises -$3,868,325 $368,568 $4,236,893 91.3
Railroad rolling stock -$1,849,496 $26 $1,849,522 99.9
Plates and fabricated structural products -$1,467,031 $44,705 $1,511,736 97.0
Other aircraft parts and auxiliary equipment -$1,145,754 $60 $1,145,814 99.9Source: IMPLAN, 2010.
For example, the regional Transportation and Logistics cluster requires $9.4 million in inputs (i.e., the products or services required to create a finished product) from the “motor vehicle parts” production. However, only $88,500 is produced in the Region, with the balance purchased from outside the five-county region. This suggests an opportunity for an existing firm or new business to satisfy the regional demand.
Another related opportunity is “other aircraft parts and auxiliary equipment.” Companies in this sector manufacture aircraft parts or auxiliary equipment (except engines and aircraft fluid power subassemblies) and/or develop and make prototypes of aircraft parts and auxiliary equipment. Auxiliary equipment can include such items as crop dusting apparatus, armament racks, in-flight refueling equipment, or external fuel tanks. Although the supply chain gaps in these industries are large, we should note that automotive and aerospace companies have a strong presence in the Rockford metro area. It is possible that a portion of these supply chain gaps are filled by companies in the Rockford area.
Also, there is some anecdotal evidence that motor vehicle parts manufacturers within the five-county region located here because of the larger industry in the Rockford area. Development of these supply chain opportunities is possible if they can be pursued in a cooperative manner between the five-county region and the Rockford area.
Since only 2010 data is available for the supply chain analysis, the impact of the Nippon-Sharyo railcar manufacturing facility in Rochelle is not reflected in the results. The supply chain gap for the railroad rolling stock industry is likely much smaller now than shown in the table but planned expansions in the Nippon-Sharyo plant could benefit the Region substantially.
Motor vehicle parts
(NAICS Sector 3363)
This industry comprises establishments primarily engaged in the manufacturing and/or rebuilding motor vehicle parts and accessories. » Motor Vehicle Gasoline Engine and Engine Parts.
» Motor Vehicle Electrical and Electronic Equipment
» Motor Vehicle Steering and Suspension Components
» Motor Vehicle Transmission and Power Train Parts

NIU Center for Governmental Studies 77
Promoting Regional Prosperity in Northwest Illinois
Transportation and Logistics
Workforce Requirements, Supply and Demand
The available workforce for the Transportation and Logistics cluster has been an ongoing issue, just as it has for manufacturing in general. The lack of qualified workers stems from the wave of retirements of the Baby Boom generation of skilled laborers. Although cluster employment has remained mostly stable during the past decade, the next generation of potential workers is relatively small. This is due in part to general demographic trends and the propensity of many younger workers to pursue white collar careers.
The Transportation and Logistics cluster has a somewhat younger age profile (46.0% are age 25 to 44 years), than some manufacturing sectors (Figure 66). Wages are also lower than for comparable age groups in the manufacturing sector. This pattern could reflect a younger, less experienced workforce, a higher number of part-time and seasonal workers employed, or may mean that many jobs require less training and experience than other industries.
Figure 66: Transportation and Logistics: Employment and Wages by Age Group, Five-County Region
Age Group Employment (Percent of Total)
Average Annual Wage
Under 25 Years 7.7% $14,269
25-44 Years 46.0 33,893
45-64 Years 41.0 38,525
65 Years & Older 5.2 20,202
Source: U.S. Bureau of Labor Statistics, Quarterly Census of Employment and Wages, 2011.
In total, 56.3% of the employment and 54.7% of the wages in the cluster are concentrated in Transportation and Material Moving occupations (Figure 67). This occupational sector represents the largest single share of the jobs in the five-county region. Ensuring that appropriately skilled workers are available at competitive rates of compensation will be critical to maintaining the manufacturing sector in the Region43 .
Figure 67: Transportation and Logistics: Staffing Patterns, Five-County Region
Occupational Classification Share or Employment Share of Wages Average Annual WageTransportation and Material Moving 56.3% 54.7% $41,407
Office and Administrative Support 21.7 17.7 34,684
Installation, Maintenance, and Repair 6.1 7.1 49,729
Personal Care and Service 4.7 4.5 40,417
Management 2.6 6.0 97,934
Business and Financial Operations 2.0 2.8 59,604
Production 1.7 1.5 35,877
Sales and Related Occupations 1.5 1.7 50,018Sources: U.S. Bureau of Labor Statistics, Quarterly Census of Employment and Wages (QCEW) and the Purdue Center for Regional Development (cluster definitions), 2012.
43 In 2008, Production, Installation, Maintenance, Repair or Transportation and Material Moving occupations accounted for 23.0% of all occupational employment in Workforce Investment Board Region #4.
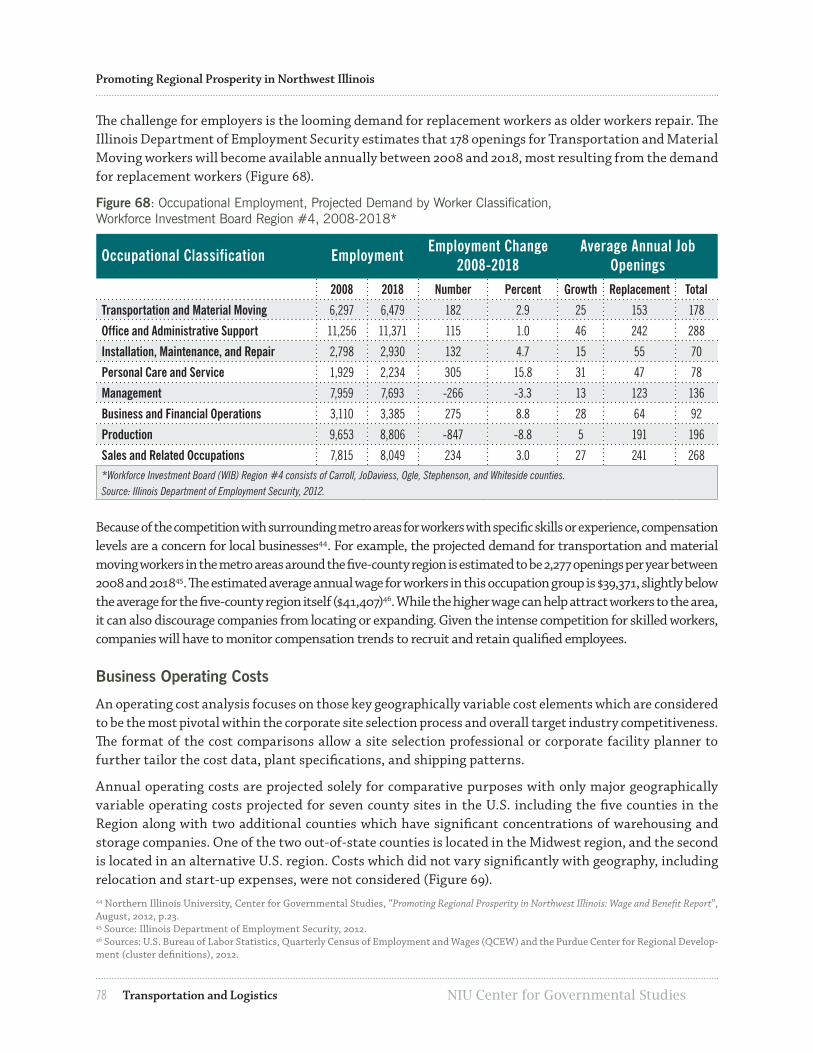
78 NIU Center for Governmental StudiesTransportation and Logistics
Promoting Regional Prosperity in Northwest Illinois
The challenge for employers is the looming demand for replacement workers as older workers repair. The Illinois Department of Employment Security estimates that 178 openings for Transportation and Material Moving workers will become available annually between 2008 and 2018, most resulting from the demand for replacement workers (Figure 68).
Figure 68: Occupational Employment, Projected Demand by Worker Classification, Workforce Investment Board Region #4, 2008-2018*
Occupational Classification Employment Employment Change 2008-2018
Average Annual Job Openings
2008 2018 Number Percent Growth Replacement Total
Transportation and Material Moving 6,297 6,479 182 2.9 25 153 178
Office and Administrative Support 11,256 11,371 115 1.0 46 242 288
Installation, Maintenance, and Repair 2,798 2,930 132 4.7 15 55 70
Personal Care and Service 1,929 2,234 305 15.8 31 47 78
Management 7,959 7,693 -266 -3.3 13 123 136
Business and Financial Operations 3,110 3,385 275 8.8 28 64 92
Production 9,653 8,806 -847 -8.8 5 191 196
Sales and Related Occupations 7,815 8,049 234 3.0 27 241 268*Workforce Investment Board (WIB) Region #4 consists of Carroll, JoDaviess, Ogle, Stephenson, and Whiteside counties. Source: Illinois Department of Employment Security, 2012.
Because of the competition with surrounding metro areas for workers with specific skills or experience, compensation levels are a concern for local businesses44. For example, the projected demand for transportation and material moving workers in the metro areas around the five-county region is estimated to be 2,277 openings per year between 2008 and 201845. The estimated average annual wage for workers in this occupation group is $39,371, slightly below the average for the five-county region itself ($41,407)46. While the higher wage can help attract workers to the area, it can also discourage companies from locating or expanding. Given the intense competition for skilled workers, companies will have to monitor compensation trends to recruit and retain qualified employees.
Business Operating Costs
An operating cost analysis focuses on those key geographically variable cost elements which are considered to be the most pivotal within the corporate site selection process and overall target industry competitiveness. The format of the cost comparisons allow a site selection professional or corporate facility planner to further tailor the cost data, plant specifications, and shipping patterns.
Annual operating costs are projected solely for comparative purposes with only major geographically variable operating costs projected for seven county sites in the U.S. including the five counties in the Region along with two additional counties which have significant concentrations of warehousing and storage companies. One of the two out-of-state counties is located in the Midwest region, and the second is located in an alternative U.S. region. Costs which did not vary significantly with geography, including relocation and start-up expenses, were not considered (Figure 69). 44 Northern Illinois University, Center for Governmental Studies, “Promoting Regional Prosperity in Northwest Illinois: Wage and Benefit Report”, August, 2012, p.23.45 Source: Illinois Department of Employment Security, 2012.46 Sources: U.S. Bureau of Labor Statistics, Quarterly Census of Employment and Wages (QCEW) and the Purdue Center for Regional Develop-ment (cluster definitions), 2012.

NIU Center for Governmental Studies 79
Promoting Regional Prosperity in Northwest Illinois
Transportation and Logistics
Figure 69: Warehousing and Storage: Geographically Variable Operating Cost Comparison
County Name Total Annual Operating Costs
Northampton County, PA $14,730,294
Stephenson County, IL 12,921,810
Ogle County, IL 12,873,896
Whiteside County, IL 12,866,672
Carroll County, IL 12,753,789
Lee County, IL 12,664,759
Clark County, KY 12,247,060Source: The Boyd Company, Inc., 2012.
The Region was the most competitive with peers in site acquisition and property tax costs. However, the labor costs were higher than for the peer location in the southeastern U.S. The Region was the most competitive in terms of shipping costs versus its peers. Estimated outbound shipping costs from the five-county region were nearly equal to Clark County, KY, and were 21.0% to 23.0% below Northampton County, PA. This underscores the advantages of northwest Illinois’ strategic location and transportation assets, as well as its access to national and global markets.
Key Takeaways
» The Transportation and Logistics cluster in the five-county region has a concentration of firms which is 2.6 times the national average and an employment concentration which is 1.1 times the national average. The Reference Region also ranks above the national average in both categories.
» Aligning public infrastructure investments with industry development strategies will be critical to maintaining the Region’s competitive advantage in this cluster. There are under-used or underdeveloped assets which if developed could dramatically improve the Region’s economy. Examples include the Global III Intermodal facility, the Whiteside Regional Airport, and the former Savanna Army Depot.
» The growth of Transportation and Logistics operations in terms of companies and operations can be leveraged to retain and to attract businesses and jobs in other industry sectors, especially agriculture, wholesale, and manufacturing.
» The Baby Boomers will create most of the demand for new workers, despite static and declining overall employment in the industry. Since other industries will experience the same challenges, competition for skilled workers will increase due to the limited number of potential younger workers.
» The five-county region’s strategic location in terms of proximity to major markets and transportation assets, along with competitive tax and site acquisition costs makes it attractive for warehouse and distribution operations.
Costs of Doing Business
Since most businesses operate in a real-time global marketplace, their focus is on maintaining comparative advantage through sourcing and supplying products profitably. Cost components such as labor, taxes, real estate, and utilities are key measures which most companies use to decide where to locate or expand their operations.
Operating cost analysis focuses on those key geographically variable cost elements which are considered to be the most pivotal within the corporate site selection process and the overall target industry competitiveness.


NIU Center for Governmental Studies 81
Promoting Regional Prosperity in Northwest Illinois
Goals, Strategies, and Recommendations
GOALS, STRATEGIES, AND RECOMMENDATIONSBased on the regional analysis and business leaders’ input the advisory committee agreed on a regional vision, five regional goals, regional action strategies, potential regional partners, and recommendations for moving forward.
Once the goals and strategies had been developed, the advisory committee prioritized the strategies according to ease of implementation and potential impact on the Region. Each strategy was rated on a scale of zero to five, with zero representing the easiest to implement or the least regional impact, and five representing the most difficult to implement or the greatest regional impact. For each strategy, the average difficulty rating was subtracted from the average impact rating. An ideal strategy would have a final score of five--high impact and low difficulty in implementation. The strategies are listed in the order in which they were ranked by the advisory committee within each goal. At the end of this section the strategies are ranked overall, without regard to which goal they fall under.
The next section describes each goal, the context for choosing each goal, recommended strategies ranked in order based on scoring, potential partners, and best practices which may be effective in implementing the strategies.
REGIONAL VISIONIn the next three years the five-county region will…
» Strongly encourage entrepreneurship with a highly supportive business environment;
» Invest in necessary local infrastructure to support current and future businesses;
» Leverage existing and emerging industrial assets and capabilities; and
» Market regional assets to attract and retain young professionals.
REGIONAL GOALSGoal I: Develop a competitive and highly productive workforce with up-to-date skills and capable of using the latest technology in production processes.
Goal II: Support major existing and emerging growth industries such as transportation and aerospace component manufacturing to become a major Midwestern production/assembly region.
Goal III: Create an entrepreneurial region with a climate which supports new business formation and encourages existing businesses to invest and prosper.
Goal IV: Make better use of local (regional) inputs and specialties to develop a highly profitable agribusiness and food processing region integrated into Midwestern markets.
Goal V: Leverage and market existing regional assets to encourage growth, enhance the quality of life, and maximize the potential of the region.

82 NIU Center for Governmental StudiesGoals, Strategies, and Recommendations
Promoting Regional Prosperity in Northwest Illinois
GOAL I: DEVELOP A COMPETITIVE AND HIGHLY PRODUCTIVE WORK FORCE WITH UP-TO-DATE SKILLS AND CAPABLE OF USING THE LATEST TECHNOLOGY IN PRODUCTION PROCESSES.
Context
Competition for skilled workers is projected to be strong both locally and nationally. The Region will be challenged by competition from surrounding metro areas such as Dubuque, Rockford, Quad Cities, and Chicago since they offer more employment opportunities and in some cases higher wages. This issue is critical because of the projected declines in the working-age population and the increased demand for replacement workers from Baby Boomer generation retirements. For example, the projected replacement demand for production workers is 191 annually from 2008 to 2018. The number of production workers needed by companies in the Rockford and Quad Cities metro areas will be several times larger.
Additional factors must be considered.
» The underemployment study, conducted in this project, identified a substantial number of potential workers who lack the training, skills, or experience to qualify for many jobs available in the Region. The study indicated 2.0% (200) of the underemployed and 6.0% (570) of the unemployed individuals who are actively seeking work in the Region also lack a high school diploma or GED.
» Interviews with area businesses confirmed this situation and also raised concerns about the work ethic, reading, math, and social skills of some applicants.
» Area businesses, especially manufacturers, expect technological changes (e.g., additive manufacturing, robotics) during the next decade which will require workers to have a high degree of competency in product or system design, production, and maintenance skills.
» Attracting and retaining management, professional, and technical talent have been challenging because of the relatively small number of positions available and the competition from surrounding areas.
Consider Dual-Credit Courses to Provide Technical Education for High School Students Entering the Workforce
Lewis and Clark Community College in Madison County, Illinois http://www.lc.edu/degrees/HSpartnership
According to a report on dual-credit courses in the Illinois Community College System, Lewis and Clark Community College offers the most dual-credit courses in career and technical education in the state. Lewis and Clark College has partnered with 20 local high schools, allowing students to enroll in college-level courses on subjects including information technology, CAD, and welding. Through these courses, high school students gain technical skills which help them transition into the workforce after they graduate. For the students of dual-credit courses through Lewis and Clark Community College, no charge for tuition or books is required.
The Region will be challenged by competition from surrounding metro areas such as Dubuque, Rockford, Quad Cities, and Chicago since they offer more employment opportunities and in some cases higher wages.

NIU Center for Governmental Studies 83
Promoting Regional Prosperity in Northwest Illinois
Goals, Strategies, and Recommendations
» Discussions with businesses also indicated that a central location for skills training and other technical assistance from agencies in the Region would make these services easier to access.
» Local employers also indicated that perceptions about career potential and quality of life may play a role in the Region’s attractiveness to young professionals who will be needed in the next decade.
Recommended Strategies
1. Form alliances between employers and educational institutions to plan future programs by engaging businesses in mentoring activities connected with educational programs and career centers. Businesses can provide apprenticeships, summer employment programs, and/or other training opportunities for youth. Examine how current course offerings fit with regional priorities and growth industries to identify potential deficiencies.
2. Survey community colleges and training centers in the Region to inventory the courses, workshops, and training offered to secondary school and college students, as well as lifelong learners. Assess the adequacy of these programs to meet current and future needs of employers. Connect graduates of programs with potential employers through Career Fairs and other exchanges.
3. Develop and implement ongoing programs to improve the customer service and social skills of employees in the Region (e.g., Certificate of Employability, CareerTec, WorkKeys) in order to provide high-quality, dependable, and well-trained employees.
4. Work with the WIBs to coordinate and focus existing workforce development programs and funding to meet employers’ needs.
Certificate of Employability
Schenectady County Community College, New York, Certificate of Employability http://www.coeny.com/
Schenectady County Community College surveyed over 100 local employees to identify areas of improvement for the entry-level workforce and then developed a 30-hour training course based on the needs of businesses surveyed. The Certificate of Employment program’s curriculum is based on soft skills such as reliability, accepting constructive criticism, respect for coworkers and customers, and adherence to company rules. Employers interested in hiring individuals with a Certificate of Employment have registered with program personnel, providing evidence that employers value the program and consider the certificate when hiring.
Sauk Valley Community College, Illinois, WorkKeys, Pre-Employability Screening http://www.svcc.edu/news/archive/2008-08-WorkKeys-Testing-Site.html
Sauk Valley Community College is a registered, certified site for the WorkKeys Online testing program, a job skills assessment system for measuring, communicating, and improving the common skills required for workplace success. WorkKeys quantitatively assesses skills in several areas in individuals and in actual jobs, so it can correctly identify individuals with the skills required to be successful in a specific job or career. Using WorkKeys, Sauk can show a potential employer that a job applicant meets the profiled requirements of a job opening. Six specific areas which can be measured through testing include Applied Technology, Applied Mathematics, Business Writing, Locating Information, Reading for Information, and Observation.

84 NIU Center for Governmental StudiesGoals, Strategies, and Recommendations
Promoting Regional Prosperity in Northwest Illinois
5. Systematically evaluate workforce concerns by local businesses and assess their expected employee needs in the next 3-5 years through working with partners such as the Whiteside Area Career Center, CareerTec, Highland Community College, and Sauk Valley Community College. Extend the programs to other businesses as needed. Develop Business Advisory Committees for programs.
6. Generate financial support and resources for entrepreneurial manufacturing and related service firms in these activities.
7. Create and publicize incentives to attract and retain young professionals (e.g., 22-40 years old) by assessing the current attractiveness of the Region using contacts with young professionals, as well as an inventory of area attractions, housing options, and employment availability in growth industries. These incentives could include creating and/or supporting a regional “Young Professionals Organization” or similar groups working with community colleges, YMCAs, sport leagues, etc., to build ties with people in this age category.
8. Provide market research, export education, business intelligence, and mentoring to assist 2nd stage companies interested in expansion.
9. Create a Region-wide Manufacturing Technology Innovations Center (MTIC) which works with the regional career centers to provide a forum for continuous networking, exchange of information on best practices, new business technology, and emerging industry needs. Provide these opportunities at several locations, if necessary, considering the distances which must be traveled to obtain services. The Apollo Career Center in Ohio (www.apollocareercenter.com) and Aileron (www.aileron.org) are examples of possible approaches.
10. Provide employer-funded, shared lab space and equipment in the MTIC to stimulate research and development of mutually beneficial technologies which advance regional businesses.
11. Implement dual-credit courses where secondary school students can enroll in technical programs while attending school to improve their transition to the workforce. Deliver training and educational programs online in conjunction with other workforce organizations, community colleges, and other educational training agencies. Create a curriculum pathway to community colleges and four-year institutions.
12. Within the MTIC, design a “Manufacturing Technology Academy” with a curriculum dedicated to upgrading workforce skills (adults and current students) to meet current manufacturers’ requirements. Prepare suitable coursework for adults in partnership with regional career centers, community colleges, and other agencies. Include internships with local businesses as part of the curriculum.
Focus Efforts on Attraction and Retention of Young Professionals
City of Charleston, West Virginia
http://dailymail.com/News/201208220104
The manager of Charleston has proposed partnering with local businesses to provide housing incentives for young professionals. The city would build an apartment complex and provided subsidized rent for young employees planning to live in Charleston for at least three years. Rent subsidies would be provided by the employers as part of the employee’s salary and employees would pay an amount of rent out of pocket. At the end of three years employees under this program are eligible for a $15,000 loan toward the purchase of a house in Charleston. If the employee stays in the house for three years the loan will be forgiven. Construction of the apartment complex would be funded partially by revenue bonds backed by rent payments.

NIU Center for Governmental Studies 85
Promoting Regional Prosperity in Northwest Illinois
Goals, Strategies, and Recommendations
Potential Regional Partners
» Superintendent of Sterling Schools and other K-12 officials » Surgeons of Steel Program » Whiteside Area Career Center » Morrison Institute of Technology » Workforce Investment Board » Sauk Valley and Highland Community College officials » Business owners and managers » Career Tec » NIU CEET » Economic development and chamber of commerce officials
GOAL II: SUPPORT MAJOR EXISTING AND EMERGING GROWTH INDUSTRIES SUCH AS TRANSPORTATION AND AEROSPACE COMPONENT MANUFACTURING TO BECOME A MAJOR MIDWESTERN PRODUCTION/ASSEMBLY REGION.
Context
The regional economy has a strong manufacturing tradition which still accounts for approximately 15.0% of the total employment and 25.0% of the regional output. Promoting “advanced manufacturing” will help the Region to become more competitive in the future. Advanced manufacturing involves innovative processes and productive capabilities used by companies and their workers in many industries, so it is important to provide a support base in the Region for training and technical assistance to facilitate advances by manufacturers.
Business focus groups held in the Region identified a need for more communication among businesses regarding the availability of inputs, but also with educational institutions and public agencies regarding programs of assistance and other services. A special concern expressed in the forums was about the difficulties experienced by small businesses in applying for financial incentives or obtaining financing for start-ups or expansions.
The growth of the aerospace industry in Rockford, for example, could offer opportunities for local manufacturers to diversify their customer base while building on traditional expertise and capabilities. In recent years, significant advancements in technology and innovation have occurred within the aerospace industry, and the impact of these advances has been felt in numerous other industries as new applications and spin-offs emerge.
The regional economy has a strong manufacturing tradition which still accounts for approximately 15.0% of the total employment and 25.0% of the regional output. Promoting “advanced manufacturing” will help the Region to become more competitive in the future.
86 NIU Center for Governmental StudiesGoals, Strategies, and Recommendations
Promoting Regional Prosperity in Northwest Illinois
» The advisory committee and local businesses expressed a desire to maintain the Region’s competitive advantage in the manufacturing sector given the skills and capabilities of local businesses and the workforce.
» Research on the Region identified several industry clusters which offer significant development opportunities:
• Fabricated Metal Products Manufacturing• Machinery Manufacturing• Transportation Equipment Manufacturing
» The aerospace manufacturing niche includes businesses involved at all stages of the value chain for aircraft, space equipment, and other aeronautic production. These industries range from aircraft materials and component manufacturers to specialized electronics producers and large-scale assemblers.
• The Rockford area has five major Tier I aerospace supply companies (e.g., Hamilton-Sundstrand and Woodward), as well as many smaller suppliers and subcontractors.
• The planned expansion of Woodward in Loves Park will offer more opportunities for local suppliers. » Maintaining and enhancing these competitive advantages will require collaboration, innovation,
and the adoption of new technologies within these industries as well as financing opportunities.
Recommended Strategies
1. Inventory the processes and production capabilities of small and medium-size job shops to determine if new supplier-customer relationships could be developed by firms within the Region or nearby. Also use the knowledge gained about these processes and production capabilities as a marketing tool to attract businesses or industries to the Region.
2. Examine the skills and other workforce characteristics needed to produce these types of inputs and to work in the distribution network in the Region.
3. Form a task force of interested business leaders in selected clusters and find ways to move ahead. Possibly use a Strategic Doing approach—what can, should, and will the Region do together to promote regional development and employment? More information and research into opportunities for implementing Green Strategies and using technology to reduce costs should be provided especially to smaller companies.
4. Assess options for increasing the services provided throughout the Region by agencies such as a regional Small Business Development and Entrepreneurship Center which works with currently underserved areas. This agency and other technical assistance
Explore Partnerships with Other Institutions for Vocational Training Courses.
Joint Institute of Engineering and Technology-Aerospace (JIET-A) in Rockford http://jiet.aero/3299/about_jieta
JIET-A partners with aerospace companies and educational institutions in northern Illinois to provide comprehensive education for students who are interested in careers in the aerospace industry. Students enroll in JIET-A programs through one of several educational institutes of their choice including Rock Valley College and Northern Illinois University. While students take courses in engineering, mathematics, and information technology, they work as interns for companies such as GE Aviation and B/E Aerospace. Students graduate from JIET-A programs with the skills and experience demanded by aerospace companies.

NIU Center for Governmental Studies 87
Promoting Regional Prosperity in Northwest Illinois
Goals, Strategies, and Recommendations
services such as Economic Gardening, Illinois Manufacturing Extension Center, and related programs can be located in the Manufacturing Technology Innovation Center (MTIC). Outreach efforts should be coordinated in the Region to minimize overlap and/or underserved areas. The business forums indicated that current intermediate agencies, such as the SBDC, are underfunded.
5. Explore partnerships with Rock Valley College, MIT, NIU-College of Engineering and Engineering Technology, Sauk Valley Community College, Highland Community College, and other higher education institutions to provide vocational training courses for specific industries.
6. Prepare value chain analyses for industries which regional development practitioners are interested in contacting. Examine these prospective businesses regarding how they can fit into a regional clustering and marketing scheme.
7. Inventory inputs which are purchased outside of the Region by current manufacturers and determine whether sufficient volume and/or capacity exist to produce them locally. Also determine whether existing companies could retool and meet these demands, such as producing in Rochelle the components for the Nippon-Sharyo railcar production facility which are currently imported from overseas. Design a marketing program to attract businesses in the top 3-4 industries best suited for the Region, based on the analyses in this report and previous studies.
8. Design a regional manufacturing network or collaborative of manufacturing and business leaders which meets quarterly to help “change the narrative” about manufacturing, identify new opportunities and markets, and help educational institutions shape programs to meet labor demands by having manufacturing groups participate in internship programs or similar activities. This approach could address the communication issues discussed earlier.
9. Evaluate opportunities to work with EigerLab in Rockford and/or assess ways in which the Manufacturing Technology Academy can link with EigerLab to bring their services to the Region.
10. Evaluate the findings of the cost of operation comparisons for the Region with other competitive sites and incorporate them into decisions about marketing to prospective firms.
11. Use the network formed by the task force to support a ListServ, regional website, or other online communication program to provide information about sharing specialized equipment and/or services. Creating a ‘Craig’s List’ for manufacturing opportunities was mentioned in a business forum. The network could also host a “Manufacturing Fair” to build more awareness in the Region, but also to better inform companies about the inputs available in the Region and to encourage collaborations about pursuing new markets.
12. Using existing research, analyze the aerospace industry potential, needs for labor and other inputs, and related activities where the Region could serve Aerospace cluster participants. Start on-going discussions with personnel in the aerospace cluster industries.
13. Working with the MTIC and MTA, this network could sponsor a periodic assessment of the state of the Region regarding trends and opportunities for future development and expansion. The Carson Manufacturer’s Forum, which works with Western Nevada College, could be an example (http://manufacturingcollaborative.com).
14. Capitalize on the expansion of regional aerospace suppliers, such as Woodward and Hamilton Sundstrand in Rockford, to determine what components and technical training for technicians, engineers, and others will be required to operate in the next decade.

88 NIU Center for Governmental StudiesGoals, Strategies, and Recommendations
Promoting Regional Prosperity in Northwest Illinois
Potential Regional Partners
» EIGER Lab » NIU College of Engineering » Business owners and managers » NIU Center for Governmental Studies » Economic development and chamber of commerce officials » Rock Valley Community College » Morrison Institute of Technology » Rockford Area Aerospace Cluster » Rockford Area Economic Development Council (RAEDC) » Workforce Investment Board » Small Business Development Center
GOAL III: CREATE AN ENTREPRENEURIAL REGION WITH A CLIMATE WHICH SUPPORTS NEW BUSINESS FORMATION AND ENCOURAGES EXISTING BUSINESSES TO INVEST AND PROSPER.
Context
Research on northwestern Illinois and rural areas in general shows that locally owned, small businesses (those with fewer than 10 employees) are a primary source of job creation and are more likely to stay in the area as they expand. Past research (confirmed by interviews with local business owners) also shows that locally owned, small businesses can be lost due to a lack of succession planning and/or a lack of buyers for the businesses. Many such businesses may be at risk for this reason and, if serious efforts are made to prepare young adults for these opportunities, these businesses could be retained and continue under new ownership.
Along with developing and retaining workers coming into the labor force, it is crucial to identify, train, and retain the next generation of entrepreneurs to successfully take over current businesses and create new ones. Business starts in the Region lag behind those in adjacent areas. For instance, between 2004 and 2007, rural areas (non-metropolitan) in Iowa had 2.81 business starts per 1,000 population, while rural Wisconsin had 3.12 per 1,000. The average (weighted) for the five counties was 1.61 per 1,000 residents during this period. The comparisons with Iowa and Wisconsin are more relevant than with Illinois because southern Illinois has a substantially different economy than northern Illinois.
Within the Region, Stephenson and Ogle counties were highest, and Carroll County was lowest. Possible explanations include population density, income, and other local characteristics. An important point is that this comparison reinforces comments in the manufacturers’ forums saying that technical assistance is needed especially by small establishments, and parts of the Region have limited access, on a regular basis, to small business development support.
Along with developing and retaining workers coming into the labor force, it is crucial to identify, train, and retain the next generation of entrepreneurs to successfully take over current businesses and create new ones.
NIU Center for Governmental Studies 89
Promoting Regional Prosperity in Northwest Illinois
Goals, Strategies, and Recommendations
» Comparisons of business starts per 10,000 population in the Region with non-metro areas in Iowa and Wisconsin (based on NETS data) show that the Region as a group lags well behind other areas in new establishment formations. A goal for the Region could be to surpass other areas in business formations and substantially reduce business closures.
» Counties in the Region, except Whiteside, have minimal, if any, regular small business support services as noted in the manufacturers’ forums.
» The number of jobs lost in the Region between 2000 and 2009 by companies which closed, downsized, or moved out surpassed by 11,000 the number of jobs created in those which opened, expanded, or moved into the area.
» Small businesses often do not have the internal expertise to effectively participate in the state and federal programs available.
» Efforts to encourage or support new business starts or small business growth are fragmented, underfunded, and need better coordination to increase their effectiveness.
Recommended Strategies
1. Work with local educational institutions to make students in grades 8-12 aware of the opportunities which are available in business careers. These efforts could include a business plan competition for juniors and seniors, a scholarship program sponsored by philanthropic organizations in the Region, and other approaches which have been used elsewhere. For example, the Southern Entrepreneurship Program has been used successfully with high school and community college students in Mississippi. The Creating Entrepreneurial Opportunities Program in Effingham, Illinois, and by the Whiteside Area Career Center, are other examples, as is the EIGERLab FastPitch competitions in northern Illinois and southwest Wisconsin.
2. Consider the formation of business led initiatives to encourage youth to consider careers or entrepreneurship opportunities. This approach can be started in partnership with existing organizations such as Kiwanis, Jaycee’s, Boys and Girls Clubs, Scouts, 4-H, or Future Farmers of America.
Promote Business Starts and Support Entrepreneurs within the Region
Littleton, Colorado-Economic Gardening http://www.littletongov.org/bia/economicgardening/
The city of Littleton has an economic development strategy based on helping existing local businesses grow, as opposed to traditional methods of small business development or attraction of large companies to an area. The program has three components: information, infrastructure, and connections. Information: The city subscribes to numerous databases for developing marketing lists, competitive intelligence, and industry trends, then shares with business owners so that they may identify new business opportunities. Infrastructure: The city invests not only in its physical infrastructure but also in its knowledge infrastructure by developing business-related courses in partnership with local community colleges. Connections: The city maintains contacts with think tanks, state universities, and CEOs in order to introduce local business owners to new opportunities outside their communities.
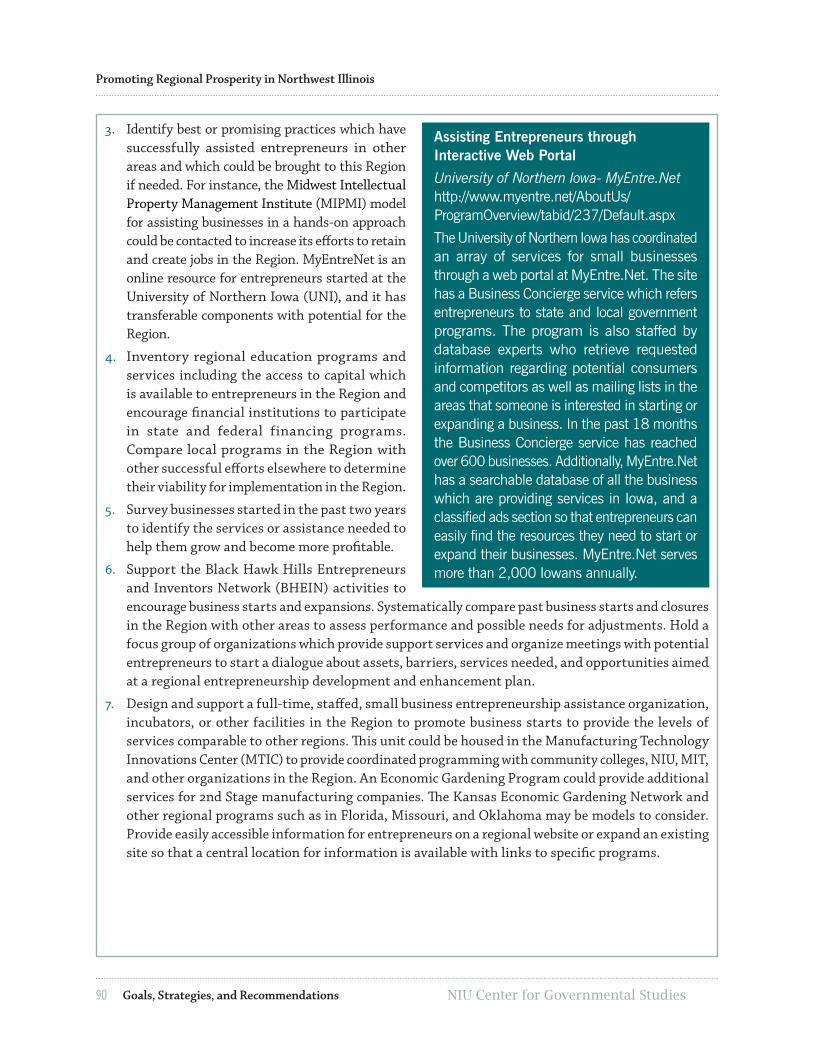
90 NIU Center for Governmental StudiesGoals, Strategies, and Recommendations
Promoting Regional Prosperity in Northwest Illinois
3. Identify best or promising practices which have successfully assisted entrepreneurs in other areas and which could be brought to this Region if needed. For instance, the Midwest Intellectual Property Management Institute (MIPMI) model for assisting businesses in a hands-on approach could be contacted to increase its efforts to retain and create jobs in the Region. MyEntreNet is an online resource for entrepreneurs started at the University of Northern Iowa (UNI), and it has transferable components with potential for the Region.
4. Inventory regional education programs and services including the access to capital which is available to entrepreneurs in the Region and encourage financial institutions to participate in state and federal financing programs. Compare local programs in the Region with other successful efforts elsewhere to determine their viability for implementation in the Region.
5. Survey businesses started in the past two years to identify the services or assistance needed to help them grow and become more profitable.
6. Support the Black Hawk Hills Entrepreneurs and Inventors Network (BHEIN) activities to encourage business starts and expansions. Systematically compare past business starts and closures in the Region with other areas to assess performance and possible needs for adjustments. Hold a focus group of organizations which provide support services and organize meetings with potential entrepreneurs to start a dialogue about assets, barriers, services needed, and opportunities aimed at a regional entrepreneurship development and enhancement plan.
7. Design and support a full-time, staffed, small business entrepreneurship assistance organization, incubators, or other facilities in the Region to promote business starts to provide the levels of services comparable to other regions. This unit could be housed in the Manufacturing Technology Innovations Center (MTIC) to provide coordinated programming with community colleges, NIU, MIT, and other organizations in the Region. An Economic Gardening Program could provide additional services for 2nd Stage manufacturing companies. The Kansas Economic Gardening Network and other regional programs such as in Florida, Missouri, and Oklahoma may be models to consider. Provide easily accessible information for entrepreneurs on a regional website or expand an existing site so that a central location for information is available with links to specific programs.
Assisting Entrepreneurs through Interactive Web Portal
University of Northern Iowa- MyEntre.Net http://www.myentre.net/AboutUs/ProgramOverview/tabid/237/Default.aspx
The University of Northern Iowa has coordinated an array of services for small businesses through a web portal at MyEntre.Net. The site has a Business Concierge service which refers entrepreneurs to state and local government programs. The program is also staffed by database experts who retrieve requested information regarding potential consumers and competitors as well as mailing lists in the areas that someone is interested in starting or expanding a business. In the past 18 months the Business Concierge service has reached over 600 businesses. Additionally, MyEntre.Net has a searchable database of all the business which are providing services in Iowa, and a classified ads section so that entrepreneurs can easily find the resources they need to start or expand their businesses. MyEntre.Net serves more than 2,000 Iowans annually.

NIU Center for Governmental Studies 91
Promoting Regional Prosperity in Northwest Illinois
Goals, Strategies, and Recommendations
Potential Regional Partners
» Financial Institutions » NIU Center for Governmental Studies » Morrison Institute of Technology » Blackhawk Hills Regional Council (BHRC) » Blackhawk Hills Entrepreneurs and Inventors
Network (BHEIN) » Business owners and managers » Economic development and chamber of
commerce officials » Youth organizations such as 4-H, Future
Farmers of America, Scouts, and other groups » Sauk Valley Community College » Highland Community College
GOAL IV: MAKE BETTER USE OF LOCAL (REGIONAL) INPUTS AND SPECIALTIES TO DEVELOP A HIGHLY PROFITABLE AGRIBUSINESS AND FOOD PROCESSING REGION INTEGRATED INTO MIDWESTERN MARKETS.
Context
The advisory committee and local businesses expressed an interest in developing the Region’s potential in terms of new crops (especially organic and specialty foods) and the expansion of value added opportunities by processing more local agricultural products and by-products within the area with a focus on agricultural product manufacturing.
» Work on these issues is already underway, especially in Whiteside and Stephenson counties. Farmers’ Markets exist in several cities in the Region. “Buy Local” programs have brought a renewed sense of ‘local is better’ for both the economy and healthier lifestyles with state and federal funding supporting this effort.
» The productivity of the agricultural land and the proximity to local food activities in both Wisconsin and Winnebago County offer viable development opportunities in the five counties.
Creating Entrepreneurial Opportunities for Youth (CEO)
Effingham County, Illinois http://www.effinghamceo.com
CEO is a one-year entrepreneurial training class offered to secondary school students in several school districts in Effingham County, Illinois, and is supported by community leaders and local business owners. CEO students receive comprehensive instructions on running a business from conceptualization to operation. Students learn to frame their business ideas in terms of costs versus benefits, economic opportunity, and competitive advantage. Students also learn marketing and record-keeping skills. Finally, students prepare business plans to present to business leaders and investors. According to a CEO annual report, the organization operates an angel investment fund which offers capital for graduates who implement business plans in the county.
The productivity of the agricultural land and the proximity to local food activities in both Wisconsin and Winnebago County offer viable development opportunities in the five counties.
92 NIU Center for Governmental StudiesGoals, Strategies, and Recommendations
Promoting Regional Prosperity in Northwest Illinois
» The Agriculture, Food Production, and Technology cluster has a strong competitive advantage in terms of employment concentration (2.5 times the U.S. average), output (3.4 times the U.S. average), and worker compensation (3.6 times the U.S. average).
» The Region has had experiences with agricultural organizations in the past. Building on initiatives such as the Northwest Illinois Ag Coalition (NIAC) formed in 2003 could be useful. While NIAC dissolved in 2006 due to funding issues, it had several successes including the Twin Cities Market located in Sterling and a local foods program in Freeport. Given the renewed interest in food processing and manufacturing, NIAC may have been ahead of its time and should be reevaluated.
» The Kitchen Incubator of Northwestern Illinois offers a base of operations for people who are interested in processing and marketing local produce. This initiative has up-to-date technology and can be promoted as an Agribusiness industry. Expanding this operation could open new markets for producers in the Region.
Recommended Strategies
1. Apply for funding to determine the feasibility of, and capacity for, processing and distribution activities within the Region, especially in adapting or expanding existing production facilities and using existing resources.
2. Create an association or agency to help brand and market regional food products to major distributors and directly to consumers. Link with similar institutions in Wisconsin, Minnesota, and Iowa to form joint products.
3. Use comparable cost data to evaluate options for the Region and pursue those with the greatest potential for the Region.
4. Identify potential markets in the Midwest for the crops and produce which are best suited for growing in the Region. Programs such as Illinois MarketMaker sponsored by the UI-Extension offer opportunities to identify specialty markets for these products in the Chicago area and metropolitan communities. This approach could bring higher prices to growers and build on the excellent logistics in the five counties.
5. Form alliances between growers, producers, and other industry sectors to promote Agribusiness and Food Processing operations such as the Kitchen Incubator of Northwestern Illinois and other units in the Region. Have them visit successful food programs in neighboring states to determine the feasibility of similar programs in the Region.
6. Contact farmers, possibly through county offices of the Illinois Farm Bureau, to determine any missing links in the Region, including organic farmers and poultry processing facilities. An active group of farmers interested in organic crops exists in the area and could be the basis for expanded activities in the Region.
7. Work with higher education institutions to determine the skill sets needed to work in food processing and related industries and make sure the workforce is highly trained.
8. Inventory the existing and planned capacity of the five counties and surrounding areas regarding specialty crops, both growing and processing, as well as animal-ag opportunities such as poultry processing to determine the viability of further processing activities. Previous work in the Fulton area could be a basis for this effort.
NIU Center for Governmental Studies 93
Promoting Regional Prosperity in Northwest Illinois
Goals, Strategies, and Recommendations
Potential Regional Partners
» Organic seed producers and distributors » County Board representatives » Blackhawk Hills Entrepreneurs and Inventors Network (BHEIN) » NIU AgTech Program » Illinois Farm Bureau » Local farmers and food processors » UI-Extension Service » UW-Extension Service » Economic development and chamber of commerce officials » Illinois Department of Commerce and Economic Opportunity » Illinois Department of Agriculture » Governor’s Rural Affairs Council » Illinois Downstate Alliance
GOAL V: LEVERAGE AND MARKET EXISTING REGIONAL ASSETS TO ENCOURAGE GROWTH, ENHANCE THE QUALITY OF LIFE, AND MAXIMIZE THE POTENTIAL OF THE REGION.
Context
The advisory committee identified Transportation, Distribution, and Logistics as critical assets in the Region, not only in terms of employment, but as a catalyst for supporting the location and growth of other targeted industries. The Region’s strategic location compared with large metropolitan areas and the highway and rail transportation routes in place give it a competitive advantage as a location for transportation dependent industries.
Many proposed initiatives in this report will require substantial funding and are beyond the fiscal resources of any one community or county. Securing funding from state and federal agencies on a regional basis will require marketing projects as collaborative efforts, since current agency policies favor regional collaborations.
The Region’s strategic location compared with large metropolitan areas and the highway and rail transportation routes in place give it a competitive advantage as a location for transportation dependent industries.

94 NIU Center for Governmental StudiesGoals, Strategies, and Recommendations
Promoting Regional Prosperity in Northwest Illinois
» The Global III and the Savanna LRA site offer different, but complementary, opportunities for industries which are shipping containerized freight or bulk commodities. However, realizing the full potential of these assets will require additional investments in highways, river access, and utilities.
» Sites for the development of new distribution facilities are available, but information on them is, in many cases, outdated or incomplete making it difficult to market the Region to site selectors or business prospects.
» The recent location and expansion of transportation-related manufacturers (such as Nippon-Sharyo, Woodward, and Chrysler) will create new business opportunities for suppliers of parts, components, or services.
» Black Hawk Hills Regional Council has a Comprehensive Economic Development Strategy (CEDS) document which lists infrastructure projects such as a new industrial park in Mt. Carroll, the expansion of public transportation in Freeport, or airport runway repair in Rochelle. These projects can be explored in more detail in light of the strategies which the Region decides to pursue.
Recommended Strategies
1. Work with the Class I and terminal railroads on a three-year plan for designated sites and facilities, rail service needs, and necessary interchange or switching agreements.
2. Work with utilities and other agencies to create a program including incentives where shovel-ready sites can be assembled quickly for prospective businesses. Make sure the regional infrastructure is current on LOIS and is marketed through DCEO avenues. Assess and prioritize infrastructure needs for regional transportation, communication/data storage, and logistics assets.
3. Identify major expansions associated with the Intermodal Terminal in Rochelle and match requirements of businesses with potential suppliers in the Region. Possibly host a supplier’s fair for businesses in the Region or a trade mission to work with businesses considering a location near the Global III.
Regional Sites Inventory and Site Selection
Louisiana Economic Development- Certified Sites & Economic Development http://www.louisianasiteselection.com/led/Buildings-And-Sites.aspx
Partnership of Alabama-Advantage Site http://edpa.org/bsc/advantagesites.asp
The states of Louisiana and Alabama collect and publish extensive information regarding the characteristics of the land which is available to economic developers. The two states maintain separate databases with similar content. Land owners can apply to have their site officially certified by submitting many pieces of information which are unavailable on the conventional site selection websites such as the Location One Information System (LOIS). In addition to data on zoning, acreage, sale price, distance to highways, and utilities providers, certified sites also submit information on the taxable property value and millage of property taxes; maps of utilities for water, electricity, and sewer; maps of flood plains and soil to determine impediments to construction; permits and zoning ordinances; availability of incentives such as enterprise zones; availability of fiber-optics and DSL; and previous land use. These requirements place additional disclosure responsibilities on land owners, but the information provided is critical to economic developers’ location decisions.

NIU Center for Governmental Studies 95
Promoting Regional Prosperity in Northwest Illinois
Goals, Strategies, and Recommendations
4. Organize a coalition of business and public leaders to make the case for business investment infrastructure needs including an airport utilization study, rail feasibility study, and evaluation of highway needs in the Region. Depending on results of previous strategies, design and market a program building on the use of the Intermodal Terminal, Whiteside County Airport, and other regional assets.
5. Conduct a regional supply chain analysis to identify and attract firms to serve transportation related manufacturers.
6. Conduct a feasibility study of the Whiteside County airport to determine the strategies for the best uses of the current facility, expansion options, logistical opportunities, aesthetics, and others. Include viable programs in the Region CEDS report.
7. Professionally review current business incentive packages and compare them with competitor regions. Determine gaps and review needs or opportunities to expand incentives and support businesses, as mentioned previously.
8. Create a regional inventory of available sites and buildings with detailed information of interest to site selectors and prospective companies. Based on the findings of the inventory, identify additional and specialized sites which may be required to attract targeted industries. Create a site certification program to insure that these sites can be quickly developed for a prospective company. This approach should include obtaining control of the site along with having the necessary zoning, platting, incentives, and infrastructure improvements in place prior to marketing the site. This inventory can be provided on a regional website.
9. Evaluate the options for starting a Foreign Direct Investment program with incentives appropriate to suppliers to the Nippon Sharyo plant.
10. Assess and prioritize infrastructure needs to support business expansions in the Region working within the Black Hawk Hills Regional Council CEDS process. Ask the BHRC to contact state and federal agencies regarding the potential funds available to build or upgrade the facilities as needed to make the Region competitive. Organize local manufacturers and other businesses to actively participate in groups such as the I-88 Corridor and the Tri-State Alliance which promote investment in infrastructure.
Certified Industrial Lands Program
Business Oregon-Certified Industrial Lands http://www.oregon4biz.com/The-Oregon-Advantage/Sites/Oregon-Certified-Sites/
Business Oregon, a state agency, has built an inventory of industrial sites which are ready for construction. Site owners who are applying for certification must complete a 20-page form detailing the site’s geological conditions, compliance with state and local regulations, utilities coverage, and workforce and demographic characteristics of the site’s location. Completing the application requires verifying documents from multiple third parties, including the initial letter of support for a development project from the local chief elected official, feedback from the U.S. Army Corp of Engineers regarding the site’s location relative to wetlands, and formal letters from utilities detailing the site’s current connection and capacity. Certified sites must also apply for recertification every two years to ensure that information is current. This information provides site selectors with sufficient information when searching for sites virtually.
96 NIU Center for Governmental StudiesGoals, Strategies, and Recommendations
Promoting Regional Prosperity in Northwest Illinois
Potential Regional Partners
» County Board representatives » Whiteside County Airport Board » Blackhawk Hills Regional Council (BHRC) » Global III Terminal representative » Rail, trucking and logistics industry representatives » Business owners and managers » NIU Center for Governmental Studies » Economic development and chamber of commerce officials
Summary and Recommendations
The analyses in this report highlighted various approaches that the Region could take as the economic recovery unfolds over the next several years. The Region, in many ways, is in an enviable position because it has a strong history in manufacturing and innovation, untapped resources, excellent logistics and transportation systems, and close proximity to regional, national, and global markets.
At the same time, the resources in the Region which are available to manage various strategies are insufficient to pursue all of the possible opportunities, so the strategies must be prioritized and additional resources must be found to manage the process.
In a first attempt at prioritizing strategies, the advisory committee identified strategies which would be the easiest and could have the greatest impact in the short- and long-term. The list of priorities for each of the five goals follows.
The advisory committee ranked Goal I as having the highest impact for the amount of time and effort to initiate. Strategies such as evaluating workforce concerns and future needs of businesses, creating a manufacturing technology innovations center and academy, generating financial support and resources for entrepreneurial manufacturing and service firms, providing market research, creating dual-credit courses for secondary school students, working with WIBs on development programs, and publicizing efforts to attract young professionals would all have a positive impact on the Region.
To meet Goal II, forming a manufacturing network, changing the narrative about manufacturing in the Region, inventorying inputs purchased outside the Region which could be made locally, preparing value chain analyses, and assessing options for providing more assistance for small and medium-sizes companies rated highest in terms of impact for time, effort, and funds invested.
For Goal III, focusing on providing more support for entrepreneurship and small business development, examining best practices to support entrepreneurs, and working with local educational institutions to make secondary school students aware of opportunities for successful business careers were viewed as having the greatest impact on the Region per investment.
In Goal IV, working with growers, identifying potential markets, applying for funding to determine the feasibility of adapting and/or expanding existing facilities in the Region, and working with educational institutions to prepare students for careers in the agri-processing and manufacturing industries could bring the highest investment returns for the Region.
Regarding Goal IV, conducting a regional inventory of available sites and buildings, working with utilities on incentives, conducting a feasibility study of the Whiteside County Airport, working with Class I railroads,

NIU Center for Governmental Studies 97
Promoting Regional Prosperity in Northwest Illinois
Goals, Strategies, and Recommendations
and identifying major expansions associated with Global Terminal III were seen as providing high payoffs for the investment of time and effort involved.
This project was designed to suggest potential strategies which could help transform the Region, increase employment and investment, and bring prosperity to the Region. The most important step, however, is taking action. Fortunately, several activities are already underway by the Whiteside Area Career Center, Career Tec, community colleges, and manufacturing businesses to upgrade the skills and capacity of the workforce.
Definitely, to move the five-county region ahead using the strategies recommended in this report will take additional resources. The three broad issues on which to focus include first finding ways to increase access to management and financial information available to start-ups and the second stage companies seeking to expand. The meetings held with manufacturers identified a need for more communication among businesses but also between small businesses and providers who can assist them with expansion plans. Increasing business starts and expansions has to be a high priority.
A second focus should be on helping to retain existing businesses in the Region by improving the quality of the labor force. Efforts are underway for businesses to work with agencies such as the Whiteside Area Career Center, community colleges in the Region, the College of Engineering and Engineering Technology at Northern Illinois University, and other organizations. These activities will not only revitalize existing manufacturers but will also build a reputation for the Region as a place where businesses can start and prosper. Manufacturing in the region should be seen as in transition, rather than in decline.
A third focus should be on the Agribusiness., Food Processing, and Technology cluster, which is active in the Region, and with guidance and assistance could increase substantially to serve the surrounding metropolitan areas . The resources are available, and the logistics-distribution systems are excellent. The Food Processing component has a strong presence in the Region on which to build, and an expansion of this component will involve growers, processors, manufacturers, and distributors. The work force will have to be trained to meet the needs of an expanded Agribusiness, Food Processing, and Technology cluster, but there will be considerable overlaps in the skills sets needed.
The Region has a set of strategies with the potential to bring prosperity. The next step is to implement them in an organized way and assign time lines to each strategy with 30-day, 60-day, 90-day, six month, one year, and/or longer-term horizons.
Top-Ranked Strategies Overall
Rank Goal, Strategy Average Difficulty Rating Average Impact Rating Impact Minus Difficulty1 Goal 1, Strategy 10 2.14 4.00 1.86
2 Goal 1, Strategy 8 1.71 3.29 1.57
3 Goal 1, Strategy 7 1.86 3.43 1.57
4 Goal 2, Strategy 8 2.83 4.33 1.50
5 Goal 1, Strategy 11 2.67 4.14 1.48
6 Goal 1, Strategy 1 2.57 3.86 1.29
7 Goal 3, Strategy 7 2.83 4.00 1.17
8 Goal 2, Strategy 13 2.33 3.33 1.00
9 Goal 3, Strategy 3 2.43 3.33 0.90
10 Goal 4, Strategy 8 2.00 2.83 0.83

98 NIU Center for Governmental StudiesGoals, Strategies, and Recommendations
Promoting Regional Prosperity in Northwest Illinois
Concluding Comments
The five counties examined in this report have the potential to move ahead on a variety of fronts. They have excellent transportation access to major regional and national markets. A long history of manufacturing provides a base on which to build and a large number of small businesses in the Region can participate effectively in a networked economy. The Agribusiness, Food Processing, and Technology cluster in the Region provides opportunities to participate in the local foods movement. While the workforce in the future could face some challenges given population trends, the educational and business communities recognize the needed changes and are implementing strategies to make corrections.
The prosperity in the Region will depend on the actions taken by both community and business leaders. The Region has an action plan with goals and strategies. Business and community leaders are meeting to implement these approaches and if this approach continues, the Region should have a prosperous future.

NIU Center for Governmental Studies 99
Promoting Regional Prosperity in Northwest Illinois
Appendix
APPENDIX: MAJOR THEMES IDENTIFIED BY REGIONAL MANUFACTURERS AND RESOURCE PROVIDERS
Promoting Regional Prosperity in Northwest Illinois: Regional Manufacturing Roundtables
Two meetings were held with regional manufacturers, the first one was on January 29, 2013, in Rock Falls, Illinois, and the second meeting was on February 13, 2013, in Freeport, Illinois. Nearly 80 manufacturers and over 50 resource providers attended one or both sessions. After a brief overview of the five-county regional project (which includes Carroll, Lee, Ogle, Whiteside, and Stephenson counties), the attendees were asked to self-select one of four round table discussions on the topics of Finance and Capital, Education and Skills, New Markets, and Technology and Energy-Efficient Strategies for Cost Reduction. Roundtables were held for approximately 40 minutes with a mix of resource providers and business owners sharing their thoughts on each topic. Knowledge keepers and facilitators were used to encourage conversations and keep track of the important ideas and strategies which each group developed.
At the end of both meetings, an overview of each group’s discussion was given to the larger group. Combined facilitated notes for all four roundtable groups at each session, Freeport and Rock Falls, were sent to the respective attendees. This allowed them to review what each of the other groups discussed as well as to review their own session. Because this was a regional effort, and many could not attend both meetings, the following brief document expresses the overall themes from both meetings by focus area.
Focus Area: Sources of Finance and Capital Sessions
1. Provide More Technical Assistance on Business Management Issues
Small and 2nd Stage companies often do not have the internal resources and/or expertise to effectively manage their businesses in order to reach the next stage of production. Some counties in the region have very limited, if any, access to technical assistance on marketing, finance, and other issues. Business owners may have expertise in production methods but not necessarily have the same level of expertise about management issues. Making more expertise available to these businesses could foster growth. This could involve organizing a regional consulting arrangement where several small businesses could share costs.
2. Financing Expansions and Recent Growth
Small businesses are now experiencing substantial growth in demand which will require purchases of additional capital and equipment. Small business owners are not clear about available programs, effective ways to work with financial institutions, or other issues involved in accessing capital. These issues include the viability of purchasing other businesses, succession planning, and related topics. A central place in the region to make expertise on programs available and better communications with businesses about these programs would help businesses expansions. The office could have a list of professionals who, on a part-time basis, would be willing to contract with businesses for services. Likewise, the financial programs available in the region could be marketed to small businesses either over the web or in other ways which are readily available to small businesses.
3. Create a Peer Group of Manufacturers to Share Common Issues
A regular meeting of manufacturers in the area (perhaps quarterly) to discuss common issues, concerns, and ways to resolve them could help small and 2nd Stage companies to expand. The network could build capacity among small businesses to find ways to reduce costs and resolve other technical problems faced by many manufacturers in the region. For this type of network to succeed, active leadership by the business community will be required.

100 NIU Center for Governmental StudiesAppendix
Promoting Regional Prosperity in Northwest Illinois
4. Market the Region Consistently in an Organized Way
Form a regional marketing agency, perhaps by subscription, where small businesses could pool resources to market products made in the region. Some marketing could be one-on-one with potential customers while other approaches use mass marketing with several businesses sharing the cost. This agency would be more than a chamber of commerce for the region. It would market specific products to potential customers working with businesses in the region which cannot afford these marketing efforts alone. In a sense, it will build a brand or reputation for the region as a source of specific products. Participating businesses can share the costs of a regional marketing person.
5. Host a Regional Manufacturing Fair or Supplier’s Fair
Small businesses are not always aware of suppliers in the region and/or do not know other businesses with whom they could either buy or sell. Hosting an organized regional manufacturing fair or event to bring companies together could improve communications in the region and promote growth among participating companies. This meeting should be multi-county and perhaps include neighboring counties.
Focus Area: Accessing Education and Developing Skills Sessions
1. Change the Narrative of What Manufacturing Means in the Region
The major regional theme of the Education and Skills focus groups was changing the narrative of what manufacturing is in the 21st century. By reaching out to the younger generation, businesses, community colleges, and other career centers in the region can teach them that manufacturing can be a career, not just a job. One-third of all high school students will not earn a four-year degree, and teaching those individuals a work ethic, interview skills, dependability and overall employability training will be key. This changing narrative will involve working with the 8-12 school system through career fairs, job shadowing, career days, and tours of facilities by teachers, counselors, and students to tell the “new narrative” of manufacturing.
2. Reconnect Businesses with Youth and College Students
As part of changing the narrative of manufacturing, businesses agreed that getting back to community outreach, which has been lacking with cutbacks, and trying to grow their business in hard financial times is crucial. Some ideas included participating in a career day, “A Day in the Life of a Manufacturer,” helping high school, college students, and re-entries into the workforce through mock interviews, internships, and/or participating in a Manufacturing Fair could be useful. Students need a connection to the businesses to gain hands-on knowledge through apprenticeships, site visits, and/or company CEOs participating in a class. With the large number of retirements and potential knowledge lost, succession planning by investing in youth is a must.
3. Community Colleges, K-12 Institutions, Career Centers and Regional Businesses Need to Communicate Needs and Available Resources
For both meetings, many in the groups were not acquainted with one another or the programs available through the resource providers, so a first step will be open communication with all parties. Manufacturers agreed that talking with each other about mutual needs may generate ideas for training, employability standards, and possible business expansions.

NIU Center for Governmental Studies 101
Promoting Regional Prosperity in Northwest Illinois
Appendix
4. Address Workforce Dependability and Employability Issues Proactively
While there is an available workforce, including unemployed and underemployed workers, there seems to be an issue with work ethic, employability, and retention of employees. Utilizing a program such as WorkKeys to assess job skills and readiness may be one way to vet potential hires before they even apply. Also, working with organizations such as the Whiteside Area Career Center to identify potential employees will help.
Focus Area: Pursuing New Technology and Green Strategies Sessions
Create an Effective Communication Forum for Manufacturers
The region’s manufacturers can benefit from increased access to resources regarding technology and energy efficiency. Resources include information about timely energy/technology related opportunities, practices and trends, sharing technology (in some situations), and even networking with other manufacturers in the region in person or electronically (i.e., via case studies) to stay abreast of the strategies being used by peers. The most appropriate format or vehicle for effective communication would need to be explored. Some manufacturers prefer in-person contact, others prefer in-person contact under certain circumstances (i.e., close proximity to their facility), while still others prefer well-designed, online forums and chat rooms. A communication strategy involving both in-person and online aspects may be desirable. Use of a regional manufacturer’s representative(s) who can provide personalized contact with individual manufacturers in an industry and also serve as a conduit between manufacturers might be valuable.
Focus Area: Identifying New Markets Sessions
Establish On-Going Networking Opportunities and Communication Channels Between Companies
One institution must be identified or created to focus on building a network of relationships between and developing the network of resources needed to address the needs of manufacturers in the region. It should provide the following:
» Educational events should also be provided for companies to share how they have successfully handled similar issues they faced. Helping manufacturers identify and access new markets should be one key focus of this institution.
» A cooperative marketing and sales program should be established where one or more sales representatives are shared by manufacturers who are interested in synergistic or similar markets. The sales representatives would identify customer opportunities within and outside the region for participating companies.
» An online forum for the manufacturers in the region would allow companies to share information about their products and markets as well as to request advice and to identify other manufacturers to share equipment, technical capacity, or contacts. The forum host could also post information about service providers, research, procurement opportunities, case studies, how-to workshops, networking events, etc.


August 2012
Promoting regionAl ProsPerity in northwest illinois Wage and Benefit Report
in PArtnershiP with
Outreach, Engagement, and Information Technologies
N O R T H E R N I L L I N O I S U N I V E R S I T Y
Center forGovernmental Studies
TAB A

2 NIU Center for Governmental Studies
Promoting Regional Prosperity in Northwest Illinois
Produced by:
CeNteR foR GoveRNmeNtal StudIeS 148 N. Third STreeT deKalb, il 60115 815-753-0914 www.NiucgS.org
The findings and conclusions presented in this report are those of the Niu project team alone and do not necessarily reflect the views, opinions, or policies of the officers and/or trustees of Northern illinois university.
First printing: august 2012
Outreach, Engagement, and Information Technologies
N O R T H E R N I L L I N O I S U N I V E R S I T Y
Center forGovernmental Studies
M.J. (Joey) lata, Melissa henriksen, and Norman walzer *Special appreciation to andrew blanke for data compilation and statistical analysis.

NIU Center for Governmental Studies 3
Promoting Regional Prosperity in Northwest Illinois
table of Contents
executive Summary ................................................................................................................................. 6
Introduction ............................................................................................................................................. 8
Survey Scope and methodology ................................................................................................................9
data analysis .................................................................................................................................... 10
Business Practices ...................................................................................................................................11
location Type by industry .................................................................................................................12
operating locations ..........................................................................................................................12
business Size and employment Type ................................................................................................14
unions ................................................................................................................................................15
cost-Saving Strategies .......................................................................................................................15
agriculture .....................................................................................................................................16
healthcare and Social assistance .................................................................................................. 17
Manufacturing .............................................................................................................................. 18
Transportation and warehousing ................................................................................................ 18
occupations ........................................................................................................................................... 19
ubiquitous occupations in the region ............................................................................................ 19
common occupations in the region ................................................................................................ 20
unique occupations in the region ....................................................................................................21
educational attainment for regional occupations ..........................................................................21
regional workforce availability and Training Needs ......................................................................22
difficulty Filling open Positions .......................................................................................................22
employee Turnover ............................................................................................................................24
Training Needs ...................................................................................................................................25
Benefit Information ............................................................................................................................... 26
Training and education opportunities ............................................................................................ 26
Traditional benefits ...........................................................................................................................27
Paid holidays ................................................................................................................................ 28
Vacation days ................................................................................................................................ 28
Sick days ....................................................................................................................................... 29
innovative benefits ........................................................................................................................... 30
Wage Information ...................................................................................................................................31
wage comparisons .............................................................................................................................31
5-county occupations above State and National average wages ...................................................32
5-county occupations below State and National average wages .................................................. 33
wage and Salary increases ................................................................................................................ 34
4 NIU Center for Governmental Studies
Promoting Regional Prosperity in Northwest Illinois
table of Contents
APPendicies appendix a: Companies Responding to Wage and Benefit Survey .........................................................35
appendix B: North american Industry Classification System (NaICS) 5-County Industry Sector definitions ..............................................................................................................................................37
appendix C: occupational Wage data and descriptions ....................................................................... 39
Management wage data ................................................................................................................... 39
Management occupation descriptions ....................................................................................... 40
business and Financial operations wage data ................................................................................41
business and Financial operations occupation descriptions .....................................................42
engineering occupation and computer/Mathematical occupation wage data ............................ 43
engineering and computer/Mathematical occupation descriptions ........................................ 44
life, Physical and Social Science, healthcare Practitioners, healthcare Support occupation wage data ... 45
life, Physical, and Social Science, healthcare Practitioners, healthcare Support occupation descriptions .................................................................................................................................. 46
community and Social Service occupation wage data ................................................................... 48
community and Social Services occupation descriptions ......................................................... 49
building and grounds cleaning and Maintenance, Protective Service occupation wage data .... 50
building and grounds, cleaning and Maintenance, Protective Service occupation descriptions ... 50
office and administrative Support occupation wage data ............................................................. 51
office and administrative Support occupation descriptions .....................................................52
agriculture and Farming occupation wage data ............................................................................ 54
agriculture and Farming occupation descriptions .................................................................... 54
construction, Production, and Maintenance occupation wage data .............................................55
construction, Production, and Maintenance occupation descriptions .....................................57
Transportation and Material Moving occupation wage data ........................................................ 59
Transportation and Material Moving occupation descriptions ................................................ 59
NIU Center for Governmental Studies 5
Promoting Regional Prosperity in Northwest Illinois
table of Contents
list of figures Figure 1: respondents by industry ........................................................................................................11
Figure 2: headquarters and Satellite operations by industry Sector ..................................................12
Figure 3: business locations, all industries ........................................................................................ 13
Figure 4: business locations by industry............................................................................................. 13
Figure 5: business respondents by employee Size ...............................................................................14
Figure 6: cost-Saving Strategies ............................................................................................................15
Figure 7: agriculture Sector cost-Saving Strategies .............................................................................16
Figure 8: healthcare and Social assistance Sector cost-Saving Strategies ......................................... 17
Figure 9: Manufacturing Sector cost-Saving Strategies ...................................................................... 18
Figure 10: certificate or degree required by industry ........................................................................ 20
Figure 11: occupations requiring certificate or degree ......................................................................22
Figure 12: reasons for difficulty Filling open Positions .................................................................... 23
Figure 13: reasons for difficulty Filling open Positions by industry Sector ..................................... 23
Figure 14: Training Needs ......................................................................................................................25
Figure 15: Training and educational opportunities ............................................................................ 26
Figure 16: education/Training opportunities Paid by employer ........................................................27
Figure 17: benefits offered to Salaried employees ...............................................................................27
Figure 18: Paid holidays per Year ......................................................................................................... 28
Figure 19: Vacation days available annually based on Years employed ............................................ 28
Figure 20: Sick days per Year ................................................................................................................ 29
Figure 21: carryover Vacation and Sick days offered ......................................................................... 29
Figure 22: innovative benefits .............................................................................................................. 30
Figure 23: Median wages for Soc categories in the 5-county region ...............................................31
Figure 24: Methods for determining wage and Salary increases ....................................................... 34
Figure 25: Methods for wage and Salary increases by industry Sector .............................................. 34
list of tAblesTable 1: ubiquitous, common, and unique occupations in the 5-county region ............................. 20
Table 2: occupations with highest Turnover rates ..............................................................................24
Table 3: 5-county occupation categories above State and National average wages .........................32
Table 4: 5-county occupation Titles above State and National average wages .................................32
Table 5: 5-county occupation Titles below State and National average wages ................................. 33

6 NIU Center for Governmental Studies
Promoting Regional Prosperity in Northwest Illinois
executive Summary
executive summAry
The local wage and benefit survey of businesses in carroll, lee, ogle, Stephenson, and whiteside counties is a component of a larger regional project identifying advantages of the region for promoting business starts, expansions, and retention. The project is funded by the u.S. economic development administration (eda) along with local economic and community development agencies. Four main industry sectors within the counties were targeted: Manufacturing, healthcare and Social assistance, agriculture, and Transportation and warehousing. These industries have been major employers in the past and form the basis for a set of business clusters in the region.
Knowing the competitiveness of the region in terms of compensation practices and labor force will help local development practitioners market the region more effectively. consequently, a companion study examines characteristics of the unemployed and underemployed in the region. These data are then used to more clearly identify opportunities to attract and start businesses in the region.
a total of 295 businesses in the 5-county region were invited to complete the compensation survey with 103 companies participating (34.9% response rate). Manufacturing business participation was highest and aligns with its industry dominance in the region but a cross-section of businesses in other sectors participated also. The compensation survey updates previous work on similar topics and regional business characteristics. while the data are based on electronic survey results voluntarily completed by employees, they provide benchmark information that can inform local decisions.
Key findings: » Most businesses have headquarters in the county where their business is located. The region contains
many relatively small businesses with nearly half (46.5%) of regional employment in businesses with 1-49 employees. large companies (1000+ employees) reported 100-249 full-time salaried positions, while those respondents reporting the least number of full-time salaried employees (1-4) were in businesses with total employment of 1-49. a majority (75.7%) of business respondents reported no labor union participation.
» cost reduction efforts by businesses in the region affect full-time employees at almost double the frequency of part-time employees. elimination and/or reduction of travel and increasing automation or adding technology were the two most commonly reported ways to reduce costs. other cost-saving strategies involved elimination and/or reduction of overtime pay, training/employee development, and shorter work weeks. cost-saving strategies differ among industry sectors.
» lack of experience is the main reason cited for positions that were hard to fill (62.5%), with work ethic a close second (43.8%). These responses are not unlike those expressed by employers in other regions as well. in addition, only 4 of 12 (33.3%) of the highest ranking turnover positions can be filled by temporary agencies. More work with educational institutions to redesign training and educational programs will help build the work force.
NIU Center for Governmental Studies 7
Promoting Regional Prosperity in Northwest Illinois
executive Summary
» Training needs are greatest for soft skills, mainly improved managerial skills. Training opportunities are available fairly equally to both hourly and salaried employees and include attending conferences, seminars, and workshops, external training, and informal on-the-job training. however, elimination or reduction of these opportunities is among the first cost-saving strategies used by businesses.
» Traditional benefits (medical, dental, life insurance) and paid days leave (vacation, sick days, holidays) were reviewed for full- and part-time employees, as well as salaried vs. hourly. life insurance is often paid in full by employers (71.3%), while 58.0% of respondents cover between 75.0%-100.0% of health insurance costs. eight or more paid holidays per year are typical for full-time employees, while part-time employees are less likely to receive paid holidays. For both hourly and salaried employees, more vacation is available the longer they are employed with the business.
» beyond traditionally offered benefit packages, innovative benefits that contribute to the overall compensation package for employees are also offered and include flexible spending accounts, cafeteria plans, flexible scheduling, and company vehicles.
» annual wage levels were gathered and compared with both state and national average wage levels (which include metro areas). average wage levels in four occupation categories and several individual occupation titles in the region exceeded 100% of the state and/or national averages, with the agriculture occupation category and healthcare occupation titles leading the region. only the Management occupation category is 25.0% or more below the state and/or national averages, with several occupation titles in healthcare and engineering below as well. These figures have not been adjusted based on productivity comparisons with other areas, nor do they consider the distribution of employees by seniority and/or years of experience. both could affect comparisons of the region and state.
» Performance-based (merit reviews) are the most common method across all industries for awarding pay increases (81.7%), while lump-sum bonuses are provided by more 43.0% of businesses. length of service pay increases are the least likely method to be used (16.9%).
overall, the region is competitive in terms of labor force characteristics and compensation levels, positioning the region to expand in several business sectors.

8 NIU Center for Governmental Studies
Promoting Regional Prosperity in Northwest Illinois
Introduction
2012 wAge And benefit rePortFor Carroll, Lee, Ogle, Stephenson, and Whiteside Counties in Illinois
introductionThe local wage and benefit survey of businesses in carroll, lee, ogle, Stephenson, and whiteside counties is a component of a larger regional project to identify the advantages the region has for promoting business starts, expansions, and retention. Funded by the u.S. economic development administration (eda) and local economic and community development agencies, the project includes conducting a labor force availability analysis for the region to help define the elements necessary to attract and retain area companies and/or launch new establishments, leading to increased growth and prosperity in the region. by identifying the skill levels of unemployed and underemployed workers, determining transferability of underutilized skills to potential new jobs, and making those results available for business prospecting and recruiting, the project will help local developers stimulate the regional economy.
The ultimate aim of the project is to identify business opportunities suited for the 5-county region and to assist local economic and community development partners in applying a regional approach to development strategies. outcomes of the project include identifying emerging industries, developing strategies to encourage job growth, and improving the current business climate.
wage and benefit data collected from the survey in april 2012, coupled with results from an underemployment study conducted by Pathfinders, inc. completed in July 2012, provide information on workforce readiness initiatives for stakeholders in the region. The wage and benefit study is an update and expansion of a wage and benefit study conducted by the center for governmental Studies (cgS) at Northern illinois university (Niu) in January 2009. The following partners are engaged in the project:
» whiteside county enterprise Zone and economic development » greater Sterling development corporation » lee county industrial development corporation » rock Falls community development corporation » Northwest illinois development alliance

NIU Center for Governmental Studies 9
Promoting Regional Prosperity in Northwest Illinois
Survey Scope and methodology
survey scoPe And methodologya survey instrument was designed to collect information about business practices, industry workforce composition, occupational wage ranges and employee benefits for the 5-county region. The survey gathered current wage and benefit information, as well as information on training needs, hiring issues, and high turnover positions. respondents accessed the survey via Survey Monkey and completed online.
a total of 295 businesses in the region were invited to complete the survey on wages, benefits, and compensation practices. The survey was conducted between February and april 2012 with 103 business responses, a return rate of 34.9% (appendix a lists responding businesses).
The wage and benefit survey was organized into five sections:
1. Business Practices. basic information was collected about the characteristics of each business in terms of size, industry affiliation, location, and number of employees as well as status in terms of full- vs. part-time and salaried vs. hourly wages.
2. Occupations and Wages. Ten occupational groups based upon Standard occupational classifications (Soc) were used as they aligned with the four major industry sectors. wages for these occupations were collected as well.
3. Workforce Availability. Positions with high turnover rates, positions difficult to fill, and positions that could be staffed by temporary employees were identified in this portion of the survey.
4. Training Needs. The importance of various topic areas for improving skills and work performance were ranked in this section of the survey.
5. Benefit Information. information on traditional benefits, such as health and dental insurance, 401K, paid days leave (Pdl) and innovative benefits were collected in this section. Methods of wage increases, training and educational opportunities, and cost-saving strategies were also obtained.
Targeted industries in the survey included Manufacturing, healthcare and Social assistance, agriculture, and Transportation and warehousing. These industries were selected based on their presence in the region and the interest by local development agencies in marketing the region to specific industries. brief definitions of the selected industry sectors based on the North american industry classification System (NaicS) are as follows:
1. Manufacturing (NAICS 31-33) establishments in the Manufacturing sector are described as plants, factories, or mills and characteristically use power-driven machines and materials-handling equipment. The subsectors in the Manufacturing sector generally reflect distinct production processes related to material inputs, production equipment, and employee skills.
NIU Center for Governmental Studies
Promoting Regional Prosperity in Northwest Illinois
10 Survey Scope and methodology
2. Healthcare and Social Assistance (NAICS 62) The healthcare and Social assistance sector is comprised of establishments providing healthcare and social assistance for individuals. The sector includes both healthcare and social assistance because it is sometimes difficult to distinguish between the boundaries of these two activities. Many of the industries in the sector are defined based on the educational degree held by the practitioners included in the industry.
3. Agriculture, Forestry, Fishing and Hunting (NAICS 11) The agriculture, Forestry, Fishing, and hunting sector is comprised of establishments primarily engaged in growing crops, raising animals, harvesting timber, and harvesting fish and other animals from a farm, ranch, or their natural habitats. The establishments in this sector are often described as farms, ranches, dairies, greenhouses, nurseries, orchards, or hatcheries. The sector distinguishes two basic activities: agricultural production and agricultural support activities.
4. Transportation and Warehousing (NAICS 48-49) The Transportation and warehousing sector includes industries providing transportation of passengers and cargo, warehousing and storage for goods, scenic and sightseeing transportation, and support activities related to modes of transportation. establishments in these industries use transportation equipment or transportation related facilities as a productive asset. This sector distinguishes three basic types of activities: subsectors for each mode of transportation, a subsector for warehousing and storage, and a subsector for establishments providing support activities for transportation.
complete definitions for industry sectors can be found in appendix b.
dAtA AnAlysisStatistical analysis of results was performed to help draw inferences from the data collected. The T-test determines whether the difference between two averages is significant even after accounting for differences expected due to the standard deviation and sample size. in this report, we use T-tests to measure the difference between averages for the survey sample as a whole and the averages for relevant sub-samples. For example, a T-test could determine if a particular industry is significantly more or less likely than the sample as a whole to require employees to have a degree or certificate.
Similar to the T-test, the chi-square test is used to measure the statistical significance of variation between two groups. chi-square is used as a test against the assumption that no significant difference exists between the actual data and the expected data. in this report, we use the chi-square test to determine when particular industries have practices that differ significantly from the sample as a whole. For example, a chi-square test could determine whether the mix of business locations for one industry differs significantly from the mix of business locations for all industries surveyed.

NIU Center for Governmental Studies 11
Promoting Regional Prosperity in Northwest Illinois
Business Practices
business PrActices
The responses from the major industry sectors in the 5-county region indicate that Manufacturing businesses had the greatest participation rate with 42.7% (Figure 1). This rate supports its status as the highest source of employment in the region, and the largest number of businesses asked to participate (u.S. census bureau, county business Patterns, 2009). The “other” category represented the second largest participaton rate (25.2%) and included education, construction, utilities, Professional/Scientific, and administrative/Support/waste Management.
Figure 1: Respondents by Industry
Manufacturing
Other
Healthcare and Social Assistance
Agriculture
Transportation and Warehousing
42.7%
25.2%
14.6%
10.7%
6.8%
“other” category includes education, construction, utilities, Professional/Scientific, and administrative/Support/waste Management.

12 NIU Center for Governmental Studies
Promoting Regional Prosperity in Northwest Illinois
Business Practices
locAtion tyPe by industryunderstanding whether businesses in the region are headquartered in their respective counties can help community and economic developers create better strategies. over 70% of businesses responded that their headquarters are in the county where their business is located. This is important because it could mean the business is more involved with the community, possibly at both a business and personal level, and that decisions about expansion, employment, and other business practices are made locally. although businesses in each of the four major industry sectors also had satellite locations within the region, Transportation and warehousing was mainly a satellite operation (Figure 2). This response was not unexpected since warehousing often involves a network of distribution centers such as those used by wal-Mart and other retail chains, where decisions about business issues are made outside of the region.
Figure 2: Headquarter and Satellite Operations by Industry Sector
HQ
Satellite
Transportation and Warehousing
ManufacturingHealthcare and Social Assistance
Agriculture0%
20%
40%
60%
80%
100%90.0%
10.0%
21.4%
78.6%
31.8%
83.3%
16.7%
68.2%
oPerAting locAtionsa majority of businesses (51.8%) responding to the survey have one location within their respective county (Figure 3). equally important, however, is that nearly one in four responding businesses (24.7%) also reported locations outside of illinois. This suggests that the companies serve other markets and may offer opportunities for expansion or relocation of other operations to the region. in fact, a total of 16 other states and canada are represented by businesses responding to the survey.
Somewhat unexpected is the relatively low proportion of businesses with locations in the chicago/Metro area (4.7%). Strengthening these linkages may offer development opportunities. businesses with international locations represented more than 17.0% of respondents and can be advantageous in an increasingly global society.

NIU Center for Governmental Studies 13
Promoting Regional Prosperity in Northwest Illinois
Business Practices
Figure 3: Business locations, all Industries
Chicago/Metro area
Illinois (outside of the 5-county region)
InternationalStates outsideof Illinois
Same county, multiple locations
Outside IL locations include: CA, FL, IA, IN, MN, MO, NE,
NM, NV, OH, OK, PA, TN, TX, WA, WI, and Canada.
No otherlocations
0
10%
20%
30%
40%
50%
60%
51.8%
24.7%
12.9%
22.4%
4.7%
17.6%
Figure 4: Business Locations by Industry
0% 10% 20% 30% 40% 50% 60% 70% 80%
Other
Healthcare
Transportation
Manufacturing
Agriculture
States outside of Illinois
International
Illinois (outside of the 5-county region)
Chicago/Metro area
Same county, multiple locations
No other locations
comparing location patterns for each of the industry sectors provides an indication of core operations. For example, agricultural businesses operate in multiple locations in the same county while Manufacturing businesses operate predominately from a single location (Figure 4). These differences may reflect organizational structure, such as separate farms owned by the same organization being counted as a separate unit. Transportation businesses reported mainly non-domestic operating locations, again reflecting links with the global economy. The greatest proportion of responses in the “other” category, mainly education, indicated only one location in the county or multiple locations in the same county, reflecting more localized operations.

14 NIU Center for Governmental Studies
Promoting Regional Prosperity in Northwest Illinois
Business Practices
business size And emPloyment tyPe The region contains many relatively small businesses with nearly half of respondents (46.0%) indicating 1-49 employees (Figure 5). The largest four companies completing the survey (1000+ employees) reported 100-249 full-time salaried positions. Three of the four also reported 500-999 full-time hourly employees. Those respondents with the least number of full-time salaried employees (1-4) were in businesses with total employment of 1-49. hospitals and medical centers had the highest number of part-time hourly employees, possibly because they often utilize part-time and contract workers for specialty services and shift work needs.
Figure 5: Business Respondents by Employee Size
1–9Employees
10–49Employees
50–99Employees
100–499Employees
500+Employees
0
5%
10%
15%
20%
25%
30%
35%
40%
8.2%
37.8%
16.3%
30.6%
7.1%
as mentioned, the highest percentage of respondents reported total employment between 1 and 49 workers. by industry sector the percentage of businesses in this size category are listed below:
» agriculture, 54.5% » Manufacturing, 48.8% » Transportation and warehousing, 42.9% » healthcare and Social assistance, 20.0%
Total employment for the “other” industry category, which includes education, construction, utilities, Professional/Scientific, and administrative/Support/waste Management, is equally divided between businesses that have either 1-49 employees or 100-499 employees.

NIU Center for Governmental Studies 15
Promoting Regional Prosperity in Northwest Illinois
Business Practices
unionsa majority (75.7%) of business respondents reported no labor union participation in their businesses while 24.3% reported unionization. Most labor union participation was in Manufacturing and Transportation and warehousing. in each of these sectors, 71.0%-100.0% of the employees are union members, reflecting a history of unionized workforces.
cost-sAving strAtegies The ongoing recession has forced many businesses to adopt cost-saving strategies. based on the responses in the five counties, most of the cost-saving strategies used by businesses involved efforts to work with full-time employees at almost double the frequency of strategies involving part-time employees (Figure 6). cost reduction efforts most often involved eliminating and/or reducing expenses for travel (41.7%), overtime pay (33.3%), training/employee development (26.7%), and shorter work weeks (25.0%).
increasing use of automation or adding new technology was one of the most commonly reported ways to reduce costs (40.0%) even though this strategy requires an up-front expense with expectations of higher productivity in the future. This trend has been common in manufacturing where a smaller labor force now produces more output.
Figure 6: Cost-Saving Strategies
Reduced Travel
Automation/new technology
Eliminate all overtime
Reduce training, employee development, seminars
Reduction in normal work hours, shorter work week
Allow more employees to work from home
Contract labor, outsourcing
Eliminate cash bonuses (incentives)
Full-time employees changed to part-time
Eliminate 2nd and 3rd shifts
Unpaid forlough, temporary unpaid leave
Temporary closing with reduced pay
Part-time
Full-time
0% 10% 20% 30% 40% 50%
as expected, there are some differences evident in cost-saving strategies pursued by the various industry sectors. The following section discusses these differences.

16 NIU Center for Governmental Studies
Promoting Regional Prosperity in Northwest Illinois
Business Practices
Agriculture The most frequently cited strategies for cost-saving were the use of automation/new technology and reduced travel, predominately for full-time employees (Figure 7). elimination of overtime affected full- and part-time employees equally, while shorter work weeks were implemented for part-time workers. Full-time workers were affected at half the frequency of part-time workers, possibly because part-time worker schedules provide more flexibility in the number of hours available. work from home was only available for full-time workers.
unpaid furlough, elimination of 2nd and 3rd shifts, reduction in training, employee development and seminars, or full-time employees changing to part-time were not reported. This sector may not require extended shift work and furloughs are not necessary if adjusting the hours of part-time workers is used as a strategy.
Figure 7: Agriculture Sector Cost-Saving Strategies
Automation/new technology
Reduced travel
Allow more employees to work from home
Eliminate all overtime
Shorter work week
Temporary closing with reduced pay
Eliminate cash bonuses, incentives
Contract labor, outsourcing
Part-time
Full-time
0% 10% 20% 30% 40% 50%

NIU Center for Governmental Studies 17
Promoting Regional Prosperity in Northwest Illinois
Business Practices
heAlthcAre And sociAl AssistAnceSeveral strategies were used to reduce costs in healthcare and Social assistance including elimination of overtime and use of automation/new technology, both of which were nearly equal for full- and part-time employees. reduced travel (Part-time, 20.0%; Full-time, 27.0%), elimination of bonuses, and reduced training/seminars (20.0% respectively) were also used for both full- and part-time employees.
Full-time employees changing to part-time, unpaid furlough, shorter work week, and work from home were indicated by a relatively low proportion of respondents at 13.0% or less (Figure 8). elimination of 2nd and 3rd shifts, contract/outsourcing, or temporary closing/reduced pay were not implemented. The nature of the service provided by skilled employees in this industry may dictate the need for continuous shifts, and closing temporarily is not implemented in this sector due to the need for continuous access to care and services.
Figure 8: Healthcare and Social Assistance Sector Cost-Saving Strategies
Eliminate all overtime
Automation /new technology
Reduced travel
Eliminate cash bonuses, incentives
Reduce training, employee development, seminars
Allow more employees to work from home
Shorter work week
Unpaid forlough, temporary unpaid leave
Full-time employees changed to part-time
Part-time
Full-time
0% 10% 20% 30% 40% 50%

18 NIU Center for Governmental Studies
Promoting Regional Prosperity in Northwest Illinois
Business Practices
mAnufActuringrespondents in the Manufacturing sector used all cost-saving strategies mainly impacting full-time workers. among the most frequently cited strategies were reduced travel (30.0%), elimination of overtime (27.0%), use of automation/new technology (27.0%), shorter work week (20.0%), and reduced training, employee development, and seminars (20.0%) (Figure 9). The strategies are inter-related as the use of automation and new technology could cause a reduction of overtime and reduced training could lead to reduction of travel.
Figure 9: Manufacturing Sector Cost-Saving Strategies
Reduced travel
Eliminate all overtime
Automation /new technology
Shorter work week
Reduce training, employee development, seminars
Eliminate 2nd and 3rd shifts
Contract labor, outsourcing
Unpaid forlough, temporary unpaid leave
Eliminate cash bonuses, incentives
Allow more employees to work from home
Temporary closing with reduced pay
Full-time employees changed to part-time
Part-time
Full-time
0% 5% 10% 15% 20% 25% 30%
trAnsPortAtion And wArehousingwork from home, contractors/outsourcing, and shorter work weeks were the only cost-saving strategies implemented in this industry sector. These strategies affected only full-time employees in a relatively small proportion (14.0%) of respondents in this sector so a figure is not included.
only Transportation and warehousing did not implement any of the top three cost-saving strategies: reduced travel, use of automation/new technology, and elimination of overtime. Not using these strategies is understandable because travel is often essential and overtime may be unavoidable due to such issues as weather conditions or traffic congestion causing unanticipated delays in required travel.

NIU Center for Governmental Studies 19
Promoting Regional Prosperity in Northwest Illinois
occupations
occuPAtions
The wage information section identified 10 Standard occupation classifications (Soc) in the 5-county region that are prevalent among the targeted industry sectors. in this section, the occupation data are grouped by whether the occupations exist in all four industry sectors and the “other” category (ubiquitous or universal), exist in four of the five categories (common) or are exclusive to one specific industry (unique). ultimately, ubiquitous and common occupations provide more opportunities for workers to transfer their skills to other locations or sectors.
ubiquitous occuPAtions in the regionrespondents in all four industry sectors, and the “other” category, identified 12 ubiquitous occupation titles within 3 Soc categories: Management, business and Financial, and office and administrative Support functions.
The Management occupations include the leadership and operations aspects of the business, such as the following:
» chief executive officer » human resources Manager » general and operations Manager » iT Systems Supervisor/computer and information Systems Manager » business and Financial Manager » Managers, all other
one business and Financial occupation was reported across all industry sectors: compliance officer. office and administrative Support occupations reported across all four industry sectors include the following:
» receptionist » executive Secretary and administrative assistant » customer Service representative » general clerk » Secretary/administrative assistant

20 NIU Center for Governmental Studies
Promoting Regional Prosperity in Northwest Illinois
Occupations
The percentage of ubiquitous occupations in each industry varies with the overall number of occupations. For example, Manufacturing had the greatest number of different occupation titles, therefore ubiquitous occupations represent the smallest proportion (17.9%). Conversely, Agriculture has the lowest number of different occupation titles, therefore ubiquitous occupations represent a higher proportion of the labor force in those businesses (42.9%) (Table 1).
Table 1: Ubiquitous, Common, and Unique Occupations in the 5-County Region
Industry
Occupational Titles on
Survey
% Ubiquitous Occupation
Titles
% Common Occupation
Titles
% Unique Occupation
Titles
Manufacturing 67 17.9% 19.4% 28.4%
Healthcare and Social Assistance 53 22.6 13.2 45.3
Transportation and Warehousing 32 37.5 37.5 0.0
Agriculture 28 42.9 17.9 14.3
Other 33 36.4 36.4 3.0
Common oCCupations in the RegionFurther analysis of the occupation titles among industry sectors revealed additional, common occupation titles. Common occupations among industry sectors also indicate the potential to transfer skills used/developed in one industry and apply them in another industry. For example, in Transportation and Warehousing, 37.5% of occupations match those in four other industry sectors (including “Other” category) in the region, and 25.0% match occupations in three other industries (Table 1). Common occupation titles are listed below:
» First-Line Supervisor of Office and Administrative Support Worker » Payroll Clerk » Stock Clerk and Order Filler » Computer Operator » Shipping Receiving and Traffic Clerk » Helper, Production Worker » Maintenance Worker, General » Janitor and Cleaner, Except Maid/Housekeeper » Truck Driver, Heavy/Tractor-trailer » Materials Handler » Industrial Production Manager
Common responsibilities and functions for each of these positions can be adapted to other industries and represent possible transferability of skills and a larger available labor pool.

NIU Center for Governmental Studies 21
Promoting Regional Prosperity in Northwest Illinois
occupations
unique occuPAtions in the regionunique occupations are those reported by only one industry sector and may represent a higher level of specialized training or the need for advanced education. The occupations related to healthcare and Social assistance have the highest proportion of unique occupations at 45.3% (Table 1). These include nurses, physicians, and other highly trained individuals. unique occupations do not offer many transferable skills as the ubiquitous and common occupations, however they do often represent higher paying jobs that the region would like to attract and retain.
educAtionAl AttAinment for regionAl occuPAtionseach industry sector is supported by a range of occupations, some of which are unique to that sector while others are found in many sectors. often, the more an occupation is specialized, the greater need for advanced education, while occupations that require no specialized skills may indicate minimal to no need for formal education. understanding the educational and training requirements for various occupations reported in the 5-county region is an important aspect to developing a work-ready labor force.
The healthcare and Social assistance sector requires a degree or certification for the largest proportion (58.4%) of occupations included in the Soc for life, Physical and Social Science, healthcare Practitioners, and healthcare Support (Figure 10). The Transportation and warehouse sector includes occupations categories least likely to require degrees or certifications such as Transportation and Material Moving, building and grounds, and construction, Production and Maintenance (22.0%).
Figure 10: Certificate or Degree Required by Industry
Transportation and Warehousing
Agriculture ManufacturingHealthcare andSocial Assistance
0%
10%
20%
30%
40%
50%
60% 58.4%
27.0%24.0%
22.0%
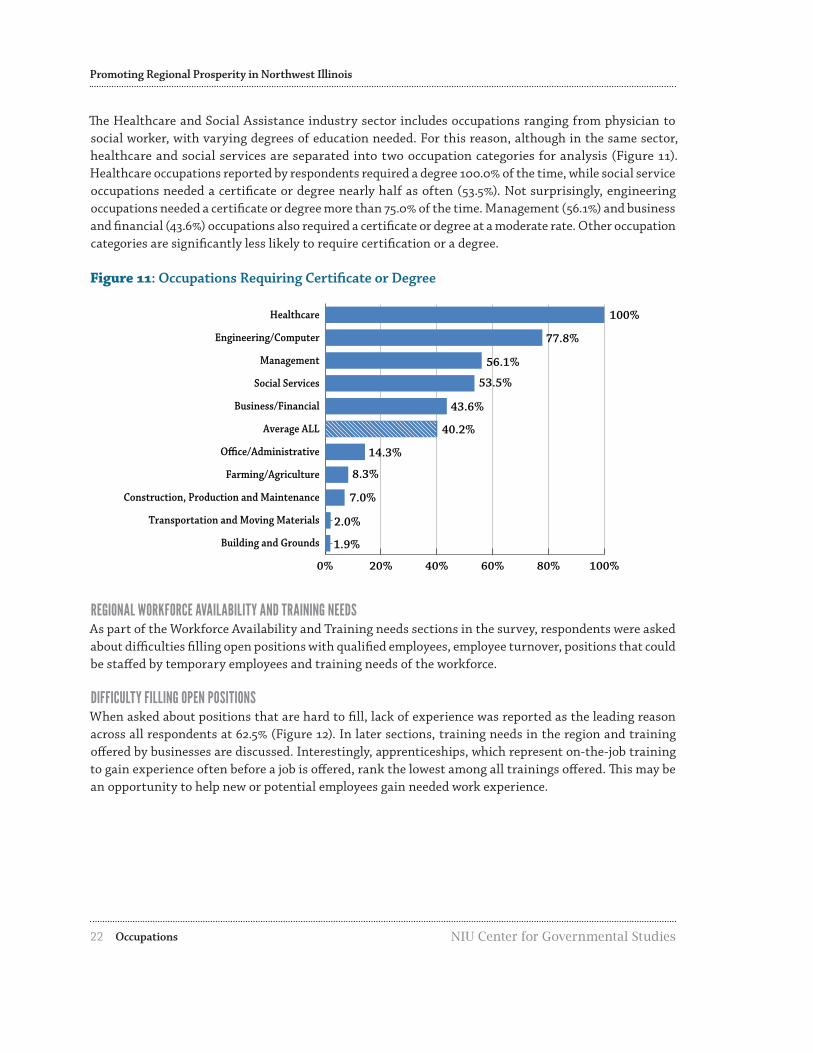
22 NIU Center for Governmental Studies
Promoting Regional Prosperity in Northwest Illinois
occupations
The healthcare and Social assistance industry sector includes occupations ranging from physician to social worker, with varying degrees of education needed. For this reason, although in the same sector, healthcare and social services are separated into two occupation categories for analysis (Figure 11). healthcare occupations reported by respondents required a degree 100.0% of the time, while social service occupations needed a certificate or degree nearly half as often (53.5%). Not surprisingly, engineering occupations needed a certificate or degree more than 75.0% of the time. Management (56.1%) and business and financial (43.6%) occupations also required a certificate or degree at a moderate rate. other occupation categories are significantly less likely to require certification or a degree.
Figure 11: Occupations Requiring Certificate or Degree
Healthcare
Engineering/Computer
Management
Social Services
Business/Financial
Average ALL
O�ce/Administrative
Farming/Agriculture
Construction, Production and Maintenance
Transportation and Moving Materials
Building and Grounds
100%
77.8%
56.1%
53.5%
43.6%
40.2%
14.3%
8.3%
7.0%
2.0%
1.9%
0% 20% 40% 60% 80% 100%
regionAl worKforce AvAilAbility And trAining needsas part of the workforce availability and Training needs sections in the survey, respondents were asked about difficulties filling open positions with qualified employees, employee turnover, positions that could be staffed by temporary employees and training needs of the workforce.
difficulty filling oPen Positionswhen asked about positions that are hard to fill, lack of experience was reported as the leading reason across all respondents at 62.5% (Figure 12). in later sections, training needs in the region and training offered by businesses are discussed. interestingly, apprenticeships, which represent on-the-job training to gain experience often before a job is offered, rank the lowest among all trainings offered. This may be an opportunity to help new or potential employees gain needed work experience.

NIU Center for Governmental Studies 23
Promoting Regional Prosperity in Northwest Illinois
occupations
Figure 12: Reasons for Difficulty Filling Open Positions
Lack of experience
Work ethic
Absenteeism
Level of pay
Pre-employment screening failures
0% 10% 20% 30% 40% 50% 60% 70% 80%
62.5%
43.8%
29.2%
18.8%
18.8%
Figure 13: Reasons for Difficulty Filling Open Positions by Industry Sector
Lack of experience
Work ethic
Absenteeism
Pre-employment screening failures
Level of pay
% of responses by industry
Agriculture Manufacturing Transportation and Warehousing
Healthcare andSocial Assistance
0%
10%
20%
30%
40%
50%
60% 59.0%
19.3%
7.2%
14.5%
in filling open positions, agriculture is the most affected by a lack of experienced workers, while absenteeism is not an issue. Transportation and warehousing reported failing pre-employment screening as the predominant reason that open positions cannot be filled, while level of pay had no effect in attracting qualified workers. level of pay issues were seen in the healthcare and Social assistance sector more than any of the other industry sectors surveyed in the region. This issue is understandable given that for several occupation titles in both healthcare and social services, the 5-county region is below the state and/or national average in wages (appendix c). Pre-employment screening had less impact for healthcare and Social assistance positions, possibly because of the screening already associated with receiving a license in nursing and other healthcare positions.
when considering reasons for difficulty in filling positions along with cost-saving strategies, elimination of bonuses, and level of pay may suggest that financial incentives are a factor in attracting qualified employees.
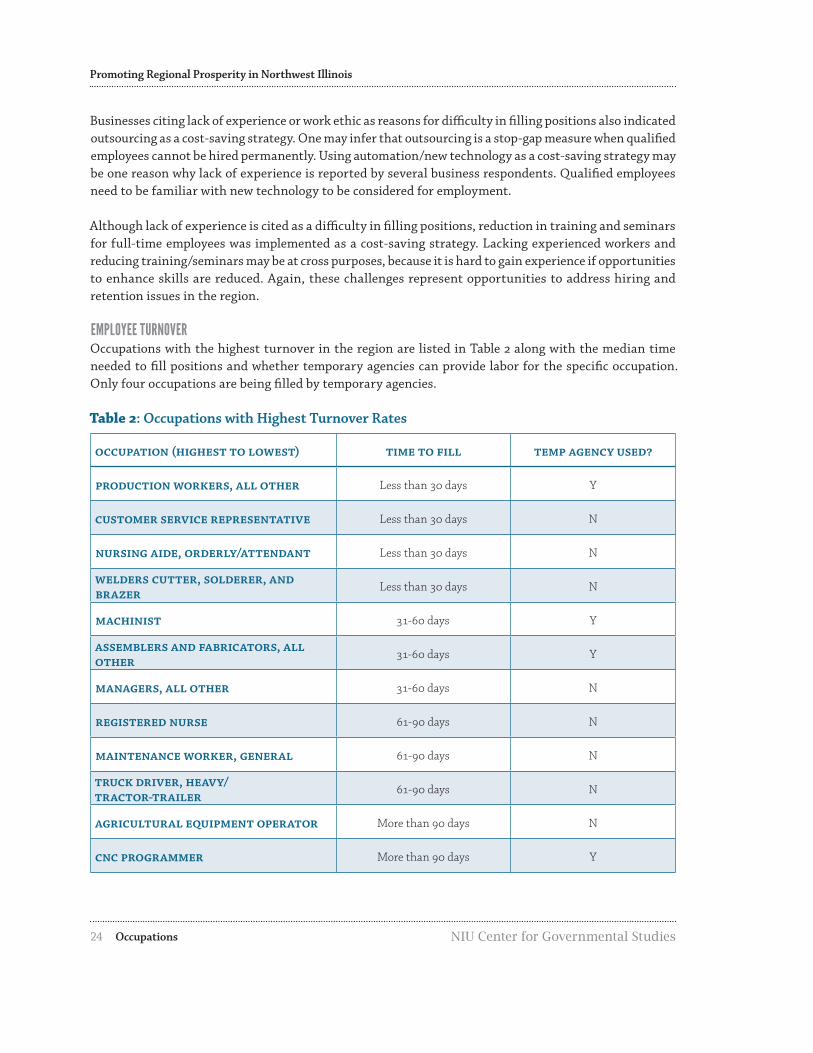
24 NIU Center for Governmental Studies
Promoting Regional Prosperity in Northwest Illinois
occupations
businesses citing lack of experience or work ethic as reasons for difficulty in filling positions also indicated outsourcing as a cost-saving strategy. one may infer that outsourcing is a stop-gap measure when qualified employees cannot be hired permanently. using automation/new technology as a cost-saving strategy may be one reason why lack of experience is reported by several business respondents. Qualified employees need to be familiar with new technology to be considered for employment.
although lack of experience is cited as a difficulty in filling positions, reduction in training and seminars for full-time employees was implemented as a cost-saving strategy. lacking experienced workers and reducing training/seminars may be at cross purposes, because it is hard to gain experience if opportunities to enhance skills are reduced. again, these challenges represent opportunities to address hiring and retention issues in the region.
emPloyee turnoveroccupations with the highest turnover in the region are listed in Table 2 along with the median time needed to fill positions and whether temporary agencies can provide labor for the specific occupation. only four occupations are being filled by temporary agencies.
Table 2: Occupations with Highest Turnover Rates
Occupation (Highest to Lowest) Time to Fill Temp Agency Used?
Production Workers, All Other Less than 30 days Y
Customer Service Representative Less than 30 days N
Nursing Aide, Orderly/Attendant Less than 30 days N
Welders Cutter, Solderer, and Brazer Less than 30 days N
Machinist 31-60 days Y
Assemblers and Fabricators, All Other 31-60 days Y
Managers, All Other 31-60 days N
Registered Nurse 61-90 days N
Maintenance Worker, General 61-90 days N
Truck Driver, Heavy/Tractor-trailer 61-90 days N
Agricultural Equipment Operator More than 90 days N
CNC Programmer More than 90 days Y

NIU Center for Governmental Studies 25
Promoting Regional Prosperity in Northwest Illinois
occupations
trAining needsSoft skills are personal attributes that enhance job performance through the ability to interact effectively with co-workers and customers. These are often the hardest skills to “teach” but lead the list of training needs for business respondents, especially in areas that require improved managerial skills (Figure 14). Training needs ranked as lower priorities, such as reading and math, may be skills that are basic or minimal requirements for employment and can be determined during pre-employment screening activities so they are not seen as issue for employers.
Figure 14: Training NeedsTeamwork and problem-solving
Supervisory/management skills
Communications
Executive/leadership development
Advanced computer skills
Sales and customer service
Specialized technology
Basic computer skills
Equipment operation
Basic math
Reading
Diversity sensitivity
English as a second language
79.7%
75.3%
69.0%
65.8%
64.3%64.0%
62.2%62.0%
57.5%
56.1%
54.5%
46.5%
21.7%
0% 10% 20% 30% 40% 50% 60% 70% 80%

26 NIU Center for Governmental Studies
Promoting Regional Prosperity in Northwest Illinois
Benefit Information
benefit informAtion
in general, full-time or part-time and/or salaried or hourly status affect the level of employee benefits offered, and this is the case with the 5-county region. benefits were examined on several levels, including training and education, health and dental insurance, 401K, paid holidays, and innovative benefits. overall, healthcare and Social assistance has the most consistency in benefits offered to both full- and part-time employees. data for Manufacturing show minimal benefits for part-time employees; however, most employment in manufacturing businesses is full-time hourly.
trAining And educAtion oPPortunitiesSurvey respondents in the region identified several training needs, including soft skills such as problem-solving and hard skills such as computer operations. Several types of training and education opportunities are offered by employers to help address those needs. hourly vs. salaried employees were provided opportunities fairly equally with conferences, seminars, and workshops, outside training, and informal on-the-job training offered by a majority of respondents (Figure 15). The apprenticeship option was the only noticeably low ranking opportunity. as mentioned above, respondents noted lack of experience as an issue, but seminars, workshops, and training were some of the highest ranked cost-saving strategies. it will be important to recognize the priority of a skilled workforce, and to identify strategies that will be most useful in both the short and long-term to address training needs while maintaining fiscal responsibility.
Figure 15: Training and Educational Opportunities
Conferences/seminars/workshops
Outside training
On-the-job training, informal
In-house training
Tuition reimbursement
On-the-job training, formal
Apprenticeship training
Salaried
Hourly
97.1%
95.2%90.2%
88.1%90.9%
87.9%86.4%
81.0%73.3%
75.9%78.4%
15.6%26.8%
89.2%
0% 20% 40% 60% 80% 100%
The willingness of a business to reimburse for training often demonstrates the importance it places on education and retention of employees. The percentage an employer pays or reimburses employees for education and training opportunities, as well as delivery methods, are consistent among hourly and salaried workers. Most businesses reimburse or pay 76.0%-100.0% of education/training expenses, again except for apprenticeships (Figure 16). in-house and on-the-job training appear to offer the most cost-effective education opportunities, both in terms of financial and time commitment, for employer and employee alike.

NIU Center for Governmental Studies 27
Promoting Regional Prosperity in Northwest Illinois
Benefit Information
Figure 16: Education/Training Opportunities Paid by Employer
Hourly
Outside training
Conferences/seminars/workshops
In-house training
On-the-job training, informal
On-the-job training, formal
Tuition reimbursement
Apprenticeship training
0% 20% 40% 60% 80% 100%
76 – 100%
51 – 75%
1 – 50%
0%
76 – 100%
51 – 75%
1 – 50%
0%
Salaried
0% 20% 40% 60% 80% 100%
trAditionAl benefitsTraditional benefits such as health and dental insurance, 401K, and disability are typically offered to full-time, salaried workers. in the survey, respondents were asked for information on the percentage they paid for each benefit for salaried employees only.
life insurance is one benefit paid frequently in full by employers (71.3%). while health insurance is not paid in full by the employer at a high rate, nearly 58.0% of respondents cover between 75.0%-100.0% of the cost of health insurance (Figure 17). with the rising cost of health insurance, splitting costs between employers and employees is typical in businesses and organizations. Transportation and warehousing and agriculture responses were too few to yield statistically significant results.
Figure 17: Benefits Offered to Salaried Employees
De�ned bene�t plan (e.g., �xed formula)
De�ned contribution (e.g., 401K)
Short-term disability
Long-term disability
Life insurance
Vision insurance
Dental insurance
Health insurance
100%
75-99%
50-74%
25-49%
1-24%
N/A - Not O�ered
% Paid byEmployer
0% 10% 20% 30% 40% 50% 60% 70% 80%

28 NIU Center for Governmental Studies
Promoting Regional Prosperity in Northwest Illinois
Benefit Information
PAid holidAysPaid holidays, sick days, and vacation day accrual are other traditional benefits, although they are often offered to both full- and part-time employees. The survey indicates that only 2.4% of full-time employees do not receive any paid holidays (Figure 18). The majority (58.5%) receive eight or more paid holidays per year. Part-time employees are less likely to have paid holidays, with nearly 37.0% receiving no paid holidays. This may be driven by work schedules and facility holiday closures.
Figure 18: Paid Holidays per Year
Number of paid holidays
Part-time
Full-time
0
1 – 5
6 – 7
8 +
36.7%
18.3%
16.7%
25.6%
58.5%
13.4%
2.4%
38.2%
28.3%
0% 10% 20% 30% 40% 50% 60%
vAcAtion dAysas is typical with many employers, the longer someone is employed, the more vacation is received. For both categories, hourly and salaried, employees receive more vacation the longer they are employed with the business. a majority of respondents indicated that a salaried employee with 20 years of service receives 15+ vacation days (73.0%), similarly an hourly employee with 20 years of service receives 15+ vacation days (71.0%). Salaried and hourly employees with only one year of experience are most likely to receive 1-5 days of vacation.
Figure 19: Vacation Days Available Annually Based on Years Employed
0% 10% 20% 30% 40% 50% 60% 70% 80%
20 Yrs.
10 Yrs.
5 Yrs.
1 Yrs.
20 Yrs.
10 Yrs.
5 Yrs.
1 Yrs.
0% 10% 20% 30% 40% 50% 60% 70% 80%
Number of Vacation Days
15+10 – 156 – 91 – 50
HourlySalaried

NIU Center for Governmental Studies 29
Promoting Regional Prosperity in Northwest Illinois
Benefit Information
sicK dAysThe number of sick days showed little variation regardless of the length of time of service. approximately 40.0% of salaried and 45.0% of hourly workers have no sick days provided per year. Nearly 30.0% of all employees are provided 1-5 sick days per year (Figure 20).
Figure 20: Sick Days per Year
20 Yrs.
10 Yrs.
5 Yrs.
1 Yrs.
20 Yrs.
10 Yrs.
5 Yrs.
1 Yrs.
Number of Sick Days
24+15 – 23
Salaried
6 – 141 – 50
Hourly
0% 10% 20% 30% 40% 50%0% 10% 20% 30% 40% 50%
Vacation carryover is available more often than sick day carryover for both salaried and hourly employees. This benefit is used by less than 50.0% of respondents (Figure 21).
Figure 21: Carryover Vacation and Sick Days Offered
Salaried
Hourly
Sick Days CarryoverVacation Carryover
0%
10%
20%
30%
40%
50% 47.6% 45.2%
32.1%34.5%

30 NIU Center for Governmental Studies
Promoting Regional Prosperity in Northwest Illinois
Benefit Information
innovAtive benefitswhile traditional benefits are the most used by businesses, innovative benefits may enhance the attractiveness of a compensation package for an employee. an innovative benefit is defined as one outside of traditionally offered benefit packages (i.e., health and dental insurance, 401K) but still contributes to the overall compensation package for employees. Flexible spending accounts are most widely implemented (61.8%) as well as cafeteria plans (41.8%), flexible scheduling, and company vehicles (both with 38.2%) (Figure 22). These represent opportunities for businesses, especially those utilizing cost-saving strategies, to offer alternative benefits that may be useful to employees but may not cost as much as traditional benefits. Part-time employees are offered innovative benefits at half the rate of full-time employees.
Figure 22: Innovative Benefits
Flexible spending accounts
Cafeteria plan
Use of company vehicle
Flexible scheduling
Gym membership
Telecommuting
Compensation time
On-site day care
Quali�ed parking
Part-time
Full-time
18.2%61.8%
23.6%
16.4%38.2%
16.4%
9.1%16.4%
38.2%
1.8%12.7%
1.8%9.1%
3.6%3.6%
1.8%1.8%
41.8%
0% 10% 20% 30% 40% 50% 60% 70% 80%

NIU Center for Governmental Studies 31
Promoting Regional Prosperity in Northwest Illinois
Wage Information
wAge informAtion
one of the greatest expenses for business is payroll, no matter the industry sector. respondents provided information on wage levels for 10 Soc categories representative of the employees in each major industry sector in the region. annual wage levels were gathered for each occupation starting at $10,000 up through $200,000 using $10,000 increments. wage data was compiled for minimum, maximum, and median amounts. Figure 23 displays the median wage information for the various Soc categories for employment in the region.
Figure 23: Median Wages for SOC Categories in the 5-County Region
Management
Engineering/Computer
Healthcare
Business/Financial
ALL Occupations
Farming/Agriculture
Construction, Production and Maintenance
Social Services
O�ce/Administrative
Transportation and Material Moving
Building/Grounds
$72,500
$58,000
$53.889
$50,000
$45,281
$41,667
$39,565
$34,000
$33,929
$33,000
$22,500
$0 $20,000 $40,000 $60,000 $80,000
wAge comPArisonsappendix c provides all wage data and occupation descriptions for the Soc categories by group associated with the major industry sectors in the region. The comparison includes national and state wage data (which include metro areas), along with survey results for minimum, maximum, and median wages paid by business respondents. in the sections below, those occupational categories that are either above or below the state and national averages are discussed.
The experience level and years of service of the workforce and productivity level characteristics of specific industry sectors are not factored into the wage comparison section. Further analyses of this aspect of wage variations between the regional, state, and national levels are needed in order to understand how wage comparisons relate to productivity. The following discussions analyze those occupation categories and titles in the 5-county region that are above or below the state and national average wages.

32 NIU Center for Governmental Studies
Promoting Regional Prosperity in Northwest Illinois
Wage Information
5-county occuPAtions Above stAte And nAtionAl AverAge wAgesin the 5-county region, average wages in four occupation categories were above both state and national average wage levels (Table 3). The threshold for determining above average wages was the occupation categories and titles in the 5-county region that exceeded 100.0% of the state and/or national average wages.
Table 3: 5-County Occupation Categories Above State and National Average Wages
Occupation Category % ABOVE State Avg.
% ABOVE National Avg.
Farming/Agriculture 21.0% 43.0%
Transportation and Material Moving 8.0 12.0
Construction, Production and Maintenance 4.0 9.0
Building and Grounds Cleaning and Maintenance, Protective Service 5.0 4.0
in the 5-county region, the remaining Soc categories did not exceed the state and national averages; however, several individual occupation titles reported average wages above state and/or national average wage levels (Table 4). The percentages are relatively small, except for Personal and home care aides and home health aides.
Table 4: 5-County Occupation Titles Above State and National Average Wages
SOC category Occupation Title % Above State Avg.
% Above National Avg.
Office and Administrative Occupations
receptionist and information clerk 4.0% 6.0%
Stock clerk and order Filler 4.0 3.0
Shipping, receiving, and Traffic clerk 2.0 3.0
general clerk 1.0 4.0
customer Service representative 0.0 6.0
Healthcare Occupations
Personal and home care aides 61.0 70.0
home health aide 30.0 37.0
cardiovascular Technologist/Technician 22.0 10.0
recreational Therapist 11.0 5.0
Physician’s assistant 8.0 0.0
Medical assistant 2.0 7.0
Pediatrician 0.0 7.0

NIU Center for Governmental Studies 33
Promoting Regional Prosperity in Northwest Illinois
Wage Information
5-county occuPAtions below stAte And nAtionAl AverAge wAgeswhile some occupation categories and titles in the 5-county region exceeded the state and/or national wage averages, there were also several below them. This section discusses occupational categories and titles that were 25.0% or more below the state and/or national average wages. only the Management occupation category falls below the state and national averages wage level, with the 5-county region paying 28.0% below the state average wages and 34.0% below the national average wages.
There were several occupation titles below the state and/or national average wages as well. Those occupation titles that paid the most below the state and national averages included iT Systems Supervisor/ computer and information Systems Manager, business and Financial Manager, and human resources Manager (Table 5).
Table 5: 5-County Occupation Titles Below State and National Average Wages
SOC category Occupation Title % Below State Avg.
% Below National Avg.
Management
iT Systems Supervisor/computer and information Systems Manager
-40.0% -46.0%
business and Financial Manager -35.0 -38.0
human resource Manager -33.0 -38.0
Managers, all other -29.0 -35.0
Healthcare Occupations
registered Nurse -29.0 -31.0
radiation Therapist -23.0 -31.0
Engineering and Computer
Mechanical engineer -29.0 -26.0
Network and computer Systems administrator -27.0 -27.0
Business and Financial Occupations
Market research analysts and Marketing Specialist
-30.0 -37.0
logisticians -24.0 -33.0

34 NIU Center for Governmental Studies
Promoting Regional Prosperity in Northwest Illinois
Wage Information
wAge And sAlAry increAsesSurvey respondents were asked which methods were used for wage/salary increases, and allowed to mark all methods that applied. These included performance-based (merit review), cost of living, length of service, and/or lump-sum bonuses. Performance-based reviews are the most common method across all industries for awarding pay increases (81.7%). lump-sum bonuses are provided by more than 43.0% of businesses, while length of service pay increases are the least likely method to be used (15.9%) (Figure 24).
Figure 24: Methods for Determining Wage and Salary Increases
Performance-based (merit review)
Cost of living adjustment
Lump-sum bonusLength of service
0
20%
40%
60%
80%
100%
15.9%
32.9%43.9%
81.7%
healthcare and Social assistance do not use lump-sum bonuses, instead they rely heavily (81.8%) on performance-based reviews to determine pay increases. conversely, Transportation and warehousing utilize lump-sum bonuses frequently (75.0%). interestingly, the least used method for determining increases in all categories was length of service, suggesting that longevity alone does not always translate into good performance. For those respondents who selected other, the majority used collective bargaining agreements and bonuses based on overall performance of the company to determine wage and salary increases.
Figure 25: Methods for Wage and Salary Increases by Industry Sector
Transportation and Warehousing
Argiculture
Manufacturing
Healthcare and Social Assistance
All Industries
Lump-sum bonus
Cost of living adjustment
Length of service
Performance-based (merit review)
0% 20% 40% 60% 80% 100%
75.0%
25.0%100%
50.0%
100%
14.3%100%
28.6%
51.3%
10.3%87.2%
25.6%
9.1%81.8%
36.4%
43.9%
15.9%81.7%
32.9%

NIU Center for Governmental Studies 35
Promoting Regional Prosperity in Northwest Illinois
appendix a
APPendix A: comPAnies resPonding to wAge And benefit survey
Thank you to the following businesses for their participation in the 2011-2012 5-county regional wage and benefit survey.
adkins energyallied-locke industries, inc.american gear, inc.astec Mobile Screens, inc.behr Manufacturingbeltway Scalesberner Food and beverage bi-county Special education co-opbonnell industries, inc.boston leather, inc.brown constructioncarroll industrial Mold Productscgh Medical center champion chisel workschrist lutherancity of rochellecoilcraftcompliance Signs companydana driveshaft Manufacturing, llcdixon directdonaldson company, inc.east coloma #12eco grove wind Farm - accionaelSPeceyelet Products and engineering corp.FhNForster ProductsFour Star Frantz Manufacturing companyFurst McNessgencogeneration 4halo branded Solutions, inc. (lee wayne)high Plains Porkhughes resources, inc.hulsebus-gehlsen chiropractichunter haven FarmsJ. T. cullen company
James endress consultingKolb-lena cheese, inc. KSb hospitall and J industrial Stapleslanark ag centerMallard Manufacturing corp.Manor court of FreeportManpowerMonroe clinicMontmorency #145Morrison #6Morrison community hospitalMorse groupNewell rubbermaid - downtown campusNorthwest illinois constructionPearl city elevators co-opPhil’s Fresh eggsProphet gearProto cutterProvena St. Joseph campusrentech energyriverdale elementary #14rochelle community hospital rochelle Foods, inc.rock Falls elementary #13rock river lumber and grain companyrock river Tool and dierock river Valley Self help enterprise rotary airlock, llcroys Transfer ryder logisticsSauer-danfossSauk Valley community collegeSeaga ManufacturingSewer equipment company of americaSilgan containers corp.Sinnissippi centers, inc.Skoog landscape design

36 NIU Center for Governmental Studies
Promoting Regional Prosperity in Northwest Illinois
appendix a
Snak King (bought cJ Vitners)Spectrum brandsSPg internationalSpherion Staffing ServicesStephenson county health dept.Stephenson Nursing centerStephenson Service companySterling #5Sterling Multi ProductsSterling Steel company, llcSVa healthcare ServicesTeam Products, inc.The iFh group, inc.Titan TireTraMec hill Fastener corp.
Transworld PlasticsTri Star MetalsTriple creek Farmsunited Parcel Servicewagner Printing, companywal-Mart distribution center #704west carroll #314westwood Machine and Toolwhiteside area career centerwhiteside county court housewhiteside county roewoodhaven association

NIU Center for Governmental Studies
Promoting Regional Prosperity in Northwest Illinois
37appendix B
APPendix b: north AmericAn industry clAssificAtion system (nAics) 5-county industry sector definitions
mAnufActuring (nAics 31-33) Definition Source: http://www.census.gov/econ/census02/naics/sector31/31-33.htm
The Manufacturing sector is comprised of establishments engaged in the mechanical, physical, or chemical transformation of materials, substances, or components into new products. The assembling of component parts of manufactured products is considered manufacturing, except in cases where the activity is appropriately classified in Sector 23, construction.
establishments in the Manufacturing sector are often described as plants, factories, or mills and characteristically use power-driven machines and materials-handling equipment. The materials, substances, or components transformed by manufacturing establishments are raw materials that are products of agriculture, forestry, fishing, mining, or quarrying as well as products of other manufacturing establishments.The subsectors in the Manufacturing sector generally reflect distinct production processes related to material inputs, production equipment, and employee skills.
The boundaries of manufacturing and the other sectors of the classification system can be somewhat blurry. The establishments in the manufacturing sector are engaged in the transformation of materials into new products. Their output is a new product. however, the definition of what constitutes a new product can be somewhat subjective.
heAlthcAre And sociAl AssistAnce (nAics 62) Definition Source: http://www.census.gov/svsd/www/services/sas/sas_summary/62summary.htm
The healthcare and Social assistance sector is comprised of establishments providing healthcare and social assistance for individuals. The sector includes both healthcare and social assistance because it is sometimes difficult to distinguish between the boundaries of these two activities. The industries in this sector are arranged on a continuum starting with those establishments providing medical care exclusively, continuing with those providing healthcare and social assistance, and finally finishing with those providing only social assistance. The services provided by establishments in this sector are delivered by trained professionals. all industries in the sector share this commonality of process, namely, labor inputs of health practitioners or social workers with the requisite expertise. Many of the industries in the sector are defined based on the educational degree held by the practitioners included in the industry.
Promoting Regional Prosperity in Northwest Illinois
NIU Center for Governmental Studies38 appendix B
Agriculture, forestry, fishing And hunting (nAics 11) Definition Source: http://www.census.gov/eos/www/naics/2007NAICS/2007_Definition_File.pdf
The agriculture, Forestry, Fishing, and hunting sector is comprised of establishments primarily engaged in growing crops, raising animals, harvesting timber, and harvesting fish and other animals from a farm, ranch, or their natural habitats. The establishments in this sector are often described as farms, ranches, dairies, greenhouses, nurseries, orchards, or hatcheries.
The sector distinguishes two basic activities: agricultural production and agricultural support activities. agricultural production includes establishments performing the complete farm or ranch operation, such as farm owner-operators, tenant farm operators, and sharecroppers. agricultural support activities include establishments that perform one or more activities associated with farm operation, such as soil preparation, planting, harvesting, and management, on a contract or fee basis.
trAnsPortAtion And wArehousing (nAics 48-49) Definition Source: http://www.census.gov/svsd/www/services/sas/sas_summary/48summary.htm
The Transportation and warehousing sector includes industries providing transportation of passengers and cargo, warehousing and storage for goods, scenic and sightseeing transportation, and support activities related to modes of transportation. establishments in these industries use transportation equipment or transportation related facilities as a productive asset. The type of equipment depends on the mode of transportation. The modes of transportation are air, rail, water, road, and pipeline.
The Transportation and warehousing sector distinguishes three basic types of activities: subsectors for each mode of transportation, a subsector for warehousing and storage, and a subsector for establishments providing support activities for transportation. in addition, there are subsectors for establishments that provide passenger transportation for scenic and sightseeing purposes, postal services, and courier services.

NIU
Cen
ter
for
Gov
ern
men
tal S
tud
ies
Prom
otin
g R
egio
nal P
rosp
erit
y in
Nor
thw
est I
llino
is
39a
ppen
dix
C
APPe
ndix
c: oc
cuPA
tionA
l wAg
e dAt
A And
desc
riPtio
nsN
ote:
in in
stan
ces
whe
re o
ccup
atio
nal t
itle
s us
ed fo
r 5-c
ount
y w
age
and
bene
fit s
urve
y di
d no
t mat
ch e
xact
ly to
So
c ti
tles
, the
clo
sest
mat
chin
g ti
tles
wer
e us
ed
whe
n de
term
inin
g th
e st
ate
and
nati
onal
ave
rage
s.
Man
agem
ent
Wag
e D
ata
Man
agem
ent
Occ
upa
tio
ns
Nat
’l
Avg.
W
age
IL A
vg.
Wag
e
5-Ct
y Av
g.
Wag
e
5-Ct
y %
o
f St
ate
Avg.
5-Ct
y %
o
f N
at’l
Av
g.
5-Ct
y M
in.
Wag
e
5-Ct
y M
ax.
Wag
e
IL
Med
ian
W
age
5-Ct
y M
edia
n
Wag
e
Busi
nes
s an
d F
inan
cial
Man
ager
s $1
20,4
50$1
15,2
3075
,085
65%
62%
$60,
000
$88,
824
$100
,630
$70,
000
Chie
f Ex
ecu
tive
s 17
6,55
015
4,85
011
4,43
374
6595
,098
134,
630
141,
400
100,
000
Gen
eral
an
d O
per
atio
ns
Man
ager
s 11
4,49
011
0,87
084
,419
7674
65,3
1910
5,91
892
,980
80,0
00
Hu
man
Res
ou
rce
Man
ager
s 10
8,60
010
1,09
067
,600
6762
54,0
7480
,345
94,9
4060
,000
Indu
stri
al P
rodu
ctio
n M
anag
ers
96,3
7087
,710
68,8
1078
7153
,200
84,4
0081
,220
65,0
00
IT S
yste
ms
Supe
rvis
ors
/Co
mpu
ter
and
In
form
atio
n S
yste
ms
Man
ager
s 12
5,66
011
2,79
068
,125
6054
54,0
0077
,500
106,
870
65,0
00
Man
ager
s, A
ll O
ther
10
4,91
095
,180
68,0
0071
6549
,643
84,8
2885
,870
60,0
00
Sale
s M
anag
ers
116,
860
105,
590
85,2
7881
7367
,143
110,
952
92,2
5080
,000
Cate
gory
Ave
rag
e12
0,48
611
0,41
478
,969
7266
62,3
1095
,925
99,5
2072
,500
Dat
a So
urce
s: C
GS
5-co
unty
Wag
e an
d Be
nefit
Sur
vey,
201
1; S
tate
and
Nat
iona
l ave
rage
s are
from
Bur
eau
of L
abor
and
Sta
tist
ics O
ES d
atas
et, 2
011.
Not
e: A
ll w
age
data
are
ann
ual.

40N
IU C
ente
r fo
r G
over
nm
enta
l Stu
die
s
Prom
otin
g R
egio
nal P
rosp
erit
y in
Nor
thw
est I
llino
is
app
endi
x C
40mAnA
geme
nt oc
cuPA
tion d
escr
iPtion
sCh
ief
Exec
uti
ves
det
erm
ine
and
form
ulat
e po
licie
s an
d pr
ovid
e ov
eral
l dir
ecti
on o
f co
mpa
nies
or
pri
vate
and
pub
lic s
ecto
r org
aniz
atio
ns w
ithi
n gu
idel
ines
set
up
by a
boa
rd o
f di
rect
ors o
r sim
ilar g
over
ning
bod
y. P
lan,
dir
ect,
or co
ordi
nate
ope
ratio
nal a
ctiv
ities
at
the
high
est l
evel
of m
anag
emen
t wit
h th
e he
lp o
f sub
ordi
nate
exe
cuti
ves
and
staff
man
ager
s.
Gen
eral
an
d O
per
atio
ns
Man
ager
Pl
an, d
irec
t, or
coor
dina
te th
e op
erat
ions
of p
ublic
or p
riva
te se
ctor
org
aniz
atio
ns.
dut
ies
and
resp
onsi
bilit
ies
incl
ude
form
ulat
ing
polic
ies,
man
agin
g da
ily
oper
atio
ns, a
nd p
lann
ing
the
use
of m
ater
ials
and
hum
an r
esou
rces
, but
are
to
o di
vers
e an
d ge
nera
l in
natu
re to
be
clas
sifie
d in
any
one
func
tion
al a
rea
of
man
agem
ent o
r adm
inis
trat
ion,
such
as p
erso
nnel
, pur
chas
ing,
or a
dmin
istr
ativ
e se
rvic
es. e
xclu
des
Firs
t-li
ne S
uper
viso
rs.
Sale
s M
anag
ers
Plan
, dir
ect,
or
coor
dina
te t
he a
ctua
l dis
trib
utio
n or
mov
emen
t of
a p
rodu
ct
or s
ervi
ce t
o th
e cu
stom
er.
coo
rdin
ate
sale
s di
stri
buti
on b
y es
tabl
ishi
ng
sale
s te
rrit
orie
s, q
uota
s, a
nd g
oals
and
est
ablis
h tr
aini
ng p
rogr
ams
for
sale
s re
pres
enta
tive
s. a
naly
ze s
ales
sta
tist
ics
gath
ered
by
staff
to
dete
rmin
e sa
les
pote
ntia
l and
inve
ntor
y re
quir
emen
ts a
nd m
onito
r the
pre
fere
nces
of c
usto
mer
s.
IT S
yste
ms
Supe
rvis
ors
/Co
mpu
ter
and
Info
rmat
ion
Sy
stem
s M
anag
ers
Plan
, dir
ect,
or c
oord
inat
e ac
tivi
ties
in s
uch
field
s as e
lect
roni
c da
ta p
roce
ssin
g,
info
rmat
ion
syst
ems,
sys
tem
s an
alys
is, a
nd c
ompu
ter
prog
ram
min
g.
Hu
man
Res
ou
rce
Man
ager
s Pl
an, d
irec
t, or
coor
dina
te h
uman
reso
urce
s act
ivit
ies a
nd st
aff o
f an
orga
niza
tion
. ex
clud
es m
anag
ers w
ho p
rim
arily
focu
s on
com
pens
atio
n an
d be
nefit
s and
trai
ning
an
d de
velo
pmen
t.
Busi
nes
s an
d F
inan
cial
Man
ager
s Pl
an, d
irec
t, o
r coo
rdin
ate
acco
unti
ng, i
nves
ting
, ban
king
, ins
uran
ce, s
ecur
itie
s,
and
othe
r fina
ncia
l act
ivit
ies o
f a b
ranc
h, o
ffice
, or d
epar
tmen
t of a
n es
tabl
ishm
ent.
Man
ager
s, A
ll O
ther
a
ll m
anag
ers
not l
iste
d se
para
tely
.

41N
IU C
ente
r fo
r G
over
nm
enta
l Stu
die
s
Prom
otin
g R
egio
nal P
rosp
erit
y in
Nor
thw
est I
llino
is
app
endi
x C
Bus
ines
s an
d Fi
nanc
ial O
pera
tion
s W
age
Dat
a
Busi
nes
s an
d Fi
nan
cial
Occ
upa
tio
ns
Nat
’l
Avg.
W
age
IL A
vg.
Wag
e
5-Ct
y Av
g.
Wag
e
5-Ct
y %
o
f St
ate
Avg.
5-Ct
y %
o
f N
at’l
Av
g.
5-Ct
y M
in.
Wag
e
5-Ct
y M
ax.
Wag
e
IL
Med
ian
W
age
5-Ct
y M
edia
n
Wag
e
Audi
tors
an
d Ac
cou
nta
nts
$70,
130
$71,
330
$55,
500
78%
79%
$39,
130
$68,
261
$63,
740
$50,
000
Com
plia
nce
Off
icer
s, E
xcep
t H
ealt
h/S
afet
y70
,130
71,3
3062
,308
8789
42,5
0085
,714
63,4
8060
,000
Logi
stic
ian
s74
,860
66,0
4050
,000
7667
40,0
0060
,000
68,9
1050
,000
Mar
ket
Rese
arch
An
alys
ts a
nd
Mar
keti
ng
Spec
iali
sts
67,1
3060
,510
42,5
0070
6332
,000
50,0
0054
,660
40,0
00
Sale
s Re
pres
enta
tive
s69
,870
68,6
0763
,478
9391
40,8
3383
,846
68,0
7060
,000
Wh
ole
sale
an
d Re
tail
Bu
yers
, Exc
ept
Farm
Pr
odu
cts
56,8
1050
,830
43,1
2585
7634
,444
52,2
2250
,280
40,0
00
Cate
gory
Ave
rage
68,1
5564
,774
52,8
1881
7738
,151
66,6
7461
,523
50,0
00
Dat
a So
urce
s: C
GS
5-co
unty
Wag
e an
d Be
nefit
Sur
vey,
201
1; S
tate
and
Nat
iona
l ave
rage
s are
from
Bur
eau
of L
abor
and
Sta
tist
ics O
ES d
atas
et, 2
011.
Not
e: A
ll w
age
data
are
ann
ual.

42N
IU C
ente
r fo
r G
over
nm
enta
l Stu
die
s
Prom
otin
g R
egio
nal P
rosp
erit
y in
Nor
thw
est I
llino
is
app
endi
x C
busin
ess A
nd fi
nAnc
iAl oP
erAt
ions o
ccuP
Ation
desc
riPtio
nsAu
dito
rs a
nd
Acc
ou
nta
nts
e
xam
ine,
an
alyz
e, a
nd i
nter
pret
acc
ount
ing
reco
rds
to p
repa
re fi
nan
cial
st
atem
ents
, giv
e ad
vice
, or
audi
t an
d ev
alua
te s
tate
men
ts p
repa
red
by o
ther
s.
inst
all o
r adv
ise
on sy
stem
s of r
ecor
ding
cost
s or o
ther
fina
ncia
l and
bud
geta
ry
data
. exc
lude
s Ta
x ex
amin
ers
and
colle
ctor
s an
d r
even
ue a
gent
s.
Com
plia
nce
Off
icer
s, e
xcep
t H
ealt
h/S
afet
y e
xam
ine,
eva
luat
e, a
nd i
nves
tiga
te e
ligib
ilit
y fo
r or
con
form
ity
wit
h la
ws
and
regu
lati
ons
gove
rnin
g co
ntra
ct c
ompl
ianc
e of
lice
nses
and
per
mit
s, a
nd
perf
orm
oth
er c
ompl
ianc
e an
d en
forc
emen
t in
spec
tion
and
ana
lysi
s ac
tivi
ties
no
t cla
ssifi
ed e
lsew
here
.
Logi
stic
ian
s a
nal
yze
and
coor
din
ate
the
logi
stic
al f
unct
ions
of
a fi
rm o
r or
gan
izat
ion.
re
spon
sibl
e for
the e
ntir
e life
cycl
e of a
pro
duct
, inc
ludi
ng ac
quis
itio
n, d
istr
ibut
ion,
in
tern
al a
lloca
tion
, del
iver
y, a
nd fi
nal d
ispo
sal o
f res
ourc
es.
Mar
ket
Rese
arch
An
alys
ts a
nd
Mar
keti
ng
Spec
iali
sts
res
earc
h m
arke
t co
ndit
ions
in
loca
l, re
gion
al, o
r na
tion
al a
reas
, or
gath
er
info
rmat
ion
to d
eter
min
e po
tent
ial s
ales
of
a pr
oduc
t or
ser
vice
, or
crea
te a
m
arke
ting
cam
paig
n. M
ay g
athe
r inf
orm
atio
n on
com
peti
tors
, pri
ces,
sale
s, a
nd
met
hods
of m
arke
ting
and
dis
trib
utio
n.
Sale
s Re
pres
enta
tive
s, W
ho
lesa
le a
nd
Man
ufa
ctu
rin
g,
Tech
nic
al a
nd
Sci
enti
fic
Pro
duct
s Se
ll go
ods
for
who
lesa
lers
or
man
ufac
ture
rs w
here
tec
hnic
al o
r sc
ient
ific
know
ledg
e is
req
uire
d in
suc
h ar
eas
as b
iolo
gy, e
ngin
eeri
ng, c
hem
istr
y, a
nd
elec
tron
ics,
nor
mal
ly o
btai
ned
from
at
leas
t tw
o ye
ars
of p
ost-
seco
ndar
y ed
ucat
ion.
exc
lude
s Sa
les
engi
neer
s.
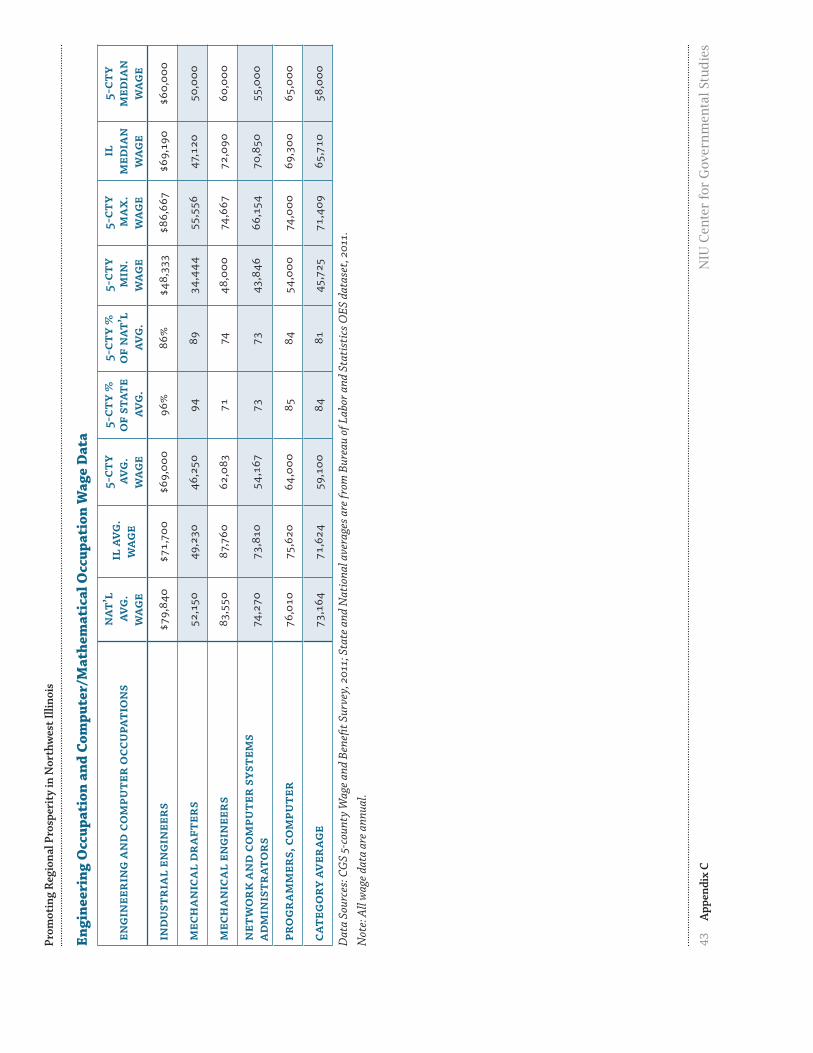
43N
IU C
ente
r fo
r G
over
nm
enta
l Stu
die
s
Prom
otin
g R
egio
nal P
rosp
erit
y in
Nor
thw
est I
llino
is
app
endi
x C
Engi
neer
ing
Occ
upat
ion
and
Com
pute
r/M
athe
mat
ical
Occ
upat
ion
Wag
e D
ata
Engi
nee
rin
g an
d Co
mpu
ter
Occ
upa
tio
ns
Nat
’l
Avg.
W
age
IL A
vg.
Wag
e
5-Ct
y Av
g.
Wag
e
5-Ct
y %
o
f St
ate
Avg.
5-Ct
y %
o
f N
at’l
Av
g.
5-Ct
y M
in.
Wag
e
5-Ct
y M
ax.
Wag
e
IL
Med
ian
W
age
5-Ct
y M
edia
n
Wag
e
Indu
stri
al E
ngi
nee
rs$7
9,84
0$7
1,70
0$6
9,00
096
%86
%$4
8,33
3$8
6,66
7$6
9,19
0$6
0,00
0
Mec
han
ical
Dra
fter
s52
,150
49,2
3046
,250
9489
34,4
4455
,556
47,1
2050
,000
Mec
han
ical
En
gin
eers
83,5
5087
,760
62,0
8371
7448
,000
74,6
6772
,090
60,0
00
Net
wo
rk a
nd
Com
pute
r Sy
stem
s Ad
min
istr
ato
rs74
,270
73,8
1054
,167
7373
43,8
4666
,154
70,8
5055
,000
Pro
gram
mer
s, C
om
pute
r76
,010
75,6
2064
,000
8584
54,0
0074
,000
69,3
0065
,000
Cate
gory
Ave
rage
73,1
6471
,624
59,1
0084
8145
,725
71,4
0965
,710
58,0
00
Dat
a So
urce
s: C
GS
5-co
unty
Wag
e an
d Be
nefit
Sur
vey,
201
1; S
tate
and
Nat
iona
l ave
rage
s are
from
Bur
eau
of L
abor
and
Sta
tist
ics O
ES d
atas
et, 2
011.
Not
e: A
ll w
age
data
are
ann
ual.
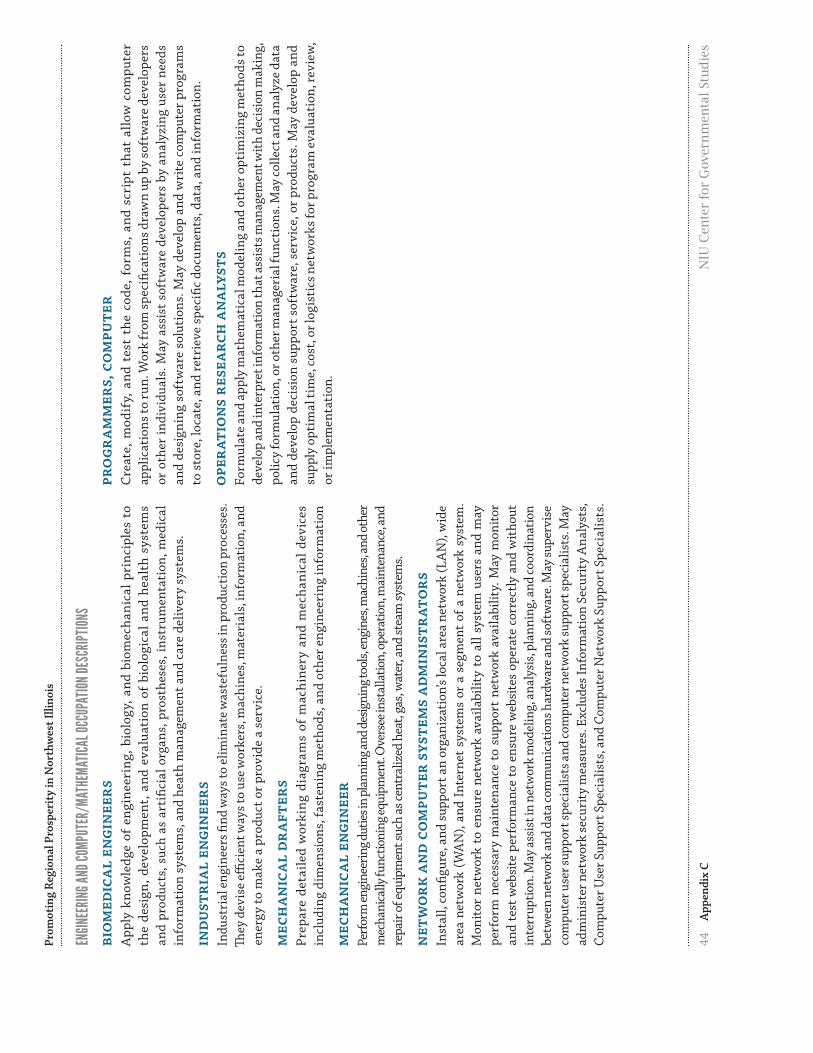
44N
IU C
ente
r fo
r G
over
nm
enta
l Stu
die
s
Prom
otin
g R
egio
nal P
rosp
erit
y in
Nor
thw
est I
llino
is
app
endi
x C
engin
eerin
g And
comP
uter
/mAt
hemA
ticAl
occu
PAtio
n des
criPt
ions
Bio
med
ical
En
gin
eers
a
pply
kno
wle
dge
of e
ngin
eeri
ng, b
iolo
gy, a
nd b
iom
echa
nic
al p
rinc
iple
s to
th
e de
sign
, dev
elop
men
t, a
nd e
valu
atio
n of
bio
logi
cal a
nd h
ealt
h sy
stem
s an
d pr
oduc
ts, s
uch
as a
rtifi
cial
org
ans,
pro
sthe
ses,
inst
rum
enta
tion
, med
ical
in
form
atio
n sy
stem
s, a
nd h
eath
man
agem
ent a
nd c
are
deliv
ery
syst
ems.
Indu
stri
al E
ngi
nee
rsin
dust
rial
eng
inee
rs fi
nd w
ays t
o el
imin
ate
was
tefu
lnes
s in
prod
ucti
on p
roce
sses
. Th
ey d
evis
e effi
cien
t way
s to
use
wor
kers
, mac
hine
s, m
ater
ials
, inf
orm
atio
n, a
nd
ener
gy to
mak
e a
prod
uct o
r pr
ovid
e a
serv
ice.
Mec
han
ical
Dr
afte
rsPr
epar
e de
taile
d w
orki
ng d
iagr
ams
of m
achi
nery
and
mec
han
ical
dev
ices
in
clud
ing
dim
ensi
ons,
fast
enin
g m
etho
ds, a
nd o
ther
eng
inee
ring
info
rmat
ion
Mec
han
ical
En
gin
eer
Pe
rfor
m en
gine
erin
g dut
ies i
n pl
anni
ng an
d des
igni
ng to
ols,
engi
nes,
mac
hine
s, an
d oth
er
mec
hani
cally
func
tioni
ng eq
uipm
ent.
ove
rsee
inst
alla
tion,
oper
atio
n, m
aint
enan
ce, a
nd
repa
ir of
equi
pmen
t suc
h as
cent
raliz
ed h
eat,
gas,
wat
er, a
nd st
eam
syst
ems.
Net
wo
rk a
nd
Co
mpu
ter
Syst
ems
Adm
inis
trat
ors
in
stal
l, co
nfigu
re, a
nd s
uppo
rt a
n or
gani
zati
on’s
loca
l are
a ne
twor
k (l
aN
), w
ide
area
net
wor
k (w
aN
), an
d in
tern
et s
yste
ms
or a
seg
men
t of
a n
etw
ork
syst
em.
Mon
itor
net
wor
k to
ens
ure
netw
ork
avai
labi
lity
to a
ll sy
stem
use
rs a
nd m
ay
perf
orm
nec
essa
ry m
aint
enan
ce t
o su
ppor
t ne
twor
k av
aila
bilit
y. M
ay m
onito
r an
d te
st w
ebsi
te p
erfo
rman
ce to
ens
ure
web
site
s op
erat
e co
rrec
tly
and
wit
hout
in
terr
uptio
n. M
ay a
ssis
t in
netw
ork
mod
elin
g, a
naly
sis,
pla
nnin
g, a
nd co
ordi
natio
n be
twee
n ne
twor
k an
d da
ta co
mm
unic
atio
ns h
ardw
are a
nd so
ftw
are.
May
supe
rvis
e co
mpu
ter u
ser s
uppo
rt sp
ecia
lists
and
com
pute
r net
wor
k su
ppor
t spe
cial
ists
. May
ad
min
iste
r net
wor
k se
curi
ty m
easu
res.
exc
lude
s inf
orm
atio
n Se
curi
ty a
naly
sts,
co
mpu
ter u
ser S
uppo
rt S
peci
alis
ts, a
nd c
ompu
ter N
etw
ork
Supp
ort S
peci
alis
ts.
Pro
gram
mer
s, C
om
pute
r c
reat
e, m
odif
y, a
nd t
est
the
code
, for
ms,
and
scr
ipt
that
allo
w c
ompu
ter
appl
icat
ions
to ru
n. w
ork
from
spec
ifica
tion
s dra
wn
up b
y so
ftw
are
deve
lope
rs
or o
ther
indi
vidu
als.
May
ass
ist
soft
war
e de
velo
pers
by
anal
yzin
g us
er n
eeds
an
d de
sign
ing
soft
war
e so
luti
ons.
May
dev
elop
and
wri
te c
ompu
ter
prog
ram
s to
sto
re, l
ocat
e, a
nd re
trie
ve s
peci
fic d
ocum
ents
, dat
a, a
nd in
form
atio
n.
Ope
rat
ion
s Re
sear
ch A
nal
ysts
Fo
rmul
ate
and
appl
y m
athe
mat
ical
mod
elin
g an
d ot
her o
ptim
izin
g m
etho
ds to
de
velo
p an
d in
terp
ret i
nfor
mat
ion
that
ass
ists
man
agem
ent w
ith
deci
sion
mak
ing,
po
licy
form
ulat
ion,
or o
ther
man
ager
ial f
unct
ions
. May
colle
ct a
nd a
naly
ze d
ata
and
deve
lop
deci
sion
sup
port
sof
twar
e, s
ervi
ce, o
r pr
oduc
ts. M
ay d
evel
op a
nd
supp
ly o
ptim
al ti
me,
cost
, or l
ogis
tics
net
wor
ks fo
r pro
gram
eva
luat
ion,
revi
ew,
or im
plem
enta
tion
.

45N
IU C
ente
r fo
r G
over
nm
enta
l Stu
die
s
Prom
otin
g R
egio
nal P
rosp
erit
y in
Nor
thw
est I
llino
is
app
endi
x C
Life
, Phy
sica
l and
Soc
ial S
cien
ce, H
ealt
hcar
e Pr
acti
tion
ers,
Hea
lthc
are
Supp
ort
Occ
upat
ion
Wag
e D
ata
Hea
lth
care
Occ
upa
tio
ns
Nat
’l
Avg.
W
age
IL A
vg.
Wag
e
5-Ct
y Av
g.
Wag
e
5-Ct
y %
o
f St
ate
Avg.
5-Ct
y %
o
f N
at’l
Av
g.
5-Ct
y M
in.
Wag
e
5-Ct
y M
ax.
Wag
e
IL
Med
ian
W
age
5-Ct
y M
edia
n
Wag
e
Card
iova
scu
lar
Tech
no
logi
sts/
Tech
nic
ian
s$5
2,16
0$4
7,01
0$5
7,50
012
2%11
0%$4
5,00
0$7
0,00
0$4
1,82
0$5
5,00
0
Chem
ists
74,7
8070
,560
60,0
0085
8050
,000
70,0
0065
,210
60,0
00
Ho
me
Hea
lth
Aid
es21
,820
23,0
1030
,000
130
137
20,0
0040
,000
21,0
8025
,000
Lice
nse
d Pr
acti
cal
Nu
rses
42,0
4041
,700
36,0
7187
8625
,714
46,4
2940
,900
30,0
00
Med
ical
Ass
ista
nts
30,1
7031
,440
32,1
4310
210
721
,429
42,8
5729
,200
30,0
00
Nu
rsin
g Ai
des,
Ord
erli
es/A
tten
dan
ts25
,420
24,7
7023
,571
9593
16,2
5031
,250
22,9
3020
,000
Occ
upa
tio
nal
Th
erap
ist
Assi
stan
ts52
,150
49,2
5048
,333
9893
40,0
0056
,667
50,7
8050
,000
Occ
upa
tio
nal
Th
erap
ists
74,9
7074
,180
63,3
3385
8446
,667
80,0
0074
,120
60,0
00
Pedi
atri
cian
s, G
ener
al16
8,65
018
2,77
018
0,00
098
107
160,
000
200,
000
126,
750
180,
000
Pers
on
al a
nd
Ho
me
Care
Aid
es20
,560
21,8
0035
,000
161
170
30,0
0040
,000
20,1
6035
,000
Phys
ical
Th
erap
ist
Assi
stan
ts51
,110
47,4
3043
,750
9286
32,5
0055
,000
49,6
0045
,000
Phys
ical
Th
erap
ists
79,8
3077
,840
73,5
7195
9255
,714
91,4
2978
,570
70,0
00
Phys
icia
n A
ssis
tan
ts89
,470
76,6
8083
,000
108
9368
,000
98,0
0079
,010
85,0
00
Radi
atio
n T
her
apis
ts79
,340
71,6
9055
,000
7769
40,0
0070
,000
76,8
8055
,000
Recr
eati
on
al T
her
apis
ts42
,940
40,5
6045
,000
111
105
40,0
0050
,000
37,3
2045
,000
Regi
ster
ed N
urs
es69
,110
67,1
9048
,000
7169
31,8
7561
,875
33,4
4040
,000
Resp
irat
ory
Th
erap
ists
56,2
6052
,690
50,0
0095
8936
,667
63,3
3353
,920
50,0
00
Surg
ical
Tec
hn
olo
gist
s42
,460
41,6
2036
,250
8785
27,5
0045
,000
40,9
1035
,000
Cate
gory
Ave
rage
59,6
2457
,899
55,5
8510
098
43,7
4067
,324
52,3
6753
,889
Dat
a So
urce
s: CG
S 5-
coun
ty W
age
and
Bene
fit S
urve
y, 2
011;
Sta
te a
nd N
atio
nal a
vera
ges a
re fr
om B
urea
u of
Lab
or a
nd S
tatis
tics O
ES d
atas
et, 2
011.
Not
e: A
ll w
age
data
are
ann
ual.

46N
IU C
ente
r fo
r G
over
nm
enta
l Stu
die
s
Prom
otin
g R
egio
nal P
rosp
erit
y in
Nor
thw
est I
llino
is
app
endi
x C
life,
Phys
icAl,
And s
ociAl
scien
ce, h
eAlt
hcAr
e PrA
ctiti
oner
s, he
Alth
cAre
suPP
ort o
ccuP
Ation
desc
riPtio
nsCa
rdio
vasc
ula
r Te
chn
olo
gist
s/Te
chn
icia
ns
cond
uct t
ests
on
pulm
onar
y or
car
diov
ascu
lar
syst
ems
of p
atie
nts
for
diag
nost
ic
purp
oses
. May
con
duct
or
assi
st in
ele
ctro
card
iogr
ams,
car
diac
cat
hete
riza
tion
s,
pulm
onar
y fun
ctio
ns, lu
ng ca
paci
ty, a
nd si
mila
r tes
ts. i
nclu
des v
ascu
lar t
echn
olog
ists
.
Chem
ists
co
nduc
t qua
litat
ive a
nd q
uant
itativ
e che
mic
al an
alys
es o
r exp
erim
ents
in la
bora
torie
s fo
r qu
ality
or
proc
ess
cont
rol o
r to
dev
elop
new
pro
duct
s or
kno
wle
dge.
exc
lude
s g
eosc
ient
ists
, exc
ept h
ydro
logi
sts a
nd g
eogr
aphe
rs an
d bi
oche
mis
ts an
d bi
ophy
sicis
ts.
Ho
me
Hea
lth
Aid
es
Prov
ide
rout
ine
indi
vidu
aliz
ed h
ealt
hcar
e su
ch a
s ch
angi
ng b
anda
ges
and
dres
sing
wou
nds a
nd a
pply
ing
topi
cal m
edic
atio
ns to
the
elde
rly,
conv
ales
cent
s,
or p
erso
ns w
ith
disa
bilit
ies a
t the
pat
ient
’s ho
me
or in
a ca
re fa
cilit
y. M
onit
or o
r re
port
cha
nges
in h
ealt
h st
atus
. May
als
o pr
ovid
e pe
rson
al ca
re su
ch a
s bat
hing
, dr
essi
ng, a
nd g
room
ing
of p
atie
nt.
Lice
nse
d P
rac
tica
l N
urs
es
care
for i
ll, in
jure
d, o
r con
vale
scin
g pa
tient
s or p
erso
ns w
ith d
isab
ilitie
s in
hosp
itals
, nu
rsin
g ho
mes
, clin
ics,
pri
vate
hom
es, g
roup
hom
es, a
nd si
mila
r ins
titu
tion
s. M
ay
wor
k un
der t
he s
uper
visi
on o
f a re
gist
ered
nur
se. l
icen
sing
requ
ired
.
Med
ical
Ass
ista
nts
Pe
rfor
m a
dmin
istr
ativ
e an
d ce
rtai
n cl
inic
al d
utie
s un
der
the
dire
ctio
n of
a
phys
icia
n. a
dmin
istr
ativ
e du
ties
may
inc
lude
sch
edul
ing
appo
intm
ents
, m
aint
aini
ng m
edic
al r
ecor
ds, b
illin
g, a
nd c
odin
g in
form
atio
n fo
r in
sura
nce
purp
oses
. clin
ical
dut
ies m
ay in
clud
e tak
ing
and
reco
rdin
g vi
tal s
igns
and
med
ical
hi
stor
ies,
pre
pari
ng p
atie
nts f
or e
xam
inat
ion,
dra
win
g bl
ood,
and
adm
inis
teri
ng
med
icat
ions
as
dire
cted
by
phys
icia
n. e
xclu
des
Phys
icia
n a
ssis
tant
s.
Nu
rsin
g Ai
des,
Ord
erli
es/A
tten
dan
ts
Tran
spor
t pa
tien
ts t
o ar
eas
such
as
oper
atin
g ro
oms
or x
-ray
roo
ms
usin
g w
heel
chai
rs, s
tret
cher
s, o
r m
ovea
ble
beds
. May
mai
ntai
n st
ocks
of s
uppl
ies
or
clea
n an
d tr
ansp
ort e
quip
men
t. P
sych
iatr
ic o
rder
lies a
re in
clud
ed in
Psy
chia
tric
a
ides
. exc
lude
s N
ursi
ng a
ssis
tant
s.
Occ
upa
tio
nal
Th
erap
ist
Assi
stan
ts
ass
ist
occu
pati
onal
the
rapi
sts
in p
rovi
ding
occ
upat
iona
l the
rapy
tre
atm
ents
an
d pr
oced
ures
. May
, in
acco
rdan
ce w
ith
Stat
e la
ws,
ass
ist
in d
evel
opm
ent
of
trea
tmen
t pl
ans;
car
ry o
ut r
outi
ne f
unct
ions
, dir
ect
acti
vity
pro
gram
s, a
nd
docu
men
t the
pro
gres
s of
tre
atm
ents
. gen
eral
ly re
quir
es fo
rmal
tra
inin
g.
Occ
upa
tio
nal
Th
erap
ists
a
sses
s, p
lan,
org
aniz
e, a
nd p
arti
cipa
te in
reha
bilit
ativ
e pr
ogra
ms t
hat h
elp
build
or
res
tore
voc
atio
nal,
hom
emak
ing,
and
dai
ly li
ving
ski
lls, a
s w
ell a
s ge
nera
l in
depe
nden
ce, t
o pe
rson
s w
ith
disa
bilit
ies
or d
evel
opm
enta
l del
ays.
Pedi
atri
cian
s, G
ener
al
Phys
icia
ns w
ho d
iagn
ose,
trea
t, a
nd h
elp
prev
ent c
hild
ren’
s dis
ease
s and
inju
ries
.
Pers
on
al a
nd
Ho
me
Care
Aid
es
ass
ist
the
elde
rly,
con
vale
scen
ts, o
r pe
rson
s w
ith
disa
bilit
ies
wit
h da
ily li
ving
ac
tivi
ties
at t
he p
erso
n’s h
ome
or in
a c
are
faci
lity.
dut
ies p
erfo
rmed
at a
pla
ce o
f re
side
nce m
ay in
clud
e kee
ping
hou
se (m
akin
g be
ds, d
oing
laun
dry,
was
hing
dis
hes)
an
d pr
epar
ing
mea
ls. M
ay p
rovi
de a
ssis
tanc
e at n
on-r
esid
enti
al ca
re fa
cilit
ies.
May
ad
vise
fam
ilies
, the
eld
erly
, con
vale
scen
ts, a
nd p
erso
ns w
ith
disa
bilit
ies r
egar
ding
su
ch th
ings
as
nutr
itio
n, c
lean
lines
s, a
nd h
ouse
hold
act
ivit
ies.
Phys
ical
Th
erap
ist
Assi
stan
ts
ass
ist p
hysi
cal t
hera
pist
s in
prov
idin
g ph
ysic
al th
erap
y tr
eatm
ents
and
pro
cedu
res.
M
ay, i
n ac
cord
ance
with
Sta
te la
ws,
ass
ist i
n th
e de
velo
pmen
t of t
reat
men
t pla
ns,
carr
y out
rout
ine f
unct
ions
, doc
umen
t the
pro
gres
s of t
reat
men
t, an
d m
odif
y spe
cific
tr
eatm
ents
in a
ccor
danc
e w
ith p
atie
nt s
tatu
s an
d w
ithin
the
sco
pe o
f tre
atm
ent
plan
s est
ablis
hed
by a
phy
sica
l the
rapi
st. g
ener
ally
requ
ires
form
al tr
aini
ng.
Phys
ical
Th
erap
ists
a
sses
s, p
lan,
org
aniz
e, a
nd p
arti
cipa
te in
reha
bilit
ativ
e pr
ogra
ms t
hat i
mpr
ove
mob
ility
, rel
ieve
pai
n, i
ncre
ase
stre
ngth
, and
im
prov
e or
cor
rect
dis
ablin
g co
ndit
ions
resu
ltin
g fr
om d
isea
se o
r in
jury
.

47N
IU C
ente
r fo
r G
over
nm
enta
l Stu
die
s
Prom
otin
g R
egio
nal P
rosp
erit
y in
Nor
thw
est I
llino
is
app
endi
x C
Phys
icia
n A
ssis
tan
ts
Prov
ide
heal
thca
re s
ervi
ces
typi
cally
per
form
ed b
y a
phys
icia
n, u
nder
the
su
perv
isio
n of
a p
hysi
cian
. con
duct
com
plet
e ph
ysic
als,
pro
vide
trea
tmen
t, a
nd
coun
sel p
atie
nts.
May
, in
som
e ca
ses,
pre
scri
be m
edic
atio
n. M
ust g
radu
ate
from
an
acc
redi
ted
educ
atio
nal p
rogr
am fo
r phy
sici
an a
ssis
tant
s. e
xclu
des e
mer
genc
y M
edic
al T
echn
icia
ns a
nd P
aram
edic
s, M
edic
al a
ssis
tant
s, r
egis
tere
d N
urse
s,
Nur
se a
nest
heti
sts,
Nur
se M
idw
ives
, and
Nur
se P
ract
itio
ners
.
Rad
iati
on
Th
erap
ists
Pr
ovid
e ra
diat
ion
ther
apy
to p
atie
nts a
s pre
scri
bed
by a
radi
olog
ist a
ccor
ding
to
esta
blis
hed
prac
tice
s and
stan
dard
s. d
utie
s may
incl
ude
revi
ewin
g pr
escr
ipti
on
and
diag
nosi
s; a
ctin
g as
liai
son
wit
h ph
ysic
ian
and
supp
orti
ve c
are
pers
onne
l; pr
epar
ing
equi
pmen
t, su
ch a
s im
mob
iliza
tion
, tre
atm
ent,
and
prot
ecti
on d
evic
es;
and
mai
ntai
ning
reco
rds,
repo
rts,
and
file
s. M
ay a
ssis
t in
dosi
met
ry p
roce
dure
s an
d tu
mor
loca
lizat
ion.
Recr
eati
on
al T
her
apis
ts
Plan
, dir
ect,
or c
oord
inat
e m
edic
ally
-app
rove
d re
crea
tion
pro
gram
s for
pat
ient
s in
hos
pita
ls, n
ursi
ng h
omes
, or o
ther
inst
itut
ions
. act
ivit
ies i
nclu
de sp
orts
, tri
ps,
dram
atic
s, s
ocia
l act
ivit
ies,
and
art
s an
d cr
afts
. May
ass
ess
a pa
tien
t con
diti
on
and
reco
mm
end
appr
opri
ate
recr
eati
onal
act
ivit
y. e
xclu
des r
ecre
atio
n w
orke
rs.
Regi
ster
ed N
urs
es
ass
ess p
atie
nt h
ealt
h pr
oble
ms a
nd n
eeds
, dev
elop
and
impl
emen
t nur
sing
care
pl
ans,
and
mai
ntai
n m
edic
al r
ecor
ds. a
dmin
iste
r nu
rsin
g ca
re t
o ill
, inj
ured
, co
nval
esce
nt, o
r dis
able
d pa
tien
ts. M
ay a
dvis
e pa
tien
ts o
n he
alth
mai
nten
ance
an
d di
seas
e pr
even
tion
or p
rovi
de c
ase
man
agem
ent.
lic
ensi
ng o
r reg
istr
atio
n re
quir
ed. i
nclu
des c
linic
al N
urse
Spe
cial
ists
. exc
lude
s Nur
se a
nest
heti
sts,
Nur
se
Mid
wiv
es, a
nd N
urse
Pra
ctit
ione
rs.
Resp
irat
ory
Th
erap
ists
a
sses
s, t
reat
, and
car
e fo
r pa
tien
ts w
ith
brea
thin
g di
sord
ers.
ass
ume
prim
ary
resp
onsi
bilit
y fo
r al
l res
pira
tory
car
e m
odal
itie
s, in
clud
ing
the
supe
rvis
ion
of
resp
irat
ory
ther
apy
tech
nici
ans.
ini
tiat
e an
d co
nduc
t th
erap
euti
c pr
oced
ures
; m
aint
ain
pati
ent r
ecor
ds; a
nd s
elec
t, a
ssem
ble,
che
ck, a
nd o
pera
te e
quip
men
t.
Surg
ical
Tec
hn
olo
gist
s a
ssis
t in
ope
rati
ons,
und
er t
he s
uper
visi
on o
f su
rgeo
ns, r
egis
tere
d nu
rses
, or
othe
r sur
gica
l per
sonn
el. M
ay h
elp
set u
p op
erat
ing
room
, pre
pare
and
tran
spor
t pa
tien
ts fo
r su
rger
y, a
djus
t lig
hts
and
equi
pmen
t, p
ass
inst
rum
ents
and
oth
er
supp
lies
to s
urge
ons
and
surg
eon’
s as
sist
ants
, hol
d re
trac
tors
, cut
sut
ures
, and
he
lp c
ount
spo
nges
, nee
dles
, sup
plie
s, a
nd in
stru
men
ts.

48N
IU C
ente
r fo
r G
over
nm
enta
l Stu
die
s
Prom
otin
g R
egio
nal P
rosp
erit
y in
Nor
thw
est I
llino
is
app
endi
x C
Com
mun
ity
and
Soci
al S
ervi
ce O
ccup
atio
n W
age
Dat
a
Com
mu
nit
y an
d So
cial
Ser
vice
Occ
upa
tio
ns
Nat
’l
Avg.
W
age
IL A
vg.
Wag
e
5-Ct
y Av
g.
Wag
e
5-Ct
y %
o
f St
ate
Avg.
5-Ct
y %
o
f N
at’l
Av
g.
5-Ct
y M
in.
Wag
e
5-Ct
y M
ax.
Wag
e
IL
Med
ian
W
age
5-Ct
y M
edia
n
Wag
e
Hea
lth
care
So
cial
Wo
rker
s$5
0,50
0$5
0,34
0$4
3,57
187
%86
%$3
4,28
6$5
2,85
7$4
9,42
0$4
0,00
0
Men
tal
Hea
lth
Co
un
selo
rs42
,590
41,5
3035
,000
8482
25,0
0045
,000
35,7
4035
,000
Reh
abil
itat
ion
Co
un
selo
rs37
,070
35,2
2030
,000
8581
20,0
0040
,000
33,4
4030
,000
Soci
al a
nd
Hu
man
Ser
vice
Ass
ista
nts
30,7
1030
,410
30,0
0099
9820
,000
40,0
0027
,110
25,0
00
Subs
tan
ce A
buse
an
d Be
hav
iora
l Di
sord
er
Cou
nse
lors
41,0
3039
,970
40,0
0010
097
30,0
0050
,000
38,0
6040
,000
Cate
gory
Ave
rage
40,3
8039
,494
35,7
1491
8925
,857
45,5
7136
,754
34,0
00
Dat
a So
urce
s: CG
S 5-
coun
ty W
age
and
Bene
fit S
urve
y, 2
011;
Sta
te a
nd N
atio
nal a
vera
ges a
re fr
om B
urea
u of
Lab
or a
nd S
tatis
tics O
ES d
atas
et, 2
011.
Not
e: A
ll w
age
data
are
ann
ual.

49N
IU C
ente
r fo
r G
over
nm
enta
l Stu
die
s
Prom
otin
g R
egio
nal P
rosp
erit
y in
Nor
thw
est I
llino
is
app
endi
x C
comm
unity
And s
ociAl
serv
ices o
ccuP
Ation
desc
riPtio
nsH
ealt
hca
re S
oci
al W
ork
ers
Prov
ide i
ndiv
idua
ls, f
amili
es, a
nd g
roup
s wit
h th
e psy
chos
ocia
l sup
port
nee
ded
to
cope
with
chro
nic,
acut
e, o
r ter
min
al il
lnes
ses.
Ser
vice
s inc
lude
advi
sing
fam
ily ca
re
give
rs, p
rovi
ding
pat
ient
educ
atio
n an
d co
unse
ling,
and
mak
ing
refe
rral
s for
oth
er
serv
ices
. May
als
o pr
ovid
e ca
re a
nd c
ase
man
agem
ent o
r int
erve
ntio
ns d
esig
ned
to p
rom
ote
heal
th, p
reve
nt d
isea
se, a
nd a
ddre
ss b
arri
ers
to a
cces
s to
hea
lthc
are.
Men
tal
Hea
lth
Co
un
selo
rs
coun
sel w
ith
emph
asis
on
prev
enti
on. w
ork
wit
h in
divi
dual
s an
d gr
oups
to
prom
ote
opti
mum
men
tal a
nd e
mot
iona
l hea
lth.
May
hel
p in
divi
dual
s dea
l wit
h is
sues
ass
ocia
ted
wit
h ad
dict
ions
and
sub
stan
ce a
buse
; fam
ily, p
aren
ting
, and
m
arit
al p
robl
ems;
str
ess
man
agem
ent;
sel
f-es
teem
; and
agi
ng. e
xclu
des
Soci
al
wor
kers
, Psy
chia
tris
ts, a
nd P
sych
olog
ists
.
Reh
abil
itat
ion
Co
un
selo
rs
coun
sel i
ndiv
idua
ls to
max
imiz
e th
e in
depe
nden
ce a
nd e
mpl
oyab
ility
of p
erso
ns
copi
ng w
ith
pers
onal
, soc
ial,
and
voca
tion
al d
ifficu
ltie
s th
at r
esul
t fr
om b
irth
de
fect
s, il
lnes
s, d
isea
se, a
ccid
ents
, or t
he st
ress
of d
aily
life
. coo
rdin
ate
acti
viti
es
for r
esid
ents
of c
are
and
trea
tmen
t fac
iliti
es. a
sses
s clie
nt n
eeds
and
des
ign
and
impl
emen
t re
habi
litat
ion
prog
ram
s th
at m
ay in
clud
e pe
rson
al a
nd v
ocat
iona
l co
unse
ling,
tra
inin
g, a
nd jo
b pl
acem
ent.
Soci
al a
nd
Hu
man
Ser
vice
Ass
ista
nts
a
ssis
t in
pro
vidi
ng c
lient
ser
vice
s in
a w
ide
vari
ety
of fi
elds
, suc
h as
psy
chol
ogy,
re
habi
litat
ion,
or s
ocia
l wor
k, in
clud
ing
supp
ort f
or fa
mili
es. M
ay a
ssis
t clie
nts
in
iden
tify
ing
and
obta
inin
g av
aila
ble
bene
fits
and
soci
al a
nd c
omm
unit
y se
rvic
es.
May
ass
ist s
ocia
l wor
kers
with
dev
elop
ing,
org
aniz
ing,
and
con
duct
ing
prog
ram
s to
pre
vent
and
reso
lve
prob
lem
s rel
evan
t to
subs
tanc
e ab
use,
hum
an re
lati
onsh
ips,
re
habi
litat
ion,
or d
epen
dent
car
e. e
xclu
des r
ehab
ilita
tion
cou
nsel
ors,
Psy
chia
tric
Te
chni
cian
s, Pe
rson
al c
are a
ides
, and
elig
ibili
ty in
terv
iew
ers,
gov
ernm
ent P
rogr
ams
Subs
tan
ce A
buse
an
d B
ehav
ior
al D
iso
rder
Co
un
selo
rsco
unse
l and
adv
ise
indi
vidu
als
wit
h al
coho
l, to
bacc
o, d
rug,
or
othe
r pr
oble
ms,
su
ch a
s ga
mbl
ing
and
eati
ng d
isor
ders
. May
cou
nsel
indi
vidu
als,
fam
ilies
, or
grou
ps o
r eng
age
in p
reve
ntio
n pr
ogra
ms.
exc
lude
s Soc
ial w
orke
rs, P
sych
olog
ists
, an
d M
enta
l hea
lth
coun
selo
rs p
rovi
ding
the
se s
ervi
ces.

50N
IU C
ente
r fo
r G
over
nm
enta
l Stu
die
s
Prom
otin
g R
egio
nal P
rosp
erit
y in
Nor
thw
est I
llino
is
app
endi
x C
Bui
ldin
g an
d G
roun
ds C
lean
ing
and
Mai
nten
ance
, Pro
tect
ive
Serv
ice
Occ
upat
ion
Wag
e D
ata
Buil
din
g an
d Gr
ou
nds
Occ
upa
tio
ns
Nat
’l
Avg.
W
age
IL A
vg.
Wag
e
5-Ct
y Av
g.
Wag
e
5-Ct
y %
o
f St
ate
Avg.
5-Ct
y %
o
f N
at’l
Av
g.
5-Ct
y M
in.
Wag
e
5-Ct
y M
ax.
Wag
e
IL
Med
ian
W
age
5-Ct
y M
edia
n
Wag
eJa
nit
ors
an
d Cl
ean
ers,
Exc
ept
Mai
d/H
ous
ekee
per
$24,
840
$25,
930
$25,
714
99%
104%
$18,
276
$33,
448
$23,
020
$20,
000
Secu
rity
Gua
rds
27,0
4025
,440
28,0
0011
010
420
,000
36,0
0023
,050
25,0
00
Cate
gory
Ave
rage
25,9
4025
,685
26,8
5710
510
419
,138
34,7
2423
,035
22,5
00
Dat
a So
urce
s: CG
S 5-
coun
ty W
age
and
Bene
fit S
urve
y, 2
011;
Sta
te a
nd N
atio
nal a
vera
ges a
re fr
om B
urea
u of
Lab
or a
nd S
tatis
tics O
ES d
atas
et, 2
011.
Not
e: A
ll w
age
data
are
ann
ual.

51N
IU C
ente
r fo
r G
over
nm
enta
l Stu
die
s
Prom
otin
g R
egio
nal P
rosp
erit
y in
Nor
thw
est I
llino
is
app
endi
x C
build
ing An
d gro
unds
, cle
Aning
And m
Ainte
nAnc
e, Pr
otec
tive s
ervic
e occ
uPAt
ion de
scriP
tions
Jan
ito
rs a
nd
Cle
aner
s, e
xcep
t M
aid/
Ho
usek
eepe
r K
eep
build
ings
in c
lean
and
ord
erly
con
diti
on. P
erfo
rm h
eavy
cle
anin
g du
ties
, su
ch a
s cle
anin
g flo
ors,
sham
pooi
ng ru
gs, w
ashi
ng w
alls
and
gla
ss, a
nd re
mov
ing
rubb
ish.
dut
ies
may
incl
ude
tend
ing
furn
ace
and
boile
r, pe
rfor
min
g ro
utin
e m
aint
enan
ce a
ctiv
itie
s, n
otif
ying
man
agem
ent o
f nee
d fo
r rep
airs
, and
cle
anin
g sn
ow o
r de
bris
from
sid
ewal
k.
Secu
rity
Gua
rds
gua
rd, p
atro
l, or
mon
itor
pre
mis
es to
pre
vent
thef
t, v
iole
nce,
or i
nfra
ctio
ns o
f ru
les.
May
ope
rate
x-r
ay a
nd m
etal
det
ecto
r equ
ipm
ent.
excl
udes
Tra
nspo
rtat
ion
Secu
rity
Scr
eene
rs.
52N
IU C
ente
r fo
r G
over
nm
enta
l Stu
die
s
Prom
otin
g R
egio
nal P
rosp
erit
y in
Nor
thw
est I
llino
is
app
endi
x C
Offi
ce a
nd A
dmin
istr
ativ
e Su
ppor
t O
ccup
atio
n W
age
Dat
a
Off
ice
and
Adm
inis
trat
ive
Occ
upa
tio
ns
Nat
’l
Avg.
W
age
IL A
vg.
Wag
e
5-Ct
y Av
g.
Wag
e
5-Ct
y %
o
f St
ate
Avg.
5-Ct
y %
o
f N
at’l
Av
g.
5-Ct
y M
in.
Wag
e
5-Ct
y M
ax.
Wag
e
IL
Med
ian
W
age
5-Ct
y M
edia
n
Wag
e
Boo
kkee
pin
g, A
cco
un
tin
g, a
nd
Audi
tin
g Cl
erks
$36,
120
$36,
330
$33,
913
93%
94%
$25,
789
$42,
632
$34,
490
$30,
000
Com
pute
r O
pera
tors
39,2
8042
,860
38,3
3389
9830
,000
42,8
5742
,170
40,0
00
Cust
om
er S
ervi
ce R
epre
sen
tati
ves
33,1
2034
,890
35,0
0010
010
625
,455
44,5
4532
,700
30,0
00
Data
En
try
Ope
rato
r29
,010
30,9
4029
,000
9410
020
,000
38,0
0027
,810
25,0
00
Exec
uti
ve S
ecre
tari
es a
nd
Adm
inis
trat
ive
Assi
stan
ts48
,120
46,6
8039
,737
8583
30,0
0050
,952
43,1
8040
,000
Firs
t-Li
ne
Supe
rvis
ors
of
Off
ice
and
Ad
min
istr
ativ
e Su
ppo
rt W
ork
ers
52,3
3053
,440
51,0
7196
9835
,625
63,1
2548
,920
50,0
00
Gen
eral
Cle
rk28
,920
29,7
5030
,000
101
104
22,5
0037
,500
27,5
3030
,000
Off
ice
and
Adm
inis
trat
ive
Supp
ort
Wo
rker
s,
All
Oth
ers
33,4
2035
,450
32,3
0891
9723
,750
40,5
8834
,210
30,0
00
Payr
oll
Cle
rk38
,080
39,2
6038
,974
9910
231
,429
46,3
6437
,860
40,0
00
Pro
duct
ion
Sch
edu
lers
an
d Ex
pedi
ters
44,9
0044
,990
41,0
0091
9131
,667
50,8
3342
,660
40,0
00
Rece
ptio
nis
ts a
nd
Info
rmat
ion
Cle
rks
26,7
3027
,180
28,3
3310
410
620
,741
35,7
6925
,800
30,0
00
Secr
etar
ies,
Adm
inis
trat
ive
Assi
stan
t33
,020
32,9
5028
,750
8787
21,3
6435
,714
30,4
6030
,000
Ship
pin
g Re
ceiv
ing
and
Traf
fic
Cler
ks30
,480
30,7
6031
,400
102
103
23,2
0039
,600
29,4
3030
,000
Sto
ck C
lerk
s an
d O
rder
Fil
lers
24,2
5024
,110
25,0
0010
410
321
,667
33,3
3320
,380
30,0
00
Cate
gory
Ave
rage
35,5
5636
,399
34,4
8796
9825
,942
42,9
8734
,114
33,9
29
Dat
a So
urce
s: CG
S 5-
coun
ty W
age
and
Bene
fit S
urve
y, 2
011;
Sta
te a
nd N
atio
nal a
vera
ges a
re fr
om B
urea
u of
Lab
or a
nd S
tatis
tics O
ES d
atas
et, 2
011.
Not
e: A
ll w
age
data
are
ann
ual.

53N
IU C
ente
r fo
r G
over
nm
enta
l Stu
die
s
Prom
otin
g R
egio
nal P
rosp
erit
y in
Nor
thw
est I
llino
is
app
endi
x C
offic
e And
Admi
nist
rAtiv
e suP
Port
occu
PAtio
n des
criPt
ions
Boo
kk
eepi
ng,
Acc
ou
nti
ng,
an
d A
udi
tin
g Cl
erk
s co
mpu
te, c
lass
ify,
and
reco
rd n
umer
ical
dat
a to
kee
p fin
anci
al re
cord
s com
plet
e.
Perf
orm
any
com
bina
tion
of r
outi
ne ca
lcul
atin
g, p
osti
ng, a
nd v
erif
ying
dut
ies t
o ob
tain
pri
mar
y fin
anci
al d
ata
for u
se in
mai
ntai
ning
acc
ount
ing
reco
rds.
May
als
o ch
eck
the
accu
racy
of fi
gure
s, c
alcu
lati
ons,
and
pos
ting
s per
tain
ing
to b
usin
ess
tran
sact
ions
reco
rded
by
othe
r wor
kers
. exc
lude
s Pay
roll
and
Tim
ekee
ping
cle
rks.
Com
pute
r O
per
ato
rs
Mon
itor a
nd co
ntro
l ele
ctro
nic c
ompu
ter a
nd p
erip
hera
l ele
ctro
nic d
ata
proc
essi
ng
equi
pmen
t to
proc
ess b
usin
ess,
scie
ntifi
c, e
ngin
eeri
ng, a
nd o
ther
dat
a ac
cord
ing
to o
pera
ting
inst
ruct
ions
. Mon
itor a
nd re
spon
d to
ope
rati
ng a
nd e
rror
mes
sage
s.
May
ent
er co
mm
ands
at a
com
pute
r ter
min
al a
nd se
t con
trol
s on
com
pute
r and
pe
riph
eral
dev
ices
. exc
lude
s co
mpu
ter
occ
upat
ions
and
dat
a en
try
Key
ers.
Cust
om
er S
ervi
ce R
epre
sen
tati
ves
inte
ract
wit
h cu
stom
ers
to p
rovi
de in
form
atio
n in
resp
onse
to in
quir
ies
abou
t pr
oduc
ts a
nd se
rvic
es a
nd to
han
dle
and
reso
lve
com
plai
nts.
exc
lude
s ind
ivid
uals
w
hose
dut
ies
are
prim
arily
inst
alla
tion
, sal
es, o
r re
pair
.
Data
En
try
and
Info
rmat
ion
Pro
cess
ing
Wo
rker
s
Data
En
try
Ope
rat
or
ope
rate
dat
a en
try
devi
ce, s
uch
as k
eybo
ard
or p
hoto
com
posi
ng p
erfo
rato
r. d
utie
s m
ay in
clud
e ve
rify
ing
data
and
pre
pari
ng m
ater
ials
for
pri
ntin
g. u
se
wor
d pr
oces
sor,
com
pute
r or t
ypew
rite
r to
type
lett
ers,
repo
rts,
form
s, o
r oth
er
mat
eria
l fro
m ro
ugh
draf
t, co
rrec
ted
copy
, or v
oice
reco
rdin
g. M
ay p
erfo
rm o
ther
cl
eric
al d
utie
s as
ass
igne
d.
Exec
uti
ve S
ecre
tari
es a
nd
Adm
in A
ssis
tan
ts
Prov
ide
high
-leve
l adm
inis
trat
ive
supp
ort
by c
ondu
ctin
g re
sear
ch, p
repa
ring
st
atis
tica
l rep
orts
, han
dlin
g in
form
atio
n re
ques
ts, a
nd p
erfo
rmin
g cl
eric
al
func
tion
s su
ch a
s pr
epar
ing
corr
espo
nden
ce, r
ecei
ving
vis
itor
s, a
rran
ging
co
nfer
ence
cal
ls, a
nd s
ched
ulin
g m
eeti
ngs.
May
als
o tr
ain
and
supe
rvis
e lo
wer
-le
vel c
leri
cal s
taff
. exc
lude
s Se
cret
arie
s.
Firs
t-Li
ne
Supe
rvis
ors
of
Off
ice
and
Adm
inis
trat
ive
Supp
ort
Wo
rker
s Se
ll go
ods f
or w
hole
sale
rs o
r man
ufac
ture
rs to
bus
ines
ses o
r gro
ups o
f ind
ivid
uals
. w
ork
requ
ires
sub
stan
tial
kno
wle
dge
of it
ems
sold
.
Gen
eral
Cle
rk
Perf
orm
dut
ies t
oo v
arie
d an
d di
vers
e to
be
clas
sifie
d in
any
spec
ific o
ffice
cler
ical
oc
cupa
tion
, req
uiri
ng k
now
ledg
e of
offi
ce s
yste
ms
and
proc
edur
es. c
leri
cal
duti
es m
ay b
e as
sign
ed in
acc
orda
nce
wit
h th
e offi
ce p
roce
dure
s of
indi
vidu
al
esta
blis
hmen
ts a
nd m
ay i
nclu
de a
com
bin
atio
n of
an
swer
ing
tele
phon
es,
book
keep
ing,
typi
ng o
r wor
d pr
oces
sing
, ste
nogr
aphy
, offi
ce m
achi
ne o
pera
tion
, an
d fil
ing.
Off
ice
and
Adm
in S
upp
ort
Wo
rker
s, A
ll O
ther
all
office
and
adm
inis
trat
ive
supp
ort w
orke
rs n
ot li
sted
sep
arat
ely.
Payr
oll
Cle
rk
com
pile
and
rec
ord
empl
oyee
tim
e an
d pa
yrol
l dat
a. M
ay c
ompu
te e
mpl
oyee
s’
tim
e w
orke
d, p
rodu
ctio
n, a
nd c
omm
issi
on. M
ay c
ompu
te a
nd p
ost
wag
es a
nd
dedu
ctio
ns, o
r pr
epar
e pa
yche
cks.
exc
lude
s b
ookk
eepi
ng, a
ccou
ntin
g, a
nd
aud
itin
g c
lerk
s.
Pro
duct
ion
Sch
edu
lers
an
d E
xped
iter
s co
ordi
nate
and
exp
edit
e th
e flo
w o
f w
ork
and
mat
eria
ls w
ithi
n or
bet
wee
n de
part
men
ts o
f an
est
ablis
hmen
t ac
cord
ing
to p
rodu
ctio
n sc
hedu
le. d
utie
s in
clud
e re
view
ing
and
dist
ribu
ting
pro
duct
ion,
wor
k, a
nd s
hipm
ent s
ched
ules
; co
nfer
ring
wit
h de
part
men
t su
perv
isor
s to
det
erm
ine
prog
ress
of
wor
k an
d co
mpl
etio
n da
tes;
and
com
pilin
g re
port
s on
pro
gres
s of
wor
k, in
vent
ory
leve
ls,
cost
s, a
nd p
rodu
ctio
n pr
oble
ms.
exc
lude
s w
eigh
ers,
Mea
sure
rs, c
heck
ers,
and
Sa
mpl
ers,
rec
ordk
eepi
ng.

54N
IU C
ente
r fo
r G
over
nm
enta
l Stu
die
s
Prom
otin
g R
egio
nal P
rosp
erit
y in
Nor
thw
est I
llino
is
app
endi
x C
Rece
ptio
nis
ts a
nd
Info
rmat
ion
Cle
rks
ans
wer
inqu
irie
s and
pro
vide
info
rmat
ion
to th
e gen
eral
pub
lic, c
usto
mer
s, v
isito
rs,
and
othe
r in
tere
sted
par
ties
reg
ardi
ng a
ctiv
itie
s co
nduc
ted
at e
stab
lishm
ent
and
loca
tion
of
depa
rtm
ents
, offi
ces,
and
em
ploy
ees
wit
hin
the
orga
niza
tion
. ex
clud
es S
wit
chbo
ard
ope
rato
rs, i
nclu
ding
ans
wer
ing
Serv
ice.
Secr
etar
ies,
Adm
inis
trat
ive
Assi
stan
t Pe
rfor
m r
outi
ne c
leri
cal
and
adm
inis
trat
ive
func
tion
s su
ch a
s dr
afti
ng
corr
espo
nden
ce, s
ched
ulin
g ap
poin
tmen
ts, o
rgan
izin
g an
d m
aint
aini
ng p
aper
an
d el
ectr
onic
file
s, o
r pro
vidi
ng in
form
atio
n to
calle
rs. e
xclu
des l
egal
, med
ical
, an
d ex
ecut
ive
secr
etar
ies.
Ship
pin
g Re
ceiv
ing
and
Tr
affi
c Cl
erk
s Ve
rify
and
mai
ntai
n re
cord
s on
inco
min
g an
d ou
tgoi
ng sh
ipm
ents
. Pre
pare
item
s fo
r sh
ipm
ent.
dut
ies
incl
ude
asse
mbl
ing,
add
ress
ing,
sta
mpi
ng, a
nd s
hipp
ing
mer
chan
dise
or m
ater
ial;
rece
ivin
g, u
npac
king
, ver
ifyi
ng a
nd re
cord
ing
inco
min
g m
erch
andi
se o
r m
ater
ial;
and
arra
ngin
g fo
r th
e tr
ansp
orta
tion
of
prod
ucts
. ex
clud
es S
tock
cle
rks
and
ord
er F
iller
s an
d w
eigh
ers,
Mea
sure
rs, c
heck
ers,
an
d Sa
mpl
ers,
rec
ordk
eepi
ng.
Sto
ck C
lerk
s an
d O
rder
Fil
lers
r
ecei
ve, s
tore
, and
issu
e sa
les
floor
mer
chan
dise
, mat
eria
ls, e
quip
men
t, a
nd
othe
r it
ems
from
sto
ckro
om, w
areh
ouse
, or
stor
age
yard
to
fill s
helv
es, r
acks
, ta
bles
, or c
usto
mer
s’ o
rder
s. M
ay m
ark
pric
es o
n m
erch
andi
se a
nd s
et u
p sa
les
disp
lays
. exc
lude
s lab
orer
s and
Fre
ight
, Sto
ck, a
nd M
ater
ial M
over
s, h
and,
and
Sh
ippi
ng, r
ecei
ving
, and
Tra
ffic
cle
rks.

55N
IU C
ente
r fo
r G
over
nm
enta
l Stu
die
s
Prom
otin
g R
egio
nal P
rosp
erit
y in
Nor
thw
est I
llino
is
app
endi
x C
Agr
icul
ture
and
Far
min
g O
ccup
atio
n W
age
Dat
a
Farm
Occ
upa
tio
ns
Nat
’l A
vg.
Wag
eIL
Avg
. W
age
5-Ct
y Av
g.
Wag
e
5-Ct
y %
o
f St
ate
Avg.
5-Ct
y %
o
f N
at’l
Av
g.
5-Ct
y M
in.
Wag
e
5-Ct
y M
ax.
Wag
e
IL
Med
ian
W
age
5-Ct
y M
edia
n
Wag
e
Agri
cult
ura
l Eq
uip
men
t O
pera
tors
$26,
830
$33,
370
$42,
500
127%
158%
$32,
500
$52,
500
$30,
030
$40,
000
Farm
Wo
rker
s/La
bore
rs20
,020
24,3
8032
,500
133
162
25,0
0040
,000
25,3
2035
,000
Firs
t-Li
ne
Supe
rvis
ors
of
Farm
ing,
Fis
hin
g,
and
Fore
stry
Wo
rker
s45
,690
48,4
1050
,000
103
109
45,0
0055
,000
50,5
9050
,000
Cate
gory
Ave
rage
30,8
4735
,387
41,6
6712
114
334
,167
49,1
6735
,313
41,6
67
Dat
a So
urce
s: CG
S 5-
Coun
ty W
age
and
Bene
fit S
urve
y, 2
011;
Sta
te a
nd N
atio
nal a
vera
ges a
re fr
om B
urea
u of
Lab
or a
nd S
tatis
tics O
ES d
atas
et, 2
011.
Not
e: A
ll w
age
data
are
ann
ual.

56N
IU C
ente
r fo
r G
over
nm
enta
l Stu
die
s
Prom
otin
g R
egio
nal P
rosp
erit
y in
Nor
thw
est I
llino
is
app
endi
x C
Agric
ultu
re An
d fAr
ming
occu
PAtio
n des
criPt
ions
Agri
cult
ur
al E
qu
ipm
ent
Ope
rat
ors
d
rive
and
cont
rol f
arm
equ
ipm
ent t
o ti
ll so
il an
d to
pla
nt, c
ulti
vate
, and
har
vest
cr
ops.
May
per
form
tas
ks, s
uch
as c
rop
balin
g or
hay
buc
king
. May
ope
rate
st
atio
nary
equ
ipm
ent t
o pe
rfor
m p
ost-
harv
est t
asks
, suc
h as
hus
king
, she
lling
, th
resh
ing,
and
gin
ning
.
Farm
Wo
rker
s/La
bore
rsM
anua
lly p
lant
, cul
tiva
te, a
nd h
arve
st v
eget
able
s, f
ruit
s, n
uts,
hor
ticu
ltur
al
spec
ialt
ies,
and
fiel
d cr
ops.
use
han
d to
ols,
suc
h as
sho
vels
, tro
wel
s, h
oes,
ta
mpe
rs, p
runi
ng h
ooks
, she
ars,
and
kni
ves.
dut
ies
may
incl
ude
tilli
ng s
oil
and
appl
ying
fer
tiliz
ers;
tra
nspl
anti
ng, w
eedi
ng, t
hinn
ing,
or
prun
ing
crop
s;
appl
ying
pes
tici
des;
or c
lean
ing,
gra
ding
, sor
ting
, pac
king
, and
load
ing
harv
este
d pr
oduc
ts. M
ay co
nstr
uct t
relli
ses,
repa
ir fe
nces
and
farm
bui
ldin
gs, o
r par
tici
pate
in
irri
gati
on a
ctiv
itie
s. e
xclu
des g
rade
rs a
nd S
orte
rs, a
gric
ultu
ral P
rodu
cts
and
Fore
st, c
onse
rvat
ion,
and
log
ging
wor
kers
.
Firs
t-Li
ne
Supe
rvis
ors
of
Farm
ing,
Fis
hin
g,
and
Fo
rest
ry W
ork
ers
dir
ectl
y su
perv
ise
and
coor
din
ate
the
acti
viti
es o
f ag
ricu
ltur
al,
fore
stry
, aq
uacu
ltura
l, an
d re
late
d w
orke
rs. e
xclu
des F
irst
-lin
e Sup
ervi
sors
of l
ands
capi
ng,
law
n Se
rvic
e, a
nd g
roun
dske
epin
g w
orke
rs.

57N
IU C
ente
r fo
r G
over
nm
enta
l Stu
die
s
Prom
otin
g R
egio
nal P
rosp
erit
y in
Nor
thw
est I
llino
is
app
endi
x C
Cons
truc
tion
, Pro
duct
ion,
and
Mai
nten
ance
Occ
upat
ion
Wag
e D
ata
Con
stru
ctio
n, P
rodu
ctio
n, a
nd
M
ain
ten
ance
Occ
upa
tio
ns
Nat
’l
Avg.
W
age
IL A
vg.
Wag
e
5-Ct
y Av
g.
Wag
e
5-Ct
y %
o
f St
ate
Avg.
5-Ct
y %
o
f N
at’l
Av
g.
5-Ct
y M
in.
Wag
e
5-Ct
y M
ax.
Wag
e
IL
Med
ian
W
age
5-Ct
y M
edia
n
Wag
e
Asse
mbl
ers
and
Fabr
icat
ors
, All
Oth
er$2
9,45
0$2
8,35
0$3
6,66
712
9%12
5%$2
5,71
4$4
5,71
4$2
5,71
0$3
5,00
0
CNC
Pro
gram
mer
s48
,460
41,8
3041
,667
100
8631
,818
49,1
6738
,250
40,0
00
Com
pute
r Ai
ded
Desi
gn (C
.A.D
.) O
pera
tor
50,1
6049
,720
45,0
0091
9036
,667
53,3
3345
,690
40,0
00
Dril
ling
an
d Bo
ring
Mac
hin
e To
ol S
ette
rs,
Oper
ator
s, a
nd
Ten
ders
, Met
al a
nd
Plas
tic
35,4
1034
,360
28,7
5084
8122
,000
36,0
0031
,770
30,0
00
Elec
tric
/Ele
ctro
nic
Equ
ipm
ent
Asse
mbl
ers
31,2
9031
,990
45,0
0014
114
430
,000
60,0
0033
,890
45,0
00
Elec
tric
ian
52,9
1070
,430
55,0
0078
104
42,0
0063
,000
70,5
1050
,000
Firs
t-Li
ne
Supe
rvis
ors
of
Con
stru
ctio
n
Trad
es a
nd
Extr
acti
on
Wo
rker
s62
,910
76,0
5072
,000
9511
456
,000
88,0
0074
,290
65,0
00
Firs
t-Li
ne
Supe
rvis
ors
of
Mec
han
ics,
In
stal
lers
, an
d Re
pair
ers
62,1
9063
,120
60,6
2596
9748
,889
71,1
1162
,600
55,0
00
Firs
t-Li
ne
Supe
rvis
ors
of
Pro
duct
ion
an
d
Ope
rati
ng
Wo
rker
s56
,890
59,7
9053
,333
8994
39,4
7464
,737
57,0
6050
,000
Grin
din
g, L
appi
ng,
Po
lish
ing,
an
d Bu
ffin
g M
ach
ine
Too
l Se
tter
s, O
pera
tors
, an
d
Ten
ders
, Met
al a
nd
Plas
tic
32,8
4035
,610
38,7
5010
911
825
,000
45,0
0032
,410
35,0
00
Hel
pers
--Pr
odu
ctio
n W
ork
ers
24,3
7024
,470
29,1
6711
912
020
,000
38,3
3321
,430
30,0
00
Indu
stri
al M
ach
iner
y M
ech
anic
s48
,030
50,1
9051
,429
102
107
40,0
0062
,857
47,0
3050
,000
Insp
ecto
r - P
reci
sio
n36
,690
37,5
9038
,125
101
104
28,7
5047
,500
33,7
9040
,000
Lath
e an
d Tu
rnin
g M
ach
ine
Tool
Set
ters
, Op
erat
ors,
an
d Te
nde
rs, M
etal
an
d Pl
asti
c37
,210
40,3
0041
,250
102
111
34,0
0050
,000
37,9
8040
,000
Mac
hin
ist
- Mai
nte
nan
ce41
,110
50,2
3045
,833
9111
135
,000
56,6
6749
,920
40,0
00
Mac
hin
ists
40,5
2040
,080
45,0
0011
211
131
,429
54,2
8637
,400
40,0
00

58N
IU C
ente
r fo
r G
over
nm
enta
l Stu
die
s
Prom
otin
g R
egio
nal P
rosp
erit
y in
Nor
thw
est I
llino
is
app
endi
x C
Con
stru
ctio
n, P
rodu
ctio
n, a
nd
M
ain
ten
ance
Occ
upa
tio
ns
Nat
’l
Avg.
W
age
IL A
vg.
Wag
e
5-Ct
y Av
g.
Wag
e
5-Ct
y %
o
f St
ate
Avg.
5-Ct
y %
o
f N
at’l
Av
g.
5-Ct
y M
in.
Wag
e
5-Ct
y M
ax.
Wag
e
IL
Med
ian
W
age
5-Ct
y M
edia
n
Wag
e
Mai
nte
nan
ce W
ork
er -
Gen
eral
$36,
930
$40,
780
$41,
707
102%
113%
$32,
727
$50,
000
$38,
080
$40,
000
Mil
ling
an
d Pl
anin
g M
ach
ine
Sett
ers,
Op
erat
ors,
an
d Te
nde
rs, M
etal
an
d Pl
asti
c37
,510
40,7
3040
,000
9810
735
,000
40,0
0038
,930
40,0
00
Pack
agin
g/Fi
llin
g M
ach
Ope
rato
rs/
Ten
ders
27,9
5027
,670
31,6
6711
411
320
,000
43,3
3323
,710
25,0
00
Pro
duct
ion
Wo
rker
s, A
ll O
ther
30,6
7031
,590
36,4
7111
511
923
,529
49,4
1229
,380
30,0
00
Pun
ch P
ress
Ope
rato
r31
,140
31,3
6031
,667
101
102
23,7
5038
,750
28,6
2030
,000
Team
Ass
embl
ers
29,7
4029
,770
40,0
0013
413
420
,000
60,0
0026
,480
30,0
00
Wel
ders
Cu
tter
s So
lder
ers
and
Braz
ers
37,9
2037
,640
35,4
1794
9325
,000
45,3
8534
,100
30,0
00
Cate
gory
Ave
rage
40,1
0042
,333
42,8
0510
410
931
,598
52,7
2139
,958
39,5
65
Dat
a So
urce
s: C
GS
5-Co
unty
Wag
e an
d Be
nefit
Sur
vey,
201
1; S
tate
and
Nat
iona
l ave
rage
s are
from
Bur
eau
of L
abor
and
Sta
tist
ics O
ES d
atas
et, 2
011.
Not
e: A
ll w
age
data
are
ann
ual.

59N
IU C
ente
r fo
r G
over
nm
enta
l Stu
die
s
Prom
otin
g R
egio
nal P
rosp
erit
y in
Nor
thw
est I
llino
is
app
endi
x C
cons
truc
tion,
Prod
uctio
n, An
d mAin
tenA
nce o
ccuP
Ation
desc
riPtio
nsAs
sem
bler
s an
d F
abri
cato
rs, A
ll O
ther
a
ll as
sem
bler
s an
d fa
bric
ator
s no
t lis
ted
sepa
rate
ly.
CNC
Pro
gram
mer
s d
evel
op p
rogr
ams
to c
ontr
ol m
achi
ning
or
proc
essi
ng o
f met
al o
r pl
asti
c pa
rts
by a
utom
atic
mac
hine
tool
s, e
quip
men
t, o
r sy
stem
s.
Com
pute
r Ai
ded
Des
ign
(C.A
.D.)
Ope
rat
or
ope
rate
com
pute
r-co
ntro
lled
mac
hine
s or r
obot
s to
perf
orm
one
or m
ore
mac
hine
fu
ncti
ons
on m
etal
or
plas
tic
wor
k pi
eces
.
Dril
lin
g an
d B
ori
ng
Mac
hin
e To
ol
Sett
ers,
Ope
rat
ors
, an
d T
ende
rs, M
etal
an
d P
last
ic
Set u
p, o
pera
te, o
r ten
d dr
illin
g m
achi
nes t
o dr
ill, b
ore,
ream
, mill
, or c
ount
ersi
nk
met
al o
r pl
asti
c w
ork
piec
es.
Elec
tric
/Ele
ctro
nic
Eq
uip
men
t As
sem
bler
s a
ssem
ble
or m
odif
y el
ectr
ical
or
elec
tron
ic e
quip
men
t, s
uch
as c
ompu
ters
, tes
t eq
uipm
ent t
elem
eter
ing
syst
ems,
ele
ctri
c m
otor
s, a
nd b
atte
ries
.
Elec
tric
ian
Mai
nte
nan
cein
stal
l, m
aint
ain,
and
repa
ir e
lect
rica
l wir
ing,
equ
ipm
ent,
and
fixt
ures
. ens
ure
that
wor
k is
in a
ccor
danc
e w
ith
rele
vant
cod
es. M
ay in
stal
l or
serv
ice
stre
et
light
s, in
terc
om s
yste
ms,
or
elec
tric
al c
ontr
ol s
yste
ms.
exc
lude
s Se
curi
ty a
nd
Fire
ala
rm S
yste
ms
inst
alle
rs.
Firs
t-Li
ne
Supe
rvis
ors
of
Con
stru
ctio
n T
rad
es a
nd
Ex
trac
tio
n W
ork
ers
dir
ectl
y su
perv
ise
and
coor
dina
te a
ctiv
itie
s of c
onst
ruct
ion
or e
xtra
ctio
n w
orke
rs.
Firs
t-Li
ne Su
perv
isor
s of
Mec
han
ics,
Inst
alle
rs, a
nd R
epai
rers
d
irec
tly
supe
rvis
e an
d co
ordi
nate
the
act
ivit
ies
of m
echa
nics
, ins
talle
rs, a
nd
repa
irer
s. e
xclu
des
team
or
wor
k le
ader
s.
Firs
t-Li
ne S
uper
viso
rs o
f Pr
oduc
tion
and
Ope
rati
ng W
orke
rs
dir
ectl
y su
perv
ise
and
coor
dina
te t
he a
ctiv
itie
s of
pro
duct
ion
and
oper
atin
g w
orke
rs, s
uch
as in
spec
tors
, pre
cisi
on w
orke
rs, m
achi
ne s
ette
rs a
nd o
pera
tors
, as
sem
bler
s, fa
bric
ator
s, a
nd p
lant
and
sys
tem
ope
rato
rs. e
xclu
des
team
or
wor
k le
ader
s.
Grin
din
g, L
appi
ng,
Po
lish
ing,
an
d B
uff
ing
Mac
hin
e To
ol
Sett
ers,
Ope
rat
ors
, an
d T
ende
rs, M
etal
an
d P
last
ic
Set u
p, o
pera
te, o
r te
nd g
rind
ing
and
rela
ted
tool
s th
at r
emov
e ex
cess
mat
eria
l or
bur
rs fr
om s
urfa
ces,
sha
rpen
edg
es o
r cor
ners
, or b
uff, h
one,
or p
olis
h m
etal
or
pla
stic
wor
k pi
eces
.
Hel
pers
-Pro
duct
ion
Wo
rker
s h
elp
prod
ucti
on w
orke
rs b
y pe
rfor
min
g du
ties
requ
irin
g le
ss sk
ill. d
utie
s inc
lude
su
pply
ing
or h
oldi
ng m
ater
ials
or t
ools
, and
cle
anin
g w
ork
area
and
equ
ipm
ent.
a
ppre
ntic
e w
orke
rs a
re c
lass
ified
in t
he a
ppro
pria
te p
rodu
ctio
n oc
cupa
tion
s.
Indu
stri
al M
ach
iner
y M
ech
anic
s re
pair,
inst
all,
adju
st, o
r mai
ntai
n in
dust
rial
pro
duct
ion
and
proc
essi
ng m
achi
nery
or
refin
ery
and
pipe
line
dist
ribu
tion
syst
ems.
exc
lude
s Mill
wri
ghts
, Mob
ile h
eavy
eq
uipm
ent M
echa
nics
, exc
ept e
ngin
es, a
nd M
aint
enan
ce w
orke
rs, M
achi
nery
.
Insp
ecto
r - P
reci
sio
n
insp
ect,
test
, sor
t, s
ampl
e, o
r wei
gh n
onag
ricu
ltur
al ra
w m
ater
ials
or p
roce
ssed
, m
achi
ned,
fab
rica
ted,
or
asse
mbl
ed p
arts
or
prod
ucts
for
def
ects
, wea
r, a
nd
devi
atio
ns f
rom
spe
cific
atio
ns. M
ay u
se p
reci
sion
mea
suri
ng in
stru
men
ts a
nd
com
plex
test
equ
ipm
ent.
Lath
e an
d T
urn
ing
Mac
hin
e To
ol
Sett
ers,
Ope
rat
ors
, an
d
Ten
ders
, Met
al a
nd
Pla
stic
Se
t up,
ope
rate
, or t
end
lath
e an
d tu
rnin
g m
achi
nes
to tu
rn, b
ore,
thre
ad, f
orm
, or
face
met
al o
r pl
asti
c m
ater
ials
, suc
h as
wir
e, ro
d, o
r ba
r st
ock.

60N
IU C
ente
r fo
r G
over
nm
enta
l Stu
die
s
Prom
otin
g R
egio
nal P
rosp
erit
y in
Nor
thw
est I
llino
is
app
endi
x C
Mac
hin
ist
- Mai
nte
nan
ce
lubr
icat
e m
achi
nery
, ch
ange
par
ts,
or p
erfo
rm o
ther
rou
tine
mac
hine
ry
mai
nten
ance
. e
xclu
des
Mai
nten
ance
an
d r
epai
r w
orke
rs,
gen
eral
.M
ach
inis
ts
Set
up a
nd o
pera
te a
var
iety
of
mac
hine
too
ls t
o pr
oduc
e pr
ecis
ion
part
s an
d in
stru
men
ts. i
nclu
des
prec
isio
n in
stru
men
t m
aker
s w
ho fa
bric
ate,
mod
ify,
or
repa
ir m
echa
nica
l ins
trum
ents
. May
als
o fa
bric
ate
and
mod
ify
part
s to
mak
e or
re
pair
mac
hine
too
ls o
r m
aint
ain
indu
stri
al m
achi
nes,
app
lyin
g kn
owle
dge
of
mec
hani
cs, m
athe
mat
ics,
met
al p
rope
rtie
s, la
yout
, and
mac
hini
ng p
roce
dure
s.
Mai
nte
nan
ce W
ork
er -
Gen
eral
Pe
rfor
m w
ork
invo
lvin
g th
e ski
lls o
f tw
o or
mor
e mai
nten
ance
or c
raft
occ
upat
ions
to
kee
p m
achi
nes,
mec
hani
cal e
quip
men
t, o
r the
stru
ctur
e of
an
esta
blis
hmen
t in
rep
air.
dut
ies
may
invo
lve
pipe
fitt
ing;
boi
ler
mak
ing;
insu
lati
ng; w
eldi
ng;
mac
hini
ng; c
arpe
ntry
; rep
airi
ng e
lect
rica
l or m
echa
nica
l equ
ipm
ent;
inst
allin
g,
alig
ning
, and
bal
anci
ng n
ew e
quip
men
t; a
nd re
pair
ing
build
ings
, floo
rs, o
r sta
irs.
ex
clud
es M
aint
enan
ce w
orke
rs, M
achi
nery
.
Mil
lin
g an
d P
lan
nin
g M
ach
ine
Sett
ers,
Ope
rat
ors
, an
d
Ten
ders
, Met
al a
nd
Pla
stic
Se
t up
, ope
rate
, or
tend
mill
ing
or p
lann
ing
mac
hine
s to
mill
, pla
ne, s
hape
, gr
oove
, or
profi
le m
etal
or
plas
tic
wor
k pi
eces
.
Pack
agin
g/Fi
llin
g M
ach
Ope
rat
ors
/Ten
ders
o
pera
te o
r ten
d m
achi
nes t
o pr
epar
e in
dust
rial
or c
onsu
mer
pro
duct
s for
stor
age
or s
hipm
ent.
incl
udes
can
nery
wor
kers
who
pac
k fo
od p
rodu
cts.
Pro
duct
ion
Wo
rker
s, A
ll O
ther
a
ll pr
oduc
tion
wor
kers
not
list
ed s
epar
atel
y.
Pun
ch P
ress
Ope
rat
or
Set
up, o
pera
te, o
r te
nd m
achi
nes
to s
aw, c
ut, s
hear
, slit
, pun
ch, c
rim
p, n
otch
, be
nd, o
r st
raig
hten
met
al o
r pl
asti
c m
ater
ial.
Team
Ass
embl
ers
wor
k as
par
t of a
team
hav
ing
resp
onsi
bilit
y fo
r ass
embl
ing
an e
ntir
e pr
oduc
t or
com
pone
nt o
f a p
rodu
ct. T
eam
ass
embl
ers
can
perf
orm
all
task
s co
nduc
ted
by
the
team
in th
e as
sem
bly
proc
ess a
nd ro
tate
thro
ugh
all o
r mos
t of t
hem
rath
er
than
bei
ng a
ssig
ned
to a
spe
cific
task
on
a pe
rman
ent b
asis
. May
par
tici
pate
in
mak
ing
man
agem
ent d
ecis
ions
aff
ecti
ng t
he w
ork.
incl
udes
team
lead
ers
who
w
ork
as p
art o
f the
team
.
Wel
ders
Cu
tter
s So
lder
ers
and
Br
azer
s u
se h
and-
wel
ding
, flam
e-cu
ttin
g, h
and
sold
erin
g, o
r bra
zing
equ
ipm
ent t
o w
eld
or jo
in m
etal
com
pone
nts
or t
o fil
l hol
es, i
nden
tati
ons,
or
seam
s of
fabr
icat
ed
met
al p
rodu
cts.

61N
IU C
ente
r fo
r G
over
nm
enta
l Stu
die
s
Prom
otin
g R
egio
nal P
rosp
erit
y in
Nor
thw
est I
llino
is
app
endi
x C
Tran
spor
tati
on a
nd M
ater
ial M
ovin
g O
ccup
atio
n W
age
Dat
a
Tran
spo
rtat
ion
an
d M
ater
ial
Mo
vin
g O
ccu
pati
on
sN
at’l
Avg
. W
age
IL A
vg.
Wag
e
5-Ct
y Av
g.
Wag
e
5-Ct
y %
o
f St
ate
Avg.
5-Ct
y %
o
f N
at’l
Av
g.
5-Ct
y M
in.
Wag
e
5-Ct
y M
ax.
Wag
e
IL
Med
ian
W
age
5-Ct
y M
edia
n
Wag
eIn
dust
rial
Tru
ck a
nd
Trac
tor
Ope
rato
rs/F
ork
lift
Ope
rato
rs$3
1,84
0$3
1,54
0$3
6,87
511
7%11
6%$2
7,778
$43,
333
$29,
510
$35,
000
Mat
eria
l H
andl
ers
26,2
4026
,250
30,8
3311
711
823
,333
37,8
9523
,430
30,0
00
Pack
ers
22,4
8022
,980
25,0
0010
911
120
,000
30,0
0019
,820
25,0
00
Truc
k Dr
iver
s, H
eavy
/Tra
cto
r-tr
aile
r39
,830
43,9
9042
,500
9710
730
,000
55,0
0040
,130
40,0
00
Truc
k Dr
iver
s, L
igh
t/De
live
ry S
ervi
ces
33,1
2035
,080
35,8
3310
210
828
,333
43,3
3331
,280
35,0
00
Cate
gory
Ave
rage
30,7
0231
,968
34,2
0810
811
225
,889
41,9
1228
,834
33,0
00
Dat
a So
urce
s: CG
S 5-
Coun
ty W
age
and
Bene
fit S
urve
y, 2
011;
Sta
te a
nd N
atio
nal a
vera
ges a
re fr
om B
urea
u of
Lab
or a
nd S
tatis
tics O
ES d
atas
et, 2
011.
Not
e: A
ll w
age
data
are
ann
ual.

62N
IU C
ente
r fo
r G
over
nm
enta
l Stu
die
s
Prom
otin
g R
egio
nal P
rosp
erit
y in
Nor
thw
est I
llino
is
app
endi
x C
trAn
sPor
tAtio
n And
mAt
eriAl
mov
ing oc
cuPA
tion d
escr
iPtion
sIn
dust
rial
Tru
ck a
nd
Tr
acto
r O
per
ato
rs/F
ork
lift
O
per
ato
rs
ope
rate
indu
stri
al t
ruck
s or
tra
ctor
s eq
uipp
ed t
o m
ove
mat
eria
ls a
roun
d a
war
ehou
se, s
tora
ge y
ard,
fact
ory,
cons
truc
tion
site
, or s
imila
r loc
atio
n. e
xclu
des
logg
ing
equi
pmen
t ope
rato
rs.
Mat
eria
l H
andl
ers
Man
ually
mov
e fr
eigh
t, s
tock
, or
othe
r m
ater
ials
or
perf
orm
oth
er g
ener
al
labo
r. in
clud
es a
ll m
anua
l lab
orer
s no
t els
ewhe
re c
lass
ified
. exc
lude
s M
ater
ial
Mov
ing
wor
kers
who
use
pow
er e
quip
men
t. e
xclu
des
cons
truc
tion
lab
orer
s an
d co
nstr
ucti
on T
rade
s h
elpe
rs.
Pack
ers
Pack
or
pack
age
by h
and
a w
ide
vari
ety
of p
rodu
cts
and
mat
eria
ls.
Truc
k Dr
iver
s, H
eav
y/Tr
acto
r-tr
aile
r d
rive
a tr
acto
r-tr
aile
r com
bina
tion
or a
truc
k w
ith
a ca
paci
ty o
f at l
east
26,
000
poun
ds g
ross
Veh
icle
wei
ght (
gV
w).
May
be
requ
ired
to u
nloa
d tr
uck.
req
uire
s co
mm
erci
al d
rive
rs’ l
icen
se.
Truc
k Dr
iver
s, L
igh
t/De
live
ry S
ervi
ces
dri
ve a
ligh
t veh
icle
, suc
h as
a tr
uck
or v
an, w
ith
a ca
paci
ty o
f les
s th
an 2
6,00
0 po
unds
gro
ss V
ehic
le w
eigh
t (g
Vw
), pr
imar
ily to
del
iver
or p
ick
up m
erch
andi
se
or t
o de
liver
pac
kage
s. M
ay lo
ad a
nd u
nloa
d ve
hicl
e. e
xclu
des
cour
iers
and
M
esse
nger
s an
d d
rive
r/Sa
les
wor
kers
.

Outreach, Engagement, and Information Technologies
N O R T H E R N I L L I N O I S U N I V E R S I T Y
Center forGovernmental Studies
August 2012
Promoting regionAl ProsPerity in northwest illinois wAge And benefit rePort


THE
5-COUNTY NORTHWEST ILLINOIS
AREA
LABOR AVAILABILITY REPORT
July, 2012
Compiled and Prepared by
THE PATHFINDERSwww.thepathfindersus.com
TAB B

The 5-County Northwest Illinois Area Labor Availability Report July, 2012 _____________________________________________________________________________________________
TABLE OF CONTENTS
I. INTRODUCTION...................................................................................................1
II. KEY FINDINGS.....................................................................................................2
III. METHODOLOGY..................................................................................................3
IV. NUMBER OF AVAILABLE WORKERS ...............................................................5
V. ASSESSMENT OF THE UNDEREMPLOYED WORKFORCE.............................6
A. Desired Wages..........................................................................................6
B. Characteristics..........................................................................................8
C. Experience and Skills.............................................................................12
D. Factors Affecting Job Desirability ........................................................16
E. Training Interests ...................................................................................20
VI. NATIONAL COMPARISONS OF THE UNDEREMPLOYED WORKFORCE .....21
A. Desired Wages .........................................................................................21
B. Experience................................................................................................22
C. Skills .........................................................................................................25
VII. ASSESSMENT OF THE UNEMPLOYED WORKFORCE ..................................28
VIII. EMPLOYERS’ RATINGS OF THE WORKFORCE ............................................32
______________________________________________________________________________________________
THE PATHFINDERS i
The 5-County Northwest Illinois Area Labor Availability Report July, 2012 __________________________________________________________________________________
INTRODUCTION
The Pathfinders has employed its many years of experience in workforce assessments for
corporate site-selection clients and civilian workforce assessments for the Department of
Defense in locations that faced military base closures to produce this evaluation of the
5-County Northwest Illinois area workforce. In site-selection projects, the question that most
often drives the search is whether the candidate location has the workforce needed for a new
or expanding operation. When considering the workforce of a possible location, a prospect
basically wants to know:
Can I find the workers I need in this location?
Do these workers have any skills and/or experience that pertain to my operation?
How much will these workers cost?
Consequently, an analysis of an area’s workforce became a key component of site searches
conducted by The Pathfinders. The report that follows was developed as a tool for economic
development officials for use in business recruitment and workforce development efforts.
Senior human resources executives from among corporate clients assisted in refining the
methodology and report format.
With regard to labor availability, while unemployed workers are a source considered in hiring,
companies typically also staff a new operation with individuals who are working but who
desire better jobs and who appear to possess the skills, education, and experience to qualify
them for those better jobs. By that definition, those individuals can be considered
“underemployed” and are identified as such in this report.
The Pathfinders was retained by Northern Illinois University to quantify the extent to which
both unemployment and underemployment exist in the 5-County Northwest Illinois area.
This report also represents the objective and professional view of The Pathfinders with
regard to workforce quality, availability, costs, experience and skills that a new or expanding
employer can expect in the 5-County Northwest Illinois region.
The information presented in this report has been developed independently of the client, and the client has not influenced the findings.
______________________________________________________________________________________________
THE PATHFINDERS 1

The 5-County Northwest Illinois Area Labor Availability Report July, 2012 __________________________________________________________________________________
KEY FINDINGS
The 5-County Northwest Illinois area, referred to in this report as the “labor shed”, has a household population of approximately 211,100; a civilian labor force of approximately 104,800; and a pool of approximately 9,500 unemployed persons who are actively seeking work.
The results of this survey indicate that a new or expanding employer will be able to attract employees from an additional pool of about 10,000 underemployed workers.
The median current pay rate of the underemployed workers in the labor shed is $13.35 per hour, and their median desired pay rate is $15.13 per hour.
Survey results indicate that the underemployed workers in the labor shed have high levels of experience and skills in distribution/transportation/warehousing and customer service.
Results indicate that underemployed workers are willing to commute an average of 27 miles to a new job, in contrast to their current average commute of 15 miles.
Survey results indicate 2% of the underemployed and 6% of unemployed, actively seeking work individuals in the labor shed have less than a high school degree.
The median desired pay rate of the unemployed workers who are actively seeking work is $12.90 per hour.
In total, the 5-County Northwest Illinois area has approximately 19,500 available workers for new or expanding businesses.
______________________________________________________________________________________________
THE PATHFINDERS 2

The 5-County Northwest Illinois Area Labor Availability Report July, 2012 _____________________________________________________________________________________________
TABLE OF CONTENTS
I. INTRODUCTION...................................................................................................1
II. KEY FINDINGS.....................................................................................................2
III. METHODOLOGY..................................................................................................3
IV. NUMBER OF AVAILABLE WORKERS ...............................................................5
V. ASSESSMENT OF THE UNDEREMPLOYED WORKFORCE.............................6
A. Desired Wages..........................................................................................6
B. Characteristics..........................................................................................8
C. Experience and Skills.............................................................................12
D. Factors Affecting Job Desirability ........................................................16
E. Training Interests ...................................................................................20
VI. NATIONAL COMPARISONS OF THE UNDEREMPLOYED WORKFORCE .....21
A. Desired Wages .........................................................................................21
B. Experience................................................................................................22
C. Skills .........................................................................................................25
VII. ASSESSMENT OF THE UNEMPLOYED WORKFORCE ..................................28
VIII. EMPLOYERS’ RATINGS OF THE WORKFORCE ............................................32
______________________________________________________________________________________________
THE PATHFINDERS i

The 5-County Northwest Illinois Area Labor Availability Report July, 2012 __________________________________________________________________________________
MAP OF THE 5-COUNTY NORTHWEST ILLINOIS LABOR SHED
______________________________________________________________________________________________
THE PATHFINDERS 4

The 5-County Northwest Illinois Area Labor Availability Report July, 2012 __________________________________________________________________________________
NUMBER OF AVAILABLE WORKERS The 5-County Northwest Illinois Area Labor Shed
The 5-County Northwest Illinois area labor shed has a household population of
approximately 211,100. The civilian labor force numbers approximately 104,800, and the
labor shed contains approximately 9,500 unemployed people who are actively seeking work.
The results of this assessment determined that approximately 10,000 workers can be defined
as underemployed: those individuals who are currently working but would take a better job if
offered by a new or existing employer and who appear to possess the skills, education, and
experience to qualify them to do so. Together with the unemployed, actively seeking work
individuals, the 5-County Northwest Illinois area has approximately 19,500 available workers
for new or existing employers.
TOTAL AVAILABLE WORKERS
Number of underemployed workers 10,000
Number of unemployed, actively seeking work individuals 9,500
________
Total Number of Workers Available for Employers* 19,500
* The reader is cautioned that, while the number of workers identified in the region, as well as
their skills, experience, education, and costs, is accurate, all of those individuals may not be
acceptable candidates for an employer. Their previous work records, stability, integrity,
intelligence, appearance, and other factors are not considered in this report.
______________________________________________________________________________________________
THE PATHFINDERS 5

The 5-County Northwest Illinois Area Labor Availability Report July, 2012 __________________________________________________________________________________
ASSESSMENT OF THE UNDEREMPLOYED WORKFORCE The 5-County Northwest Illinois Area Labor Shed
The 10,000 underemployed workers identified in this report might also be termed
“upgraders”. They desire to move into an upgraded job and appear to possess the skills,
education, and experience to enable them to do so. The following charts represent the
desired pay rates of the underemployed individuals in the labor shed. Desired wages are
shown by specific rates, range and percentiles.
NUMBER OF UNDEREMPLOYED WORKERS AVAILABLE AT SPECIFIC WAGE RATES PER HOUR (rounded)
Desired Pay Rate Number Available
$9.99 or Less 300
$10.00 - $11.99 1,400
$12.00 - $13.99 2,400
$14.00 - $15.99 2,200
$16.00 - $17.99 500
$18.00 - $19.99 700
$20.00 - $21.99 500
$22.00 - $23.99 200
$24.00 - $25.99 800
$26.00 - $27.99 200
$28.00 - $29.99 200
$30.00 or more 600
______________________________________________________________________________________________
THE PATHFINDERS 6

The 5-County Northwest Illinois Area Labor Availability Report July, 2012 __________________________________________________________________________________
______________________________________________________________________________________________
THE PATHFINDERS 7
DESIRED WAGE RATES PER HOUR BY RANGE 10,000 Underemployed Workers
DESIRED WAGE RATES PER HOUR BY PERCENTILE 10,000 Underemployed Workers
0 1,000 2,000 3,000 4,000 5,000
$9.99 or Less
$10.00 - $14.99
$15.00 - $19.99
$20.00 - $24.00
$25.00 or More
Number of Workers
$15.13
$20.00
$10.77
$12.88
10th 25th 50th Upper 25th
Percentile
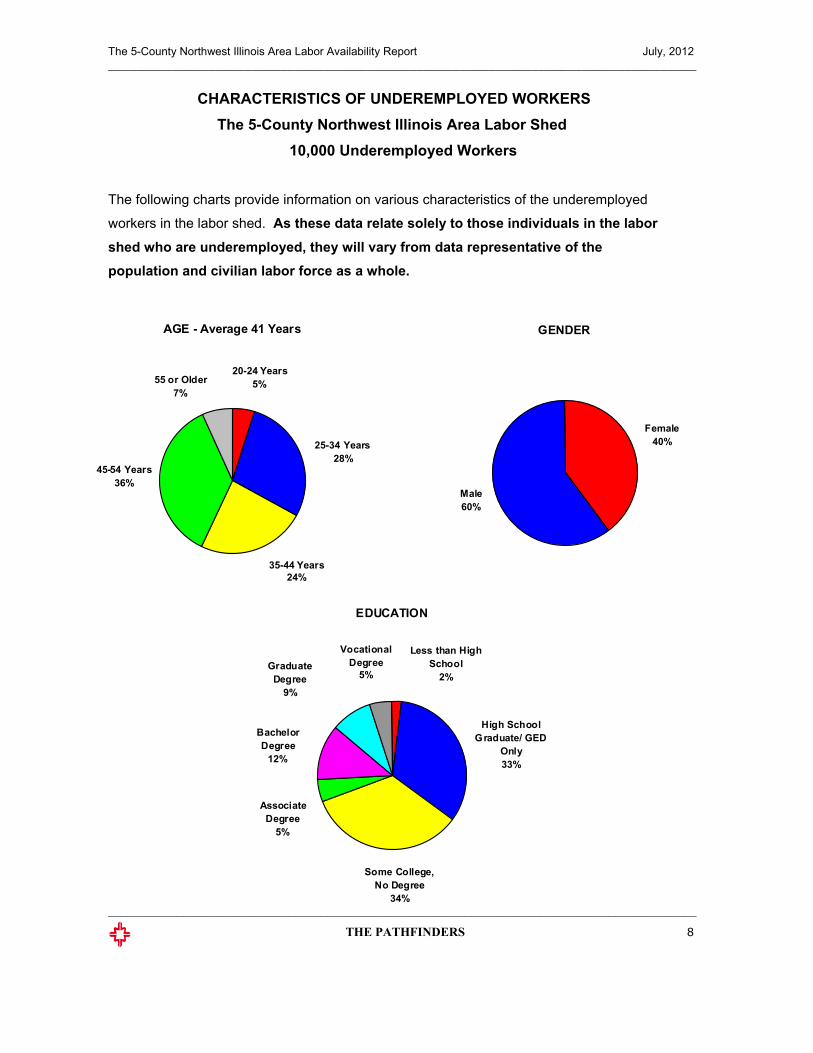
The 5-County Northwest Illinois Area Labor Availability Report July, 2012 __________________________________________________________________________________
______________________________________________________________________________________________
THE PATHFINDERS 8
AGE - Average 41 Years
25-34 Years28%
20-24 Years5%55 or Older
7%
45-54 Years36%
35-44 Years24%
GENDER
Female40%
Male60%
EDUCATION
High School Graduate/ GED
Only33%
Some College, No Degree
34%
Graduate Degree
9%
Associate Degree
5%
Less than High School
2%
Vocational Degree
5%
Bachelor Degree
12%
CHARACTERISTICS OF UNDEREMPLOYED WORKERS The 5-County Northwest Illinois Area Labor Shed
10,000 Underemployed Workers
The following charts provide information on various characteristics of the underemployed
workers in the labor shed. As these data relate solely to those individuals in the labor shed who are underemployed, they will vary from data representative of the population and civilian labor force as a whole.

The 5-County Northwest Illinois Area Labor Availability Report July, 2012 __________________________________________________________________________________
______________________________________________________________________________________________
THE PATHFINDERS 9
CURRENT COMMUTE DISTANCE
21 - 30 Miles10%
31 - 40 Miles2%
Over 40 Miles5%
11 - 20 Miles31%
0 - 10 Miles52%
CURRENT COMMUTE TIME
36 - 45 Minutes
5%
Over 45 Minutes
9%
21 - 35 Minutes
14%
Less than 20 Minutes
72%
CHARACTERISTICS OF UNDEREMPLOYED WORKERS 10,000 Underemployed Workers
The average commute time of the underemployed workers in the labor shed is 22 minutes,
and the average current commute distance is 15 miles.
LENGTH OF TIME IN CURRENT JOB
0%
10%
20%
30%
40%
50%
Less than 1Year
1 - 5 Years 6 - 10 Years 11 - 15 Years Over 15 Years
Percent of Underemployed Workers

The 5-County Northwest Illinois Area Labor Availability Report July, 2012 __________________________________________________________________________________
______________________________________________________________________________________________
THE PATHFINDERS 10
UNION PREFERENCE
Union Job14%
Non-Union Job19%
No Preference67%
Mfg/Assembly19%
Sales/ Services8%
IT10%
Admin/Office10%
Medical12%
Maint/Repair7%
Other18%
Distribution16%
MILES WILLING TO COMMUTEAverage 27 Miles
0 - 10 Miles9%
11 - 20 Miles38%
Over 40 Miles13%
31 - 40 Miles5%
21 - 30 Miles35%
CHARACTERISTICS OF UNDEREMPLOYED WORKERS 10,000 Underemployed Workers
CURRENT AREA OF EMPLOYMENT

The 5-County Northwest Illinois Area Labor Availability Report July, 2012 __________________________________________________________________________________
______________________________________________________________________________________________
THE PATHFINDERS 11
SINGLE-PARENT HOUSEHOLD
Yes12%
No88%
Personal Car95%
Carpool2%
Other Personal Vehicle
3%
CHILDREN IN HOUSEHOLD UNDER THE AGE OF 5
Yes12%
No88%
CHARACTERISTICS OF UNDEREMPLOYED WORKERS 10,000 Underemployed Workers
CHIEF MODE OF TRANSPORTATION
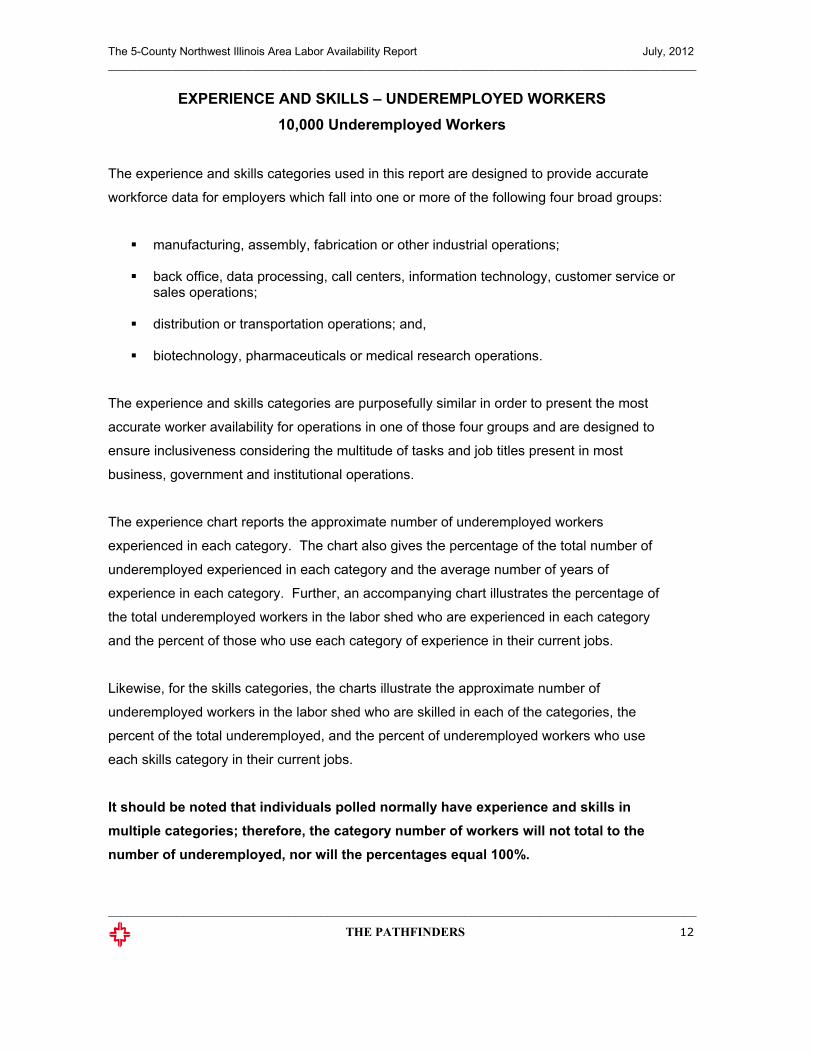
The 5-County Northwest Illinois Area Labor Availability Report July, 2012 __________________________________________________________________________________
EXPERIENCE AND SKILLS – UNDEREMPLOYED WORKERS 10,000 Underemployed Workers
The experience and skills categories used in this report are designed to provide accurate
workforce data for employers which fall into one or more of the following four broad groups:
manufacturing, assembly, fabrication or other industrial operations;
back office, data processing, call centers, information technology, customer service or sales operations;
distribution or transportation operations; and,
biotechnology, pharmaceuticals or medical research operations.
The experience and skills categories are purposefully similar in order to present the most
accurate worker availability for operations in one of those four groups and are designed to
ensure inclusiveness considering the multitude of tasks and job titles present in most
business, government and institutional operations.
The experience chart reports the approximate number of underemployed workers
experienced in each category. The chart also gives the percentage of the total number of
underemployed experienced in each category and the average number of years of
experience in each category. Further, an accompanying chart illustrates the percentage of
the total underemployed workers in the labor shed who are experienced in each category
and the percent of those who use each category of experience in their current jobs.
Likewise, for the skills categories, the charts illustrate the approximate number of
underemployed workers in the labor shed who are skilled in each of the categories, the
percent of the total underemployed, and the percent of underemployed workers who use
each skills category in their current jobs.
It should be noted that individuals polled normally have experience and skills in multiple categories; therefore, the category number of workers will not total to the number of underemployed, nor will the percentages equal 100%.
______________________________________________________________________________________________
THE PATHFINDERS 12

The 5-County Northwest Illinois Area Labor Availability Report July, 2012 __________________________________________________________________________________
______________________________________________________________________________________________
THE PATHFINDERS 13
EXPERIENCE OF UNDEREMPLOYED WORKERS 10,000 Underemployed Workers
Experience Category Number of Workers*
Percentage of Total
Average Years of Experience
Customer Service 5,300 53% 7
Warehouse/Distribution/Transportation 4,800 48% 9
Manufacturing/Assembly/Fabrication 4,700 47% 9
Office Operations 4,500 45% 7
Sales 4,000 40% 6
Maintenance/Installation/Repair 3,800 38% 7
Information Technology 3,300 33% 5
Telecommunications 2,900 29% 6
Call Center 2,200 22% 5
Medical/Health Sciences 1,900 19% 7
* Rounded
EXPERIENCE USED IN CURRENT JOB
0%
10%
20%
30%
40%
50%
60%
OfficeOps
Ware- housing
Mfg. Maint/ Install/ Repair
IT CallCenter
Medical Cust.Serv.
Telecom Sales
Percent with Experience Percent using Experience in Current Job

The 5-County Northwest Illinois Area Labor Availability Report July, 2012 __________________________________________________________________________________
______________________________________________________________________________________________
THE PATHFINDERS 14
SKILLS OF UNDEREMPLOYED WORKERS 10,000 Underemployed Workers
Skills Category Number of Workers*
Percentage of Total
Warehouse/Materials Handling 5,500 55%
Office Operations 4,700 47%
Manufacturing/Assembly/Fabrication 4,300 43%
Maintenance/Installation/Repair 3,600 36%
Information Technology 2,900 29%
Telecommunications 2,600 26%
Medical/Health Sciences 2,200 22%
Technician/Quality Assurance 2,200 22%
Electronics/Engineering 1,900 19%
* Rounded
SKILLS USED IN CURRENT JOB
0%
10%
20%
30%
40%
50%
60%
Office Ops Ware- housing
Mfg. Maint/ Install/ Repair
IT Tech/QA Medical Elec/Eng Telecom
Percent with Skills Percent using Skills in Current Job
The 5-County Northwest Illinois Area Labor Availability Report July, 2012 __________________________________________________________________________________
The survey respondents were asked to identify the one category of experience in which they
felt they were most experienced and, also, the single skills category in which they believed
themselves to be most skilled. The chart below reflects the results of these questions.
CATEGORY OF MOST EXPERIENCED / MOST SKILLED
Experience Category Percentage of Respondents Skills Category
Percentage Of
Respondents
Warehouse/Distribution/ Transportation 25% Warehouse/Distribution/
Transportation 25%
Office Operations 16% Medical/Health Sciences 17%
Manufacturing/Assembly/ Fabrication 14% Office Operations 17%
Medical/Health Sciences 12% Manufacturing/Assembly/ Fabrication 14%
Maintenance/Installation/ Repair 10% Maintenance/Installation/
Repair 10%
Customer Service 10% Electronics/Engineering 7%
Telecommunications 5% Information Technology 7%
Information Technology 3% Telecommunications 3%
Sales 3%
Call Center 2%
______________________________________________________________________________________________
THE PATHFINDERS 15

The 5-County Northwest Illinois Area Labor Availability Report July, 2012 __________________________________________________________________________________
______________________________________________________________________________________________
THE PATHFINDERS 16
SALARY
Extremely Important
76%
Very Important12%
Important12%
INSURANCE BENEFITS
Extremely Important
67%Very Important
12%
Somewhat Important
5%
Important16%
RETIREMENT BENEFITS
Extremely Important
62%
Very Important16%
Somewhat Important
3%
Important19%
BUSINESS FACTORS AFFECTING JOB DESIRABILITY 10,000 Underemployed Workers
In an effort to identify those business factors most important to the 5-County Northwest
Illinois area’s underemployed workers relative to consideration of an employer’s desirability
and a potential job change, the respondents were asked to rate the following job factors from
“extremely important” to “not important”.

The 5-County Northwest Illinois Area Labor Availability Report July, 2012 __________________________________________________________________________________
______________________________________________________________________________________________
THE PATHFINDERS 17
PAID TRAINING PROGRAMS
Not Important2%
Somewhat Important
12%
Extremely Important
48%
Very Important16%
Important22%
PHYSICAL WORKING ENVIRONMENT
Extremely Important
33%
Very Important22%
Not Important7%
Somewhat Important
19%
Important19%
OPPORTU
Extremely Important
50%
Very Important28%
So
Important16%
NITY FOR ADVANCEMENT
mewhat Important
6%
BUSINESS FACTORS AFFECTING JOB DESIRABILITY 10,000 Underemployed Workers

The 5-County Northwest Illinois Area Labor Availability Report July, 2012 __________________________________________________________________________________
______________________________________________________________________________________________
THE PATHFINDERS 18
LOCATION
Extremely Important
36%
Very Important26%
Not Important7%Somewhat
Important10%
Important21%
TELECOMMUTING POLICY OF COMPANY
Extremely Important
28%
Very Important16%
Not Important21%
Somewhat Important
14%
Important21%
FLEXIBLE WORK SCHEDULE
Extremely Important
31%
Very Important21%
Not Important10%
Somewhat Important
10%
Important28%
PERSONAL FACTORS AFFECTING JOB DESIRABILITY 10,000 Underemployed Workers
In an effort to identify those personal factors most important to the 5-County Northwest
Illinois area’s underemployed workers relative to consideration of an employer’s desirability
and a potential job change, the respondents were asked to rate the following job factors from
“extremely important” to “not important”.

The 5-County Northwest Illinois Area Labor Availability Report July, 2012 __________________________________________________________________________________
______________________________________________________________________________________________
THE PATHFINDERS 19
PERSONAL PHYSICAL IMPAIRMENTS
Extremely Important
24%
Not Important21%
Very Important21%
Somewhat Important
16%
Important18%
TRANSPORTATION AVAILABILITY / COST
Important17%
Somewhat Important
17%
Not Important19%
Very Impo17%
Extremely Important
30%
rtant
DAY / ELDER
Very Important19%
Not Important26%
Somewhat Important
19%Important
14%
CARE AVAILABILITY / COST
Extremely Important
22%
PERSONAL FACTORS AFFECTING JOB DESIRABILITY 10,000 Underemployed Workers

The 5-County Northwest Illinois Area Labor Availability Report July, 2012 __________________________________________________________________________________
INTEREST IN TRAINING COURSES 10,000 Underemployed Workers
A component was added to this survey which was designed to determine possible interest in
training courses on the part of the underemployed workers in the Carroll County workforce.
In the table that follows, it should be noted that many of the respondents indicated interest in
more than one program; therefore, the percent total will not equal 100.
Type of Training Course Number of Workers (Rounded)
Percentage of Total
Human Resources 4,000 40%
Health Care 4,000 40%
Computer Software Applications 3,600 36%
Computer Programming 3,500 35%
Technical Trades 3,300 33%
Real Estate or Insurance 3,100 31%
Construction Trades 2,900 29%
Computer Maintenance or Repair 2,900 29%
Industrial Machine Operations 2,800 28%
Auto or Maintenance Mechanics 2,400 24%
Commercial Vehicle Operations 2,200 22%
Food Service or Hospitality 1,000 10%
Restaurant or Retail Management 700 7%
GED or Basic Reading, Writing, Arithmetic 700 7%
______________________________________________________________________________________________
THE PATHFINDERS 20

The 5-County Northwest Illinois Area Labor Availability Report July, 2012 __________________________________________________________________________________
NATIONAL COMPARISONS OF UNDEREMPLOYED WORKFORCE
This section of the report provides comparisons of the pay rates, experience and skills of the
labor shed’s underemployed workforce with the underemployed workforces in other areas
previously surveyed by The Pathfinders. A prospect company considering the 5-County
Northwest Illinois region as a location will judge its workforce on a comparative basis. The
comparative data for other locations used in the following charts reflect information
accumulated over the past eighteen months. The Pathfinders maintains a continuing
database of over 700 surveyed counties and communities and more than 30 million workers.
In the charts, the 5-County Northwest Illinois region is referred to as “labor shed”.
The chart below illustrates the median current and desired wages of the underemployed
workers in the 5-County Northwest Illinois labor shed as compared to those underemployed
workers in all locations surveyed by The Pathfinders over the past eighteen months. As
indicated, the median current pay of all surveyed, underemployed workers over the past
eighteen months is $15.65 per hour, and the median desired pay of these workers is $17.10
per hour. As shown, survey results indicate that the 5-County Northwest Illinois region’s
underemployed workers have lower pay rates in both median current pay and desired pay
than other locations surveyed.
COMPARISON OF MEDIAN CURRENT / DESIRED WAGES (per hour)
$15.13$13.35
$17.10$15.65
Median Cur rent Pay Median Desired Pay
Labor Shed All Locations Surveyed
______________________________________________________________________________________________
THE PATHFINDERS 21

The 5-County Northwest Illinois Area Labor Availability Report July, 2012 __________________________________________________________________________________
______________________________________________________________________________________________
THE PATHFINDERS 22
0Lowest Median Highest
10
20
30
40
50
Perc
ent o
f Wor
kers
Labor Shed Other Locations
0
20
40
60
80
Lowest Median Highest
Perc
ent o
f Wor
kers
Labor Shed Other Locations
0
20
40
60
80
Lowest Median Highest
Perc
ent o
f Wor
kers
Labor Shed Other Locations
0
20
40
60
80
100
Lowest Median Highest
Perc
ent o
f Wor
kers
Labor Shed Other Locations
COMPARISON OF EXPERIENCEUNDEREMPLOYED WORKERS
The 5-County Northwest Illinois Area / Locations Surveyed Over the Past 18 Months
OFFICE WAREHOUSE / DISTRIBUTION / TRANSPORTATION
MANUFACTURING / ASSEMBLY / FABRICATION
MEDICAL / HEALTH SCIENCES

The 5-County Northwest Illinois Area Labor Availability Report July, 2012 __________________________________________________________________________________
______________________________________________________________________________________________
THE PATHFINDERS 23
0
10
40
west edian ighes
Perc
ent o
s
20
Lo M H t
f Wo
30rker
Labor Shed Other Locations
0
10
20
30
40
50
60
Lowest Median Highest
Perc
ent o
f Wor
kers
Labor Shed Other Locations
0
20
40
60
80
100
Lowest Median Highest
Perc
ent o
f Wor
kers
Labor Shed Other Locations
COMPARISON OF EXPERIENCEUNDEREMPLOYED WORKERS
The 5-County Northwest Illinois Area / Locations Surveyed Over the Past 18 Months
0
10
20
30
40
50
60
Lowest Median Highest
Perc
ent o
f Wor
kers
Labor Shed Other Locations
INFORMATION TECHNOLOGY
CUSTOMER SERVICE
MAINTENANCE / INSTALLATION / REPAIR CALL CENTER

The 5-County Northwest Illinois Area Labor Availability Report July, 2012 __________________________________________________________________________________
______________________________________________________________________________________________
THE PATHFINDERS 24
SUMMARY COMPARISON OF EXPERIENCEUNDEREMPLOYED WORKERS
The 5-County Northwest Illinois Area / Locations Surveyed Over the Past 18 Months
0
10
20
30
40
50
60
70
80
90
Office Distribution Mfg. Health Care
Maintenance Call Center
IT CustomerService
Perc
ent o
f Wor
kers
Labor Shed Lowest Median Highest

The 5-County Northwest Illinois Area Labor Availability Report July, 2012 __________________________________________________________________________________
______________________________________________________________________________________________
THE PATHFINDERS 25
0
20
40
60
80
100
Lowest Median Highest
Perc
ent o
f Wor
kers
Labor Shed Other Locations
0Lowest Median Highest
P
10
20
30
40
50
erce
nt o
f Wor
kers
Labor Shed Other Locations
0
20
40
60
80
100
Lowest Median Highest
Perc
ent o
f Wor
kers
Labor Shed Other Locations
0
20
40
60
80
Lowest Median Highest
Perc
ent o
f Wo
srk
er
Labor Shed Other Locations
COMPARISON OF SKILLSUNDEREMPLOYED WORKERS
The 5-County Northwest Illinois Area / Locations Surveyed Over the Past 18 Months
OFFICE WAREHOUSE / MATERIALS HANDLING
MANUFACTURING / ASSEMBLY / FABRICATION
MEDICAL / HEALTH SCIENCES
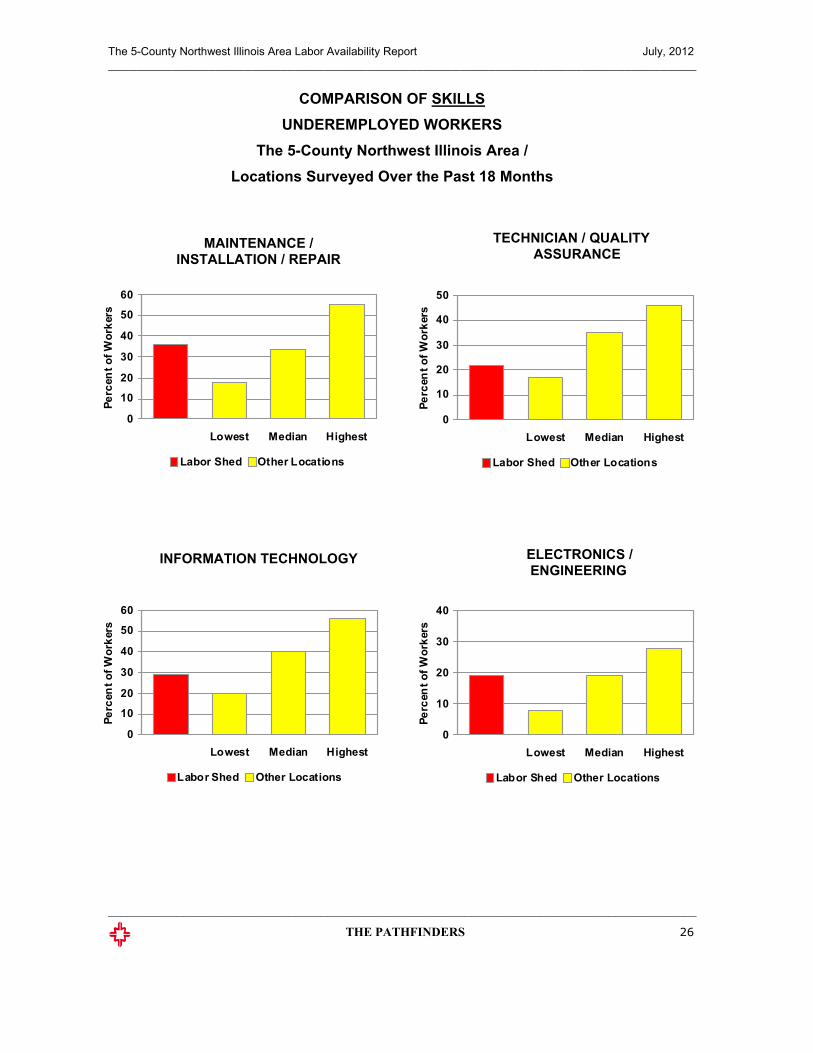
The 5-County Northwest Illinois Area Labor Availability Report July, 2012 __________________________________________________________________________________
______________________________________________________________________________________________
THE PATHFINDERS 26
0
10
20
30
40
50
Perc
ent o
f Wor
kers
Lowest Median Highest
Labor Shed Other Locations
0
10
20
30
40
50
60
Perc
ent o
f Wor
kers
Lowest Median Highest
Labor Shed Other Locations
0
10
Lowest Median Highest
Perc
20
30
40
50
60
ent o
f Wor
kers
Labor Shed Other Locations
0
10
20
30
40
Lowest Median Highest
Perc
ent o
f Wor
kers
Labor Shed Other Locations
COMPARISON OF SKILLSUNDEREMPLOYED WORKERS
The 5-County Northwest Illinois Area / Locations Surveyed Over the Past 18 Months
MAINTENANCE / INSTALLATION / REPAIR
TECHNICIAN / QUALITY ASSURANCE
INFORMATION TECHNOLOGY ELECTRONICS / ENGINEERING
The 5-County Northwest Illinois Area Labor Availability Report July, 2012 __________________________________________________________________________________
______________________________________________________________________________________________
THE PATHFINDERS 27
SUMMARY COMPARISON OF SKILLSUNDEREMPLOYED WORKERS
The 5-County Northwest Illinois Area / Locations Surveyed Over the Past 18 Months
0
10
20
30
40
50
60
70
80
90
Office Warehouse Mfg. Health Care
Maintenance Quality Assurance
IT Electronics/Engineering
Per
cent
of W
orke
rs
Labor Shed Lowest Median Highest

The 5-County Northwest Illinois Area Labor Availability Report July, 2012 __________________________________________________________________________________
______________________________________________________________________________________________
THE PATHFINDERS 28
AGE
25-34 Years12%
20-24 Years23%
55 or Older21%
45-54 Years18%
35-44 Years26%
GENDER
Female47%Male
53%
CHARACTERISTICS OF UNEMPLOYED INDIVIDUALS WHO ARE ACTIVELY SEEKING WORK
9,500 Workers
According to survey results, the following charts provide information on those unemployed
workers in the labor shed who are actively seeking work. As these data relate solely to those individuals in the labor shed who are unemployed, they will vary from data representative of the population and civilian labor force as a whole.
In the 5-County Northwest Illinois labor shed, according to published sources, there are
approximately 9,500 individuals who are actively seeking work. Survey results indicate the
average age of these individuals is 40 years.
The median desired pay rate of the individuals who are unemployed, actively seeking work is
$12.90 per hour. These available workers have been out of the workforce for an average of
23 weeks and are willing to commute an average of 25 miles for a job.

The 5-County Northwest Illinois Area Labor Availability Report July, 2012 __________________________________________________________________________________
______________________________________________________________________________________________
THE PATHFINDERS 29
WEEKS OUT OF WORKFORCEMedian 23 Weeks
5 - 14 Weeks24%
Less than 5 Weeks15%
More than 27 Weeks
43%
15 - 26 Weeks18%
CHARACTERISTICS OF UNEMPLOYED INDIVIDUALS WHO ARE ACTIVELY SEEKING WORK
9,500 Workers
REASON FOR BEING OUT OF WORKFORCE
REASON Percentage of Respondents
Laid Off / Job Eliminated 29%
Personal Choice / Stay-At-Home 23%
Company Closed / Relocated 18%
No Jobs / Discouraged 15%
Retired or Close to Retirement 6%
Student 3%
Medical/Disability 3%
Other / Not Reported 3%

The 5-County Northwest Illinois Area Labor Availability Report July, 2012 __________________________________________________________________________________
______________________________________________________________________________________________
THE PATHFINDERS 30
EDUCATION
High School Graduate/ GED
Only27%
Some College, No Degree
35%
Graduate Degree
3%
Associate Degree
6%
Less than High School
6%
Vocational Degree
14%
Bachelor Degree
9%
MILES WILLING TO COMMUTEAverage 25 Miles
21 - 30 Miles
31 - 40 Miles9%
Over 40 Miles5%
0 - 10 Miles12%
21%
11 - 20 Miles53%
SINGLE-PARENT HOUSEHOLD
Yes18%
No82%
CHILDREN IN HOUSEHOLD UNDER THE AGE OF 5
Yes15%
No85%
CHARACTERISTICS OF UNEMPLOYED INDIVIDUALS WHO ARE ACTIVELY SEEKING WORK
9,500 Workers

The 5-County Northwest Illinois Area Labor Availability Report July, 2012 __________________________________________________________________________________
CHARACTERISTICS OF UNEMPLOYED INDIVIDUALS WHO ARE ACTIVELY SEEKING WORK
9,500 Workers
Experience Category Number of Individuals*
Percentage of Total
Average Years of Experience
Manufacturing/Assembly/Fabrication 5,000 53% 7
Customer Service 5,000 53% 7
Warehouse/Distribution/Transportation 4,800 50% 6
Office Operations 4,200 44% 8
Maintenance/Installation/Repair 3,600 38% 7
Telecommunications 3,300 35% 5
Information Technology 3,300 35% 4
Medical/Health Sciences 2,800 29% 9
Call Center 2,600 27% 5
Sales 2,000 21% 5
It should be noted that individuals polled normally have experience and/or skills in multiple categories.
Skills Category Number of Individuals* Percentage of Total
Warehouse/Materials Handling 5,900 62%
Manufacturing/Assembly/Fabrication 5,000 53%
Office Operations 4,500 47%
Telecommunications 4,200 44%
Information Technology 3,900 41%
Maintenance/Installation/Repair 3,000 32%
Technician/Quality Assurance 3,000 32%
Medical/Health Sciences 2,800 29%
Electronics/Engineering 1,400 15%
* Rounded ______________________________________________________________________________________________
THE PATHFINDERS 31

The 5-County Northwest Illinois Area Labor Availability Report July, 2012 __________________________________________________________________________________
EMPLOYERS’ VIEWS AND RATINGS OF THE THE NORTHWEST ILLINOIS AREA TOTAL WORKFORCE
In developing a profile of existing workers in the Northwest Illinois region, The Pathfinders
considered such factors as labor availability, productivity, attitudes, costs, and education.
The analysis was based upon interviews conducted with senior management and human
resources professionals from companies located in the labor shed.
As determined from the employer interviews, the tables below reflect the top four methods
used to recruit hourly and salaried workers in the Northwest Illinois region and the percent of
employers utilizing each method. Employers may use multiple recruitment methods.
RECRUITMENT METHODS
Recruiting Methods – Hourly Workers % of Employers
Newspaper Ads 41%
Word of Mouth 34%
Internet 31%
Staffing/Temp Agency 24%
Recruiting Methods – Salaried Workers % of Employers
Internet 34%
Newspaper Ads 34%
Word of Mouth 31%
Recruiters 21%
______________________________________________________________________________________________
THE PATHFINDERS 32

The 5-County Northwest Illinois Area Labor Availability Report July, 2012 __________________________________________________________________________________
______________________________________________________________________________________________
THE PATHFINDERS 33
NUMBER OF EMPLOYEESPast 12 Months
Decreased12%
Increased54%
Stayed the Same34%
NUMBER OF Next 12
EMPLOYEES Months
Decrease8%
Increase38%
Stay the Same54%
STATE UNEMPLOYMENT TAX RATEPast Two Years
Stayed the Same30%
Increased44%
Not Reported26%
EMPLOYERS’ VIEWS AND RATINGS OF THE THE NORTHWEST ILLINOIS AREA TOTAL WORKFORCE
The employers who were interviewed were asked whether or not their company’s
employment figures had increased, decreased or stayed the same over the past twelve
months and also to make hiring projections for the next twelve months.
The employers were asked to report if, over the past two years, their state unemployment tax
rate had increased, decreased or stayed the same.
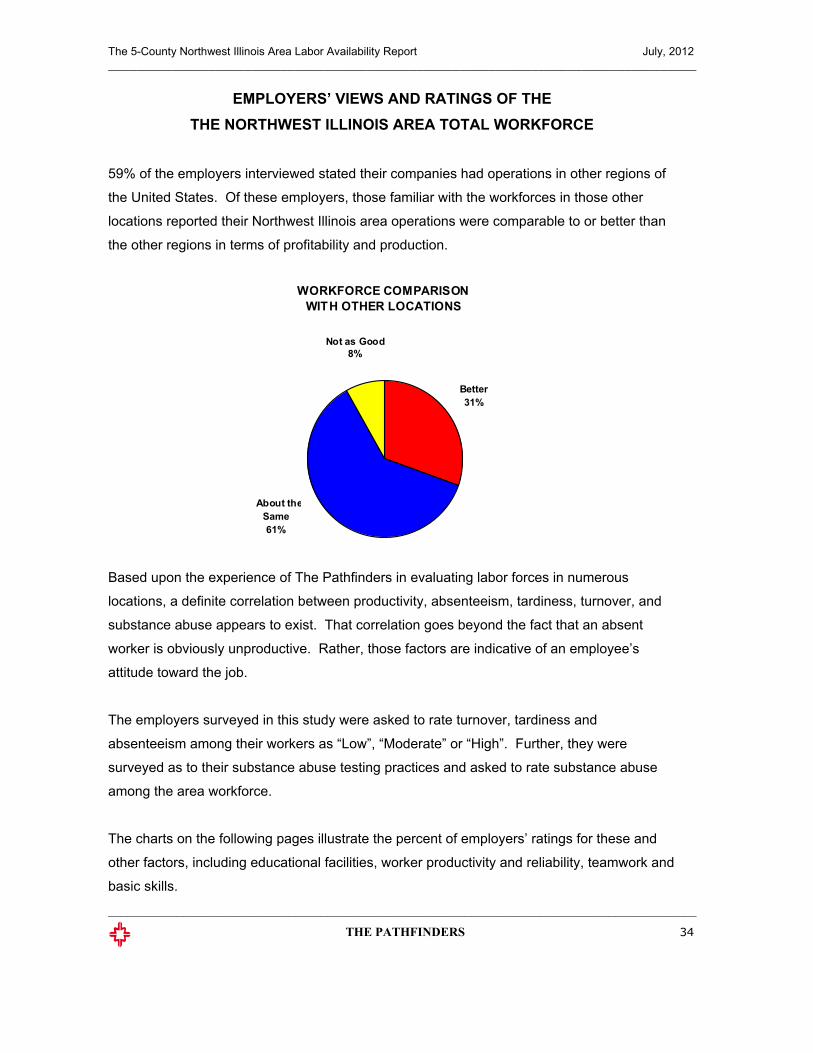
The 5-County Northwest Illinois Area Labor Availability Report July, 2012 __________________________________________________________________________________
______________________________________________________________________________________________
THE PATHFINDERS 34
WORKFORCE COMPARISONWITH OTHER LOCATIONS
Better31%
About theSame61%
Not as Good8%
EMPLOYERS’ VIEWS AND RATINGS OF THE THE NORTHWEST ILLINOIS AREA TOTAL WORKFORCE
59% of the employers interviewed stated their companies had operations in other regions of
the United States. Of these employers, those familiar with the workforces in those other
locations reported their Northwest Illinois area operations were comparable to or better than
the other regions in terms of profitability and production.
Based upon the experience of The Pathfinders in evaluating labor forces in numerous
locations, a definite correlation between productivity, absenteeism, tardiness, turnover, and
substance abuse appears to exist. That correlation goes beyond the fact that an absent
worker is obviously unproductive. Rather, those factors are indicative of an employee’s
attitude toward the job.
The employers surveyed in this study were asked to rate turnover, tardiness and
absenteeism among their workers as “Low”, “Moderate” or “High”. Further, they were
surveyed as to their substance abuse testing practices and asked to rate substance abuse
among the area workforce.
The charts on the following pages illustrate the percent of employers’ ratings for these and
other factors, including educational facilities, worker productivity and reliability, teamwork and
basic skills.

The 5-County Northwest Illinois Area Labor Availability Report July, 2012 __________________________________________________________________________________
______________________________________________________________________________________________
THE PATHFINDERS 35
EMPLOYERS’ VIEWS AND RATINGS OF THE THE NORTHWEST ILLINOIS AREA TOTAL WORKFORCE
TURNOVER / TARDINESS / ABSENTEEISM
In the Northwest Illinois labor shed, 72% of the employers interviewed stated their companies
tested for substance abuse, using one or more of the following practices:
SUBSTANCE ABUSE TESTING PRACTICES
0%
15%
30%
45%
60%
75%
90%
Low Moderate High
Perc
ent
of Em
plo
yer
s
Turnover Tardiness Absenteeism
0%
20%
40%
Perc
ent
of
60%
80%
100%
Em
plo
yers
Pre-Employment Random Cause/Suspicion
Post-Accident Return to Work

The 5-County Northwest Illinois Area Labor Availability Report July, 2012 __________________________________________________________________________________
______________________________________________________________________________________________
THE PATHFINDERS 36
WORKER PRODUCTIVITY
Good62%
Excellent17%Fair
21%
WORKER RELIABILITY
Fair21%
Excellent17%
Good62%
EMPLOYERS’ VIEWS AND RATINGS OF THE THE NORTHWEST ILLINOIS AREA TOTAL WORKFORCE
SUBSTANCE ABUSE RATING – AREA WORKFORCE
Further, 79% of the employers surveyed completed criminal background checks on potential
employees, and 69% checked for valid drivers’ licenses.
0%
Low Moderate High
10%
20%
30%
40%
50%
Per
cent
of E
mplo
yers
Substance Abuse - Area Workforce
The 5-County Northwest Illinois Area Labor Availability Report July, 2012 __________________________________________________________________________________
______________________________________________________________________________________________
THE PATHFINDERS 37
WORKER ATTITUDES
Good83%
Poor3%
Fair14%
LOCAL PUBLIC SCHOOLS
Good37%
Excellent4%Poor
18%
Fair41%
LOCAL COMMUNITY COAND TECH SCHOO
LLEGESLS
Good59%
Excellent19%
Poor3%
Fair19%
TEAMWORK SKILLS
Good62%
Excellent17%Fair
21%
EMPLOYERS’ VIEWS AND RATINGS OF THE THE NORTHWEST ILLINOIS AREA TOTAL WORKFORCE
The educational competencies of employees are additional factors used to evaluate an
area’s labor force. In the Northwest Illinois area, 41% of the employers interviewed rated the
local public schools as “Excellent” or “Good”, and 78% rated the local community colleges
and technical schools as “Excellent” or “Good”. Ratings for basic skills and other factors are
also shown.

The 5-County Northwest Illinois Area Labor Availability Report July, 2012 __________________________________________________________________________________
______________________________________________________________________________________________
THE PATHFINDERS 38
READING SKLLS
Good52%
Excellen11%
tPoor3%
Fair34%
WRITING SKLLS
Good50%
Excellent4%
Fair46%
COMPUTER SKILLS
Good50%
Excellent7%Poor
18%
Fair25%
MATH SKILLS
Good36%
Excellent11%
Poor7%
Fair46%
EMPLOYERS’ VIEWS AND RATINGS OF THE THE NORTHWEST ILLINOIS AREA TOTAL WORKFORCE
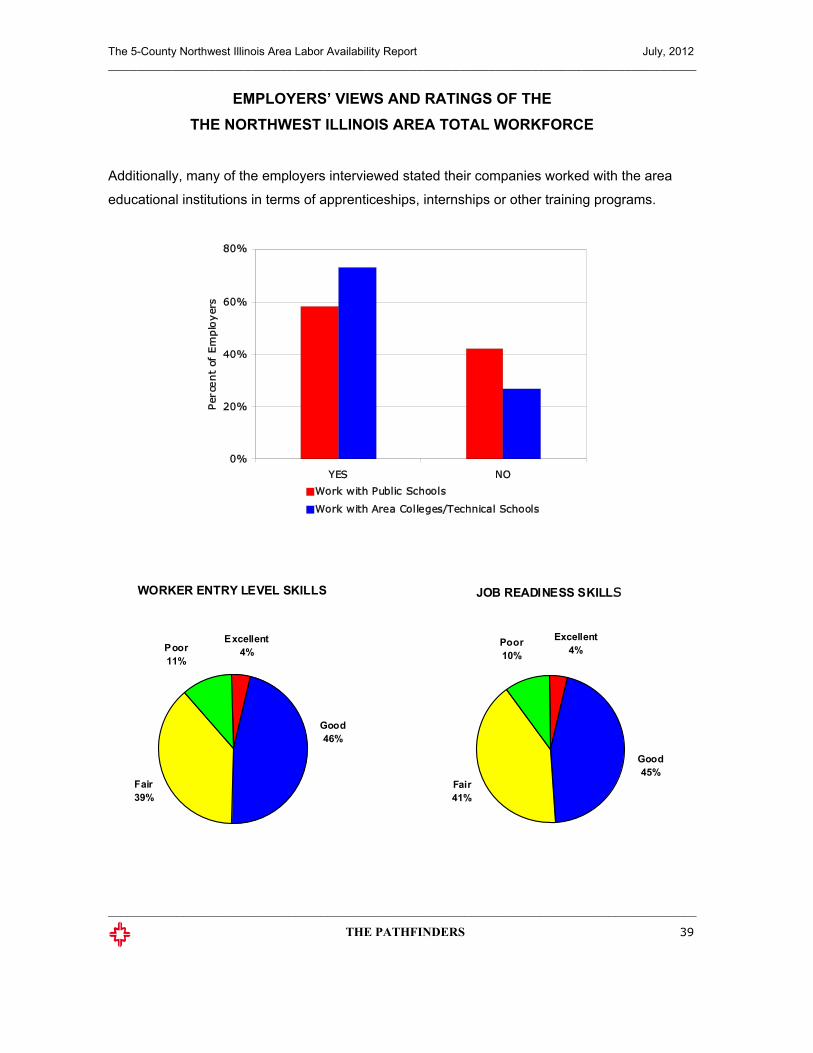
The 5-County Northwest Illinois Area Labor Availability Report July, 2012 __________________________________________________________________________________
______________________________________________________________________________________________
THE PATHFINDERS 39
WORKER ENTRY LEVEL SKILLS
Good46%
Excellent4%Poor
11%
Fair39%
JOB READINESS SKILLS
Good45%
Excel4%
lentPoor10%
Fair41%
EMPLOYERS’ VIEWS AND RATINGS OF THE THE NORTHWEST ILLINOIS AREA TOTAL WORKFORCE
Additionally, many of the employers interviewed stated their companies worked with the area
educational institutions in terms of apprenticeships, internships or other training programs.
0%
20%
40%
60%
80%
YES NO
Per
cent
of E
mplo
yer
s
Work with Public Schools
Work with Area Colleges/Technical Schools
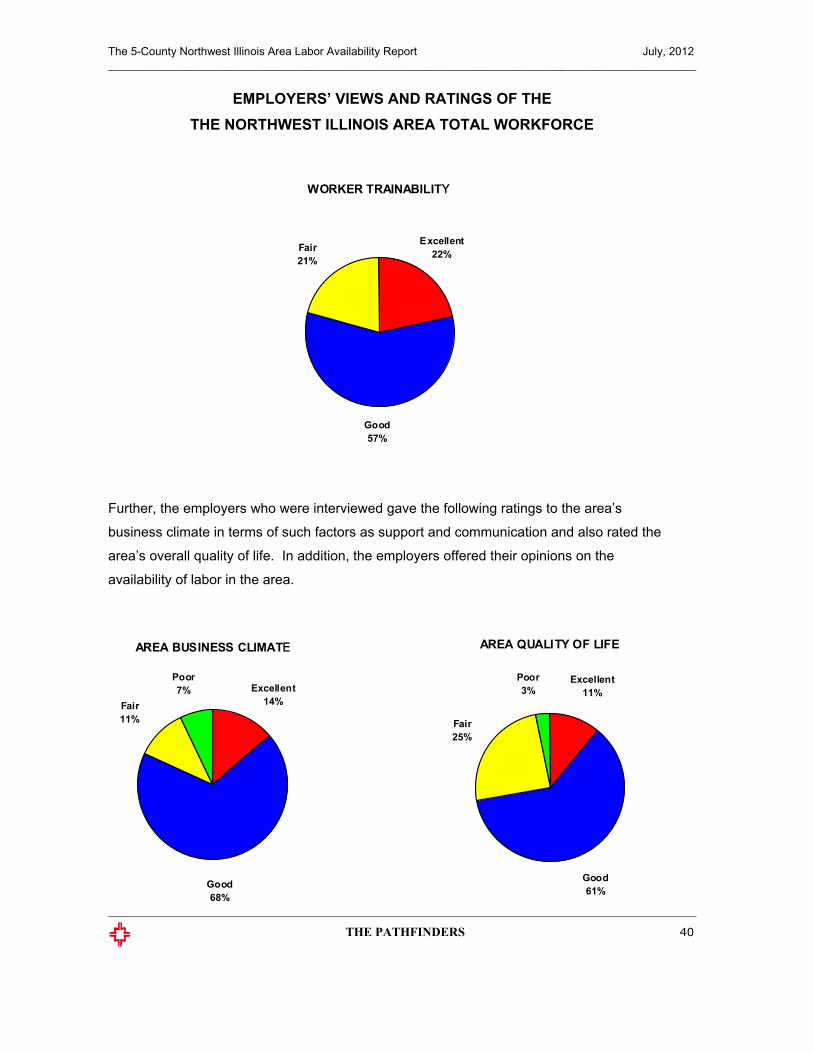
The 5-County Northwest Illinois Area Labor Availability Report July, 2012 __________________________________________________________________________________
______________________________________________________________________________________________
THE PATHFINDERS 40
WORKER TRAINABILITY
Goo57%
d
Excellent22%Fair
21%
AREA BUSINESS CLIMATE
Good68%
Excellent14%
Poor7%
Fair11%
AREA QUALITY OF LIFE
Good61%
Excellent11%
Poor3%
Fair25%
EMPLOYERS’ VIEWS AND RATINGS OF THE THE NORTHWEST ILLINOIS AREA TOTAL WORKFORCE
Further, the employers who were interviewed gave the following ratings to the area’s
business climate in terms of such factors as support and communication and also rated the
area’s overall quality of life. In addition, the employers offered their opinions on the
availability of labor in the area.
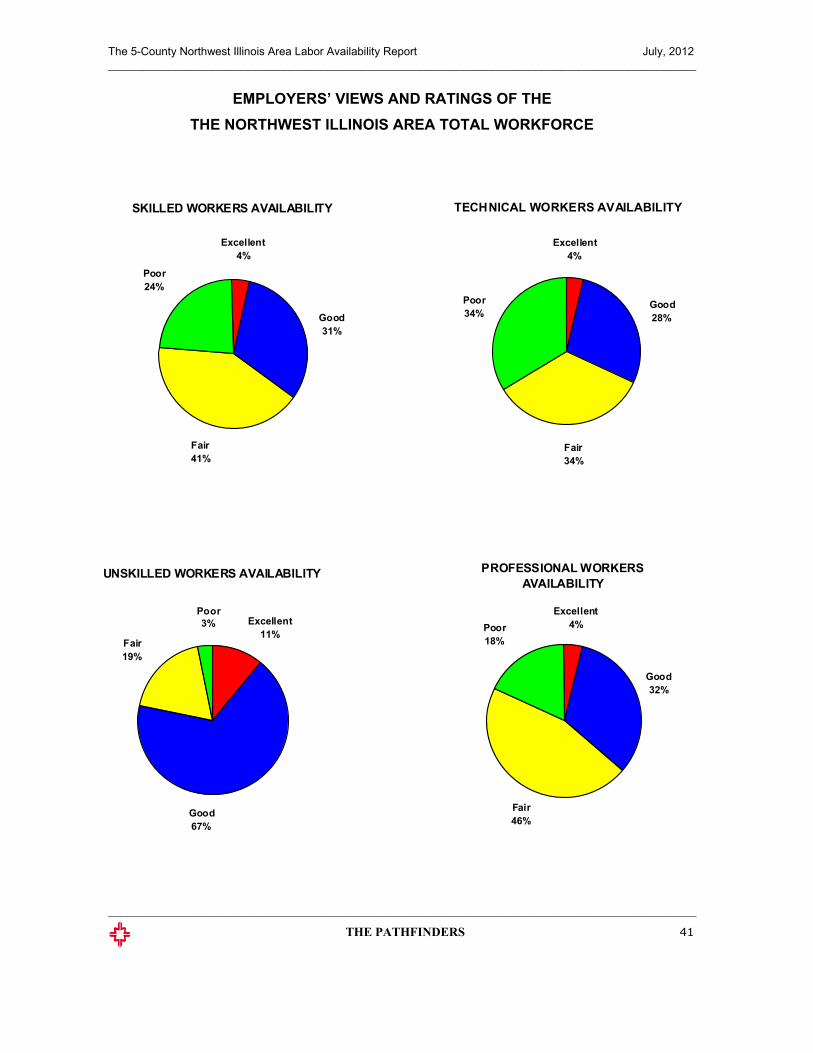
The 5-County Northwest Illinois Area Labor Availability Report July, 2012 __________________________________________________________________________________
______________________________________________________________________________________________
THE PATHFINDERS 41
EMPLOYERS’ VIEWS AND RATINGS OF THE THE NORTHWEST ILLINOIS AREA TOTAL WORKFORCE
SKILLED WORKERS AVAILABILITY TECHNICAL WORKERS AVAILABILITY
Excellent4%
Excellent4%
UNSKILLED WORKERS AVAILABILITY
Good67%
Excellent11%
Poor3%
Fair19%
Poor24%
Poor34%
Good28%Good
31%
Fair34%
PROFESSIONAL WORKERSAVAILABILITY
Good
Fair41%
32%
Excellent4%Poor
18%
Fair46%
THE
5-COUNTY NORTHWEST ILLINOIS
AREA
LABOR AVAILABILITY REPORT
July, 2012
Compiled and Prepared by
THE PATHFINDERSwww.thepathfindersus.com


Outreach, Engagement, and Information Technologies
N O R T H E R N I L L I N O I S U N I V E R S I T Y
Center forGovernmental Studies
IN PARTNERSHIP WITH
APRIL 2013
PROMOTING PROSPERITY IN NORTHWEST ILLINOIS Regional Focus, Regional Results