Embed Size (px)
Citation preview
Building the Customer-
Centric Supply Chain
Supply Chain Insights LLC Copyright © 2016, p. 2
Disclaimer: I am a Skeptic

Supply Chain Insights LLC Copyright © 2016, p. 3
A Social Scientist

Supply Chain Insights LLC Copyright © 2016, p. 4
A Curmudgeon

Supply Chain Insights LLC Copyright © 2016, p. 5
A Fortune-teller of Sorts….

Supply Chain Insights LLC Copyright © 2016, p. 6
I Write for the Supply Chain Leader

How Effective Is Today’s
Supply Chain in Serving
the Customer?

Who is Your Customer?
Start at
the
basketStore needs
the productShip to
store
Sit in
warehouse
Ship to
warehouse
Make
Old View
New View

The Evolution of the Long Tail

Supply Chain Insights LLC Copyright © 2016, p. 11
Bullwhip Effect

Supply Chain Insights LLC Copyright © 2016, p. 12
Descriptors Used by Leaders
Supply Chain Insights LLC Copyright © 2016, p. 13
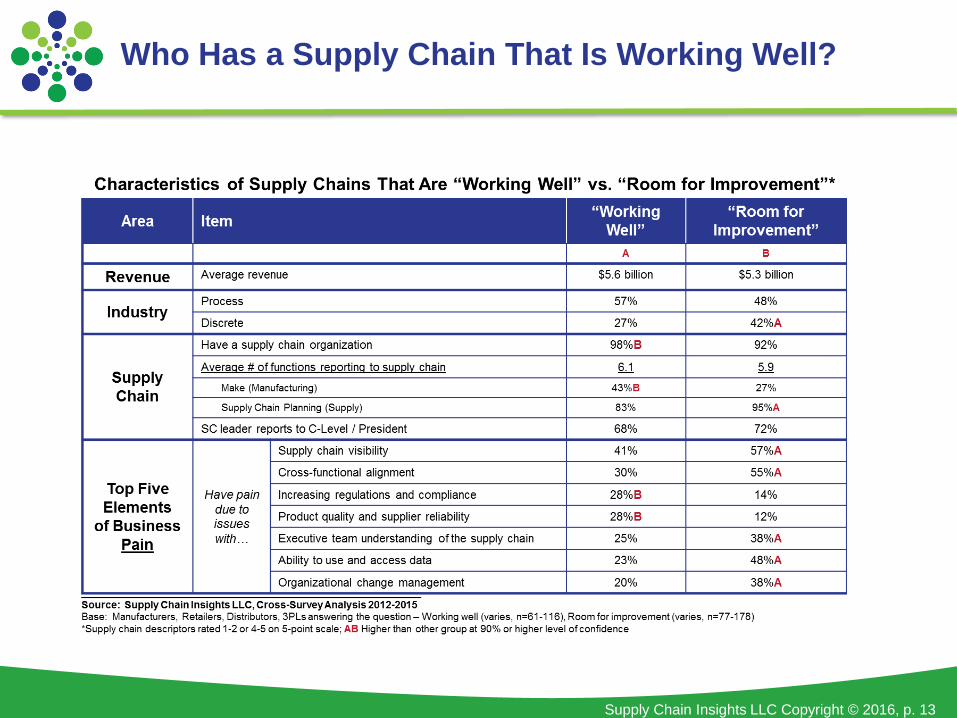
Who Has a Supply Chain That Is Working Well?

Supply Chain Insights LLC Copyright © 2016, p. 14
Customer Priorities
Supply Chain Insights LLC Copyright © 2016, p. 15
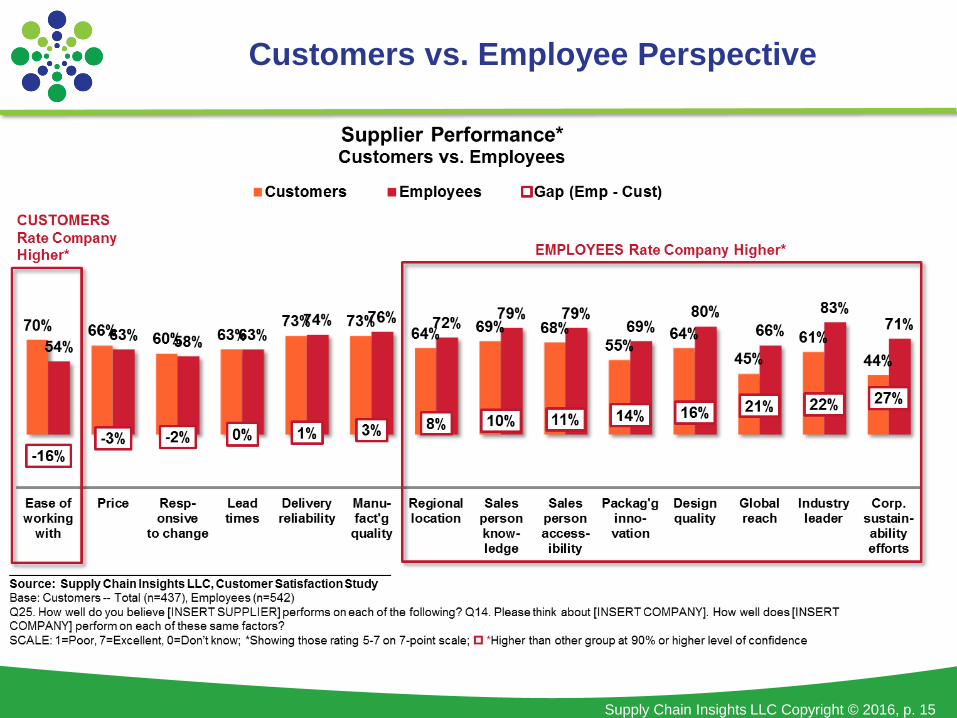
Customers vs. Employee Perspective
Supply Chain Insights LLC Copyright © 2016, p. 16
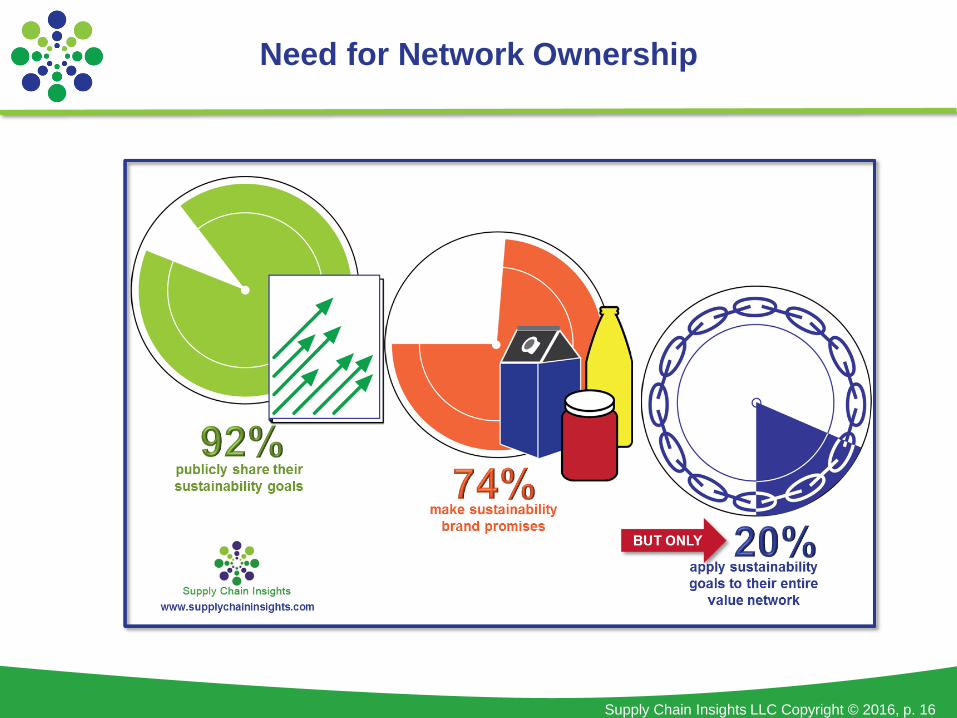
Need for Network Ownership

Supply Chain Insights LLC Copyright © 2016, p. 17
• Need to sense and actively shape demand using channel data.
• Organizations need to build outside-in processes to test and learn.
• Price/volume should be orchestrated across the supply chain.
• Organizational alignment and incentive gaps need to be closed.
• We need to embrace new ways of thinking.
What Needs to Change?

Current State
Supply Chain Insights LLC Copyright © 2016, p. 19
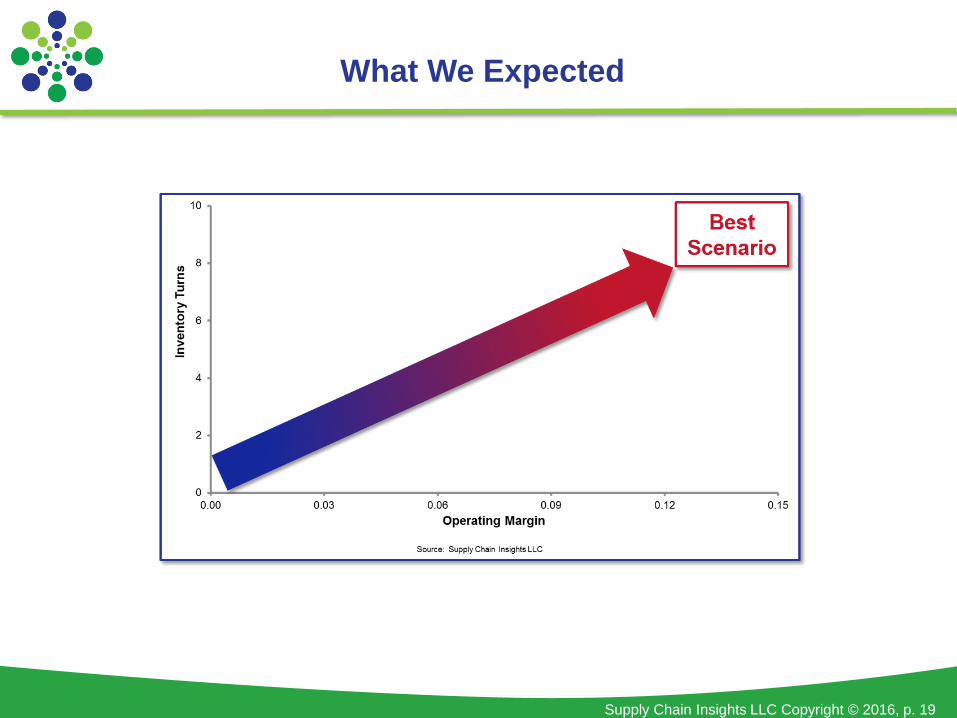
What We Expected
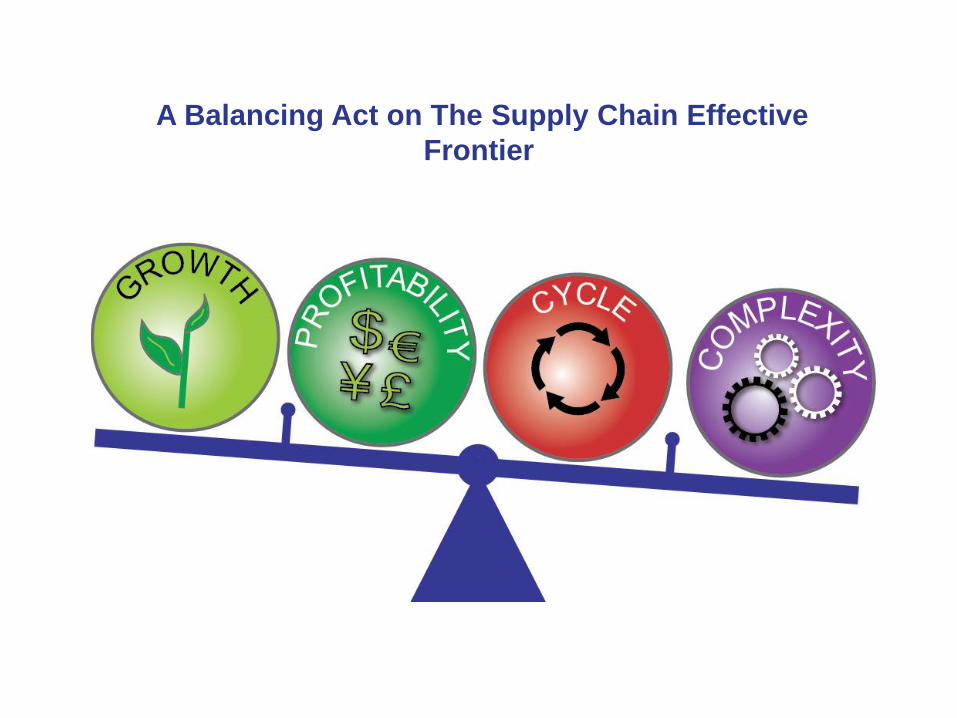
A Balancing Act on The Supply Chain Effective
Frontier

Chemical Industry a Look at Orbit Charts: Dow & DuPont(Inventory Turns and Operating Margin)

A Closer Look at Automotive

Source: Supply Chain Insights LLC, Corporate Annual Reports 2006-2014
2006
4.0
5.0
6.0
7.0
8.0
9.0
10.0
-0.10 0.00 0.10 0.20 0.30 0.40 0.50 0.60
Operating Margin
Eli Lilly and Company Novo Nordisk
20 NVO
0.31, 6.48
201
4
200
6
Best Scenario
LLY
0.24, 8.30
Average (Operating Margin, Inventory Turns)
Inve
nto
ry T
urn
s
A Closer Look at Pharmaceuticals: Novo Nordisk Making
Progress
2006
2014
2006
2014
6
7
8
9
10
11
12
13
0.09 0.10 0.11 0.12 0.13 0.14 0.15 0.16 0.17 0.18 0.19
Inve
nto
ry T
urn
s
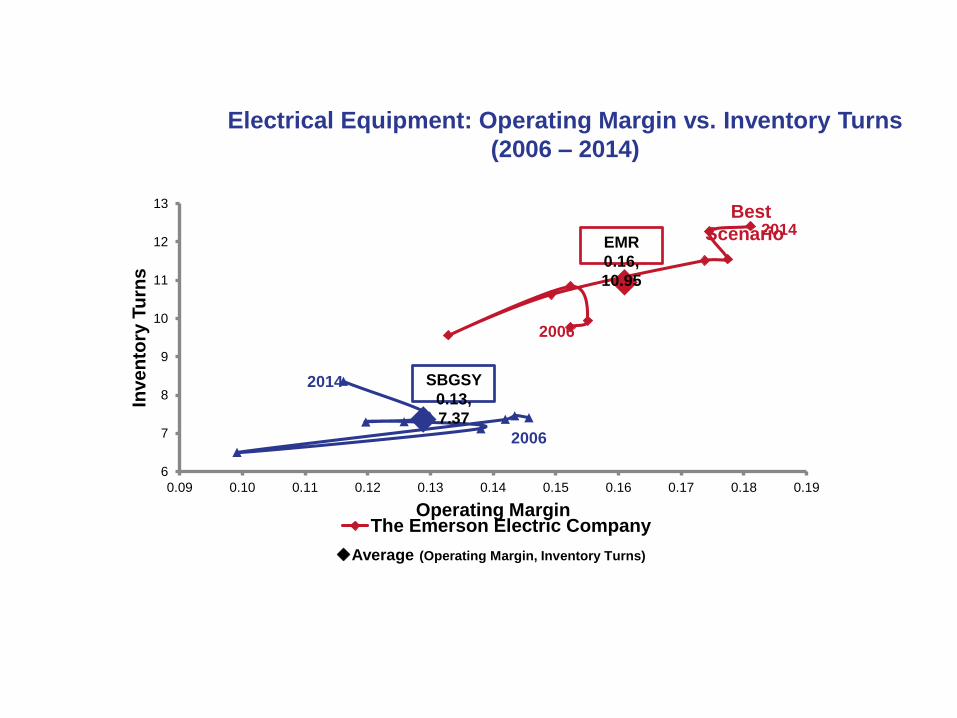
Operating MarginThe Emerson Electric Company
Best
Scenario
SBGSY
0.13,
7.37
EMR
0.16,
10.95
Average (Operating Margin, Inventory Turns)
Source: Supply Chain Insights LLC, Corporate Annual Reports 2006-2014 from YCharts
Electrical Equipment: Operating Margin vs. Inventory Turns
(2006 – 2014)
Supply Chain Insights LLC Copyright © 2016, p. 25
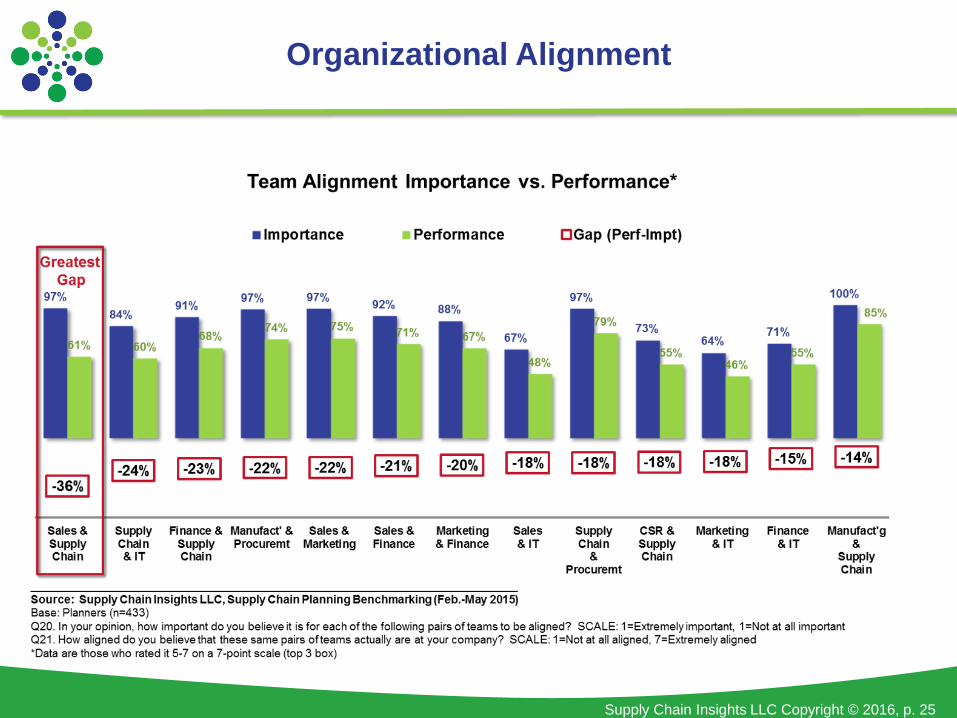
Organizational Alignment
Supply Chain Insights LLC Copyright © 2016, p. 26
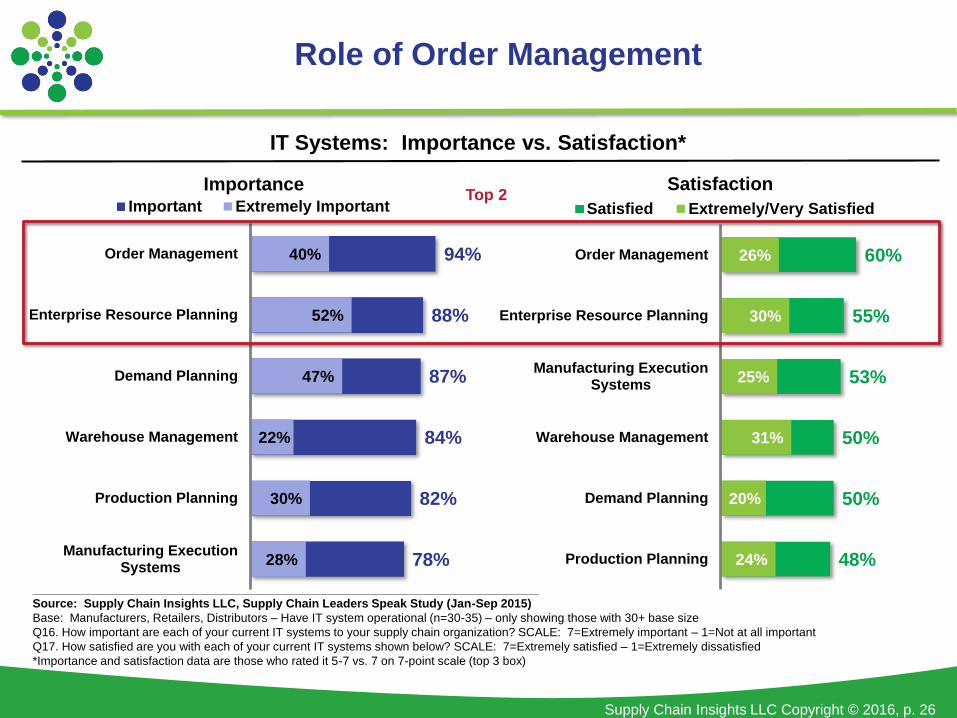
Role of Order Management
94%
88%
87%
84%
82%
78%
40%
52%
47%
22%
30%
28%
Order Management
Enterprise Resource Planning
Demand Planning
Warehouse Management
Production Planning
Manufacturing ExecutionSystems
ImportanceImportant Extremely Important
60%
55%
53%
50%
50%
48%
26%
30%
25%
31%
20%
24%
Order Management
Enterprise Resource Planning
Manufacturing ExecutionSystems
Warehouse Management
Demand Planning
Production Planning
Satisfaction
Satisfied Extremely/Very Satisfied
IT Systems: Importance vs. Satisfaction*
Top 2
____________________________________________________________________________
Source: Supply Chain Insights LLC, Supply Chain Leaders Speak Study (Jan-Sep 2015)
Base: Manufacturers, Retailers, Distributors – Have IT system operational (n=30-35) – only showing those with 30+ base size
Q16. How important are each of your current IT systems to your supply chain organization? SCALE: 7=Extremely important – 1=Not at all important
Q17. How satisfied are you with each of your current IT systems shown below? SCALE: 7=Extremely satisfied – 1=Extremely dissatisfied
*Importance and satisfaction data are those who rated it 5-7 vs. 7 on 7-point scale (top 3 box)

Becoming More Customer
Centric

Supply Chain Insights LLC Copyright © 2016, p. 28
Consumer-driven Supply Networks: Defined by P&G in the 1990s as a shelf-driven, outside-in process defined by successful execution of the two moments of truth. (The two moments of truth are: Was the product in stock? Was the customer delighted?)
Demand-driven Supply Networks: As defined by AMR Research in 2004: a supply chain that senses and translates market signals in real time.
Demand-driven Value Networks: As defined by AMR Research in 2007: A network that senses demand with minimal latency to drive a near-real time response to shape and translate demand.
Market-driven Value Networks: As defined by Supply Chain Insights in 2010: an adaptive network focused on a value-based outcomes that senses, translates, and orchestrates market changes (buy and sell-side markets) bi-directionally with near-real time data to align sell, deliver, make and sourcing organizations outside-in.
Evolution of Demand-driven Concepts
Supply Chain Insights LLC Copyright © 2016, p. 29
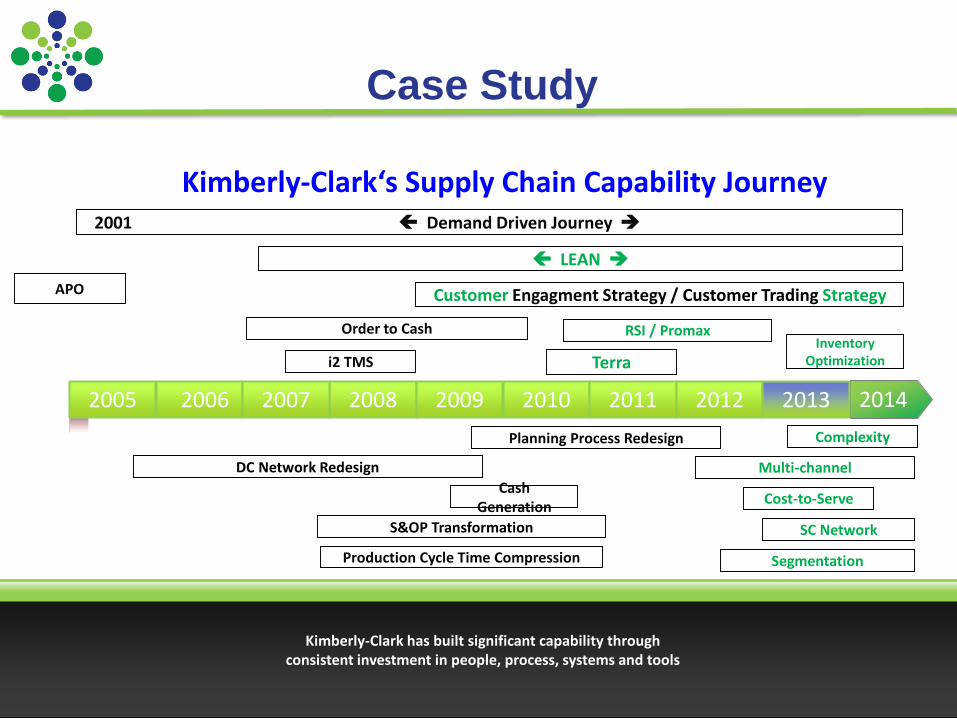
APO
Kimberly-Clark has built significant capability through consistent investment in people, process, systems and tools
20142008 2009 2010 2011 2012 20132005 2006 2007
Kimberly-Clark‘s Supply Chain Capability Journey
Order to Cash
Terra
Complexity
SC Network
RSI / Promax
Planning Process Redesign
DC Network Redesign
Cash Generation
Segmentation
Cost-to-Serve
Inventory Optimization
LEAN
i2 TMS
2001 Demand Driven Journey
Production Cycle Time Compression
S&OP Transformation
Customer Engagment Strategy / Customer Trading Strategy
Multi-channel
Case Study

Supply Chain Insights LLC Copyright © 2016, p. 30
Understanding Demand
• Aligning the lines?
• Pursue clear, simple connections for product and information
flow
Shelf take-away
Forecast
Shipments
5/11/2016
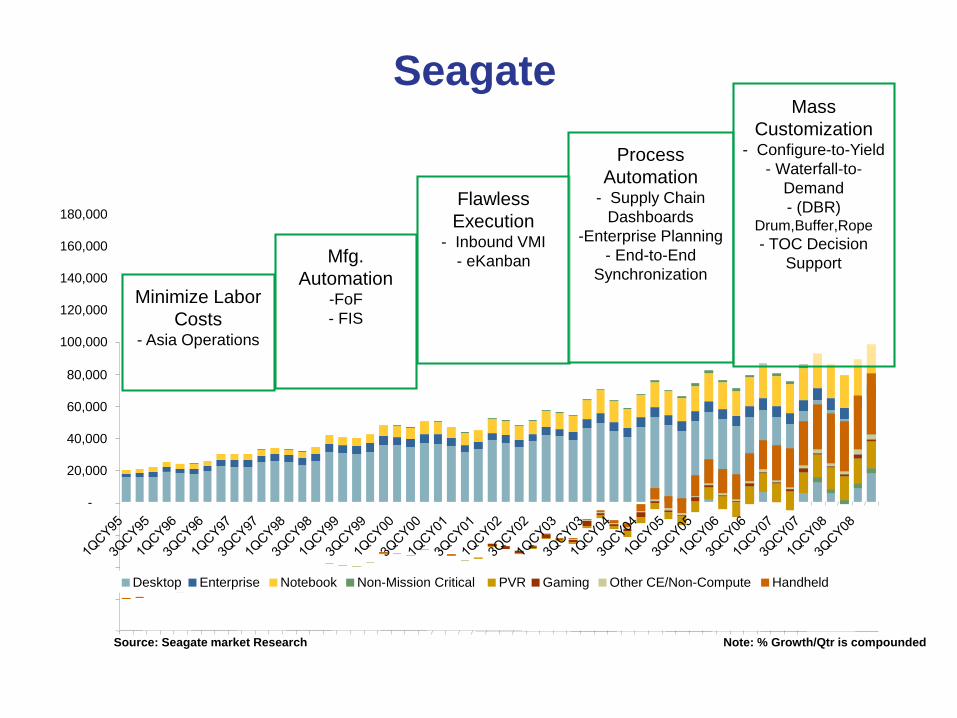
Seagate Supply Chain of the Future
Roadmap
October 2004
Page 31
© Seagate Confidential
Seagate
-
20,000
40,000
60,000
80,000
100,000
120,000
140,000
160,000
180,000
Desktop Enterprise Notebook Non-Mission Critical PVR Gaming Other CE/Non-Compute Handheld
Note: % Growth/Qtr is compoundedSource: Seagate market Research
Minimize Labor
Costs- Asia Operations
Mfg.
Automation-FoF
- FIS
Flawless
Execution- Inbound VMI
- eKanban
Process
Automation- Supply Chain
Dashboards
-Enterprise Planning
- End-to-End
Synchronization
Mass
Customization- Configure-to-Yield
- Waterfall-to-
Demand
- (DBR) Drum,Buffer,Rope
- TOC Decision
Support

Many Barriers To Adoption
In The End To End Supply Chain
Channels & Customers Inside The Enterprise Suppliers & Service Providers
Reluctance To Share
Data
Immature &
Inadequate Systems
Slow Internal
Processes
Many Battlefronts
Win-Lose Mentality
Metrics Split, Conflicting
Rewards Based On
Legacy Drivers
Petty Kingdoms & Perks
Slow/No Information
Sharing
Attitudes Stuck In The
Past
Silos Of Optimization
Reluctance To Share
Data
Immature &
Inadequate Systems
Slow Internal
Processes
Many Battlefronts
Win-Lose Mentality
Channels &
Customers
Product
Marketing
Supply Chain
Planning
Finance
Sales
R&D
Logistics
Manufacturing
& Operations
Suppliers &
Service Providers
Sourcing &
Procurement

Building Strong Channel
Relationships

Supply Chain Insights LLC Copyright © 2016, p. 34
SHARED
VISION+ SKILLS + INCENTIVE + RESOURCES + PLAN + LEADERSHIP = CHANGE
SKILLS + INCENTIVE + RESOURCES + PLAN = CONFUSION
SHARED
VISION+ INCENTIVE + RESOURCES + PLAN + LEADERSHIP = ANXIETY
SHARED
VISION+ SKILLS + INCENTIVE + RESOURCES + LEADERSHIP =
FALSE
STARTS
SHARED
VISION+ SKILLS + INCENTIVE + PLAN + LEADERSHIP = FRUSTRATION
SHARED
VISION+ SKILLS + RESOURCES + PLAN + LEADERSHIP =
GRADUAL
CHANGE
Source: J.P. Kotter
Collaboration: The Right Stuff
Bar codes were first used at Marsh Supermarket in 1968
Pull Push
Cu
stom
ers
an
d C
on
sum
ers
Channel
Demand
&
Demand
Management
Demand
Translation
Reliable,
Profitable
Response from
Supply Based
on Demand
Su
pp
liers
Demand Visibility Supply Visibility
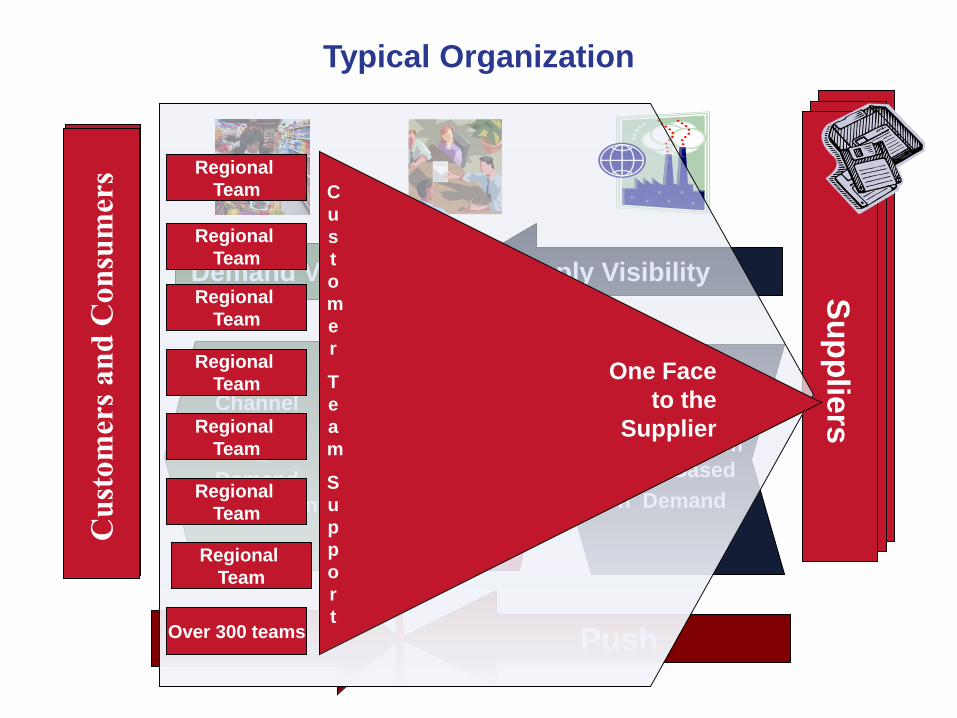
Typical Organization
Regional
Team
Regional
Team
Regional
Team
Regional
Team
Regional
Team
Regional
Team
Regional
Team
Over 300 teams
One Face
to the
Supplier
C
u
s
t
o
m
e
r
T
e
a
m
S
u
p
p
o
r
t
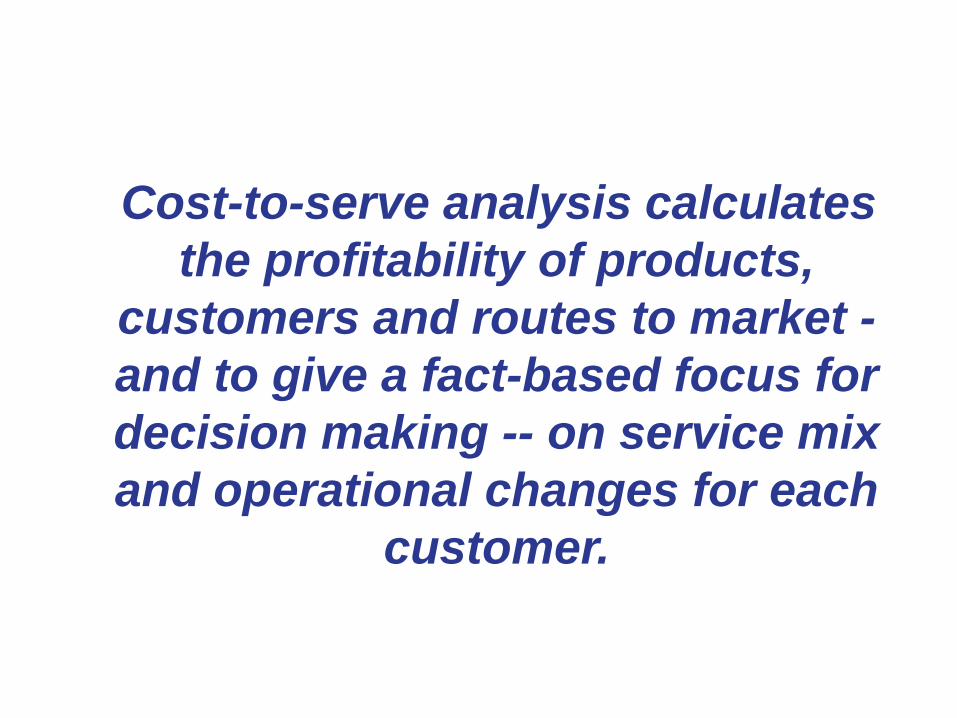
Cost-to-serve analysis calculates
the profitability of products,
customers and routes to market -
and to give a fact-based focus for
decision making -- on service mix
and operational changes for each
customer.

Supply Chain Insights LLC Copyright © 2016, p. 38
Cost to Serve in Consumer Products
What Is Demand Driven?
Supply Chain Insights LLC Copyright © 2016, p. 40
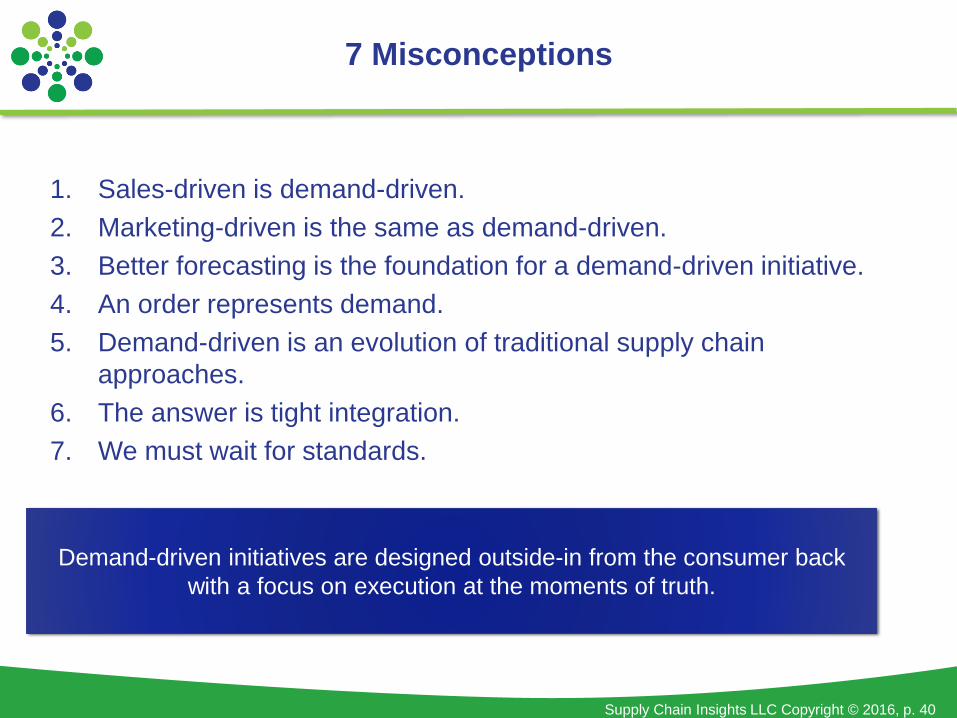
1. Sales-driven is demand-driven.
2. Marketing-driven is the same as demand-driven.
3. Better forecasting is the foundation for a demand-driven initiative.
4. An order represents demand.
5. Demand-driven is an evolution of traditional supply chain
approaches.
6. The answer is tight integration.
7. We must wait for standards.
7 Misconceptions
Demand-driven initiatives are designed outside-in from the consumer back
with a focus on execution at the moments of truth.

Supply Chain Insights LLC Copyright © 2016, p. 41
Customer-driven Supply Networks: Defined by P&G in the 1990s as a shelf-driven, outside-in process defined by successful execution of the two moments of truth. (The two moments of truth are: Was the product in stock? Was the customer delighted?)
Demand-driven Supply Networks: As defined by AMR Research in 2004: a supply chain that senses and translates market signals in real time.
Demand-driven Value Networks: As defined by AMR Research in 2007: A network that senses demand with minimal latency to drive a near-real time response to shape and translate demand.
Market-driven Value Networks: As defined by Supply Chain Insights in 2010: an adaptive network focused on a value-based outcomes that senses, translates, and orchestrates market changes (buy and sell-side markets) bi-directionally with near-real time data to align sell, deliver, make and sourcing organizations outside-in.
Evolution of Demand-driven Concepts

Supply Chain Insights LLC Copyright © 2016, p. 42
• Demand Sensing: The reduction of time to sense consumer purchase
and take away. The translation of channel pull to outside-in flows.
• Demand Latency: The latency of demand signal due to demand
translation from shelf take-away to order receipt.
• Demand Translation: The translation of demand by role (sell, make,
within the organization.
• Adaptive Buffers: In the demand-driven supply chain, adaptive buffers
flex to accommodate changes in flows.
• Synchronization. The demand signal must be connected from node to
node in the supply chain and then mapped. The most frequently
mapped data elements are product hierarchies, time/calendars, and
locations.
• Harmonization. Data harmonization enables data of differing granularity
and structures to be harmonized into a common database.
Demand Terminology

0.0
0.5
1.0
1.5
2.0
2.5
3.0
WK 1
WK 2
WK 3
WK 4
WK 5
WK 6
WK 7
WK 8
WK 9
WK 1
0
WK 1
1
WK 1
2
WK 1
3
WK 1
4
WK 1
5
WK 1
6
WK 1
7
WK 1
8
WK 1
9
WK 2
0
WK 2
1
WK 2
2
WK 2
3
WK 2
4
WK 2
5
WK 2
6
WK 2
7
WK 2
8
WK 2
9
WK 3
0
WK 3
1
WK 3
2
WK 3
3
WK 3
4
WK 3
5
WK 3
6
WK 3
7
WK 3
8
WK 3
9
WK 4
0
WK 4
1
WK 4
2
WK 4
3
WK 4
4
WK 4
5
WK 4
6
WK 4
7
WK 4
8
WK 4
9
WK 5
0
WK 5
1
WK 5
2
WM WEEK
PO
S B
AS
E I
ND
EX
Profile CA-40 MID-N SOUTH NORTH PAC
Aligning Demand Patterns

Supply Chain Insights LLC Copyright © 2016, p. 44
For Both Sales and Purchase Orders,
Over Half of Orders are Exchanged via EDI/XML

Supply Chain Insights LLC Copyright © 2016, p. 45
Greatest Gaps in Visibility
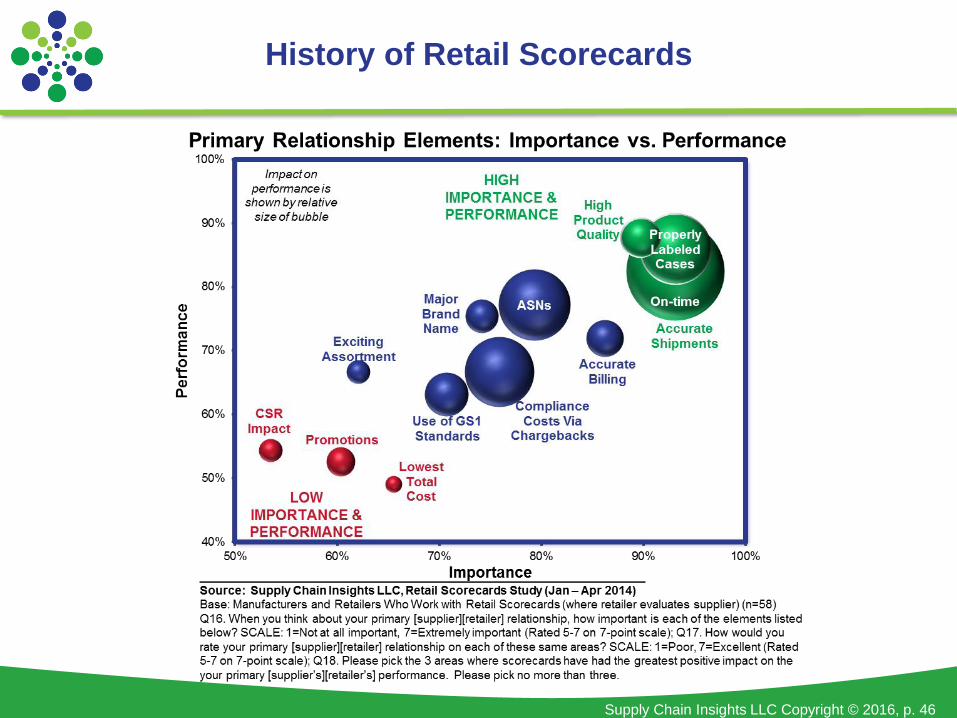
Supply Chain Insights LLC Copyright © 2016, p. 46
History of Retail Scorecards
Making the Digital Pivot
Supply Chain Insights LLC Copyright © 2016, p. 48
Automation of the four moments of truth in the
purchase cycle through the use of social, mobile,
digital, and analytics technologies.
Digital Path to Purchase

Supply Chain Insights LLC Copyright © 2016, p. 49
Four Moments of Truth
The List:• Digital
Recipe
• Digital
Coupons
• Online
Rating and
Reviews
The Basket:• Shelf-sensing
• QR Codes
• In-store
coupons
• IP Address
Sensing
• Localized
assortment
The Check-out• Downstream
Data
• Loyalty Data
Usage• Sentiment Data
• Ratings and
Reviews
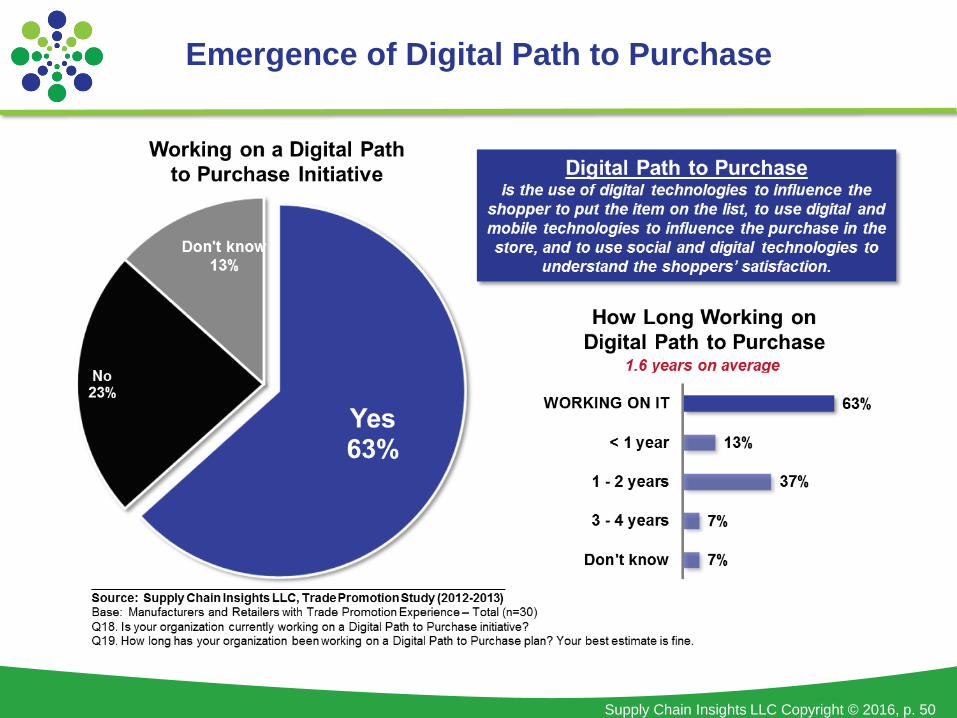
Supply Chain Insights LLC Copyright © 2016, p. 50
Emergence of Digital Path to Purchase

Supply Chain Insights LLC Copyright © 2016, p. 51
Funding for the Digital Path to Purchase

Supply Chain Insights LLC Copyright © 2016, p. 52
Thank you for letting
BudHunters know
about your beer being
out of stock.
We’re working to get
your Bud Light for you.
If you’re in a hurry, why
not grab some Bud
Select?
“Where’s My Bud!” – The Process Flow
New text
message to
612-961-
7802:
A customer
at Denny
and Doug’s
Liquor …

Supply Chain Insights LLC Copyright © 2016, p. 53
Where’s my Bud?
Finally make it to the aisle, and…
Where’s My Bud?
Use your mobile phone to snap the tag
above to get your Bud!
http://demos.dennyboynton.com/RetailLocation
OutOfStock.aspx
Supply Chain Insights LLC Copyright © 2016, p. 54
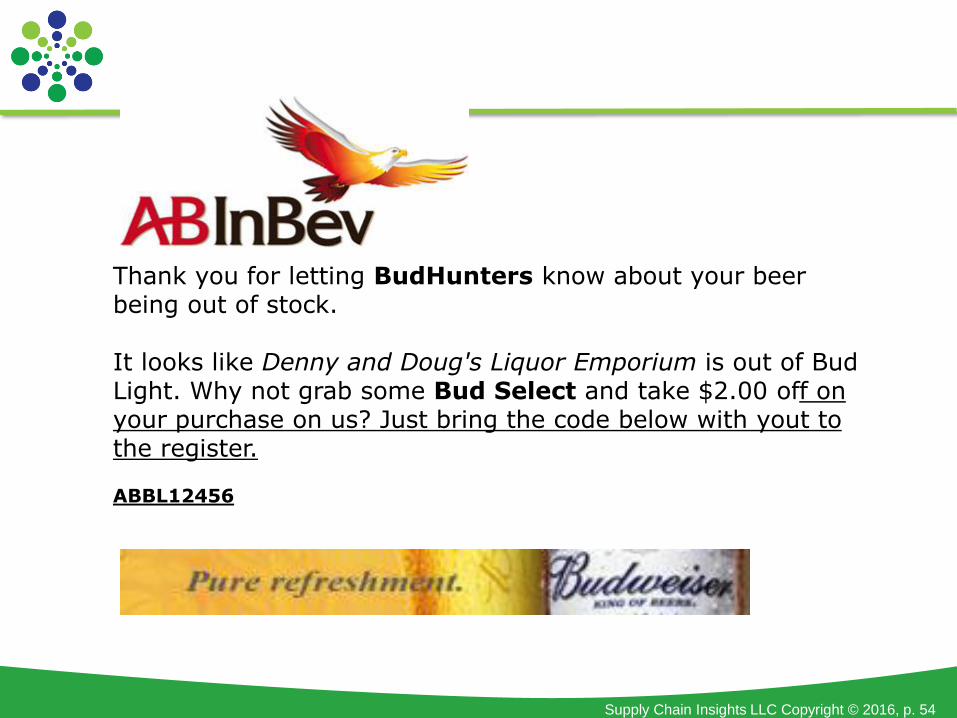
Thank you for letting BudHunters know about your beer being out of stock.
It looks like Denny and Doug's Liquor Emporium is out of Bud Light. Why not grab some Bud Select and take $2.00 off on your purchase on us? Just bring the code below with yout to the register.
ABBL12456

Supply Chain Insights LLC Copyright © 2016, p. 55
Retailer Experience
New text message to
612-961-7802:
A customer at Denny
and Doug’s Liquor
Emporium has just
snapped a tag. You’re
out of stock on Bud
Light.
Please contact your
wholesaler.
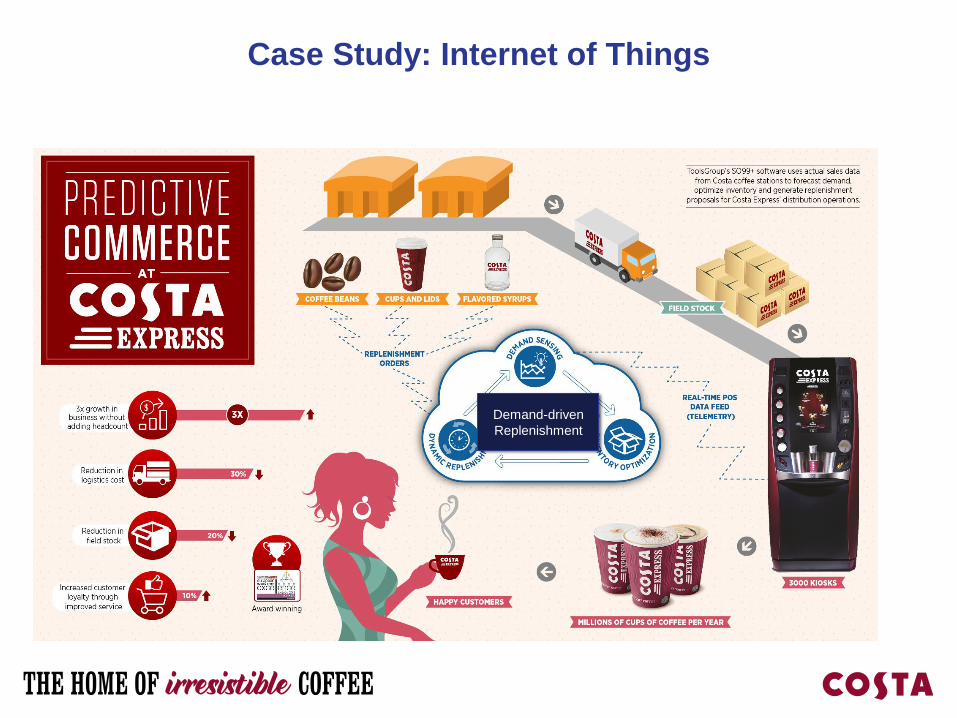
Case Study: Internet of Things
Demand-driven
Replenishment
Supply Chain Insights LLC Copyright © 2016, p. 57
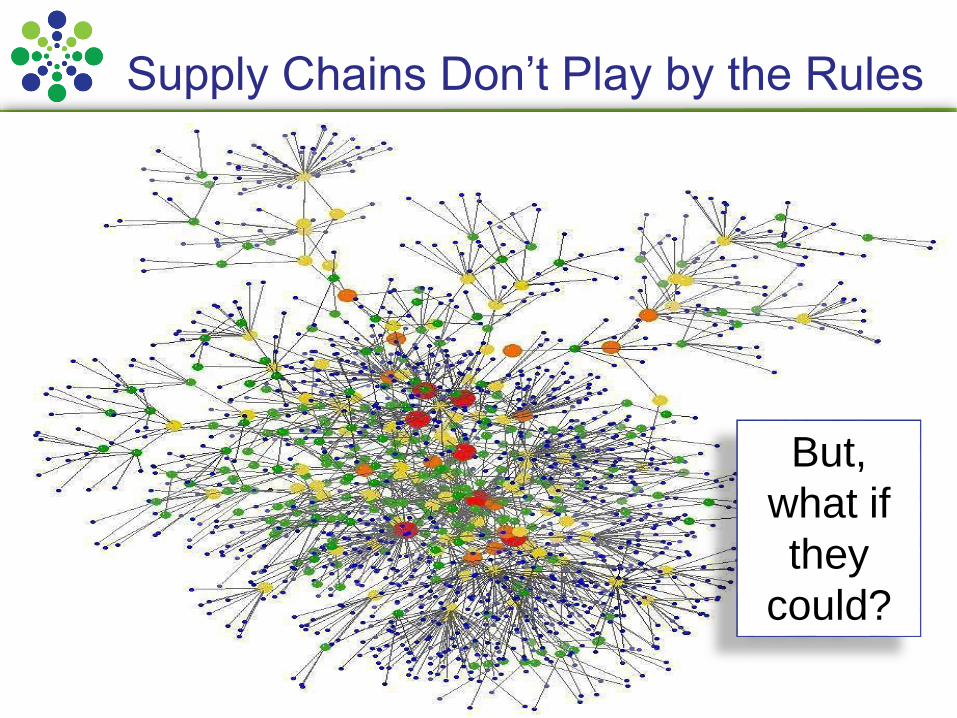
Supply Chains Don’t Play by the Rules
57
But,
what if
they
could?
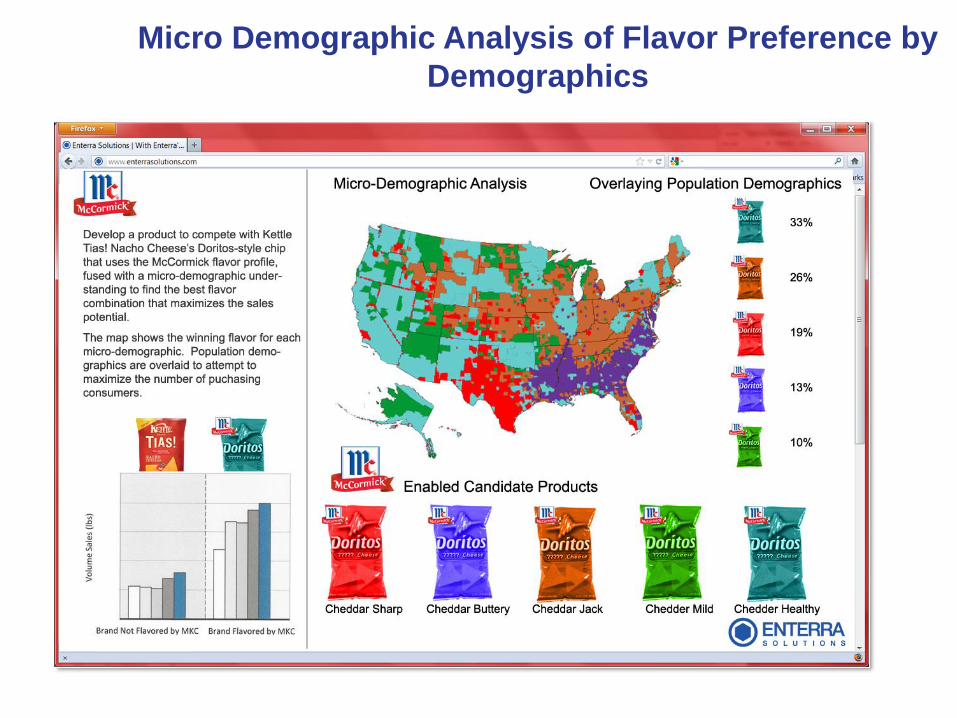
Micro Demographic Analysis of Flavor Preference by
Demographics

Supply Chain Insights LLC Copyright © 2016, p. 59
Opportunity
at the Intersection
of the Social and Interest Graph(s)

Supply Chain Insights LLC Copyright © 2016, p. 60
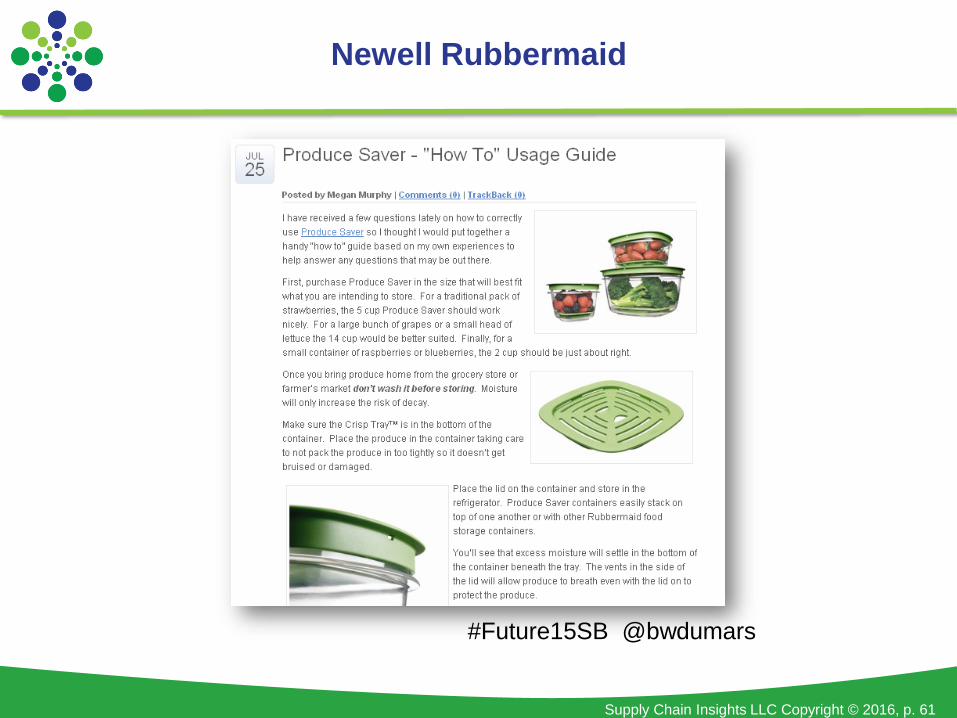
• Newell Rubbermaid
Listening: Newell Rubbermaid
#Future15SB @bwdumars
Supply Chain Insights LLC Copyright © 2016, p. 61
#Future15SB @bwdumars
Newell Rubbermaid

Supply Chain Insights LLC Copyright © 2016, p. 62
Listening: Lenovo

Supply Chain Insights LLC Copyright © 2016, p. 63
0
0
0
0
0
0
0
Canada
-Customer A calls about a blue screen on a Yoga
-Customer B posts on Facebook about his X220’s AC/DC adapter issues
Large Enterprise Client experiences 5 keyboard malfunctions in their latest
shipment. Complaints received through account executive
[Critical Situation]
Brazil
-Customer F submits a service from on
esupport.lenovo.com regarding
their W530 hard drive
Morocco
-Customers G & H comment on their
X220’s electrical issues on Twitter.com
-Customer I called about Yoga screen
issues
Australia
-Customer J write a review on
NewEgg.com about AC/DC adapter
issues on X220
-Customer K had an eChat with Lenovo
about Yoga screen issues
China
-Customer L wrote on Weibo about
Yoga screen issues
-Customer M calls about a Tablet 8battery issues
Voice of Customer Comes in Many Forms
USA
-Customers C & D write X220 product
reviews on amazon.com and mention
issues with AC/DC adapters
-Customer E posts on
forums.lenovo.com that they are
experiencing blue screens on their Yoga

Supply Chain Insights LLC Copyright © 2016, p. 64
0
0
0
0
0
0
0
Lenovo
- 6 recorded issues about X220’s
AC/DC adapter
- 5 recorded issues about
keyboard issues on X1 Carbon
- 5 recoded issues about Yoga
screen
- 1 recorded issue about W530
hard-drive
- 1 recorded issue about Tablet 8
battery
One Voice – A Single View of Perceptual Quality
Supply Chain Insights LLC Copyright © 2016, p. 65
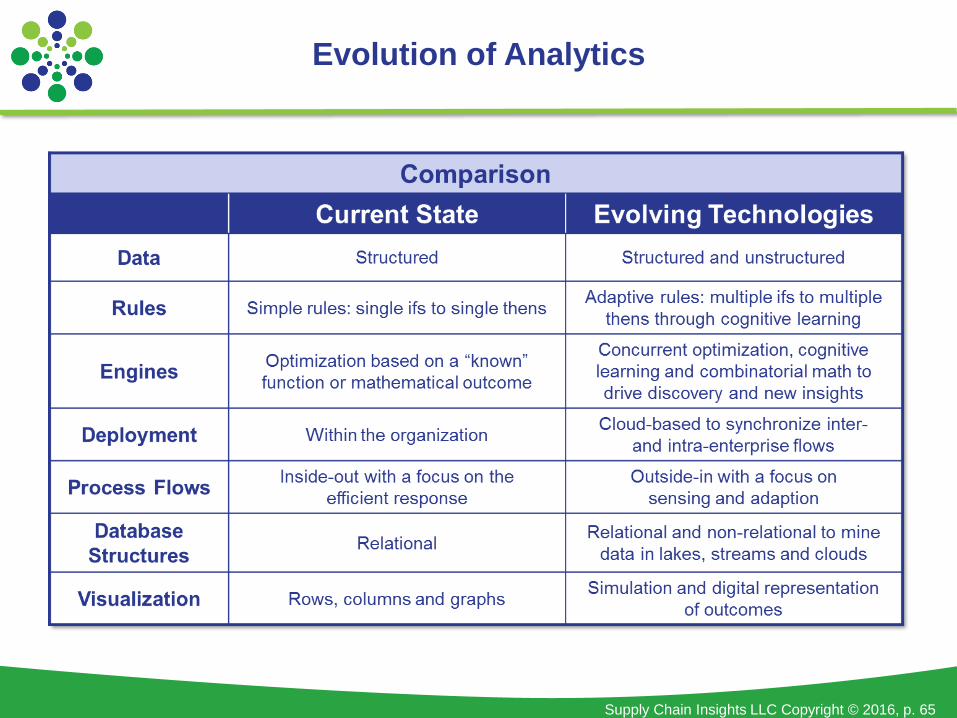
Evolution of Analytics
Supply Chain Insights LLC Copyright © 2016, p. 66
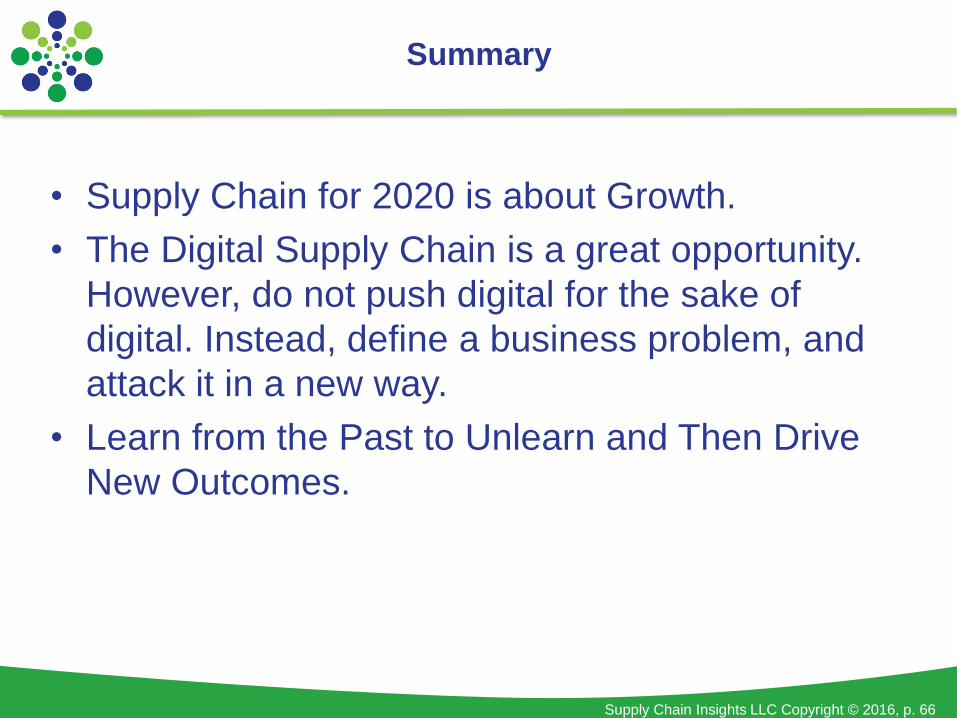
• Supply Chain for 2020 is about Growth.
• The Digital Supply Chain is a great opportunity.
However, do not push digital for the sake of
digital. Instead, define a business problem, and
attack it in a new way.
• Learn from the Past to Unlearn and Then Drive
New Outcomes.
Summary

Supply Chain Insights LLC Copyright © 2016, p. 69
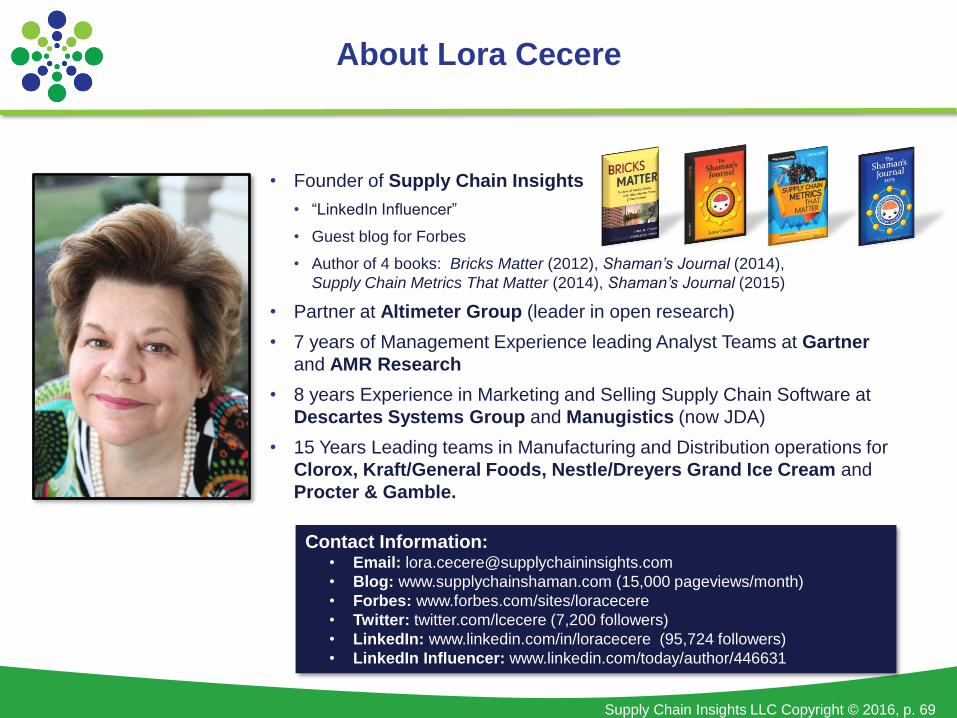
About Lora Cecere
• Founder of Supply Chain Insights
• “LinkedIn Influencer”
• Guest blog for Forbes
• Author of 4 books: Bricks Matter (2012), Shaman’s Journal (2014),
Supply Chain Metrics That Matter (2014), Shaman’s Journal (2015)
• Partner at Altimeter Group (leader in open research)
• 7 years of Management Experience leading Analyst Teams at Gartner
and AMR Research
• 8 years Experience in Marketing and Selling Supply Chain Software at
Descartes Systems Group and Manugistics (now JDA)
• 15 Years Leading teams in Manufacturing and Distribution operations for
Clorox, Kraft/General Foods, Nestle/Dreyers Grand Ice Cream and
Procter & Gamble.
Contact Information: • Email: [email protected]
• Blog: www.supplychainshaman.com (15,000 pageviews/month)
• Forbes: www.forbes.com/sites/loracecere
• Twitter: twitter.com/lcecere (7,200 followers)
• LinkedIn: www.linkedin.com/in/loracecere (95,724 followers)
• LinkedIn Influencer: www.linkedin.com/today/author/446631