Embed Size (px)
Citation preview

TOPIC
FINANCIAL ANALYSIS OF *RAHIM TEXTILE* (2009-2013)
1. Hossain, Mohammad Sazzad ID: 12-21618-22. Haque, Nadia ID: 12-21865-23. Islam, Shafiqul ID: 12-21987-2
*FINANCIAL MANAGEMENT*TEACHER: ABEDIN,MD
JOYNAL SECTION: D
INTRODUCTION
To evaluate the firm’s financial performance. To compare the strength and weakness of
various company . To measure the company productivity. To identify the opportunity and risk in the
company performance. To review the financial performance Provide the key information regarding the
companies financial performance . Help to take the decision to invest the money.
Company Overview Chairman - A. Matin Chowdhury. Incorporate - December 31, 1981( as
Private Limited Company) Commercial Operation - July 1, 1987 Convert into Public Limited Company -
March 28, 1988 . Listing in stock exchange - 29 March 1988Number of share holder - 1723Main Products - High quality knit & woven
dyed and printed fabric.

'RATIO ANALYSIS'
There are four types of Ratio1. Liquidity Ratio2. Leverage Ratio3. Turnover Ratio4. Profitability Ratio

Liquidity ratio:
There are three types of Liquidity Ratio
I. Current RatioII. Quick RatioIII.Cash Ratio
Current ratioFormula: current asset/current liabilities
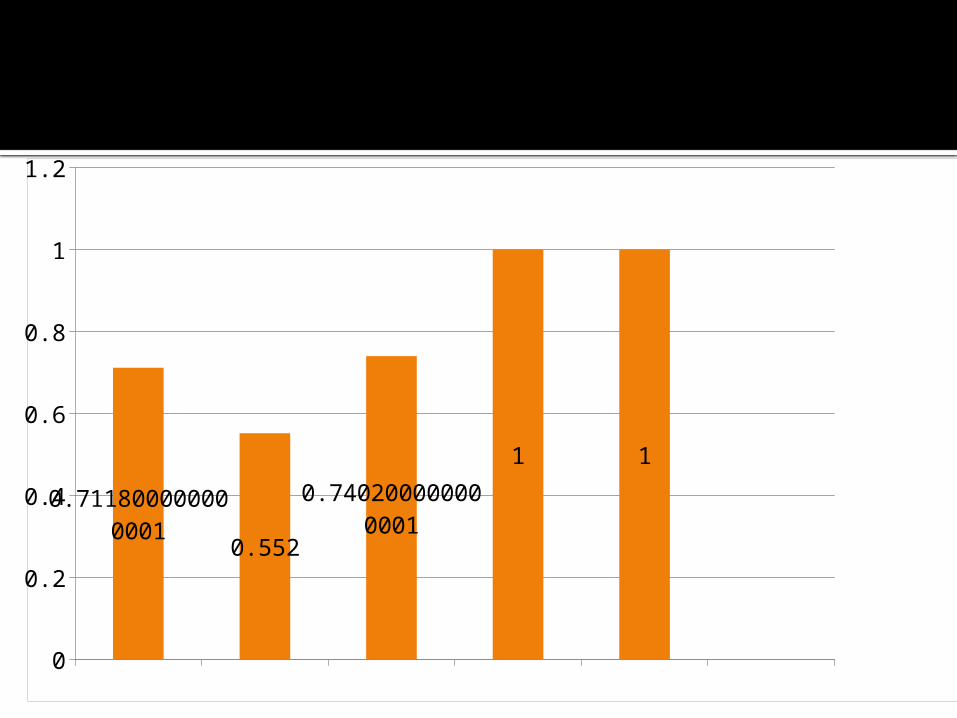
2009 2010 2011 2012 20130
0.2
0.4
0.6
0.8
1
1.2
0.711800000000001 0.552
0.740200000000001
1 1

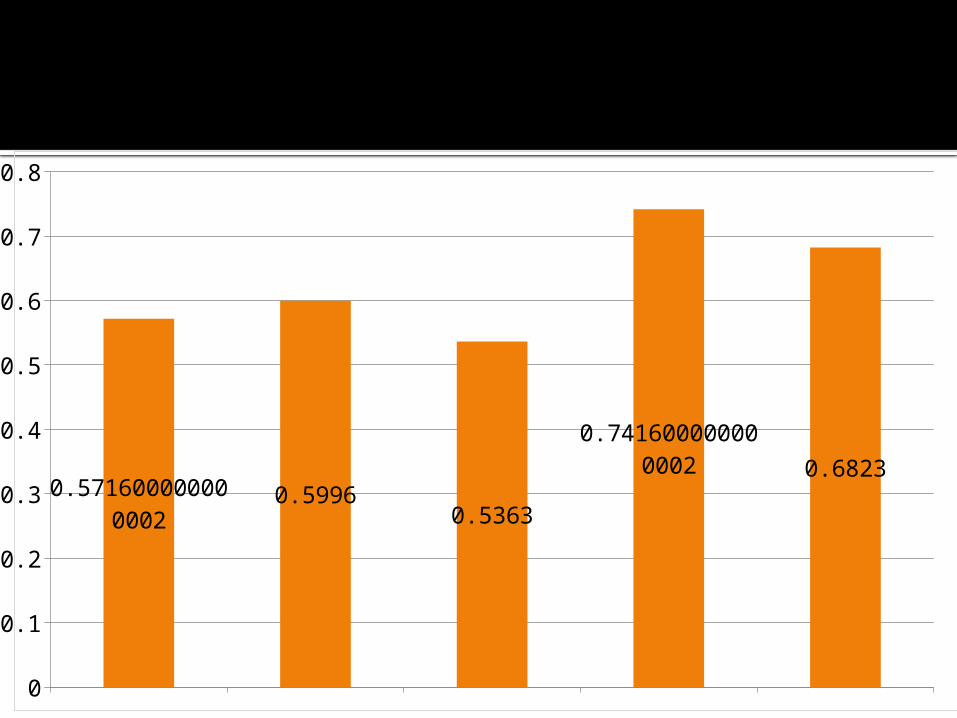
Quick ratio
Formula: current asset-inventories/current liabilities.
2009 2010 2011 2012 20130
0.1
0.2
0.3
0.4
0.5
0.6
0.7
0.8
0.571600000000002
0.59960.5363
0.741600000000002 0.6823

Cash ratio:
formula: cash + cash equivalent /current liabilities

2009 2010 2011 2012 20130
0.02
0.04
0.06
0.08
0.1
0.12
0.14
0.16
0.18
0.0892 0.0790000000000002 0.0791
0.1129
0.158
Leverage ratio:
Debt to equity ratio Formula: Total Debt/ shareholder
equity
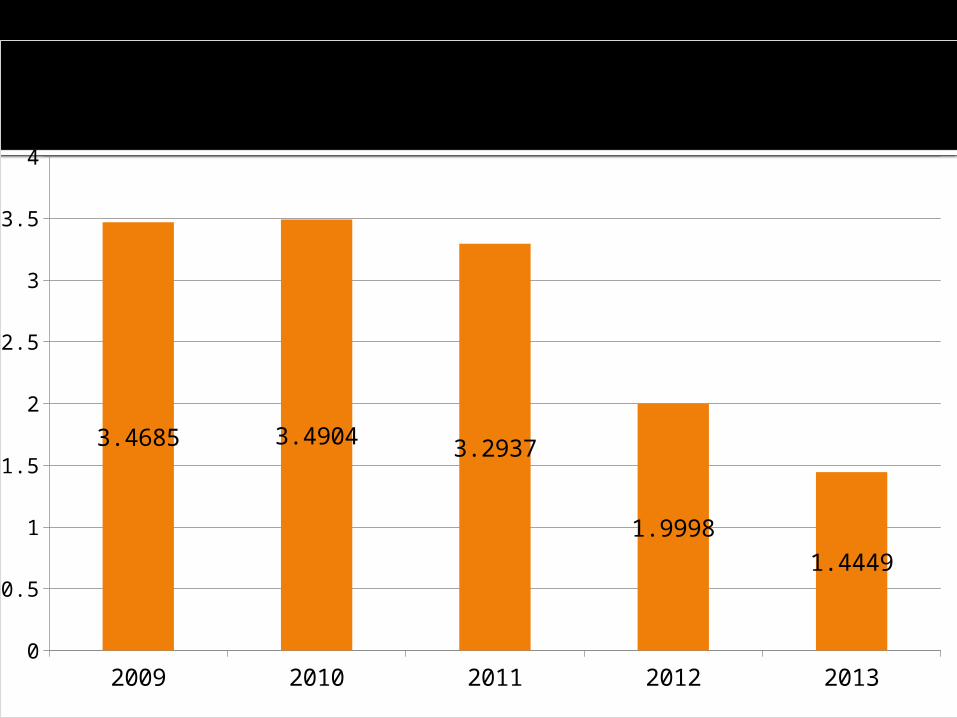
2009 2010 2011 2012 20130
0.5
1
1.5
2
2.5
3
3.5
4
3.4685 3.4904 3.2937
1.99981.4449

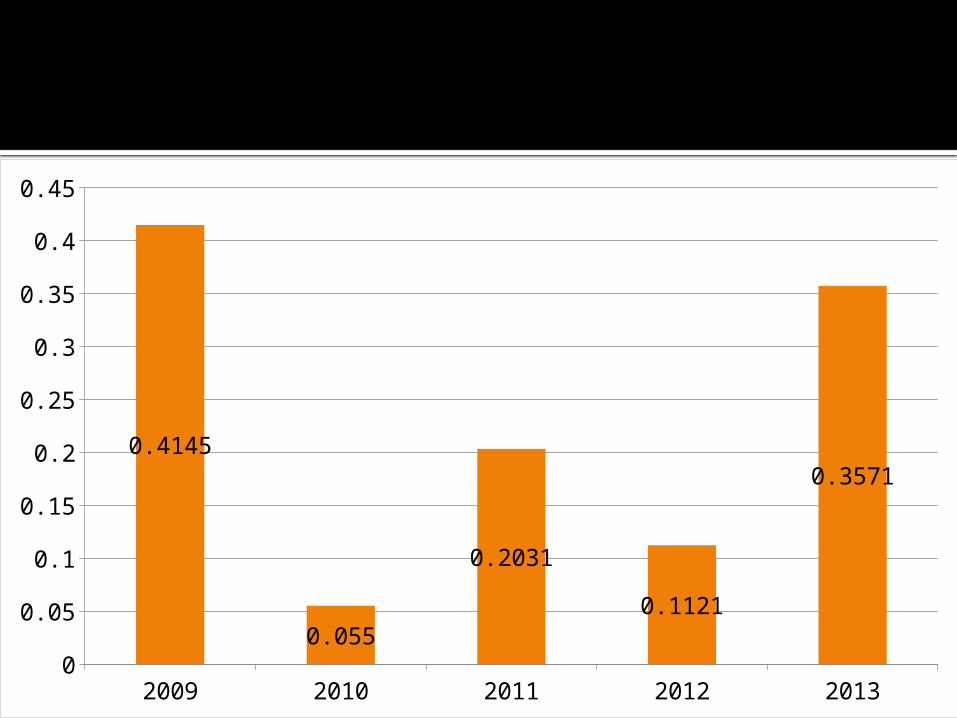
Interest coverage ratio:
Formula: earnings before interest and tax/interest expense
2009 2010 2011 2012 20130
0.05
0.1
0.15
0.2
0.25
0.3
0.35
0.4
0.45
0.4145
0.055
0.20310.1121
0.3571

Debt to capital ratio:
formula: Total Debt/shareholders equity

2009 2010 2011 2012 20130
0.1
0.2
0.3
0.4
0.5
0.6
0.7
0.8
0.9
0.776300000000002
0.777300000000002
0.767100000000002 0.6666000000000
03 0.591

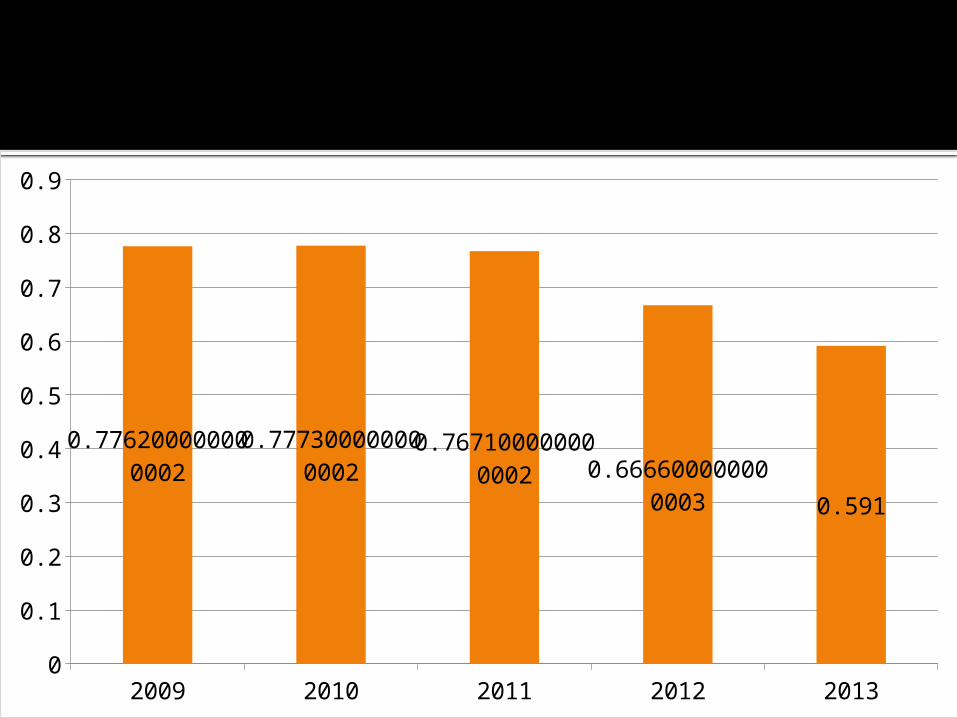
Debt to Total Assets:
Formula: (short term debt + long term debt) / total asset
2009 2010 2011 2012 20130
0.1
0.2
0.3
0.4
0.5
0.6
0.7
0.8
0.9
0.776200000000002
0.777300000000002
0.767100000000002 0.66660000000
0003 0.591
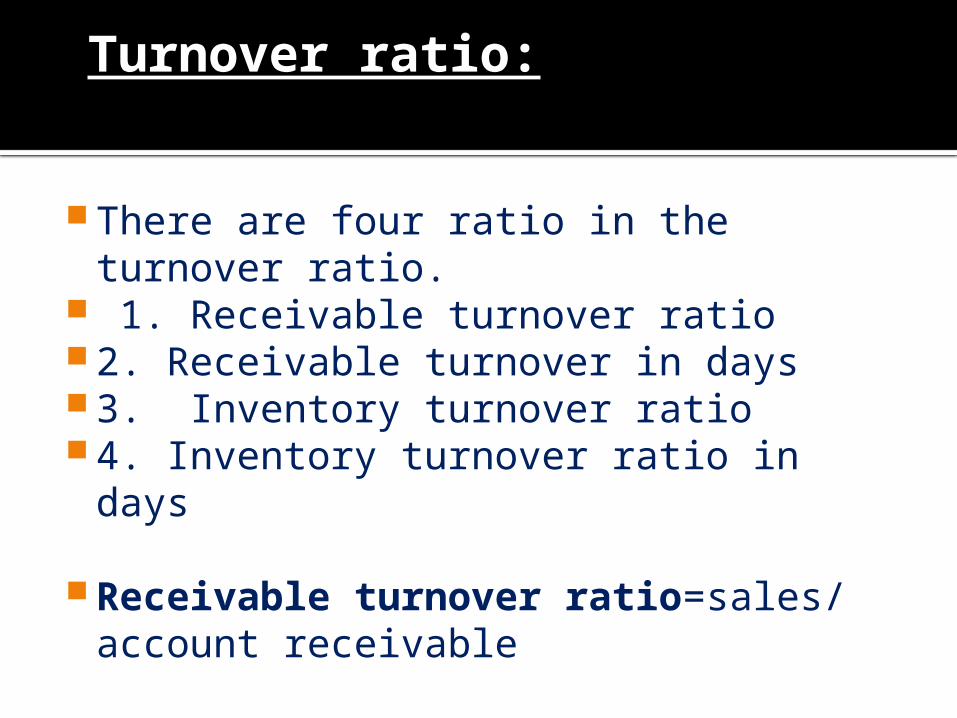
Turnover ratio:
There are four ratio in the turnover ratio.
1. Receivable turnover ratio 2. Receivable turnover in days 3. Inventory turnover ratio 4. Inventory turnover ratio in days
Receivable turnover ratio=sales/ account receivable

year2009 tear2010 year2011 year2012 year20130
1
2
3
4
5
6
7
8
9
10
3.62993.229
4.7498 4.7421
8.7343
Receivable turnover
Series 1
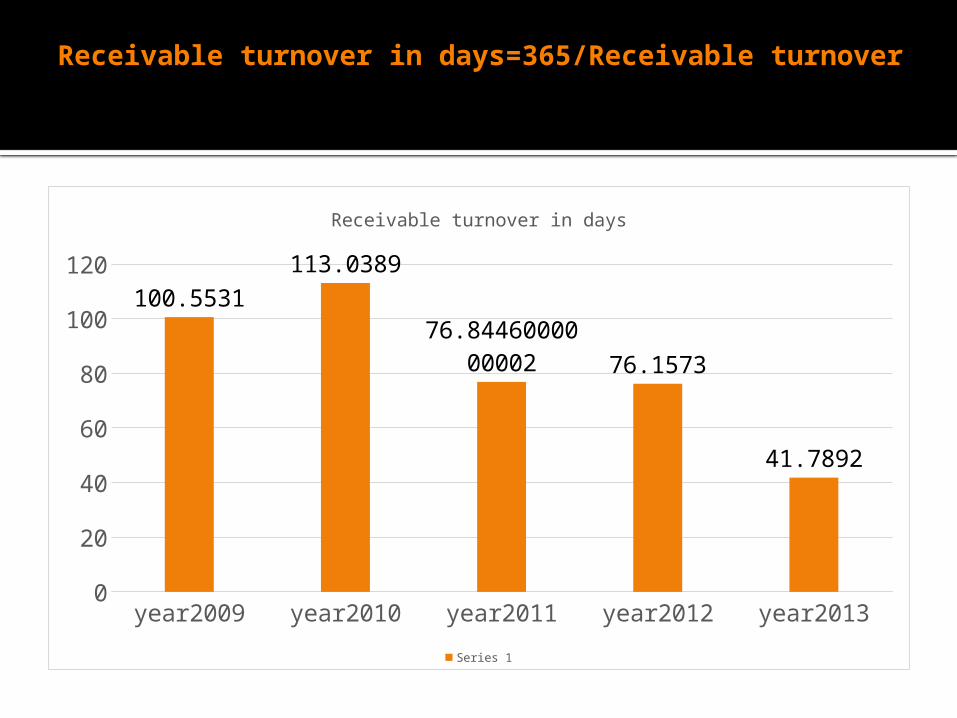
Receivable turnover in days=365/Receivable turnover
year2009 year2010 year2011 year2012 year20130
20
40
60
80
100
120100.5531
113.0389
76.8446000000002 76.1573
41.7892
Receivable turnover in days
Series 1
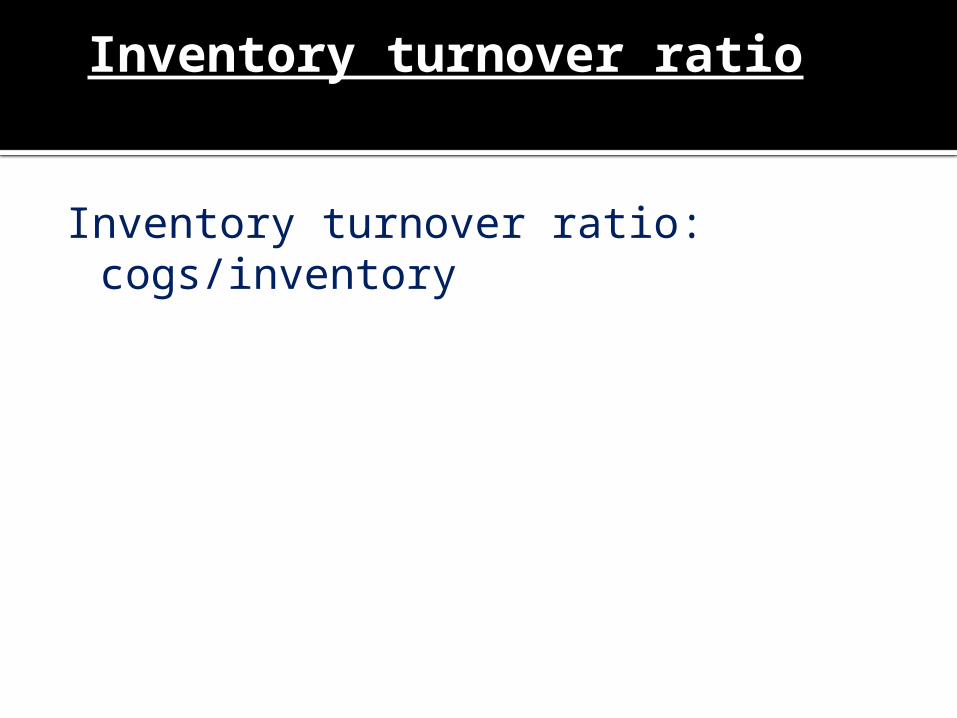
Inventory turnover ratio
Inventory turnover ratio: cogs/inventory

year2009 year2010 yar2011 year2012 year20130
2
4
6
8
10
12
9.56068.7914
7.2482
8.7727
11.049
Invntory turnover
Series 1
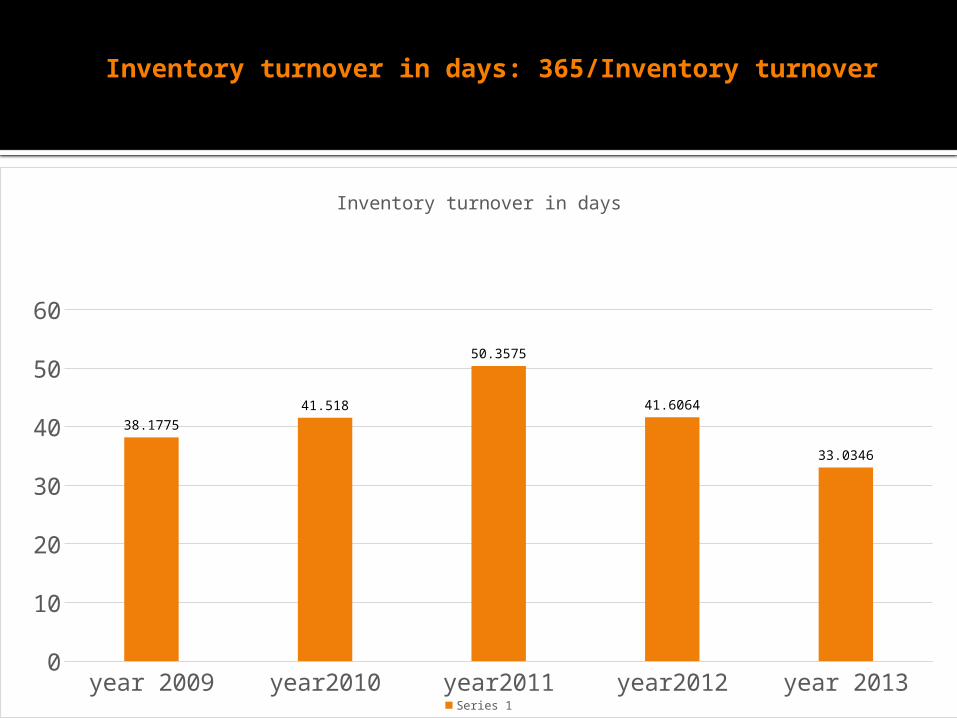
Inventory turnover in days: 365/Inventory turnover
year 2009 year2010 year2011 year2012 year 20130
10
20
30
40
50
60
38.177541.518
50.3575
41.6064
33.0346
Inventory turnover in days
Series 1
Total asset Turnover
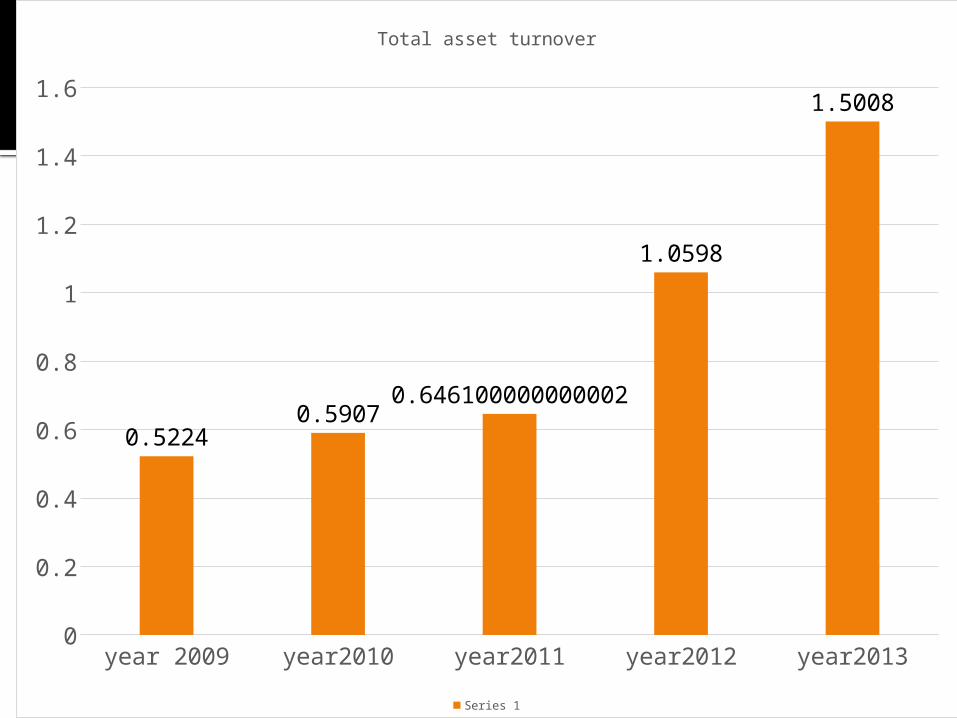
Total asset turnover: Net sales/total assets
year 2009 year2010 year2011 year2012 year20130
0.2
0.4
0.6
0.8
1
1.2
1.4
1.6
0.52240.5907
0.646100000000002
1.0598
1.5008
Total asset turnover
Series 1
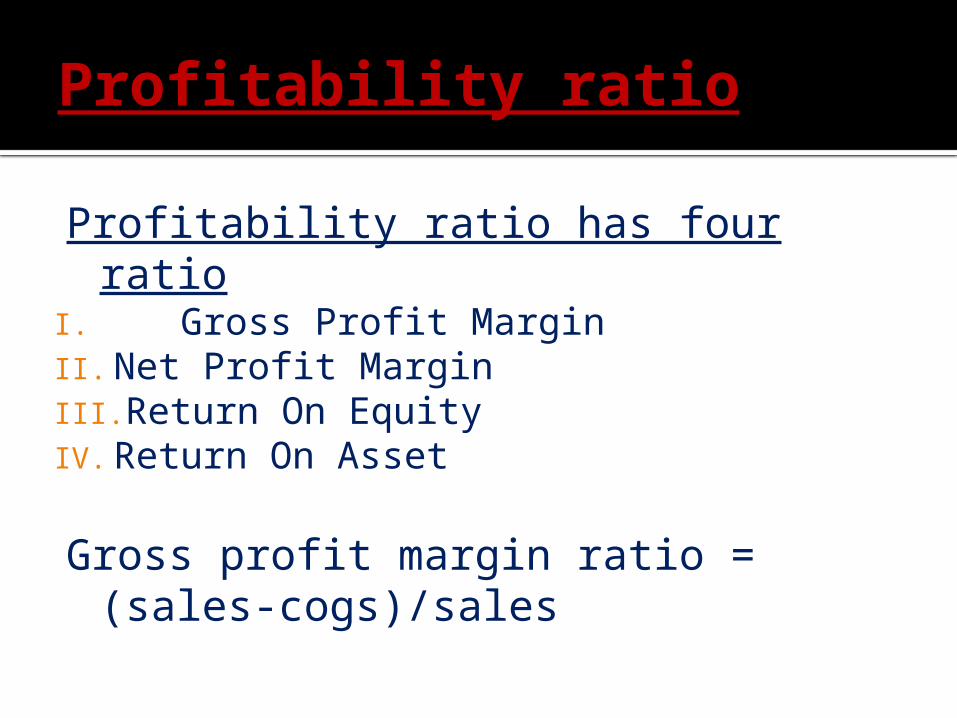
Profitability ratio
Profitability ratio has four ratioI. Gross Profit MarginII. Net Profit MarginIII. Return On EquityIV. Return On Asset
Gross profit margin ratio = (sales-cogs)/sales

year 2009 year2010 year 2011 year 2012 year 201313
13.514
14.515
15.516
16.517
17.517.07 16.89 16.81
14.49 14.51
gross profit margin
gross profit margin
Net profit margin
Net profit margin ratio= Net income /sales
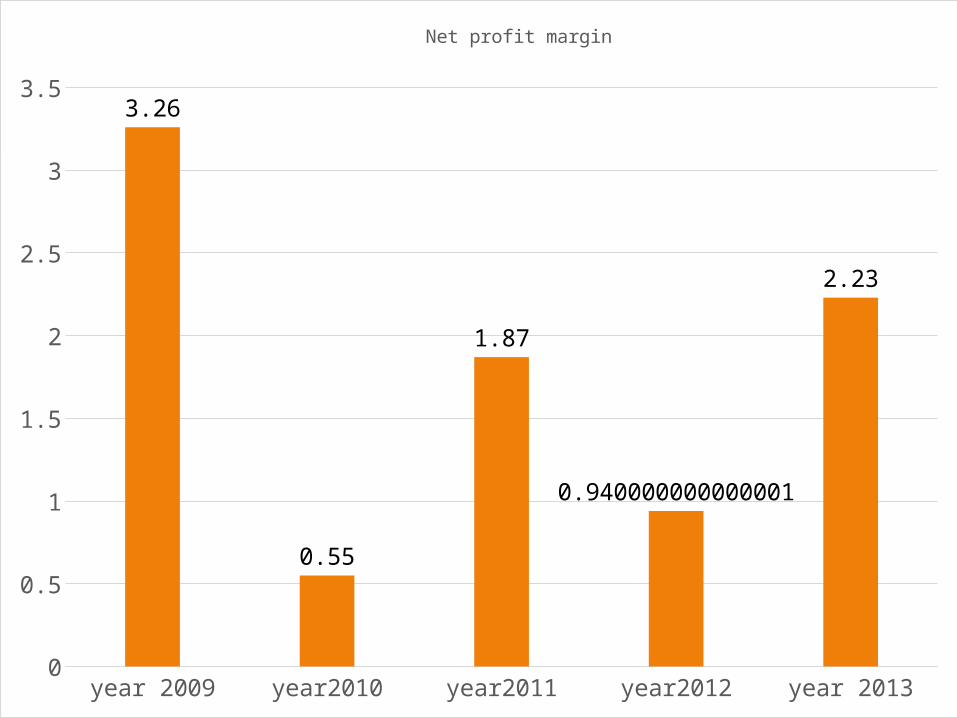
year 2009 year2010 year2011 year2012 year 20130
0.5
1
1.5
2
2.5
3
3.53.26
0.55
1.87
0.940000000000001
2.23
Net profit margin
Return on equity
Return on equity= Net profit after
tax/ total equity
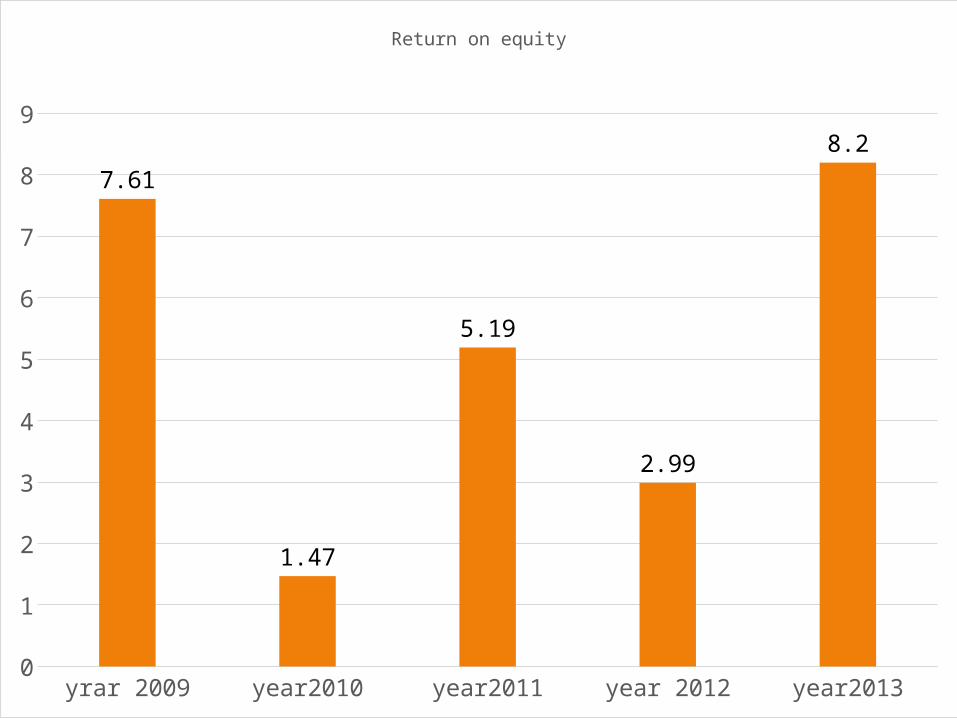
yrar 2009 year2010 year2011 year 2012 year20130
1
2
3
4
5
6
7
8
9
7.61
1.47
5.19
2.99
8.2
Return on equity
Return on asset
Return on asset=Net profit after tax / total asset .

year2009 year2010 year2011 year20120
0.5
1
1.5
2
2.5
3
3.5
4
1.7
0.330000000000001
1.21
3.35
Return on assest
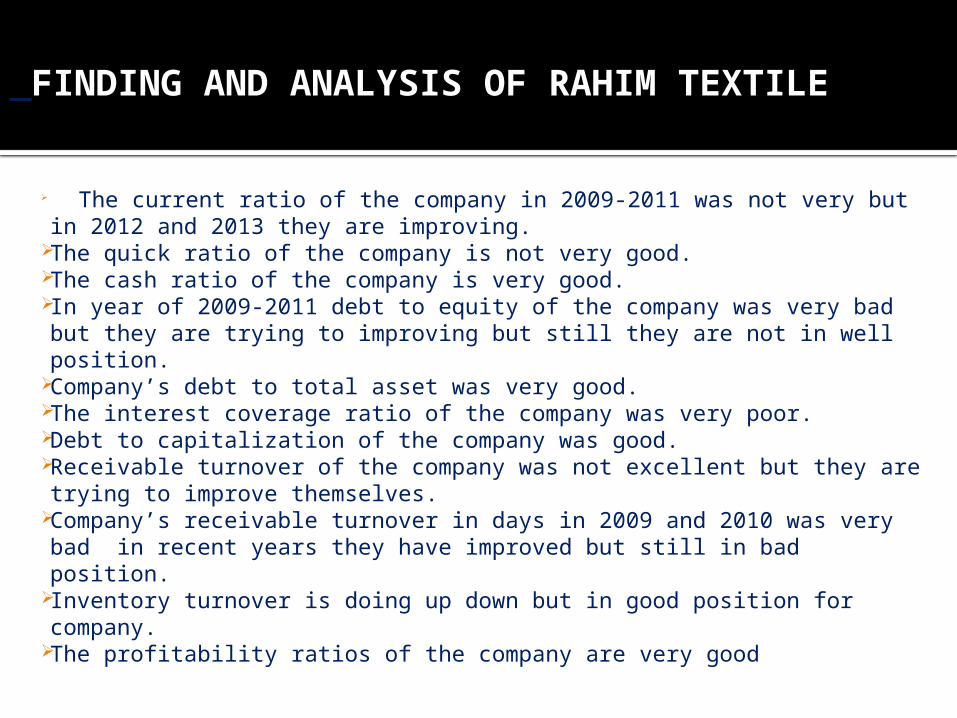
FINDING AND ANALYSIS OF RAHIM TEXTILE
The current ratio of the company in 2009-2011 was not very but in 2012 and 2013 they are improving.
The quick ratio of the company is not very good. The cash ratio of the company is very good. In year of 2009-2011 debt to equity of the company was very bad but
they are trying to improving but still they are not in well position. Company’s debt to total asset was very good. The interest coverage ratio of the company was very poor. Debt to capitalization of the company was good. Receivable turnover of the company was not excellent but they are
trying to improve themselves. Company’s receivable turnover in days in 2009 and 2010 was very
bad in recent years they have improved but still in bad position. Inventory turnover is doing up down but in good position for company. The profitability ratios of the company are very good
CONCLUSION
We know that the progress of a
company depend on appropriate financing and keeping statement. Rahim textile company should have analysis their performance to overcome their problems.