Embed Size (px)
Citation preview
Power Forward 2.0How American Companies Are Setting Clean Energy Targets and Capturing Greater Business Value
WORKING TOGETHER TO REDUCE THE IMPACT OF CLIMATE CHANGE
Power Forward 2.0How American Companies Are Setting Clean Energy Targets and Capturing Greater Business Value
How American Companies Are Setting Clean Energy Targets and Capturing Greater Business Value 1
© W
WF
-CA
NO
N
TABLE OF CONTENTSEXECUTIVE SUMMARY ................................................................... 2
INTRODUCTION ............................................................................. 6
CLIMATE AND CLEAN ENERGY TARGETS IN THE FORTUNE 500 ..... 9
Sector analysis ....................................................................................................... 9
PROGRESS IN THE FORTUNE 100: PROMISES KEPT .................... 15
RECOMMENDATIONS ................................................................... 19
Recommendations for companies ........................................................................ 19
Recommendations for investors ............................................................................ 20
Recommendations for the electric sector .............................................................. 20
Recommendations for policymakers ..................................................................... 21
APPENDICES ............................................................................... 26
Appendix A: Status of Fortune 100 companies ..................................................... 26
$SSHQGL[�%��)RUWXQH�����WDUJHWV��UHSRUWHG�¿QDQFLDO�UHVXOWV .................................. 28
Appendix C: Endnote references ......................................................................... 31
A full database of Fortune 500 goals is available as a supplemental document, which can be accessed at www.worldwildlife.org/powerforward2014.
Acknowledgements
Lead contributors to this report include:
WWF: Bryn Baker, Marty Spitzer, and Evan Vaughan
Ceres: Peyton Fleming, Andrea Moffat, Brandon Smithwood, and Andrew Wiley
Calvert Investments: Paul Bugala and Gabriel Thoumi, CFA
David Gardiner and Associates: David Gardiner and Ryan Hodum
Substantial portions of data for this report were provided by CDP.
Special thanks to Tom Carnac and Sara Law at CDP.

2 Power Forward 2.0
E XECUT IVE SUMMARYFor the largest corporations in the United States, clean energy is now becoming mainstream. Overall, 43 percent, or 215 of the companies in the Fortune 500 have set targets in one of three categories: (1) greenhouse gas (GHG) reduction FRPPLWPHQWV������HQHUJ\�HI¿FLHQF\��DQG�����UHQHZDEOH�HQHUJ\��1HDUO\�KDOI�RI�WKH�ODUJHVW�FRPSDQLHV�LQ�WKH�8�6��DUH�FDSWXULQJ�VLJQL¿FDQW�EXVLQHVV�YDOXH�E\�FXWWLQJ�emissions and using clean forms of energy to power their operations. Leaders such as Caterpillar, Dow Chemical, General Electric, General Motors, Procter & Gamble, Sprint, and Walmart have set targets across all three categories.
The largest companies in the Fortune 500 – the Fortune 100 – continue to lead: 60 percent of Fortune 100 companies have set clean energy and GHG reduction WDUJHWV�DV�RI�������6LQFH�WKH�¿UVW�Power Forward report was released, companies like Apple and Pepsi have joined the ranks of other Fortune 100 companies with climate and clean energy targets.
7KH�DJJUHJDWH�LPSDFW�RI�WKH�FRPSDQ\�DFWLRQV�LV�VLJQL¿FDQW��$PRQJ�WKH����)RUWXQH�100 companies reporting on climate and energy targets to CDP (formerly the Carbon Disclosure Project), they are conservatively saving $1.1 billion annually through their emission reduction and renewable energy initiatives. In 2012 alone, these companies decreased their annual emissions by approximately 58.3 million metric tons of CO2 equivalent – comparable to retiring about 15 coal plants – saving them an average of $19 per metric ton of carbon dioxide equivalent emissions (mtCO
2e).
As companies exceed their targets, these successes are resulting in new renewable HQHUJ\�SURMHFWV�DQG�H[SDQGHG�GHSOR\PHQW�RI�HQHUJ\�HI¿FLHQF\�LQ�VWDWHV�DFURVV�the country. For example, AT&T had a 2012 goal of adding 5 megawatts (MW) of alternative energy from a 2011 baseline of 3.9 MW. They surpassed this target, adding 7 MW of alternative energy, and have now installed 11 MW total as of 2013. Hewlett-Packard exceeded its target to double renewable energy purchases to 8 percent of electricity use by 2012. They purchased 496 million kWh of renewable energy worldwide in 2012 and generated 3 million kWh onsite, equivalent to 13 percent of total electricity consumption.1
For the 20 Fortune 100 companies with targets that ended in 2012, 85 percent achieved their target and 80 percent have gone on to set greater targets or still KDYH�RWKHU�RQJRLQJ�WDUJHWV��/RRNLQJ�DW�WKH�EHQH¿WV�WKHVH�FRPSDQLHV�UHDOL]HG��LW¶V�not surprising most set new targets. These companies alone executed roughly 20,900 projects that recorded nearly $400 million in annual savings through their carbon reduction projects and reduced 44 million metric tons of carbon dioxide equivalent (mtCO
2H��DQQXDOO\���0DQ\�RI�WKHVH�SURMHFWV�DFKLHYH�VLJQL¿FDQW�
¿QDQFLDO�UHWXUQV�ZLWKLQ�VKRUW��DQG�PHGLXP�WHUP�WLPH�IUDPHV��ZLWK�VRPH�DFKLHYLQJ�SUR¿WDELOLW\�ZLWKLQ�RQH�WR�WKUHH�\HDUV��DFFRUGLQJ�WR�FRPSDQ\�UHSRUWHG�payback periods described in unaudited CDP climate change reports.
The scale of these savings is likely to grow substantially. Individual companies KDYH�DOUHDG\�DFKLHYHG�VLJQL¿FDQW�VDYLQJV�DQG�KDYH�KLJK�H[SHFWDWLRQV�JRLQJ�forward. For example, IBM has saved a cumulative $477 million through its annual energy conservation actions. Walmart expects to save $1 billion globally
How American Companies Are Setting Clean Energy Targets and Capturing Greater Business Value 3
SHU�\HDU�WKURXJK�LWV�UHQHZDEOH�HQHUJ\�DQG�HQHUJ\�HI¿FLHQF\�LQLWLDWLYHV��'HOO�HVWLPDWHV�WKDW�LPSURYHPHQWV�LQ�WKH�HI¿FLHQF\�RI�LWV�SURGXFWV�ZLOO�VDYH�FXVWRPHUV�$1.1 billion annually. The trends are clear: leading companies are capturing business value by executing effective clean energy strategies, and with proven results, more are sure to join the pursuit.
However, despite the overwhelming success of these American companies meeting their targets and saving money, smaller companies and some entire sectors are missing climate business opportunities. For example, only 30 percent of the companies among the Fortune 250 to Fortune 500 have a GHG, renewable HQHUJ\��RU�HQHUJ\�HI¿FLHQF\�WDUJHW�RU�VRPH�FRPELQDWLRQ�WKHUHRI��/HVV�WKDQ�D�WKLUG�of companies in the Energy and Financial Services sectors have adopted targets.
Furthermore, the ambition of company targets and time frames for achieving them vary widely. Very few companies have time-bound GHG reduction targets that align with the pollution reductions climate scientists say are urgently needed to avoid the worst impacts of climate change. Leading are companies such as Apple, Procter and Gamble, and Walmart that have long-term commitments to be 100% powered by renewable energy. Cisco is one of a few that have set a science-based target to reduce absolute emissions 40 percent by 2017.
7KLV�LV�FRQVLVWHQW�ZLWK�WKH�¿QGLQJV�RI�D�UHFHQW�&HUHV�UHSRUW��Gaining Ground, which found that two-thirds of companies are taking some action on climate change but only 35 percent of those surveyed had time-bound targets for reducing GHG emissions.2 Thirty-seven percent have implemented renewable energy SURJUDPV��ZLWK�RQO\���SHUFHQW�KDYLQJ�VSHFL¿F�WDUJHWV�IRU�ERRVWLQJ�UHQHZDEOH�energy sourcing.
The leaders are demonstrating the value of clean energy and raising expectations that other companies will do the same. Yet, the companies in the Fortune 500 that are not adopting the practices of the leading companies are forgoing substantial opportunities to save money, generate shareholder value, and minimize their environmental footprint. Collectively, the failure of these companies to follow what has become best practice also means that the corporate response to climate FKDQJH�LV�LQVXI¿FLHQW�
Recommendations for Companies
�� &RPSDQLHV�VKRXOG�VHW�WLPH�ERXQG�UHQHZDEOH�HQHUJ\��HQHUJ\�HI¿FLHQF\��RU�GHG emissions reduction commitments. Companies across the Fortune 500 have set increasingly aggressive targets. The 3% Solution and The 21st Century Corporation: The Roadmap to 2020 provide two resources for FRPSDQLHV�WR�IROORZ�DV�WKH\�GH¿QH�WKH�DPELWLRQ�RI�WKHVH�WDUJHWV�
• Companies with GHG targets should also set renewable energy and energy HI¿FLHQF\�WDUJHWV��RU�DW�D�PLQLPXP�HQVXUH�WKDW�ERWK�DUH�SDUW�RI�DQ\�*+*�reduction strategy. Many companies are realizing a strong return on investment by achieving these targets.
• Companies should be fully transparent in reporting their GHG commitments and the role that renewable energy should play in meeting them, using emerging global standards for Scope 2 carbon accounting.3 To measure progress, companies should publicly disclose the amount of renewable energy they purchase annually compared to their total energy consumption.

4 Power Forward 2.0
• Companies should identify opportunities to support local, state and national policies that remove barriers to scale up renewable energy, deploy energy HI¿FLHQF\��DQG�HQDEOH�FRPSDQLHV�WR�DFKLHYH�WKHLU�FOLPDWH�FRPPLWPHQWV���$OO�companies should be engaged in policy advocacy because it helps increase availability of renewable energy and lower prices, while bringing corporate commitments and public policy positions in line with one another.
Recommendations for Investors
�� ,QYHVWRUV�VKRXOG�FRQWLQXH�WR�¿OH�UHVROXWLRQV�ZLWK�FRPSDQLHV�WR�VHW�FOLPDWH�and energy targets to deliver cost savings and reduce climate-related business risk.
Recommendations for the Electric Sector
• Utilities should offer cost-competitive clean energy options to large customers. Without competitive renewable energy offerings, for example, companies in the Fortune 500 have a continued incentive to bypass their utilities to meet their public clean energy commitments. Most utilities are not offering these options to large customers.
• Utility executives should take note of this increasing market demand and engage in dialogues with their large customers on ways to sell the renewable energy offerings corporate customers are looking for. Special “green tariffs” that allow large customers to buy renewable energy through the utility offer a promising development.
Recommendations for Policymakers
• Federal policymakers should continue to support the Production Tax Credit for wind and Investment Tax Credit for solar, both of which have helped bring emerging technologies into the mainstream. Allowing both to expire will raise prices for companies committed to buying renewable energy.
• State utility regulators should authorize the use of third-party Power Purchase Agreements (PPAs) and allow access to net-metering. Unstable or outdated policies are creating roadblocks for large corporate buyers of renewable energy.
• State policymakers should continue to support renewable portfolio standards, which have provided a marketplace for renewable energy in which large corporate buyers are now participants. Fortune 500 companies are developing renewable energy opportunities in locations where market conditions are most favorable.
© W
WF
-CA
NO
N
6 Power Forward 2.0
INTRODUC T IONPurpose of report
Clean energy has entered the mainstream at the world’s largest corporations. In this report, the second in the Power Forward series, we expand upon the analysis of clean energy and climate targets from the U.S. Fortune 100 to include the full U.S. Fortune 500. We total the savings that leading companies are realizing DQG�FKURQLFOH�WKH�UDSLGO\�HYROYLQJ�EXVLQHVV�SUDFWLFHV��¿QDQFLDO�WRROV��DQG�SROLF\�developments that are catalyzing corporate clean energy adoption and making QRQ�HQHUJ\�FRPSDQLHV�VLJQL¿FDQW�SOD\HUV�RQ�WKH�HOHFWULF�JULG�
This report on Fortune 500 commitments is intended to inform companies, investors, the electric power sector, and state and federal policymakers on trends and preferences among large corporate renewable energy buyers. It is also intended to encourage companies in and out of the Fortune 500 to understand WKH�YDOXH�RI�VHWWLQJ�UHQHZDEOH�HQHUJ\��HQHUJ\�HI¿FLHQF\��DQG�JUHHQKRXVH�JDV�emissions reduction commitments. Corporate initiatives on climate change and FOHDQ�HQHUJ\�DUH�LQFUHDVLQJ�DV�FRPSDQLHV�DUH�FDSWXULQJ�FRVW�VDYLQJV�DQG�SUR¿WV�IURP�WKHLU�HQHUJ\�HI¿FLHQF\�DQG�UHQHZDEOH�HQHUJ\�LQLWLDWLYHV��(QHUJ\�HI¿FLHQF\�and renewable energy activities are here to stay.
7KH�UHSRUW�FRYHUV�ERWK�HQHUJ\�HI¿FLHQF\�DQG�UHQHZDEOH�HQHUJ\�DV�WKH�SULPDU\�means of achieving GHG reductions. The report gives greater consideration to the rationales, approaches, and barriers to renewable energy procurement than WR�HQHUJ\�HI¿FLHQF\��%DUULHUV�DQG�RSSRUWXQLWLHV�IRU�HQHUJ\�HI¿FLHQF\�KDYH�EHHQ�WKRURXJKO\�FRYHUHG�LQ�RWKHU�UHSRUWV��:KLOH�HQHUJ\�HI¿FLHQF\�LV�D�NH\�FRPSRQHQW�of a company’s emissions reduction strategy, any company hoping to grow production while reducing emissions on an absolute basis will need to have a strategy for procuring renewable energy.
Report methodology
7KH�¿QGLQJV�LQ�WKLV�UHSRUW�DUH�EDVHG�RQ�SXEOLFO\�DYDLODEOH�LQIRUPDWLRQ��LQFOXGLQJ�2013 corporate responses to CDP (formerly Carbon Disclosure Project), the EPA Green Power Partnership, public company websites, corporate social responsibility and sustainability reports, and other public disclosures. Public &'3�UHSRUWV�DUH�IURP�WKH������GLVFORVXUH�F\FOH�UHÀHFWLQJ�GDWD�IURP�������7KH�data set is limited to the 2013 U.S. Fortune 500 list of companies, which are the largest companies in the U.S. by total revenue and include both publicly traded and private companies.4
This study expands beyond the original Power Forward report, which focused on the Fortune 100, to include the Fortune 500. It does not review the Global )RUWXQH�����WKDW�ZHUH�LQFOXGHG�LQ�WKH�¿UVW�UHSRUW�
Power Forward 2.0 reviews business commitments to reducing greenhouse gas HPLVVLRQV��*+*��DQG�LQFUHDVLQJ�HQHUJ\�HI¿FLHQF\�DQG�UHQHZDEOH�HQHUJ\��*+*�commitments constitute a target to reduce emissions by a certain amount over time. These targets may be absolute (e.g., reduce the corporation’s emissions by 30 percent by 2020) or intensity based (reduce emissions per ton of product
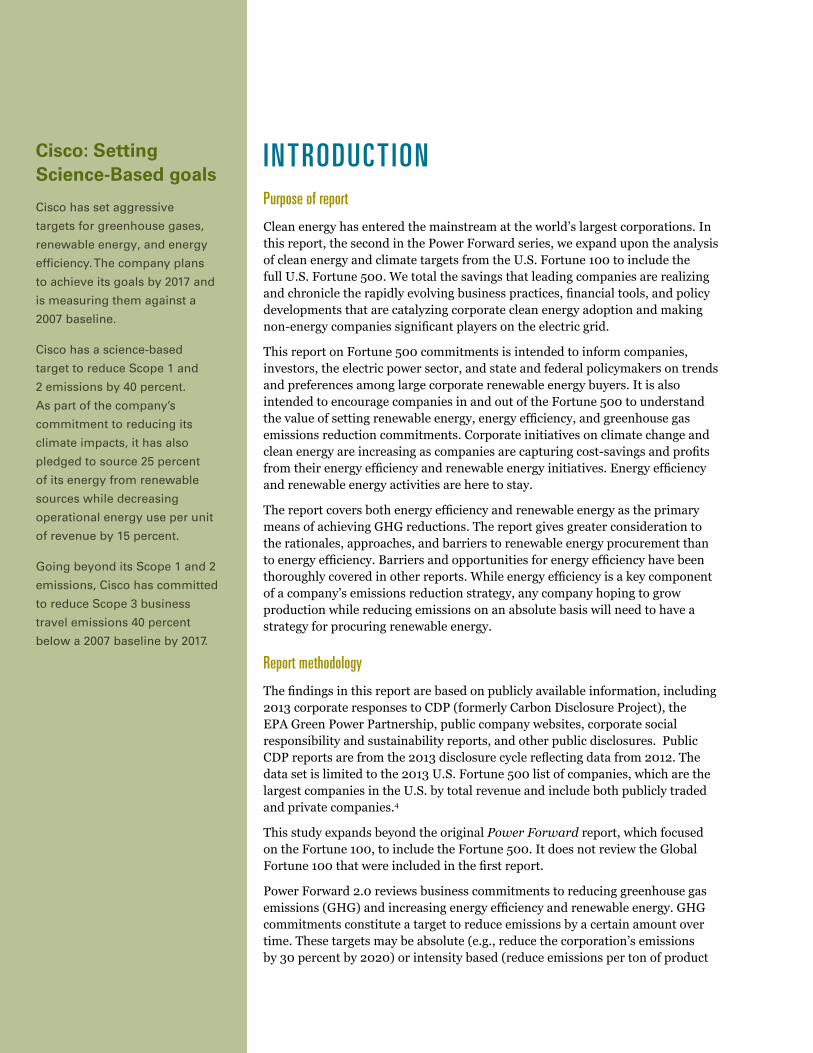
Cisco: Setting Science-Based goals
Cisco has set aggressive targets for greenhouse gases, renewable energy, and energy efficiency. The company plans to achieve its goals by 2017 and is measuring them against a 2007 baseline.
Cisco has a science-based target to reduce Scope 1 and 2 emissions by 40 percent. As part of the company’s commitment to reducing its climate impacts, it has also pledged to source 25 percent of its energy from renewable sources while decreasing operational energy use per unit of revenue by 15 percent.
Going beyond its Scope 1 and 2 emissions, Cisco has committed to reduce Scope 3 business travel emissions 40 percent below a 2007 baseline by 2017.
How American Companies Are Setting Clean Energy Targets and Capturing Greater Business Value 7
produced by 50 percent). Targets are typically over a time-bound period and can cover the company’s Scope 1, 2 or 3 emissions.a�(QHUJ\�HI¿FLHQF\�DQG�UHQHZDEOH�energy commitments are the primary means to achieving overall GHG targets but ZH�GLVWLQFWO\�LQFOXGH�DQ\�VSHFL¿F�FRPPLWPHQWV�WR�GHFUHDVH�WKH�DPRXQW�RI�HQHUJ\�consumed or increase the amount of renewable energy consumed.
This analysis only looks at whether a company has set a GHG, renewable energy, RU�HQHUJ\�HI¿FLHQF\�WDUJHW��,W�GRHV�QRW�DVVHVV�WKH�DPELWLRQ�RI�WKRVH�WDUJHWV�RU�whether they are in line with science-based recommendations on the level of action required to address climate change.
Why are companies adopting renewable energy targets?
Companies are motivated to purchase renewable energy for a number of reasons, including:
1) the ability to reduce costs;
��� GLYHUVL¿FDWLRQ�RI�HQHUJ\�VXSSO\��
3) locking in long-term energy price stability to hedge against energy market volatility;
4) achieving GHG emissions reduction targets;
5) meeting demand from investors and customers; and
��� GHPRQVWUDWLQJ�FRUSRUDWH�OHDGHUVKLS��LQQRYDWLRQ��DQG�FRPSHWLWLYH�¿UVW�PRYHU�advantage.
Renewable energy investments can deliver attractive economic returns, and large corporate buyers want to reduce risks and costs while creating competitive DGYDQWDJH��$�UHFHQW�DQDO\VLV�¿QGV�WKDW�IRXU�RXW�RI�¿YH�FRPSDQLHV�HDUQ�PRUH�RQ�average from investments aimed at reducing carbon emissions than on their average investment portfolio.5
In 2013, for example, Walmart announced two new commitments to renewable HQHUJ\�DQG�HQHUJ\�HI¿FLHQF\��D��WR�GULYH�WKH�SURGXFWLRQ�RU�SURFXUHPHQW�RI���billion kWh of renewable energy globally every year, and b) to reduce the kWh/sq. ft. energy intensity by 20 percent, both by 2020 (compared to 2010 levels).6 The two new commitments are anticipated to generate more than $1 billion in annual energy savings once fully implemented.7
Walmart’s experience is not unique. Analysis for this report shows that companies achieving their targets are realizing compelling returns for their investments �VHH�3URJUHVV�LQ�WKH�)RUWXQH������3URPLVHV�.HSW���:LWK�WKH�¿QDQFLDO�EHQH¿WV�of clean energy targets clearer than ever, institutional investors have been calling for companies to adopt greenhouse gas and other clean energy targets. ,Q�WKH�SDVW�WZR�\HDUV�LQVWLWXWLRQDO�LQYHVWRUV�KDYH�¿OHG�PRUH�WKDQ�����FOLPDWH�related resolutions with companies in the electric power, oil & gas, insurance, manufacturing, and other sectors.
a The GHG protocol characterizes an entity’s direct and indirect emissions into three broad categories or
“scopes.” Scope 1: All direct GHG emissions; Scope 2: Indirect GHG emissions from consumption of
purchased electricity, heat or steam; Scope 3: Other indirect emissions.
“More than ever, we know that
our goal to be supplied 100
percent by renewable energy
is the right goal and that
marrying up renewables with
HQHUJ\�HI¿FLHQF\�LV�HVSHFLDOO\�powerful. The math adds up
pretty quickly – when we use
less energy, that’s less
energy we have to buy, and
that means less waste and
more savings. These new
commitments will make us a
stronger business, and
they’re great for our
communities and the
environment.”
Mike Duke, President and CEO,
Walmart8

How American Companies Are Setting Clean Energy Targets and Capturing Greater Business Value 9
The shareholder resolutions typically request that companies disclose climate-related risks they are facing and strategies for managing those risks, including JUHHQKRXVH�JDV�UHGXFWLRQ�SODQV��LPSURYHG�HQHUJ\�HI¿FLHQF\��DQG�ERRVWLQJ�XVH�RI�renewable energy.9 When these resolutions go to vote at shareholder meetings, heavyweight investors increasingly support them. Some of the largest mutual fund companies, including DWS, AllianceBernstein, Schroder, and Oppenheimer voted for these resolutions over 66 percent of the time.10
CL IMATE AND CLE AN ENERGY TARGE TS IN THE FORTUNE 500Overall, 43 percent of the Fortune 500 (215 companies) have a greenhouse JDV�WDUJHW��D�UHQHZDEOH�HQHUJ\�WDUJHW��DQ�HQHUJ\�HI¿FLHQF\�WDUJHW��RU�VRPH�combination. The largest companies of the Fortune 100 continue to lead, with 60 percent of companies setting targets.
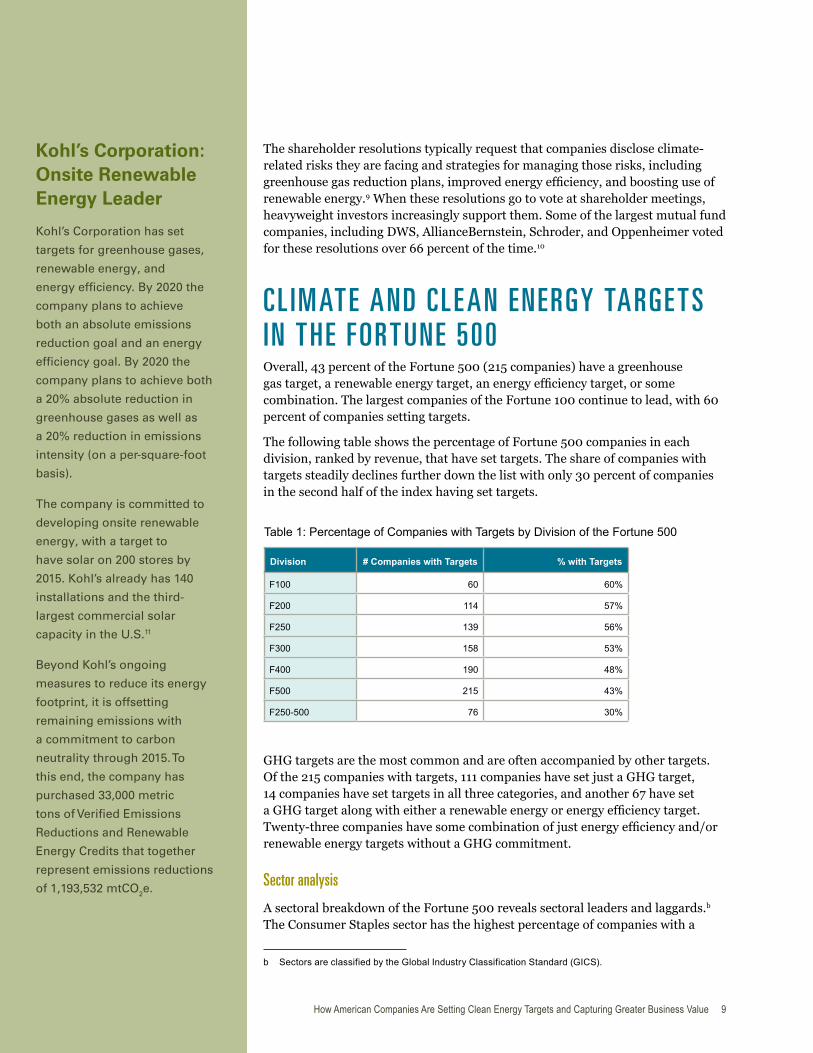
The following table shows the percentage of Fortune 500 companies in each division, ranked by revenue, that have set targets. The share of companies with targets steadily declines further down the list with only 30 percent of companies in the second half of the index having set targets.
Table 1: Percentage of Companies with Targets by Division of the Fortune 500
Division # Companies with Targets % with Targets
F100 60 60%
F200 114 57%
F250 139 56%
F300 158 53%
F400 190 48%
F500 215 43%
F250-500 76 30%
GHG targets are the most common and are often accompanied by other targets. Of the 215 companies with targets, 111 companies have set just a GHG target, 14 companies have set targets in all three categories, and another 67 have set D�*+*�WDUJHW�DORQJ�ZLWK�HLWKHU�D�UHQHZDEOH�HQHUJ\�RU�HQHUJ\�HI¿FLHQF\�WDUJHW��7ZHQW\�WKUHH�FRPSDQLHV�KDYH�VRPH�FRPELQDWLRQ�RI�MXVW�HQHUJ\�HI¿FLHQF\�DQG�RU�renewable energy targets without a GHG commitment.
Sector analysis
A sectoral breakdown of the Fortune 500 reveals sectoral leaders and laggards.b The Consumer Staples sector has the highest percentage of companies with a
b Sectors are classified by the Global Industry Classification Standard (GICS).
Kohl’s Corporation: Onsite Renewable Energy Leader
Kohl’s Corporation has set targets for greenhouse gases, renewable energy, and energy efficiency. By 2020 the company plans to achieve both an absolute emissions reduction goal and an energy efficiency goal. By 2020 the company plans to achieve both a 20% absolute reduction in greenhouse gases as well as a 20% reduction in emissions intensity (on a per-square-foot basis).
The company is committed to developing onsite renewable energy, with a target to have solar on 200 stores by 2015. Kohl’s already has 140 installations and the third-largest commercial solar capacity in the U.S.11
Beyond Kohl’s ongoing measures to reduce its energy footprint, it is offsetting remaining emissions with a commitment to carbon neutrality through 2015. To this end, the company has purchased 33,000 metric tons of Verified Emissions Reductions and Renewable Energy Credits that together represent emissions reductions of 1,193,532 mtCO2e.

10 Power Forward 2.0
target at 62 percent. Both the Information Technology and Materials sectors follow with 53 percent of companies setting targets.
More than half of the utilities in the Fortune 500 have set additional emissions reduction targets beyond what is required through state Renewable Portfolio Standard (RPS) or regional emissions regulations like the Regional Greenhouse Gas Initiative and AB 32 in California. Industrials and Consumer Discretionary follow with 44 percent and 43 percent of companies with targets, respectively. Telecommunications, Health Care, and Finance have some of the lowest levels of targets at 40 percent, 35 percent and 30 percent, respectively. The Energy sector trails all other sectors of the Fortune 500, with less than a quarter of companies setting targets.
The lagging status of the Energy sector is worth further comment. Despite persistent advocacy by investors on their own and through groups such as CDP and the United Nations Principles on Responsible Investment (UN PRI) Carbon Action ,QLWLDWLYH��WKH�(QHUJ\�VHFWRU�LV�FRQVLVWHQWO\�UHVLVWDQW�WR�FRPPLWWLQJ�WR�VSHFL¿F�reductions. The most likely reasons for this include the increasing demand for and the increasing carbon content of fossil fuels, the lack of clarity regarding carbon regulation on a global and national basis, and the perceived complexities involved in setting enterprise-level targets that apply to operations that span continents and employ a wide variety of technologies and processes. While the second two UHDVRQV�FDQ�DQG�KDYH�EHHQ�RYHUFRPH�EHIRUH��WKH�¿UVW�±�FRQWLQXHG�GHSHQGHQFH�RQ�more carbon intense fossil fuels – will require a demand-side transition in favor of alternative energy, particularly in emerging countries.
0%
10%
20%
30%
40%
50%
60%
43%
70%
80%
90%
100%
Consu
mer Stap
les
Materia
ls
Inform
ation
Tech
nolog
y
Utilitie
s
Indus
trials
Consu
mer Disc
retion
ary
Telec
ommun
icatio
n Serv
ices
Health
Care
Financ
ials
Energy
Figure 1: Fortune 500: Percentage of Companies with a Target by Sector

How American Companies Are Setting Clean Energy Targets and Capturing Greater Business Value 11
The chart below shows the breakdown of target types set by companies within a given sector.
c RE: renewable energy; EE: energy efficiency/conservation; GHG: greenhouse gases
14
8 11 10
23
16
1 1
8
15
5
2
1
4
3
3
3
1 1 1
3
1
5
12
2
3
3 2
9
6
6 13
41
1
3
3
1
2
2
1
19
15
23
12
21
46
54
6
30
49
6
31
0
10
20
30
40
50
60
70
80
90
100
Consu
mer Stap
les
Materia
ls
Inform
ation
Tech
nolog
y
Utilities
Indus
trials
Consu
mer Disc
retion
ary
Telec
ommun
icatio
n Serv
ices
Health
Care
Financ
ials
Energy
# of
Com
pani
es
12 Power Forward 2.0
How do companies plan to achieve their renewable energy commitments?
To meet their renewable energy targets, companies continue to use three SULPDU\�WRROV�IRU�SURFXUHPHQW��WUDGDEOH�5HQHZDEOH�(QHUJ\�&HUWL¿FDWHV��5(&V���Power Purchase Agreements (PPAs),d and on- or off-site direct investment. Companies continue to shift away from large REC purchases toward direct forms of renewable energy procurement in order to have a greater impact and capture greater business value.
Because of an oversupply of RECs in the U.S., REC prices remain low and revenue often is not substantial enough to cause new projects to be built. Some large unbundled REC buyers have been accused of green-washing because the purchase of cheap RECs from existing projects makes no impact on lowering overall emissions or incentivizing new generation. RECs also don’t deliver business value EH\RQG�UHSXWDWLRQDO�EHQH¿WV�EHFDXVH�WKH\�DUH�D�SXUH�FRVW�SUHPLXP�
Consequently, many large companies continue to move toward PPAs and direct investment to capture energy cost savings, price certainty, and reasonable returns on investment. Companies pursue direct investment opportunities where it is technically and economically attractive but those opportunities can be limited and require companies to be willing to invest capital.
For companies that are not able to assign their own capital to a renewable energy project, PPAs create value by locking in energy prices to reduce the fuel-price volatility of traditional energy and often are expected to provide a hedge against predicted rises in traditional utility rates over the term of the contract. They have WKH�DGGHG�EHQH¿W�WKDW�DQRWKHU�SDUW\�LV�UHVSRQVLEOH�IRU�RZQLQJ�DQG�PDQDJLQJ�WKH�renewable energy project.
33$V�DV�ZHOO�DV�OHDVLQJ�VWUXFWXUHV�DUH�DOVR�XVHG�WR�OHYHUDJH�WKLUG�SDUW\�¿QDQFH�WR�install renewable energy projects onsite, most commonly solar PV on warehouses, big-box retailers, and manufacturing sites. Walmart, Costco, and Kohl’s hold the top three spots in the U.S. for onsite solar capacity, and most of their combined ����0:�RI�LQVWDOOHG�VRODU�HQHUJ\�DW�WKH�HQG�RI������ZDV�WKLUG�SDUW\�¿QDQFHG�12
However, companies can only sign traditional PPAs in states where the utilities have been deregulated to allow supplier competition. The prohibition on PPAs in regulated markets prevents companies from exercising their choice of energy supply and driving renewable energy demand.
To overcome this challenge and break the logjam, some companies are turning to something called a “virtual PPA,” also known as a synthetic PPA or a contract for differences. The virtual PPA helps overcome the prohibition on PPAs in regulated markets by allowing companies to source renewable energy offsite, often in an entirely different state.
A virtual PPA is basically a form of price hedge. A company enters into a contract to pay a renewable energy project an agreed offtake price. However, the renewable energy project sells the generated power into the local wholesale market on a merchant basis. The hedge works both ways: the project pays the company if the electricity is sold into the market above the agreed contract price. The company
d A PPA is a contract to buy power over time at a negotiated price from a particular facility in which the
renewable energy is either located onsite or sited remotely.
Raytheon: Three Generations of Targets
Raytheon’s first-generation target was a 33 percent reduction of GHG emissions below 2002 levels; it met this goal a year ahead of schedule, in 2008. Following this success, the company set a 10 percent reduction target to be achieved by 2015. The company met this target in 2011.
Currently Raytheon has a 2015 target of reducing Scope 1 and 2 emissions 25 percent below 2008 levels on an absolute basis. The company has already reduced emissions by 21 percent.
These targets have been achieved through a company-wide strategy to reduce emissions by surveying over 600 potential projects and implementing at least 425 projects. Payback periods for these projects generally range from four to ten years.
How American Companies Are Setting Clean Energy Targets and Capturing Greater Business Value 13
pays the project the difference if the electricity price falls below the agreed price. The corporate purchaser keeps the RECs from the project to apply to facilities in states where they are otherwise challenged to procure renewable energy and is essentially banking that energy prices will go up over time in order to make money off the contract.
Companies are also beginning to step in as tax equity investors in offsite renewable energy projects – a role historically occupied mainly by utilities – where they expect a healthy return on investment and usually a share of the RECs to count toward their clean energy targets. Interest is growing in the tax equity space but there are only a handful of non-utility corporate players, like Google and Honda, that have executed tax equity deals.
Other companies are making access to renewable energy a key decision when siting or expanding new facilities, particularly large energy consuming facilities like data centers and factories. Companies like American Express, Apple, Facebook, Google, Mars, Unilever, and Yahoo! have evaluated their ability to purchase renewable energy when determining the best location with the lowest carbon footprint.15
What are the challenges for large corporate buyers of renewable energy?
Procuring renewable energy beyond unbundled RECs is just one of many challenges companies face in scaling up their renewable energy use. Based on feedback gathered16 from some of the largest purchasers of renewable energy, their challenges fall into three categories:
• Internal challenges, including knowledge, capacity, and management support;
• Market challenges that lead to high transaction costs; and
• Limits on what they can do and how they can do it created by laws, utility regulators, utility practices, and accounting standards.
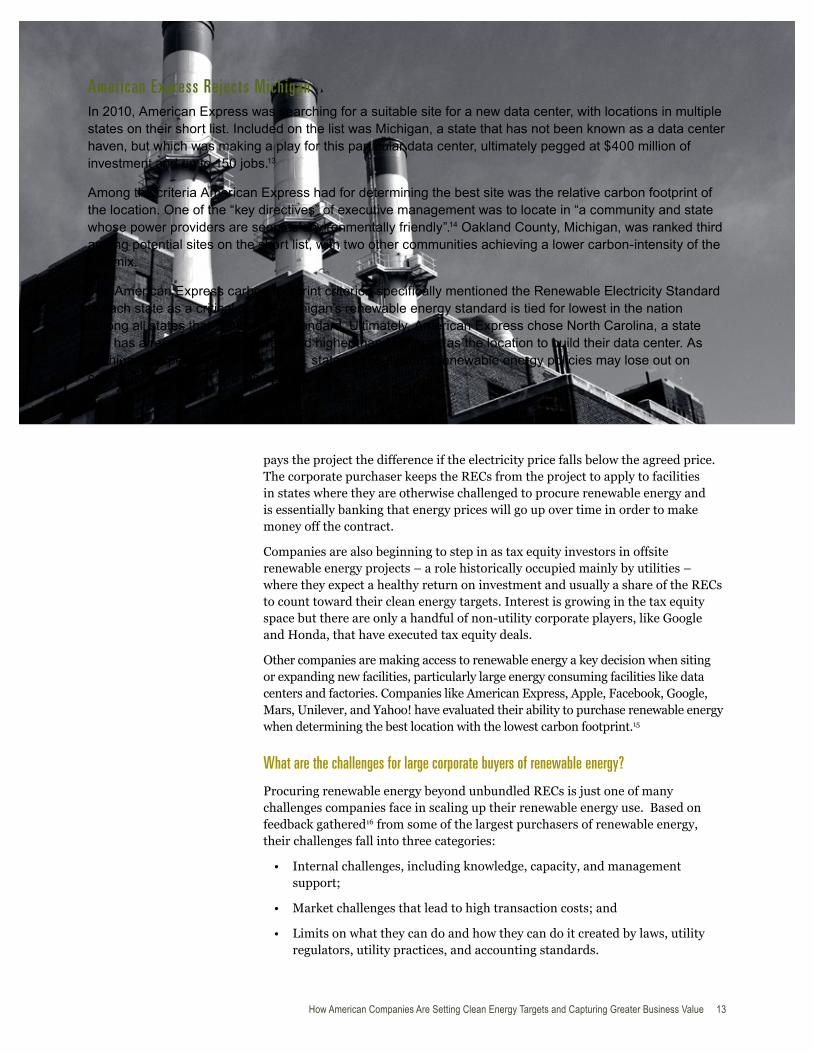
Amer ican E xpress Rejec t s MichiganIn 2010, American Express was searching for a suitable site for a new data center, with locations in multiple
states on their short list. Included on the list was Michigan, a state that has not been known as a data center
haven, but which was making a play for this particular data center, ultimately pegged at $400 million of
investment and up to 150 jobs.13
Among the criteria American Express had for determining the best site was the relative carbon footprint of
the location. One of the “key directives” of executive management was to locate in “a community and state
whose power providers are seen as environmentally friendly”.14 Oakland County, Michigan, was ranked third
among potential sites on the short list, with two other communities achieving a lower carbon-intensity of the
fuel mix.
The American Express carbon footprint criterion specifically mentioned the Renewable Electricity Standard
in each state as a critical policy. Michigan’s renewable energy standard is tied for lowest in the nation
among all states that have such a standard. Ultimately, American Express chose North Carolina, a state
that has a renewable energy standard higher than Michigan, as the location to build their data center. As
Michigan’s experience demonstrates, states without robust renewable energy policies may lose out on
corporate investment and job opportunities.
14 Power Forward 2.0
Internal challengesAs companies try to source and execute projects to meet their targets, even the largest FRPSDQLHV�FDQ�ODFN�FDSDFLW\�WR�KDQGOH�WKH�FRPSOH[�GHDO�VWUXFWXUHV�DQG�¿QDQFLDO�LQVWUXPHQWV�QHHGHG�WR�EX\�UHQHZDEOHV��8QGHUVWDQGLQJ�WKHVH�¿QDQFLDO�DFFRXQWLQJ�and legal structures often requires expensive outside expertise. Renewable energy developers, suppliers, and buyers need to work together to make information and resources easier to access and understand so it is more straightforward for company PDQDJHPHQW�WR�EX\�LQWR�WKH�EHQH¿WV�DQG�WR�FRPSOHWH�DQG�DSSURYH�UHQHZDEOH�HQHUJ\�deals and investments.
Market challengesThere are certain market structures that raise the transaction costs of procuring renewable energy. For example, the industry standard is for 15-to-20-year PPAs, but many companies are not able to sign such long-term agreements. They may lease their IDFLOLWLHV�RU�WKHLU�ULVN�¿QDQFH�GHSDUWPHQWV�ZRQ¶W�DSSURYH�VXFK�D�ORQJ�WHUP�FRQWUDFW��'HYHORSLQJ�VKRUWHU�WHUP�RU�WUDQVIHUDEOH�FRQWUDFWV�ZRXOG�RIIHU�PRUH�ÀH[LELOLW\��However, even when companies are open to longer-term PPA or investment terms, contracts aren’t standardized and require extensive expertise to complete. Companies DOVR�¿QG�LW�FKDOOHQJLQJ�WR�LGHQWLI\�SRWHQWLDO�SURMHFWV�EHFDXVH�RI�WKH�ODFN�RI�PDUNHW�transparency around available project opportunities.
Policy and utility challengesWhen companies cannot meet their commitments with onsite renewable projects, they either need to be able to sign PPAs or buy the renewable power through their utility. PPAs can be challenging for the reasons discussed above and also require companies to develop expertise in areas outside their core business. As a result, many large buyers are interested in working with their utility suppliers to procure renewable energy on their behalf just as they would turn to their suppliers of other input commodities.
*RRJOH�LV�DQ�H[DPSOH�RI�D�FRPSDQ\�WKDW�KDV�JRQH�WR�VLJQL¿FDQW�OHQJWKV�WR�EXLOG�XS�the necessary expertise to complete large renewable energy transactions. Google has contracted for over 1 gigawatt of renewable energy capacity, and even became a FERC-registered wholesale seller of power in order to procure renewable energy and apply it to states where utility and state policies prevent them from signing PPAs.
“Utilities are now much more
interested in collaborating
with us, and I think we are at
the beginning of a period in
which we could see a very
rapid change in the energy
mix utilities are providing in
just a few short years.”
Bill Weihl, Facebook Manager of
(QHUJ\�(I¿FLHQF\�DQG�Sustainability20
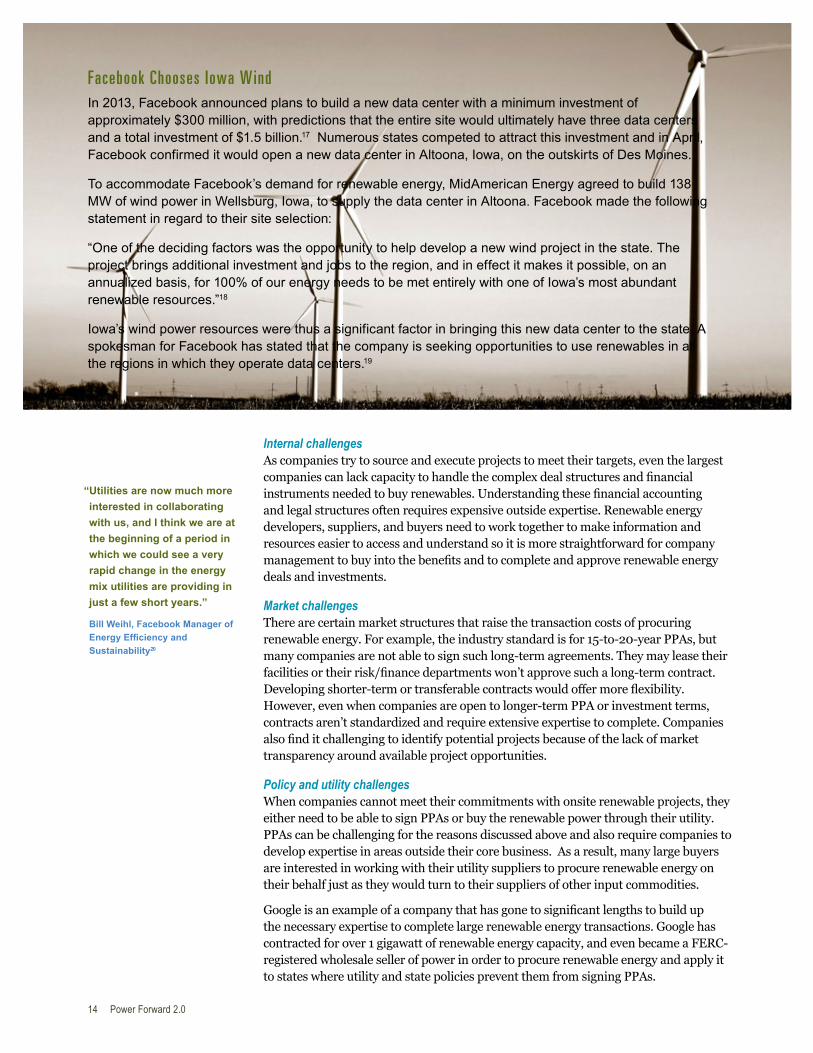
Facebook Chooses Iowa WindIn 2013, Facebook announced plans to build a new data center with a minimum investment of
approximately $300 million, with predictions that the entire site would ultimately have three data centers
and a total investment of $1.5 billion.17 Numerous states competed to attract this investment and in April,
Facebook confirmed it would open a new data center in Altoona, Iowa, on the outskirts of Des Moines.
To accommodate Facebook’s demand for renewable energy, MidAmerican Energy agreed to build 138
MW of wind power in Wellsburg, Iowa, to supply the data center in Altoona. Facebook made the following
statement in regard to their site selection:
“One of the deciding factors was the opportunity to help develop a new wind project in the state. The
project brings additional investment and jobs to the region, and in effect it makes it possible, on an
annualized basis, for 100% of our energy needs to be met entirely with one of Iowa’s most abundant
renewable resources.”18
Iowa’s wind power resources were thus a significant factor in bringing this new data center to the state. A
spokesman for Facebook has stated that the company is seeking opportunities to use renewables in all
the regions in which they operate data centers.19

How American Companies Are Setting Clean Energy Targets and Capturing Greater Business Value 15
However, Google recently issued a white paper outlining a shift in strategy toward working with their utilities rather than procuring projects independently.21 Gary Demasi, Google’s director of global infrastructure, said the company hopes their recent agreement to buy 402 MW of wind power through MidAmerican “will inspire all of our XWLOLWLHV�WR�ZRUN�ZLWK�XV�LQ�¿QGLQJ�ZD\V�WR�LQFUHDVH�WKH�VXSSO\�RI�FOHDQ�SRZHU�´22
Many other companies would welcome the opportunity to work collaboratively with their utilities to procure the renewable energy they need to meet their targets without having to build substantial energy procurement expertise internally.
PROGRE SS IN THE FORTUNE 100: PROMISE S K EPTAmerica’s largest and most successful companies are consistently setting clean energy and FOLPDWH�WDUJHWV��GHPRQVWUDWLQJ�D�FRPPRQ�XQGHUVWDQGLQJ�RI�WKH�VLJQL¿FDQW�EHQH¿WV�DQG�opportunities available. The vast majority of businesses are meeting and exceeding their targets, following through on their commitments, and realizing attractive economic returns on their investments.
Most companies are not yet pursuing targets in line with the ambition the science of climate change shows is necessary. However, the successes companies are seeing in meeting the targets they have set will hopefully inspire more companies to adopt targets with the necessary rigor. Indeed, there is reason to believe this is beginning to happen. Most companies that achieved their targets are doubling down on these achievements by setting new, more aggressive targets for the years ahead.
In 2012, 20 companies in the Fortune 100 had an expiring renewable energy generation or greenhouse gas reduction target. Of those 20 companies 17, or 85 percent, met their WDUJHW��,Q�DW�OHDVW����RI�WKHVH����VXFFHVV�VWRULHV��WKH�WDUJHW�ZDV�H[FHHGHG��RIWHQ�E\�VLJQL¿FDQW�margins.
It is notable that 80 percent of companies (16 of 20) with an expiring 2012 target still have targets. Twelve companies out of 20 (60 percent) established new targets for future years that build on what was already achieved in their 2012 targets; these companies include Dell and TIAA-CREF that did not achieve their 2012 targets, but did set new targets. Four more companies either committed to continuing their 2012 target or have other, ongoing targets. Appendix A at the end of this report highlights the universe of achievements among FRPSDQLHV�ZLWK�D������WDUJHW��GRFXPHQWLQJ�VSHFL¿F�WDUJHWV�DQG�RXWFRPHV�
0% 10% 20% 30% 40% 50% 60% 70% 80% 90% 100%
Post 2012 Goal
2012 Goal Achieved Yes
No
Figure 3: Percent of Fortune 100 Companies Meeting and Extending 2012 Targets

16 Power Forward 2.0
Table 2: Progress by Fortune 100 Companies with Targets that Expired in 2012
CompanyResult for
2012 Target
New
Target Set
or Other
Ongoing
Targets?
2012 Targets
American Express Exceeded YesReduce absolute Scope 1, 2 & 3 emissions by 10% by
2012 relative to 2006 baseline
AT&T Exceeded Yes
5MW of alternative energy from fuel cell and
solar production against 2011 capacity baseline of
3.888 MW by 2012
Boeing Exceeded Yes
1) a 1% reduction in Scope 1 &2 emissions by 2012; 2)
a 25% reduction (per adjusted unit revenue) in Scope
1 & 2 emissions at major manufacturing facilities. Both
goals relative to a 2007 baseline
Chevron Met NoReduce absolute Scope 1 & 2 emissions by 0.7% by
2012 relative to 2011 baseline
Cisco Systems Exceeded Yes25% absolute GHG reduction by 2012 over 2007
baseline
Dell Missed target YesReduce carbon emissions by 15% per dollar of revenue
by 2012 relative to 2007 baseline
ExxonMobil Exceeded No
Reduce Scope 1 GHG intensity by 10% by 2012
relative to 2002 baseline for its downstream and
chemical operations
Goldman Sachs Exceeded Yes
Reduce absolute Scope 1 & 2 emissions by 7% by
2012; reduce absolute Scope 1 & 2 emissions from all
facilities to zero by 2020 (both relative to 2005 baseline)
Hewlett-Packard Exceeded Yese
Double purchases of renewable energy to 8% of
electricity use (in addition to the renewable energy
available by default in the power grid)
Humana Missed target YesfReduce Scope 1 & 2 emissions by 10% by 2012 per
square foot, relative to 2012 baseline
IBM Exceeded YesgReduce Scope 1 & 2 emissions by 12% by 2012
relative to 2005 baseline
Intel Exceeded YesReduce Scope 1 & 2 emissions by 20% by 2012
relative to 2007 baseline
J.P. Morgan
ChaseExceeded Yes
Reduce absolute Scope 1 & 2 emissions by 20% by
2012 relative to 2005 baseline
Lockheed Martin Exceeded YesReduce absolute carbon emissions by 25 percent by
2012 against 2007 baseline
3¿]HU Exceeded YesReduce absolute emissions by 20% by 2012 relative to
2007 baseline
State Farm
InsuranceExceeded No
18 percent reduction in emissions intensity by 2012
relative to 2002 baseline
SuperValu Exceeded NoReduce carbon emissions by 10 percent by the end of
2012 from 2007 baseline levels
TIAA-CREF Missed target YesReduce scope 1+2 intensity by 17.5% by 2012 relative
to 2007 baseline
Walmart Exceeded YesReduce absolute emissions 20% in stores, clubs,and
distribution centers by 2012 from 2005 baseline
Walt Disney Met YeshBy 2012, achieve 50% of long-term absolute target of
zero net direct GHG emissions
e HP is continuing their renewable energy goal.
f Humana is extending their current goal.
g IBM has an ongoing energy efficiency goal and will announce new GHG goals later in 2014.
h Walt Disney has an ongoing goal for zero net direct GHG emissions, and the 2012 goal was an interim
target toward the longer-term goal.

How American Companies Are Setting Clean Energy Targets and Capturing Greater Business Value 17
Most of these companies are achieving high return on investment (ROI) by achieving their targets. The companies that reported data to CDP on the savings from their carbon investments are earning substantial returns on a broad range RI�HQHUJ\�HI¿FLHQF\�DQG�UHQHZDEOH�HQHUJ\�SURMHFWV��PDQ\�ZLWK�SD\EDFN�SHULRGV�RI�1-3 years.
7KH����FRPSDQLHV�ZKRVH�WDUJHWV�H[SLUHG�LQ������DQG�UHSRUWHG�GDWD�WR�&'3�H[HFXWHG�URXJKO\��������SURMHFWV�WKDW�UHFRUGHG�QHDUO\������PLOOLRQ�LQ�DQQXDO�VDYLQJV�DVVRFLDWHG�ZLWK����PLOOLRQ�PHWULF�WRQV�RI�&2��HTXLYDOHQW�LQ�DYRLGHG�HPLVVLRQV�DQQXDOO\��3D\EDFN�SHULRGV�IRU�WKHVH�SURMHFWV²DV�VHOI�UHSRUWHG�E\�WKHVH�FRUSRUDWLRQV²JHQHUDOO\�UDQJH�IURP�XQGHU�RQH�\HDU�WR�DERXW����\HDUV�
$PRQJ�WKH�IXOO�)RUWXQH�����FRPSDQLHV�����FRPSDQLHV�KDYH�WDUJHWV�DQG����RI�those companies report progress on their targets to CDP. The companies report DQQXDO�VDYLQJV�RI������ELOOLRQ�IURP�RYHU��������SURMHFWV��ZLWK�RYHU����PLOOLRQ�metric tons of CO
�H�VDYHG���7KH�HPLVVLRQV�VDYLQJV�DUH�HTXLYDOHQW�WR�UHWLULQJ����
FRDO�SODQWV��3D\EDFN�SHULRGV�ZHUH�W\SLFDOO\�UHSRUWHG�IURP������\HDUV�
Baxter: A Multi-Pronged Approach to Achieving Absolute Reductions
Baxter is committed to reducing GHG emissions from operations 45% indexed to revenue by 2015 compared to 2005. From 2005 to 2013, Baxter decreased net GHG emissions from operations by 10% in absolute terms and 40% indexed to revenue. The company did this despite a significant expansion of its business.
Baxter has pursued both renewable energy adoption and energy efficiency to achieve its goals. The company has sourced renewable energy both through onsite projects- including biomass boilers, geothermal systems, and solar electricity and hot water generation- as well as the purchase of renewable energy and renewable energy certificates. Baxter’s efficiency efforts have included LED lighting projects and the use of cogeneration systems. The company has also achieved Leadership in Energy and Environmental Design (LEED) certification at several facilities.
Table 3: Financial and Emissions Results for Targets in the Fortune 100
Number of companies reporting target data to CDP 53
Total projects implemented 30,526
Total annual estimated mtCO2e savings 58,300,268
Total annual $ savings $1,097,326,563
Average annual mtCO2e savings per project 1,910
Average annual dollar savings per project $36,000
Average annual dollar saving per mtCO2e reduced $19
&RPSDQLHV�UHSRUW�¿QDQFLDOO\�PDWHULDO�DQQXDO�VDYLQJV�RI�����WR�����SHU�PW&2�e
UHGXFHG��ZLWK�DQ�DYHUDJH�RI������)RU�WKHVH�FRPSDQLHV��DFKLHYLQJ�FOHDQ�HQHUJ\�WDUJHWV�PHDQV�VDYLQJ�PRQH\�DQG�JURZLQJ�SUR¿WV��DQG�KDV�EHFRPH�EXVLQHVV�DV�XVXDO���$SSHQGL[�%�VXPPDUL]HV�WKH�&'3�GDWD�IRU�WKH����)RUWXQH�����FRPSDQLHV��LQFOXGLQJ�WKH�¿QDQFLDO�UHVXOWV�IRU�WKH����FRPSDQLHV�ZLWK������WDUJHWV�GLVFXVVHG�above.
7KH�VKRUWHU�SD\EDFN�SHULRG�RI�PDQ\�RI�WKHVH�HPLVVLRQV�UHGXFWLRQ�SURMHFWV�PHDQV�WKDW�WKHVH�HQHUJ\�HI¿FLHQF\�DQG�UHQHZDEOH�HQHUJ\�SURMHFWV�FDQ�EH�OHVV�ULVN\�DQG�SRWHQWLDOO\�PRUH�SUR¿WDEOH�WKDQ�VWDQGDUG�EXVLQHVV�LQYHVWPHQWV��7KLV�LV�EDFNHG�XS�E\�¿QGLQJV�IURP�::)��&'3��DQG�0F.LQVH\��&RPSDQ\��LQ�The 3% Solution: 'ULYLQJ�3UR¿WV�WKURXJK�&DUERQ�5HGXFWLRQ��ZKLFK�IRXQG�WKDW�FRPSDQLHV�ZLWK�*+*�UHGXFWLRQ�WDUJHWV�DFKLHYHG�DQ�DYHUDJH�RI���SHUFHQW�EHWWHU�52,�WKDQ�WKRVH�ZLWKRXW�WDUJHWV��DQG����SHUFHQW�RI�FRPSDQLHV�DFKLHYHG�KLJKHU�UHWXUQV�RQ�WKHLU�carbon investments than on their average investment portfolio.
%RHLQJ�&RPSDQ\��IRU�H[DPSOH��KDV�LQYHVWHG�LQ����SURMHFWV�LQFOXGLQJ�OLJKWLQJ�UHWUR¿WV��UHWUR�FRPPLVVLRQLQJ��+9$&�XSJUDGHV��DQG�PRUH��ZKLFK�WRJHWKHU�DUH�FUHDWLQJ�PLOOLRQV�LQ�DQQXDO�VDYLQJV��,%0�KDV�DOVR�LPSOHPHQWHG�������HI¿FLHQF\�DQG�FRQVHUYDWLRQ�PHDVXUHV�DV�RI�WKH�HQG�RI�������UHVXOWLQJ�LQ�WHQV�RI�PLOOLRQV�LQ�annual savings.


How American Companies Are Setting Clean Energy Targets and Capturing Greater Business Value 19
RECOMMENDAT IONSRecommendations for companies
The recent Ceres assessment of leading U.S. companies against expectations set out in the 21st Century Corporation: The Roadmap to 2020 makes clear that cumulative efforts still fall short of meeting the challenge of climate change, and WKDW�VLJQL¿FDQW�DGGLWLRQDO�WDUJHWV�DQG�DFWLRQV�QHHG�WR�EH�WDNHQ�RQ�UHQHZDEOH�energy.23 According to The Ceres Roadmap, corporate leadership on climate change will require companies to reduce greenhouse gas emissions by 25 percent, LPSURYH�HQHUJ\�HI¿FLHQF\�RI�RSHUDWLRQV�E\�DW�OHDVW����SHUFHQW��DQG�REWDLQ�DW�least 30 percent of energy from renewable sources by 2020 (based on a 2005 baseline).24
Furthermore, as a recent report by the International Energy Agency (IEA) highlights, an average of $1 trillion in additional investment in clean energy needs to take place every year between now and 2050 globally, in order to keep global warming below the critical two degrees Celsius threshold.25
Much of the capital needed to achieve the IEA’s clean energy investment target must come from corporate balance sheets. Companies across sectors are in a SRVLWLRQ�WR�QRW�RQO\�GHSOR\�PXFK�RI�WKH�FDSLWDO�QHHGHG��EXW�DOVR�WR�LQÀXHQFH�WKH�utility industry’s own investments. Unleashing companies as investors and leaders in clean energy requires further work to overcome barriers inside companies, in the electric sector, and within legislative chambers and regulatory agencies.
)RUWXQDWHO\��VXEVWDQWLDO�XQWDSSHG�SRWHQWLDO�H[LVWV�IRU�SUR¿WDEOH�FOHDQ�HQHUJ\�investments by the corporate sector. WWF and CDP’s The 3% Solution�¿QGV�that the U.S. corporate sector can capture up to $780 billion in net present value (NPV) savings by ramping up clean energy investments, including large amounts RI�HQHUJ\�HI¿FLHQF\��7KH�LQYHVWPHQWV�WKH�UHSRUW�LGHQWL¿HV�HQDEOH�WKH�HQWLUHW\�RI�the emissions reductions called for by science from non-utility companies to be PHW�SUR¿WDEO\��i,26
7KH�DQDO\VLV�DOVR�¿QGV�WKDW�IRXU�RXW�RI�¿YH�FRPSDQLHV�FDSWXUH�JUHDWHU�UHWXUQV�on their carbon reduction investments than they do on their average investment portfolio.27 What’s becoming clear is that companies don’t have to choose between the bottom line and addressing climate change.j
Moreover, such investments in renewable energy, greenhouse gas reductions, DQG�HQHUJ\�HI¿FLHQF\�LPSURYHPHQWV�KDYH�FRPH�WR�EH�H[SHFWHG�E\�PDLQVWUHDP��institutional investors. Setting targets in these areas is now “business as usual” and at the very least, investors expect companies to transparently set and report on targets and annual data on their emissions inventory and emission reduction initiatives.
i The 3% Solution found that to be on track to keep the rise of global temperatures below 2° Celsius, the
U.S. corporate sector must reduce GHG emissions at least 25 percent from 2010 to 2020, or an average of 3
percent per year across the corporate sector. The study finds these reductions can be done profitably when
looking at potential opportunities by sector. The Materials, Consumer Discretionary, and Transport sectors
have the most cost saving opportunities to reduce emissions.
j The 3% Solution and The 21st Century Corporation: the Roadmap to 2020 provide two resources for
companies to follow in setting goals or revising their goals to be in line with the demands of science.
Clorox: Tying Executive Pay to Emissions Reductions
Clorox has created a variable incentive package for its Chief Executive Officer, that is contingent on Clorox meeting its annual environmental footprint targets, including emissions reductions. WIth executive support, the company is succeeding in surpassing its goals.
Clorox had a target to reduce Scope 1, 2, and 3 emissions per case of product sold by 10 percent between 2007 and 2013. Ahead of schedule and above the target, the company achieved a 16.5 percent reduction in emissions by 2011. Clorox then set a second target of 20 percent emissions reduction per case of product sold from 2012 to 2020. By 2013, Clorox had reduced their emissions 9 percent - meeting 45 percent of this second target in one year.
With high ROI and generally paybacks less than three years, Clorox achieved these targets applying sustainable product design, renewable energy purchases, transportation fleet upgrades, and building efficiency techniques.

20 Power Forward 2.0
Companies should:
�� 6HW�WLPH�ERXQG�UHQHZDEOH�HQHUJ\��HQHUJ\�HI¿FLHQF\��RU�JUHHQKRXVH�JDV�(GHG) emissions reduction commitments.
�� ,QFOXGH�VSHFL¿F�UHQHZDEOH�HQHUJ\�DQG�HQHUJ\�HI¿FLHQF\�WDUJHWV��RU�DW�D�minimum ensure that both are part of any GHG reduction strategy. Many companies are realizing strong ROIs by achieving these targets.
• Be fully transparent in reporting their GHG commitments and the role that renewable energy should play in meeting them, using emerging global standards for Scope 2 carbon accounting.28 To measure progress, companies should publicly disclose the amount of renewable energy they purchase annually compared to their total energy consumption.
• Identify opportunities to support local, state, and national policies that UHPRYH�EDUULHUV�WR�VFDOH�XS�UHQHZDEOH�HQHUJ\��GHSOR\�HQHUJ\�HI¿FLHQF\��DQG�enable companies to achieve their climate commitments. All companies should be engaged in policy advocacy because it helps increase availability of renewable energy and lower prices, while bringing corporate commitments and public policy positions in line with one another.
Recommendations for investors
$V�LQYHVWRUV�UHDOL]H�FRPSDQLHV�FDQ�SUR¿W�DQG�VDYH�PRQH\�IURP�WKHVH�FOHDQ�HQHUJ\�opportunities, they expect companies to set and achieve carbon reduction targets. This report builds on a body of evidence that acting to adopt clean energy has value beyond risk mitigation. Indeed, forgone clean energy investments are likely forgone shareholder value.
Investors have recognized that climate change presents a “clear and present GDQJHU´�DQG�¿QDQFLDO�ULVN�WR�FRPSDQLHV�LQ�WKHLU�KROGLQJV��IURP�SK\VLFDO�LPSDFWV�of changing weather patterns, new regulations, and reputational risks among the public and key stakeholders for failing to act. In each of the past two years, LQYHVWRUV�KDYH�¿OHG�RYHU�����UHVROXWLRQV�UHODWHG�WR�FRUSRUDWH�FOLPDWH�FKDQJH�strategy and related practices. Investors now know that climate risk is�¿QDQFLDO�risk.
Investors should:
�� &RQWLQXH�WR�¿OH�UHVROXWLRQV�ZLWK�FRPSDQLHV�WR�VHW�FOLPDWH�DQG�HQHUJ\�WDUJHWV�to deliver cost savings and reduce climate-related business risk.
Recommendations for the electric sector
Companies in the Fortune 500 are increasingly adopting renewable energy strategies that bypass their utility, utilizing Power Purchase Agreements, third-SDUW\�¿QDQFLQJ�DQG�RQVLWH�GLUHFW�JHQHUDWLRQ��&RUSRUDWH�UHQHZDEOH�HQHUJ\�DGRSWLRQ�LV�WKHUHIRUH�ERWK�D�VLJQL¿FDQW�WKUHDW�DQG�D�SURPLVLQJ�RSSRUWXQLW\�IRU�XWLOLWLHV��:KHWKHU�XOWLPDWHO\�XWLOLWLHV�EHQH¿W�RU�DUH�KXUW�E\�FRUSRUDWH�HIIRUWV�ZLOO�depend on the electric sector’s response.
How American Companies Are Setting Clean Energy Targets and Capturing Greater Business Value 21
With 215 major companies setting greenhouse gas and renewable energy targets, WKHUH�LV�VLJQL¿FDQW�PDUNHW�GHPDQG�IRU�UHQHZDEOH�HQHUJ\�SURGXFWV�DQG�VHUYLFHV��However, many of these corporate leaders would prefer to buy renewable energy directly from their utility, given that most do not want to be in the business of procuring energy.
• Utility executives should acknowledge the trend of growing corporate demand for renewable energy and engage in dialogues with their large customers on ways to develop new renewable energy offerings to meet growing corporate demand. Cost-competitive options are currently lacking among the vast majority of utilities. Without competitive renewable energy offerings, companies have a continued incentive to go around their utilities to meet their public targets.
Special “green tariffs” or “green riders” that allow large customers to buy renewable energy through the utility offer a promising development. Green tariffs differ from utility green pricing programs in that the product offered includes ERWK�WKH�HOHFWULFLW\�DQG�UHQHZDEOH�HQHUJ\�FUHGLWV��5(&V��RQ�D�ORQJHU�WHUP��¿[HG�price basis, often from newly built renewable energy facilities. In December 2013, for example, the North Carolina Utilities Commission approved a new renewable energy program for Duke Energy Carolinas customers in North Carolina, the Green Source Rider program, designed for manufacturers, data centers, college campuses, and big box retailers.29 NV Energy in Nevada and Dominion Energy in Virginia have also introduced green tariffs for large customers, and several others are exploring them. However, most of the existing tariffs in large part do not meet the needs of large customers and more innovation and development is needed to make these tariffs consumer friendly.
• Utilities should explore dedicated “green tariffs” for their commercial and industrial customers.k
Recommendations for policymakers
As companies transition to being more active participants in the energy marketplace, they are looking for greater choice in their options to procure clean energy. Innovative public policy is key to opening this traditionally monopolistic and highly regulated sector to allow companies greater choice as consumers and the ability to participate as electricity generators.
Federal policies and many state policies have created, exacerbated, or failed to correct barriers that create a challenge for America’s largest companies as they pursue their renewable energy targets. In many cases, companies are pursuing strategies to knock down those barriers to greater renewable energy deployment and increasingly engaging in policy advocacy at local, state, and federal levels.
April 10, 2014, marked the one-year anniversary of the Climate Declaration, a corporate call-to-action that urges federal and state policymakers to seize the economic opportunity of addressing climate change. Launched by 33 founding companies and Ceres’ business coalition—Business for Innovative Climate and Energy Policy (BICEP)—the Climate Declaration now has more than 750
k The World Resources Institute has a paper for utilities on how to design green tariffs: Above and Beyond, Green Tariff Design for Traditional Utilities: http://www.wri.org/publication/green-tariff-design.
Bristol-Myers Squibb: Emissions Reductions is Corporate Strategy
Bristol-Myers Squibb has integrated tackling climate change into its overall business strategy. This strategy focuses on the economic benefits of reducing energy and other costs.
In 2010, Bristol-Myers Squibb achieved an absolute GHG reduction of 26 percent compared to a 2001 baseline. As a result, the company is strengthening its commitment and has instituted a 15 percent Scope 1, 2, and 3 emissions reduction target for 2015 (against a 2009 baseline). The company is currently on track to achieve this target. Projects the company has implemented include HVAC optimization, which has a payback of less than two-years.

22 Power Forward 2.0
signatories nationwide. These include large corporate buyers of renewable energy from within and outside the Fortune 500, including Apple, eBay, General Motors, IKEA, Intel, Mars Inc., Sprint, Starbucks, and Unilever.
$V�LQFUHDVLQJ�QXPEHUV�RI�FRPSDQLHV�¿QG�WDFNOLQJ�FOLPDWH�FKDQJH�LV�VPDUW�business, poor policy may lead to states losing out on economic development opportunities as companies site facilities in other states where policies are more conducive to corporate renewable energy adoption and the development of a clean energy sector. Many Fortune 500 companies, particularly the information technology (IT) industry, are developing renewable energy opportunities in locations where market conditions are most favorable, such as where PPAs and WKLUG�SDUW\�¿QDQFLQJ�DUH�DYDLODEOH�DV�ZHOO�DV�WKRVH�ZLWK�UHQHZDEOH�SRUWIROLR�standards (see case study 1 and 2, on how Nebraska and Michigan lost Facebook and American Express facilities, respectively, over access to clean power).
Ironically, some states may be using a range of incentives, like tax credits, to attract data centers, while undermining the renewable energy sectors that will attract them. One example is North Carolina, where the legislature has extended lucrative tax credits to data centers while considering legislation to roll back their renewable energy portfolio standard.
• Policymakers should take note of the fact that increasingly, companies are siting new facilities that bring jobs and economic development in states where they have access to renewable energy.
Stability in federal incentives
Inconsistent renewable energy policies hinder companies from setting ambitious commitments and pose an obstacle to meeting existing commitments because of uncertainty around the price, supply, and deployment of renewable energy.
The federal Production Tax Credit (PTC) for wind and Investment Tax Credit �,7&��IRU�VRODU�KDYH�EHHQ�NH\�WR�OHYHOLQJ�WKH�SOD\LQJ�¿HOG�IRU�FOHDQ�HQHUJ\��EXW�frequent expirations, particularly for the PTC, provide instability and uncertainty in the marketplace. In 2012, two-dozen investors with more than $800 billion in assets under management called for immediate extension of the PTC before its expiration at the end of the year. In 2012, 20 companies, including Microsoft, Starbucks, Staples, and Yahoo!, also called for an extension of the Production Tax Credit before its expiration.32 Sprint, which also endorsed the letter and has committed to securing 10 percent of its total electricity through renewable sources by 2017, advocated for the extension of the federal PTC for wind because its expiration puts their PPA strategy at risk.
• Federal policymakers should continue to support the Production Tax Credit for wind and Investment Tax Credit for solar, both of which have helped bring emerging technologies into the mainstream. Allowing both to expire will raise prices for companies committed to buying renewable energy.
%H\RQG�H[LVWLQJ�SROLF\�LQFHQWLYHV��WKH�8�6��LV�SRLVHG�WR�HQDFW�WKH�¿UVW�QDWLRQZLGH�limits on carbon pollution from power plants, the single largest source of such pollution in the United States. The Obama administration recently issued a new Climate Action Plan that, among other things, will jumpstart the implementation
“Tackling climate change is
one of America’s greatest
economic opportunities of the
21st century (and it’s simply
the right thing to do).”
From Ceres’ Climate Declaration30
“So, what’s stopping Walmart
and other big energy buyers
from doing more [renewable
energy]? You guessed it:
policies. Instead of just
quotas and subsidies, energy
buyers need more market
freedom to be able to go
directly to renewable energy
developers to negotiate a
power purchase agreement.
Competition is a good thing
for renewables.”
Miranda Ballentine, Director of
Sustainability, Renewable Energy
and Sustainable Facilities at
Walmart31
How American Companies Are Setting Clean Energy Targets and Capturing Greater Business Value 23
of long-overdue pollution regulations in the utility sector using the EPA’s existing DXWKRULW\�WR�UHJXODWH�JUHHQKRXVH�JDVHV�XQGHU�WKH�&OHDQ�$LU�$FW���(QHUJ\�HI¿FLHQF\�and renewable energy may be considered as eligible compliance options under EPA guidelines for limiting carbon dioxide emissions from existing power plants. ,I�(3$�WDNHV�WKLV�ÀH[LEOH�DSSURDFK��FRPSDQLHV�FRXOG�VFDOH�XS�WKHLU�HIIRUWV�LQ�HQHUJ\�HI¿FLHQF\�DQG�UHQHZDEOH�HQHUJ\�
State renewable portfolio standards
Nearly 30 states have adopted binding renewable energy targets, often called Renewable Portfolio Standards (RPS). Such targets are key to helping corporate buyers procure renewable energy – they create a marketplace to serve corporate buyers and allow non-utility participation to diversify a state’s renewable energy resources.
In recent years, these standards have withstood efforts by lawmakers to weaken or repeal the rules, helped in part by large corporate buyers and other business leaders. In Ohio, for example, Campbell’s Soup Company issued a public VWDWHPHQW�LQ�VXSSRUW�RI�VWDWH�UHQHZDEOH�DQG�HQHUJ\�HI¿FLHQF\�WDUJHWV���
Campbell’s Soup has set a corporate commitment to reduce greenhouse gas emissions by 50 percent per unit of production by 2020 and currently sources 8 percent of its total global electric power from renewable energy, including 33,000 solar panels at facilities around the world. At the company’s Napoleon, Ohio, SODQW��&DPSEHOO¶V�6RXS�KDV�LQVWDOOHG�D�����0:�VRODU�¿HOG�WR�JHQHUDWH����SHUFHQW�of the electricity required to run the operations at the largest soup manufacturing plant in the world.35
In Kansas, a similar effort to repeal the state Renewable Portfolio Standard was recently defeated. This was helped in part by support from the Greater Kansas City Chamber of Commerce36 and large corporate buyers like Sprint, which submitted written testimony to support the existing RPS.37
• State policymakers should continue to support renewable portfolio standards, which have provided a marketplace for renewable energy in which large corporate buyers are now participants. Fortune 500 companies are developing renewable energy opportunities in locations where market conditions are most favorable.
Ability to access renewable energy
In addition to state renewable targets, other key policy mechanisms for large corporate buyers include policies that allow for non-utility companies to participate in a market that has been historically limited to monopoly utilities. These policies include the ability to negotiate third-party PPAs and wheel power in regulated states, net metering, and standby charges.
“We need our voices to be
heard. We think it’s important
to have more green energy
choices in the United States.”
Amy Hargroves, Manager for
Corporate Responsibility, Sprint33
“Undoing the smart clean
energy policies that are in
place today won’t help us build
a stronger Ohio tomorrow.”
Dave Stangis, Vice President, Public
Affairs and Corporate
Responsibility, Campbell Soup
Company34

24 Power Forward 2.0
Policymakers have the opportunity to help large companies accelerate their renewable energy purchases and should be aware of the key criteria large corporate buyers are looking for:
• cost parity or better compared with the default energy rate, which is already possible in many markets
�� DFFHVV�WR�ORQJ�WHUP��¿[HG�SULFH�UHQHZDEOH�HQHUJ\�RSWLRQV�WKDW�UHÀHFW�WKDW�renewable energy doesn’t have fuel price volatility
• an ability to retain the renewable energy attributes (e.g., RECs, carbon credits, etc.), which enables corporate claims on progress toward overall commitments
• the ability to enter into PPAs in order to limit capital investment required
Net metering is another policy that has aided corporate participation in electricity markets. Net metering enables customers who supply their own electricity from onsite generation to sell electricity they do not use back into the grid at retail rates. This allows utilities to avoid costs from generating and delivering energy and better manage their peak electricity loads. To date, 43 states have passed net metering laws.38 Commercial electricity customers utilize net metering where it is available. In recent years, utilities have led efforts to weaken or amend net metering laws, which have implications particularly for onsite solar economics. 7KHVH�FRQÀLFWV�UHÀHFW�D�QHZ�UHDOLW\�ZKHUH�QRQ�XWLOLW\�FRPSDQLHV��DORQJ�ZLWK�individual homeowners) are taking power production into their own hands and creating an impetus for evolution in the prevailing business model of utilities.
• State utility regulators should authorize the use of third-party PPAs, preserve access to net metering, and remove policies that limit the development of onsite renewable power generation (including unreasonably high standby charges). Unstable and outdated policies are creating roadblocks for large corporate buyers of renewable energy.
eBay Par tners with Legislator for Energy ChoiceIn Utah, a unique collaboration between a Republican state senator, the state’s largest electric utility, and
eBay championed legislation (which was ultimately passed and signed by the governor) to allow non-utility
energy consumers to buy and transmit power directly from renewable energy developers in a regulated
market. Following passage of the legislation, eBay installed its largest onsite solar array (665 kW) and
announced plans to build a second data center in Utah. Similar legislation has now been explored in
Kansas. This policy tool is likely to continue to be pursued to allow large companies to scale their
renewable energy use.
© W
WF
-CA
NO
N

26 Power Forward 2.0
APPENDICE SAppendix A: Status of Fortune 100 companiesThis appendix analyzes changes in Fortune 100 targets, including: 1) companies that had 2012 targets hat were met or exceeded their goals, 2) companies that did not meet their 2012 targets, and 3) companies that set new targets.
Companies from the Fortune 100 with targets that expired in 2012
Companies that met or exceeded targets:
American Express had a 2012 target of reducing emissions 10 percent from 2006 levels (scopes 1, 2 & 3). The company reports achieving a 27.5 percent reduction and set a new target of achieving a 10 percent emissions reduction from 2011 levels by 2017 (also all three scopes).
AT&T had a 2012 target of adding 5 MW of alternative energy from 2011 baseline of 3.9 MW, and ultimately added 7 MW to get up to 11 MW total. The company set a new target to add 10 MW in 2013.
Boeing had two 2012 targets: a 1 percent absolute emissions reduction, and a 25 percent reduction at major manufacturing facilities, adjusted for revenue (both scope 1 & 2 and relative to 2007 baseline). The company reports achieving reductions of 9 percent and 26 percent, respectively. Boeing’s new target is a 50 percent reduction by 2050 of net aviation carbon emissions from a 2005 baseline.
Chevron’s target was a 0.7 percent reduction in scope 1 & 2 emissions in 2012 from 2011. Taking divestitures and acquisitions into account, this target was met. Chevron does not appear to have a new target.
Cisco’s target was 25 percent absolute reduction by 2012 against a 2007 baseline, and it achieved this with a 28 percent reduction. From the company’s 2012 baseline, Cisco now aims to reduce scope 1 & 2 emissions by 40 percent, and air travel (scope 3) emissions by 40 percent as well.
Originating from an industry initiative, ExxonMobil’s 2012 target was to reduce its downstream and chemical RSHUDWLRQV�VFRSH���*+*�HPLVVLRQV�LQWHQVLW\����SHUFHQW�WKURXJK�HQHUJ\�HI¿FLHQF\�IURP�LWV������EDVHOLQH��([[RQ0RELO�UHSRUWHG�D����SHUFHQW�LPSURYHPHQW�LQ�HQHUJ\�HI¿FLHQF\�IRU�UH¿QLQJ��DQG�D����SHUFHQW�LPSURYHPHQW�LQ�HQHUJ\�HI¿FLHQF\�for chemical manufacturing.
Goldman Sachs�KDG�D�WDUJHW�RI�DFKLHYLQJ�D���SHUFHQW�UHGXFWLRQ�RI�DEVROXWH�VFRSH������RI¿FH�HPLVVLRQV�E\������IURP�a 2007 baseline. The company achieved a 19 percent reduction (10 percent if data centers are included). Goldman Sachs ZDQWV�WR�EH�FDUERQ�QHXWUDO������SHUFHQW�RI�VFRSH������HPLVVLRQV�UHGXFWLRQ��E\������IRU�DOO�RI¿FHV�DQG�GDWD�FHQWHUV�
Hewlett-Packard had a 2012 target of acquiring 8 percent renewable energy for electricity use beyond what is already on the grid, and this target was achieved one year early. The company’s GHG target is a 20 percent reduction of scope 1 + 2 emissions by 2020 from a 2010 baseline. In 2011, HP had already achieved a 10 percent reduction.
IBM had a 2012 target of reducing scope 1 & 2 emissions by 12 percent from a 2007 baseline, and the company achieved 15.7 percent in reductions. IBM is currently preparing their next-generation climate target.
Intel had a target of reducing scope 1 & 2 emissions 20 percent by 2012 from a 2007 baseline. The company reports absolute reductions of 60 percent, and is now aiming for a further 20 percent reduction from 2012 by 2015. Intel also purchases RECs equal to 100 percent of their power usage.
J.P. Morgan Chase had a 2012 target of absolute scope 1 & 2 emissions reductions of 20 percent from a 2005 baseline. The company reduced emissions by 26 percent and has a new target of absolute emissions reductions of 40 percent by 2020 over a 2005 baseline.

How American Companies Are Setting Clean Energy Targets and Capturing Greater Business Value 27
Lockheed Martin had a target of reducing emissions 25 percent by 2012 from a 2007 baseline, which was achieved with a 31 percent reduction. Lockheed Martin’s new target is to reduce emissions 35 percent by 2020 from its 2010 baseline.
Pfizer’s 2012 target was a 20 percent reduction from its 2007 baseline, and this was achieved with a 25 percent UHGXFWLRQ��3¿]HU�QRZ�DLPV�WR�DFKLHYH�D����SHUFHQW�UHGXFWLRQ�E\������RYHU�LWV������EDVHOLQH��
State Farm’s 2012 target was an 18 percent reduction of emissions from a 2002 baseline. The company reports a 46 percent reduction achieved by 2008. State Farm has no new target.
SuperValu had a 2012 target of reducing emissions 10 percent from a 2007 baseline. The company reports that it exceeded this target.
Walmart’s GHG target was a 20 percent absolute emissions reduction in stores, clubs, and distribution centers by 2012 from a 2005 baseline. This target was achieved one year early. New targets have been created for scope 1, scope 1 & 2, and scope 3 emissions by 2015, 2020, and 2015, respectively. Additionally, Walmart has an aspirational goal of being powered 100% by renewables.
Walt Disney’s target was to get 50 percent of the way to net-zero emissions by 2012. The company reports meeting this target, and an additional target for 2013 is to reduce scope 2 emissions 10 percent from a 2006 baseline.
Companies that did not meet 2012 targets:
Dell had a target of reducing scope 1 & 2 carbon emissions by 15 percent per dollar of revenue by 2012 from its 2007 baseline. The company achieved reductions of nearly 11 percent per dollar of revenue. The scale of reductions and ¿QDQFLDO�VDYLQJV�ZDV�VWLOO�RQH�RI�WKH�ODUJHVW�UHSRUWHG�WR�&'3�LQ�������6HH�$SSHQGL[�%���'HOO¶V�QHZ�WDUJHW�LV�D�UHGXFWLRQ�RI�50 percent in scope 1 +2 emissions by 2020, but the company is not releasing a baseline year against which this goal will be measured until summer 2014.
Humana’s target was to reduce scope 1 & 2 emissions by 10 percent by 2012 from its 2009 baseline. The company achieved 4 percent reductions, and is keeping the 10 percent target as a continuing objective. Humana has not announced a new deadline.
TIAA-CREF’s target was to reduce scope 1 & 2 emissions intensity by 17.5 percent by 2012 over its 2007 baseline. 7KH�FRPSDQ\�IHOO�MXVW�VK\�RI�WKLV�WDUJHW��ZLWK�LQWHQVLW\�UHGXFWLRQV�RI����SHUFHQW�LQ�RI¿FH�HPLVVLRQV�DQG����SHUFHQW�LQ�multifamily and retail emissions. TIAA-CREF’s new target is a 20 percent intensity reduction by 2013 from the same 2007 baseline.
Fortune 100 companies with new commitments
Apple did not previously have renewable energy or greenhouse gas targets, but in 2013 the company created an aspirational target of being 100 percent powered by renewable energy. To that end, Apple created the largest privately owned clean energy facility in the country: two 20 MW solar farms at its data center in Maiden, NC. Apple also has a 10 MW fuel cell installation at the same site.
Pepsi�GLG�QRW�SUHYLRXVO\�KDYH�D�WDUJHW��EXW�KDV�QRZ�VHW�D�WDUJHW�RI�NHHSLQJ�VFRSH������HPLVVLRQV�ÀDW�DW������OHYHOV�through 2015.
Verizon already had a target of reducing scope 1 & 2 carbon intensity 50 percent by 2020 from its 2009 baseline. The company has now added a renewable energy target of implementing 10 MW by 2014.
Wells Fargo increased the aggressiveness of their target. The baseline year of 2008 remains the same, while the target has been moved from a 20 percent reduction in scope 1, 2 and business travel scope 3 emissions by 2018 to a 35 percent reduction by 2020. The company has already achieved reductions of 18 percent.
28 Power Forward 2.0
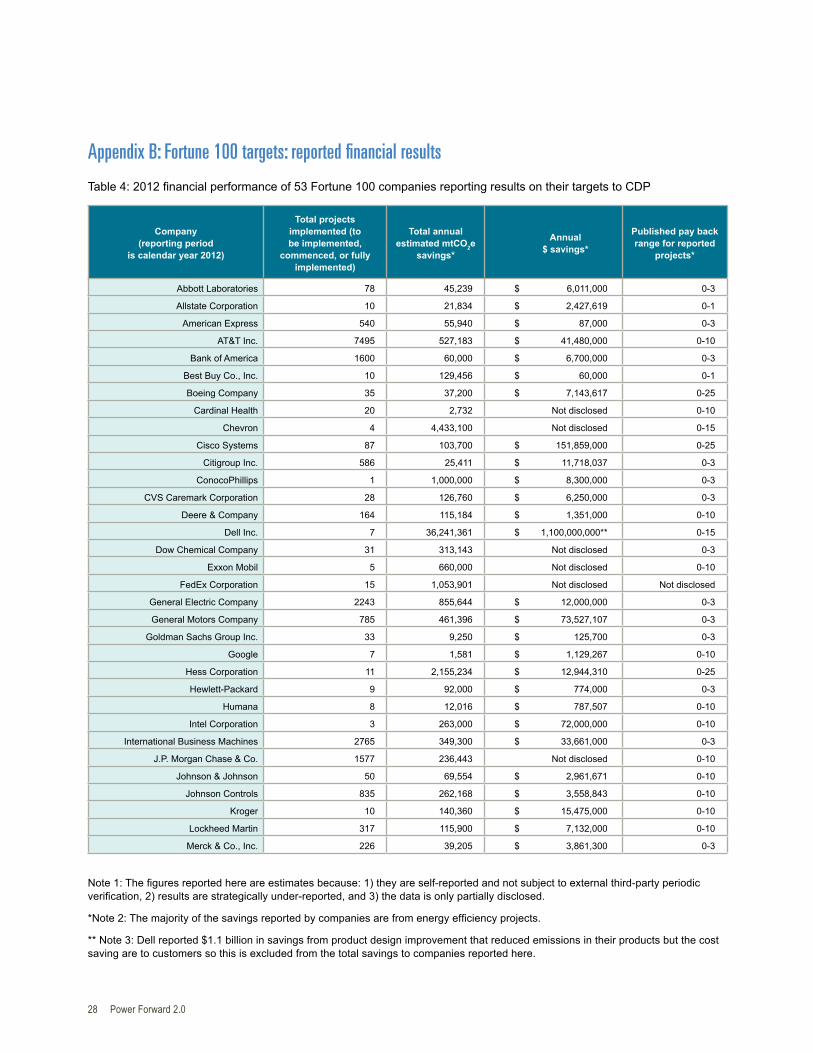
Appendix B: Fortune 100 targets: reported financial results
7DEOH���������¿QDQFLDO�SHUIRUPDQFH�RI����)RUWXQH�����FRPSDQLHV�UHSRUWLQJ�UHVXOWV�RQ�WKHLU�WDUJHWV�WR�&'3
Company
(reporting period
is calendar year 2012)
Total projects
implemented (to
be implemented,
commenced, or fully
implemented)
Total annual
estimated mtCO2e
savings*
Annual
$ savings*
Published pay back
range for reported
projects*
Abbott Laboratories 78 45,239 $ 6,011,000 0-3
Allstate Corporation 10 21,834 $ 2,427,619 0-1
American Express 540 55,940 $ 87,000 0-3
AT&T Inc. 7495 527,183 $ 41,480,000 0-10
Bank of America 1600 60,000 $ 6,700,000 0-3
Best Buy Co., Inc. 10 129,456 $ 60,000 0-1
Boeing Company 35 37,200 $ 7,143,617 0-25
Cardinal Health 20 2,732 Not disclosed 0-10
Chevron 4 4,433,100 Not disclosed 0-15
Cisco Systems 87 103,700 $ 151,859,000 0-25
Citigroup Inc. 586 25,411 $ 11,718,037 0-3
ConocoPhillips 1 1,000,000 $ 8,300,000 0-3
CVS Caremark Corporation 28 126,760 $ 6,250,000 0-3
Deere & Company 164 115,184 $ 1,351,000 0-10
Dell Inc. 7 36,241,361 $ 1,100,000,000** 0-15
Dow Chemical Company 31 313,143 Not disclosed 0-3
Exxon Mobil 5 660,000 Not disclosed 0-10
FedEx Corporation 15 1,053,901 Not disclosed Not disclosed
General Electric Company 2243 855,644 $ 12,000,000 0-3
General Motors Company 785 461,396 $ 73,527,107 0-3
Goldman Sachs Group Inc. 33 9,250 $ 125,700 0-3
Google 7 1,581 $ 1,129,267 0-10
Hess Corporation 11 2,155,234 $ 12,944,310 0-25
Hewlett-Packard 9 92,000 $ 774,000 0-3
Humana 8 12,016 $ 787,507 0-10
Intel Corporation 3 263,000 $ 72,000,000 0-10
International Business Machines 2765 349,300 $ 33,661,000 0-3
J.P. Morgan Chase & Co. 1577 236,443 Not disclosed 0-10
Johnson & Johnson 50 69,554 $ 2,961,671 0-10
Johnson Controls 835 262,168 $ 3,558,843 0-10
Kroger 10 140,360 $ 15,475,000 0-10
Lockheed Martin 317 115,900 $ 7,132,000 0-10
Merck & Co., Inc. 226 39,205 $ 3,861,300 0-3
1RWH����7KH�¿JXUHV�UHSRUWHG�KHUH�DUH�HVWLPDWHV�EHFDXVH�����WKH\�DUH�VHOI�UHSRUWHG�DQG�QRW�VXEMHFW�WR�H[WHUQDO�WKLUG�SDUW\�SHULRGLF�YHUL¿FDWLRQ�����UHVXOWV�DUH�VWUDWHJLFDOO\�XQGHU�UHSRUWHG��DQG����WKH�GDWD�LV�RQO\�SDUWLDOO\�GLVFORVHG��
1RWH����7KH�PDMRULW\�RI�WKH�VDYLQJV�UHSRUWHG�E\�FRPSDQLHV�DUH�IURP�HQHUJ\�HI¿FLHQF\�SURMHFWV�
** Note 3: Dell reported $1.1 billion in savings from product design improvement that reduced emissions in their products but the cost
saving are to customers so this is excluded from the total savings to companies reported here.

How American Companies Are Setting Clean Energy Targets and Capturing Greater Business Value 29
Company
(reporting period
is calendar year 2012)
Total projects
implemented (to
be implemented,
commenced, or fully
implemented)
Total annual
estimated mtCO2e
savings*
Annual
$ savings*
Published pay back
range for reported
projects*
Microsoft 13 1,031,804 $ 425,000 0-10
Mondelez International Inc 31 115,150 Not disclosed 0-10
Morgan Stanley 45 4,641 $ 867,474 0-3
Oracle Corporation 145 14,800 $ 1,125,000 0-3
PepsiCo 1500 300,000 $ 120,000,000 0-3
3¿]HU� 539 142,997 $ 10,025,243 0-10
Philip Morris International 532 88,000 $ 1,007,600 0-10
Prudential Financial 16 12,238 $ 1,910,000 0-25
Sprint Nextel Corporation 81 356,599 $ 31,661,892 0-25
Target Corporation 16 130,000 $ 6,600,000 0-10
The Coca-Cola Company 6 2,819,770 $ 2,250,000 0-10
The Home Depot, Inc. 6 111,000 $ 11,000,000 0-10
United Continental Holdings 9 810,820 $ 103,943,579 Not disclosed
United Technologies Corporation 338 75,440 $ 15,613,592 0-10
UnitedHealth Group Inc 75 50,579 $ 681,000 0-10
UPS 4 165,000 $ 200,384,000 0-10
Verizon Communications Inc. 120 430,300 $ 16,854,646 0-3
Wal-Mart Stores, Inc. 7435 1,506,000 $ 71,200,000 0-10
Walt Disney Company 10 958 $ 95,000 0-10
Wells Fargo & Company 10 118,977 $ 18,357,559 0-3
Totals 30,526 58,300,268 $ 1,097,326,563
7DEOH����3D\�EDFN�FRPSDULVRQ�E\�SHULRG�DQG�LQWHJUDWHG�¿QDQFLDO�FOLPDWH�UHWXUQV
Payback
periods
reported
CompaniesTotal projects
implemented
Total annual
estimated
mtCO2e
savings*
Annual $
savings*
Annual mtCO2e
savings per
project
Annual dollar
savings per
project *
Annual dollar
saving per
mtCO2e not
emitted*
0-1 2 20 151,290 $ 2,487,619 7,565 $ 124,381 $16
0-3 18 10,745 4,302,006 $ 320,219,823 400 $ 29,802 $74
0-10 24 19,496 8,642,819 $ 465,156,723 443 $ 23,859 $54
0-15 2 11 40,674,461 Not disclosed Not disclosed Not disclosed Not disclosed
0-25 5 230 2,664,971 $ 205,518,819 11,587 $ 893,560 $77
Not Disclosed 2 NA NA NA NA NA NA
All ranges 53 30,526 58,300,268 $ 1,097,326,563 1,910 $ 35,947 $18.82
1RWH��7KH�¿JXUHV�UHSRUWHG�KHUH�DUH�HVWLPDWHV�EHFDXVH�����WKH\�DUH�VHOI�UHSRUWHG�DQG�QRW�VXEMHFW�WR�H[WHUQDO�WKLUG�SDUW\�SHULRGLF�YHUL¿FDWLRQ��RU����UHVXOWV�DUH�VWUDWHJLFDOO\�XQGHU�UHSRUWHG��RU����WKH�GDWD�LV�RQO\�SDUWLDOO\�GLVFORVHG��
Table 4 continued from Page 28

30 Power Forward 2.0
7DEOH����,QWHJUDWHG�¿QDQFLDO�FOLPDWH�UHWXUQV�E\�VHFWRU
Companies SectorsTotal projects
implemented
Total annual
estimated
mtCO2e
savings*
Annual $
savings*
Annual mtCO2e
savings per
project
Annual dollar
savings per
project*
Annual
dollar saved
per mtCO2e
not emitted*
6Consumer
Discretionary1,662 1,094,978 $ 94,840,950 659 $ 57,064 $ 87
7 Consumer Staples 9,542 5,096,040 $ 216,182,600 534 $ 22,656 $ 42
4 Energy 21 8,248,334 $ 21,244,310 392,778 $ 1,011,634 $ 3
9 Financial 4,417 544,734 $ 42,193,389 123 $ 9,552 $ 77
7 Health Care 996 362,322 $ 24,327,721 364 $ 24,425 $ 67
8 Industrials 3,125 3,229,089 $ 347,567,788 1,033 $ 111,222 $ 108
8Information
Technology3,036 38,097,546 $ 260,973,546 12,549 $ 85,950 $ 7
1 Materials 31 313,143 Not Disclosed Not Disclosed Not Disclosed Not
Disclosed
3Telecommunication
Services7,696 1,314,082 $ 89,996,538 171 $ 11,694 $ 68
1RWH��7KH�¿JXUHV�UHSRUWHG�KHUH�DUH�HVWLPDWHV�EHFDXVH�����WKH\�DUH�VHOI�UHSRUWHG�DQG�QRW�VXEMHFW�WR�H[WHUQDO�WKLUG�SDUW\�SHULRGLF�YHUL¿FDWLRQ��RU����UHVXOWV�DUH�VWUDWHJLFDOO\�XQGHU�UHSRUWHG��RU����WKH�GDWD�LV�RQO\�SDUWLDOO\�GLVFORVHG��

How American Companies Are Setting Clean Energy Targets and Capturing Greater Business Value 31
Appendix C: Endnote references 1 Hewlett-Packard. “HP operations.” Retrieved from: http://www8.hp.com/us/en/hp-information/environment/operations-index. html#.U00IEKhdU5U
2 Ceres. “Gaining Ground: Corporate Progress on the Ceres Roadmap for Sustainability.” April 30, 2014. Retrieved from: http:// www.ceres.org/resources/reports/gaining-ground-corporate-progress-on-the-ceres-roadmap-for-sustainability/view
3 The World Resources Institute is updating its global accounting guidance “Scope 2” emissions from purchased energy. Final guidance is expected in 2014. For more information see: http://www.ghgprotocol.org/feature/ghg-protocol-power-accounting- guidelines
4 Fortune. “How we pick the 500.” Retrieved from: http://money.cnn.com/magazines/fortune/fortune500/2013/faq/?iid=F500_ ÀBPHWKRG
�� ::)��&'3�DQG�0F.LQVH\��&RPSDQ\��³7KH����6ROXWLRQ��'ULYLQJ�3URILWV�WKURXJK�&DUERQ�5HGXFWLRQ�´�-XQH�����������5HWULHYHG�from: KWWSV���ZZZ�ZRUOGZLOGOLIH�RUJ�SURMHFWV�WKH���VROXWLRQ
�� :DOPDUW��³:DOPDUW�$QQRXQFHV�1HZ�&RPPLWPHQWV�WR�'UDPDWLFDOO\�,QFUHDVH�(QHUJ\�(I¿FLHQF\�DQG�5HQHZDEOHV�´�$SULO�����������Retrieved from: http://news.walmart.com/news-archive/2013/04/15/walmart-announces-new-commitments-to-dramatically- LQFUHDVH�HQHUJ\�HI¿FLHQF\�UHQHZDEOHV
7 Ibid. 8 Ibid
9 Ceres. “Mutual fund companies show record high support for climate change shareholder resolutions.” February 20, 2014. Retrieved from: https://www.ceres.org/press/press-releases/mutual-fund-companies-show-record-high-support-for-climate-change- shareholder-resolutions
10 Ibid
11 Solar Energy Industries Association. “Solar Means Business 2013: Top U.S. Commercial Solar Users.” Retrieved from: http:// www.seia.org/research-resources/solar-means-business-2013-top-us-commercial-solar-users
12 Ibid.
13 Data Center Knowledge. “American Express to Build in North Carolina”, May 20, 2010. Retrieved from http://www. datacenterknowledge.com/archives/2010/05/20/american-express-to-build-in-north-carolina
14 Greenpeace. “Clicking Clean: How Companies are Creating the Green Internet.” April 2014. Retrieved from: http://www. greenpeace.org/usa/Global/usa/planet3/PDFs/clickingclean.pdf
15 Baker, Bryn and Dan Seif. On Balance Blog:”Big Business Wants Renewable Energy, But it Ain’t Easy” November 6, 2013. Retrieved At http://www.worldwildlife.org/blogs/on-balance/posts/big-business-wants-renewable-energy-but-it-ain-t-easy
��� /HQLR��-RKQ�7��³5H��3URMHFW�'RXEOHZLGH�(YDOXDWLRQ�8SGDWH�´�8QSXEOLVKHG�PHPR��&%�5LFKDUG�(OOLV��WR�0LFKLJDQ�(FRQRPLF�Development Corp.), March 3, 2010.
��� )DFHERRN�&RQ¿UPV�$OWRRQD��,RZD�'DWD�&HQWHU��$SULO�����������3&�0DJ
18 Facebook’s Altoona, Iowa, data center to be completely wind-powered, November 13, 2013, SlashGear.
19 How wind energy helped Iowa attract Facebook’s new data center, April 24, 2013, Midwest Energy News.
20 Greenpeace. “Clicking Clean: How Companies are Creating the Green Internet.” April 2014. Retrieved from: http://www. greenpeace.org/usa/Global/usa/planet3/PDFs/clickingclean.pdf
21 Google. “Expanding Renewable Energy Options for Companies Through Utility-Offered ‘Renewable Energy Tariffs.’” April 19, 2013. Retrieved from: https://static.googleusercontent.com/media/www.google.com/en/us/green/pdf/renewable-energy-options.pdf
���-RUGDQ��6WHYH��³*RRJOH�VLJQV�GHDO�ZLWK�0LG$PHULFDQ�(QHUJ\�WR�SRZHU�%OXIIV�GDWD�FHQWHU�´�2PDKD�:RUOG�+HUDOG��$SULO�����������Retrieved from: http://www.omaha.com/article/20140422/MONEY/140429678/1697
23 Ceres. “Gaining Ground: Corporate Progress on the Ceres Roadmap for Sustainability.” April 30, 2014. Retrieved from: http://www.ceres.org/resources/reports/gaining-ground-corporate-progress-on-the-ceres-roadmap-for-sustainability/view
24 Ceres. “The 21st Century Corporation: The Ceres Roadmap for Sustainability.” March 2010. Retrieved from: http://www.ceres. org/resources/reports/ceres-roadmap-to-sustainability-2010/view
25 International Energy Agency (IEA). “Energy Technology Perspectives 2012: Pathways to a Clean Energy System.” 2012. Retrieved from: http://www.iea.org/etp/etp2012/
32 Power Forward 2.0
���::)��&'3�DQG�0F.LQVH\��&RPSDQ\��³7KH����6ROXWLRQ��'ULYLQJ�3URILWV�WKURXJK�&DUERQ�5HGXFWLRQ�´�-XQH�����������5HWULHYHG�from: KWWSV���ZZZ�ZRUOGZLOGOLIH�RUJ�SURMHFWV�WKH���VROXWLRQ
27 Ibid.
28 The�World�Resources�Institute�is�updating�its�global�accounting�guidance�“Scope2”�emissions�from�purchased�energy.�Final guidance is expected in 2014. For more information see: http://www.ghgprotocol.org/feature/ghg-protocol-power-accounting- guidelines
29 PR Newswire. “North Carolina regulators approve Green Source Rider for Dike Energy Carolinas customers.” December 19, 2013. Retrieved from http://www.prnewswire.com/news-releases/north-carolina-regulators-approve-green-source-rider-for-duke-energy- carolinas-customers-236625561.html
30 Ceres.“Climate Declaration.” Retrieved from: http://www.ceres.org/bicep/climate-declaration
31 Ballentine, Miranda. “The secret to affordable renewable energy.” World Economic Forum. November 30, 2012. Retrieved from: http://forumblog.org/2012/11/the-secret-to-affordable-renewable-energy/
���*UHHQ%L]�FRP��³6WDUEXFNV��--��<DKRR��¿JKW�WR�H[WHQG�ZLQG�HQHUJ\�WD[�FUHGLW�´�6HSWHPEHU�����������5HWULHYHG�IURP��http://www. greenbiz.com/blog/2012/09/21/companies-extension-wind-tax-credit
33 Ceres. “Business Leaders Urge Congress to Extend Renewable Energy Tax Credit.” September 18, 2012. Retrieved from: http:// www.ceres.org/press/press-releases/business-leaders-urge-congress-to-extend-renewable-energy-tax-credit
34 Stangis, Dave. “Ohio’s Energy Policy Makes Sense for Business; We Shouldn’t Undo it.” Campbell’s Soup Company. December 2, 2013. Retrieved from: http://www.campbellsoupcompany.com/newsroom/news/120213-ohio-energy-policy-makes-sense-for- business
35 Ibid.
36 Vancrum, Bob. “2013 Kansas Legislative Report.” March 18, 2013. Retrieved from: https://www.kcchamber.com/KCChamber/ media/Media/PDFs/2013LegislativeUpdates/KS-Legislative-Update-3-18-13.pdf
37 Fucik, Patrick R. “Sprint Testimony in Opposition to SB 433 Before the Kansas Senate Utilities Committee” March 19th, 2014. Retrieved from: http://www.kslegislature.org/li/b2013_14/committees/ctte_s_utils_1/documents/testimony/20140319_21.pdf
���'DWDEDVH�RI�6WDWH�,QFHQWLYHV�IRU�5HQHZDEOHV��(I¿FLHQF\��³1HW0HWHULQJ�´�-XO\������5HWULHYHG�IURP��http://www.dsireusa.org/documents/summarymaps/net_metering_map.pdf

About the OrganizationsWorld Wildlife Fund (WWF) is one of the world’s leading conservation organizations, working in 100 countries for over half a century. With the support of almost 5 million members worldwide, WWF is dedicated to delivering science-based solutions to preserve the diversity and abundance of life on Earth, halt the degradation of the environment and combat climate change. For more information, visit www.worldwildlife.org.
Ceres is an advocate for sustainability leadership. It mobilizes a powerful coalition of investors, companies, and public interest groups to accelerate and expand the adoption of sustainable business practices and solutions to build a healthy global economy. Ceres also directs the Investor Network on Climate Risk (INCR), a network of 100 institutional investors with collective assets totaling more than $10 trillion. For more information, visit www.ceres.org and www.incr.com.
Calvert Investments is an investment management company serving LQVWLWXWLRQDO�LQYHVWRUV��UHWLUHPHQW�SODQV��¿QDQFLDO�LQWHUPHGLDULHV��DQG�WKHLU�clients. Many of Calvert’s investment strategies feature integrated corporate sustainability and responsibility research. Founded in 1976 and based in Bethesda, Maryland, Calvert Investments managed assets of more than $11.9 billion as of November 13, 2012. For more information, visit www.calvert.com.
David Gardiner and Associates is a strategic advisor to organizations seeking a sustainable future. We are focused on climate change, clean HQHUJ\��DQG�VXVWDLQDELOLW\��2XU�FOLHQWV�DUH�QRQ�SUR¿WV��FRUSRUDWLRQV��DQG�WUDGH�DVVRFLDWLRQV��2XU�QRQ�SUR¿W�FOLHQWV�LQFOXGH�DGYRFDF\�RUJDQL]DWLRQV�DQG�foundations, while our corporate clients include clean energy companies and companies committed to sustainability. We help our clients develop their strategies, conduct research and analysis, and improve their communications through our writing expertise, partnership building, and advocacy. Our team integrates decades of practical experience across business sectors with diverse subject expertise resulting in highly-tailored products or deliverables meeting WKH�VSHFL¿F�QHHGV�RI�HDFK�FOLHQW��)RU�PRUH�LQIRUPDWLRQ��YLVLW� www.dgardiner.com.