Embed Size (px)
Citation preview
Philip Ordway Principal and Portfolio Manager, Anabatic Investment Partners
January 13, 2016
Philip C. Ordway
Managing Principal
Anabatic Investment Partners LLC
(630) 481-4134
Opportunities in Building Products Companies
Disclaimer
This presentation has been prepared solely for informationalpurposes. Information herein is not intended to be complete, andsuch information is qualified in its entirety. This is not an offering orthe solicitation of an offer to purchase an interest in any fund, and itis not an offer to buy or sell or a solicitation of an offer to buy or sellany security. Nothing herein should be construed as investmentadvice, an opinion regarding the appropriateness or suitability ofany investment, on an investment recommendation.
No representation is made that the objectives or goals of anyinvestment or strategy will be met or that an investment or strategywill be profitable or will not incur losses. Past performance is noguarantee of future results.
Reliable methods were used to obtain information for thispresentation but the information herein cannot be guaranteed foraccuracy or reliability; the information in this presentation may beout of date or inaccurate.
The information contained in this summary is and may not bedistributed without permission.
2
Table of Contents
I. Overview and Investment Process
II. Review of Prior Conferences
III. Building Products – Ceilings
IV. Appendix
V. Contact Information
3
I. Overview and Investment Process
4
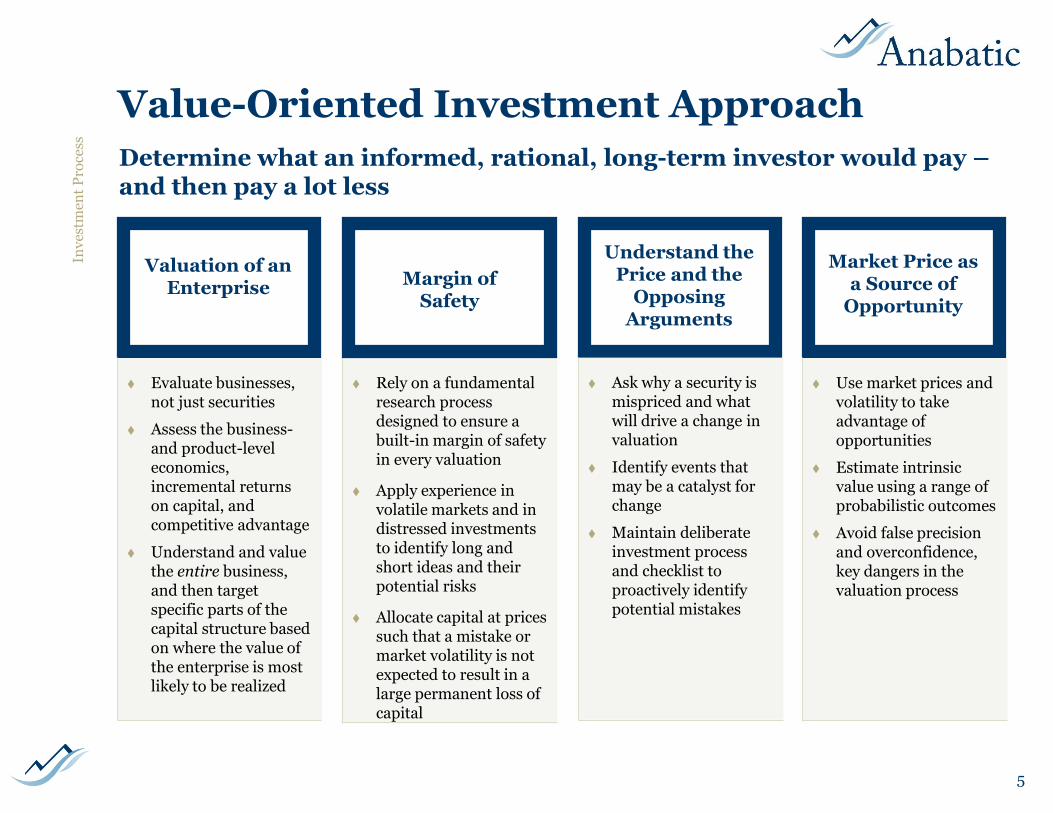
Determine what an informed, rational, long-term investor would pay –and then pay a lot less
Rely on a fundamental research process designed to ensure a built-in margin of safety in every valuation
Apply experience in volatile markets and in distressed investments to identify long and short ideas and their potential risks
Allocate capital at prices such that a mistake or market volatility is not expected to result in a large permanent loss of capital
Value-Oriented Investment Approach
5
Inv
estm
ent
Pro
cess
Valuation of an Enterprise
Margin of Safety
Understand the Price and the
Opposing Arguments
Evaluate businesses, not just securities
Assess the business-and product-level economics, incremental returns on capital, and competitive advantage
Understand and value the entire business, and then target specific parts of the capital structure based on where the value of the enterprise is most likely to be realized
Ask why a security is mispriced and what will drive a change in valuation
Identify events that may be a catalyst for change
Maintain deliberate investment process and checklist to proactively identify potential mistakes
Market Price as a Source of
Opportunity
Use market prices and volatility to take advantage of opportunities
Estimate intrinsic value using a range of probabilistic outcomes
Avoid false precision and overconfidence, key dangers in the valuation process
Anabatic’s investment philosophy is drawn from well-established value investing tenets
Investment Philosophy
A “margin of safety” is paramount – successful investments require investing at a price that absorbs volatility and errors to minimize the risk of a significant impairment to capital
Markets are highly competitive and often efficient, but investors occasionally act irrationally and thereby create opportunities; as such, value investors with a disciplined, rational and patient process can have a distinct advantage over time
Value investing works because it requires the time, patience and discipline that many investors lack –in other words, value investing works over time because it doesn’t work all the time
Valuation produces a range of estimates in seeking to minimize common valuation mistakes such as overconfidence and false precision
Good opportunities are rare and deserve meaningful capital – avoid diluting returns by over-diversifying, but employ an appropriate level of diversification over time to better protect capital
Preserve the flexibility to be opportunistic – invest in equity and in credit, take long and short positions, and hold cash when appropriate
Seek to act rationally in the face of near-term and be prepared to tolerate short-term volatility and underperformance in order to pursue expected long-term results
6
Inv
estm
ent
Pro
cess
Key Strengths
Fundamental value approach: Anabatic’s investment process utilizes fundamental analysis to evaluate businesses and invest when securities are believed to offer a significant margin between price and expected value
Focus on under-followed companies and special situations: Anabatic’s portfolio focuses on companies that attract relatively little attention from the market and on special situations that may be complex or subject to non-economic buying/selling pressure
Fund size: Capacity is carefully monitored to preserve an opportunistic approach as the ability to allocate to smaller companies and under-followed situations is a key advantage
Experience: Over the course of his career Mr. Ordway has analyzed and invested across the entire capital structure, long and short, in smaller companies, and in distressed credit situations, through a variety of market conditions
Concentration: Anabatic’s portfolio is expected to be concentrated, generally with 8-12 investments comprising at least two-thirds of capital
Long-term approach: Anabatic seeks to maintain a patient, long-term oriented investment process, particularly in the face of near-term market uncertainty and volatility; accordingly, Anabatic targets equally patient, like-minded investors
7
Ov
erv
iew
Value Orientation Discipline Patience
Investment Strategies
8
Inv
estm
ent
Pro
cess
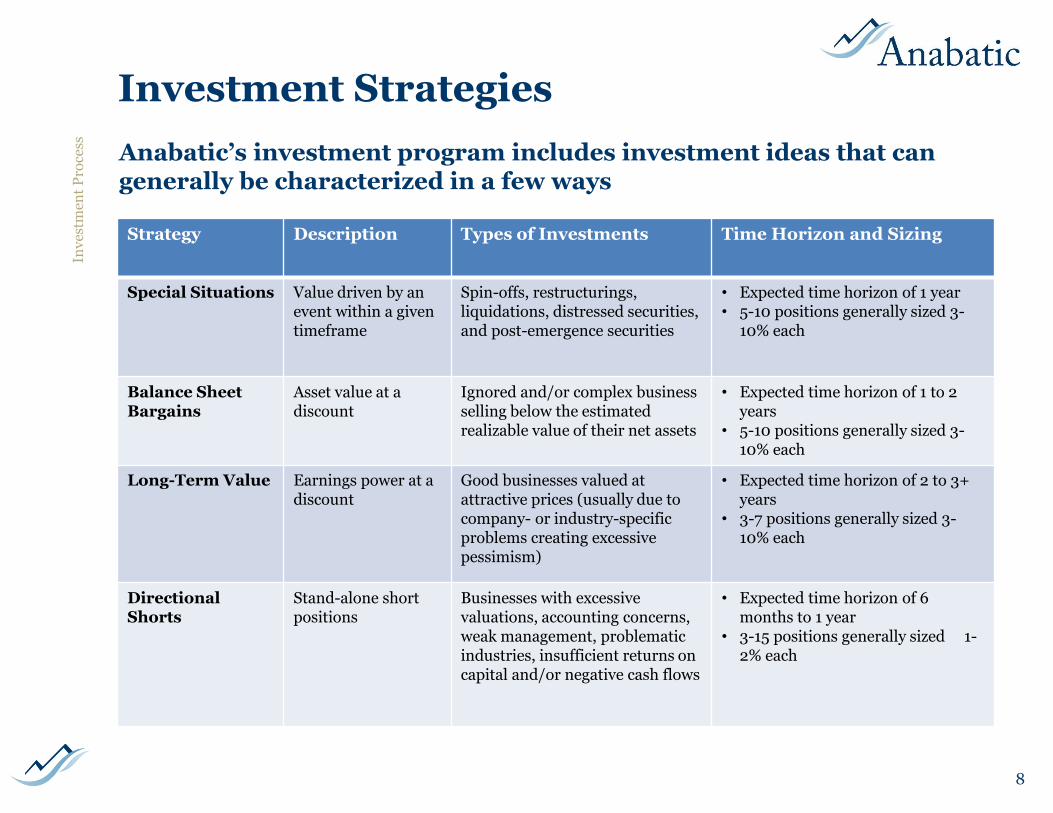
Strategy Description Types of Investments Time Horizon and Sizing
Special Situations Value driven by anevent within a given timeframe
Spin-offs, restructurings, liquidations, distressed securities, and post-emergence securities
• Expected time horizon of 1 year• 5-10 positions generally sized 3-
10% each
Balance Sheet Bargains
Asset value at a discount
Ignored and/or complex business selling below the estimated realizable value of their net assets
• Expected time horizon of 1 to 2 years
• 5-10 positions generally sized 3-10% each
Long-Term Value Earnings power at a discount
Good businesses valued at attractive prices (usually due to company- or industry-specific problems creating excessive pessimism)
• Expected time horizon of 2 to 3+ years
• 3-7 positions generally sized 3-10% each
Directional Shorts
Stand-alone short positions
Businesses with excessive valuations, accounting concerns, weak management, problematic industries, insufficient returns on capital and/or negative cash flows
• Expected time horizon of 6 months to 1 year
• 3-15 positions generally sized 1-2% each
Anabatic’s investment program includes investment ideas that can generally be characterized in a few ways
Finding OpportunitiesSmaller, over-looked companies and special situations often provide the best
opportunities
Anabatic’s investment universe includes smaller, under-followed companies and special situations: spin-offs, carve-outs, liquidations, recapitalizations, regulatory events, and distressed companies
As institutional capital concentrates in large funds, focusing on smaller companies is a key advantage
Forced or indiscriminate selling creates opportunities
Looking for trouble: value can often be found in securities that other investors are selling due to liquidity or regulatory constraints, distress, bankruptcy, ratings downgrades, and out-of-favor sectors
Reviewing as many spinoffs, bankruptcies and corporate events as possible creates a deep pool of potential investments and potentially useful business knowledge
A fundamental research process often leads to investment ideas
The development of deep industry- and company-specific knowledge can generate attractive investments
Heavy emphasis placed on evaluating original source documents such as annual reports, 10-Qs, proxies, registration statements, press releases, disclosure statements, etc.
Monitoring secondary sources (periodicals, trade journals, books, newsletters), screens/databases, and in-person research with managers, customers, and suppliers can also lead to new ideas
Maintaining an active “watch list” of previously valued companies
Reading, reading, and more reading
Email me for a copy of my reading list or to join my “good reading” distribution9
Inv
estm
ent
Pro
cess
Fundamental Business Analysis
Deep fundamental research is crucial in valuing companies, and the process aims to understand the key risk factors in each investment as well as the reasons that the perceived valuation gap will close
The fundamental research process, which is designed to thoroughly analyze and understand each business and security under consideration, generally incorporates:
– Close reading of original-source documents: annual reports, 10Qs, proxy statements, call transcripts, and press releases
– Evaluation of competitive position and industry dynamics, including the history and evolution of the firms
– Financial analysis: margins, ratios, and trends
– Assessment of customers, competitors, suppliers, employees, and managers
– Consideration of a future outcome in which the business has deteriorated and what went wrong
– Evaluation of the business performance over time and in varying business conditions
– Judgment of future capital investment opportunities for the business and management’s capital allocation priorities
– Determination of management’s honesty, ability, and incentives
Use fundamental analysis to estimate “fair value,” a range in which the business would be appropriately priced
Always invert and ask what could go wrong with a business and how capital could be impaired
10
Inv
estm
ent
Pro
cess
11
II. Review of Prior Conferences
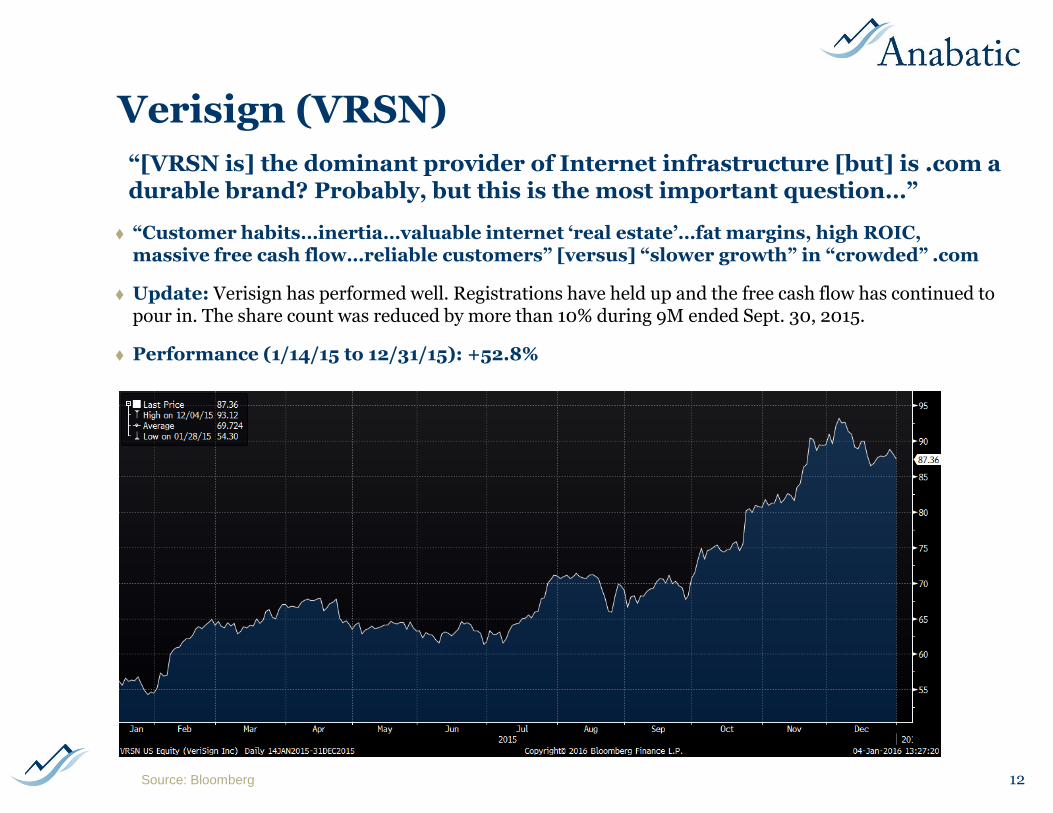
Verisign (VRSN)
“Customer habits…inertia…valuable internet ‘real estate’…fat margins, high ROIC, massive free cash flow…reliable customers” [versus] “slower growth” in “crowded” .com
Update: Verisign has performed well. Registrations have held up and the free cash flow has continued to pour in. The share count was reduced by more than 10% during 9M ended Sept. 30, 2015.
Performance (1/14/15 to 12/31/15): +52.8%
12
“[VRSN is] the dominant provider of Internet infrastructure [but] is .com a durable brand? Probably, but this is the most important question…”
Source: Bloomberg
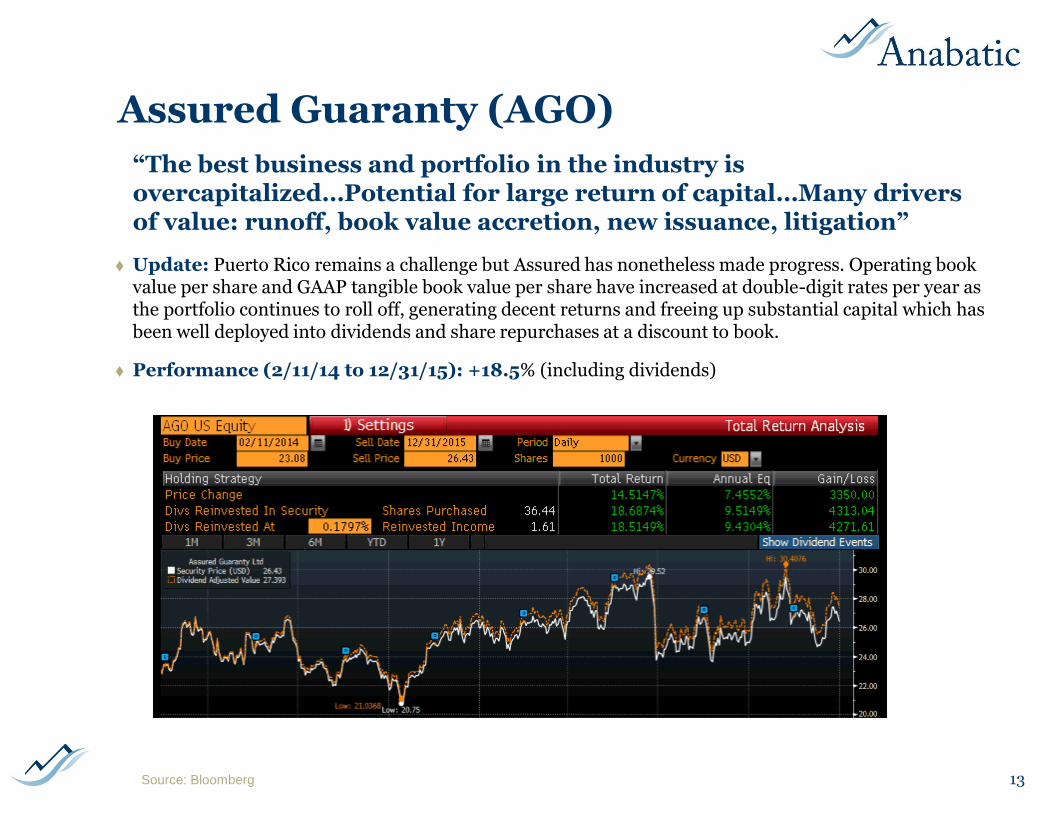
Assured Guaranty (AGO)
Update: Puerto Rico remains a challenge but Assured has nonetheless made progress. Operating book value per share and GAAP tangible book value per share have increased at double-digit rates per year as the portfolio continues to roll off, generating decent returns and freeing up substantial capital which has been well deployed into dividends and share repurchases at a discount to book.
Performance (2/11/14 to 12/31/15): +18.5% (including dividends)
13
“The best business and portfolio in the industry is overcapitalized…Potential for large return of capital…Many drivers of value: runoff, book value accretion, new issuance, litigation”
Source: Bloomberg
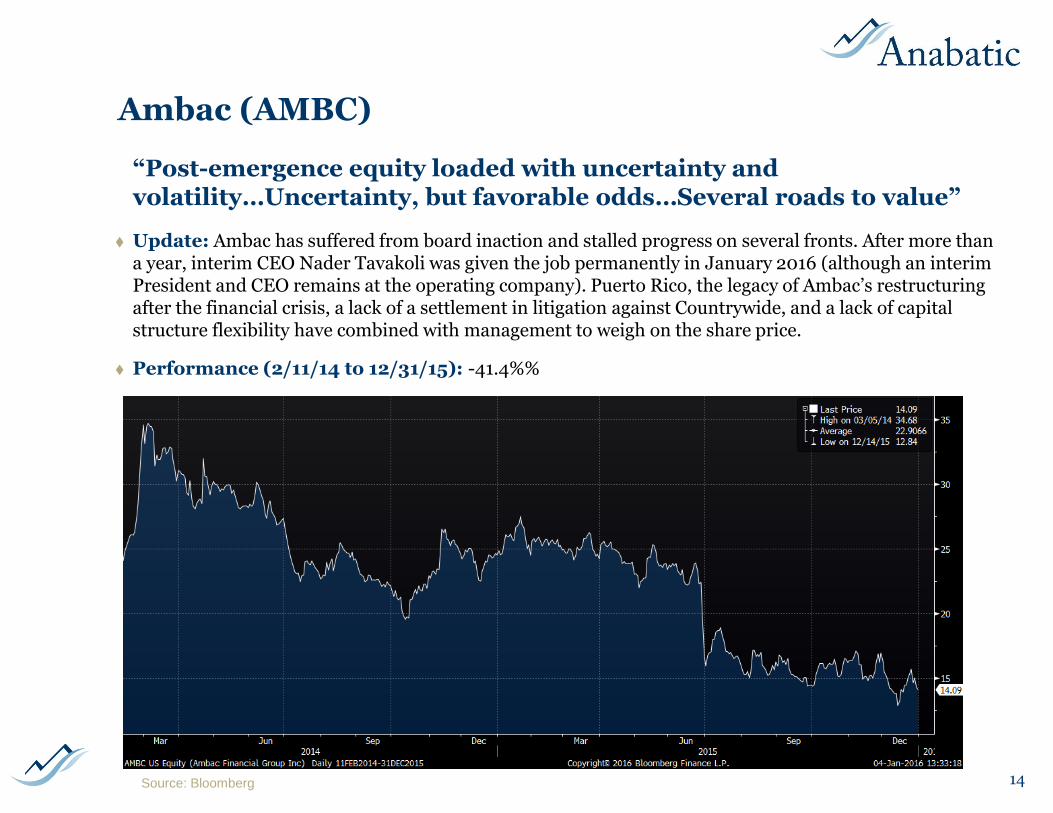
Ambac (AMBC)
Update: Ambac has suffered from board inaction and stalled progress on several fronts. After more than a year, interim CEO Nader Tavakoli was given the job permanently in January 2016 (although an interim President and CEO remains at the operating company). Puerto Rico, the legacy of Ambac’s restructuring after the financial crisis, a lack of a settlement in litigation against Countrywide, and a lack of capital structure flexibility have combined with management to weigh on the share price.
Performance (2/11/14 to 12/31/15): -41.4%%
14
“Post-emergence equity loaded with uncertainty and volatility…Uncertainty, but favorable odds…Several roads to value”
Source: Bloomberg
15
III. Building Products – Ceilings
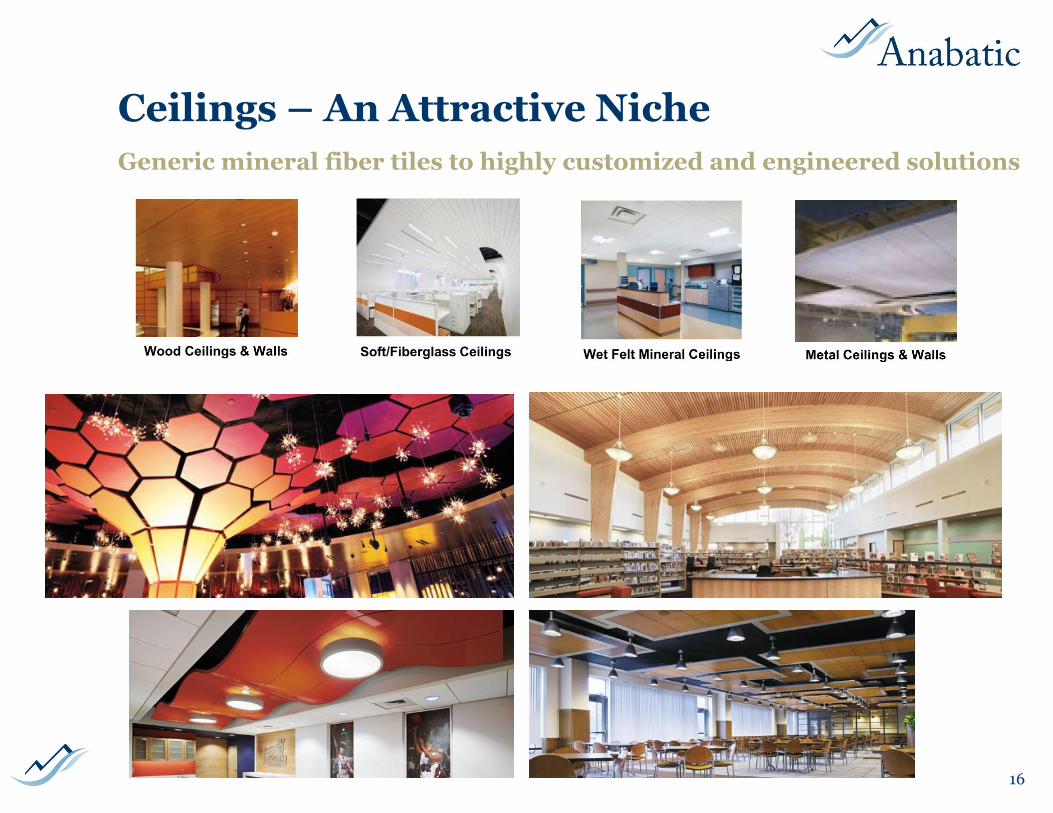
Ceilings – An Attractive Niche
16
Generic mineral fiber tiles to highly customized and engineered solutions
Ceilings – An Attractive Niche
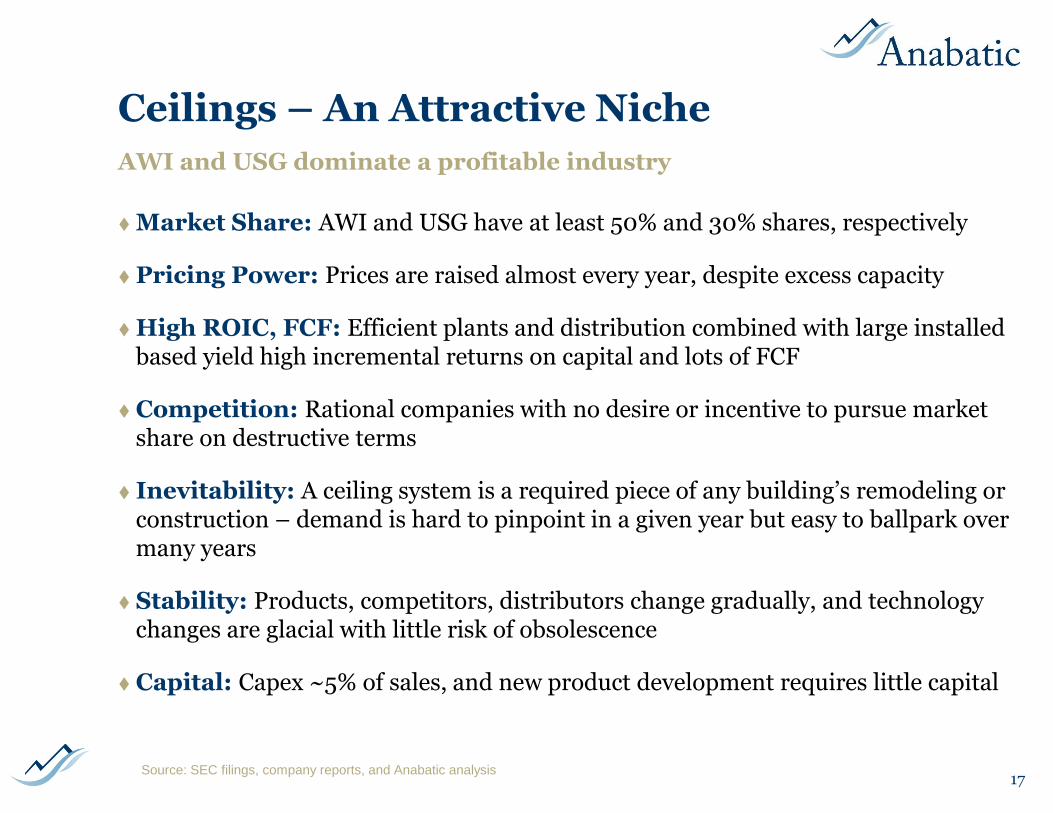
Market Share: AWI and USG have at least 50% and 30% shares, respectively
Pricing Power: Prices are raised almost every year, despite excess capacity
High ROIC, FCF: Efficient plants and distribution combined with large installed based yield high incremental returns on capital and lots of FCF
Competition: Rational companies with no desire or incentive to pursue market share on destructive terms
Inevitability: A ceiling system is a required piece of any building’s remodeling or construction – demand is hard to pinpoint in a given year but easy to ballpark over many years
Stability: Products, competitors, distributors change gradually, and technology changes are glacial with little risk of obsolescence
Capital: Capex ~5% of sales, and new product development requires little capital
17
AWI and USG dominate a profitable industry
Source: SEC filings, company reports, and Anabatic analysis
Ceilings – An Attractive Niche
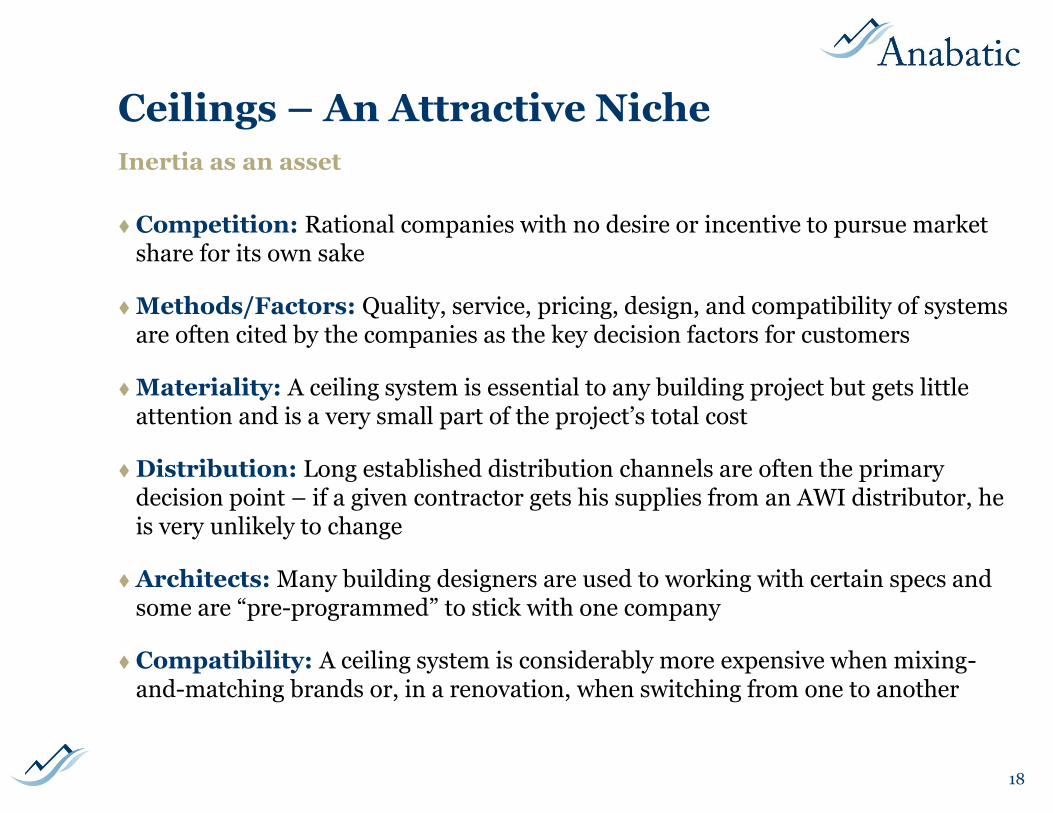
Competition: Rational companies with no desire or incentive to pursue market share for its own sake
Methods/Factors: Quality, service, pricing, design, and compatibility of systems are often cited by the companies as the key decision factors for customers
Materiality: A ceiling system is essential to any building project but gets little attention and is a very small part of the project’s total cost
Distribution: Long established distribution channels are often the primary decision point – if a given contractor gets his supplies from an AWI distributor, he is very unlikely to change
Architects: Many building designers are used to working with certain specs and some are “pre-programmed” to stick with one company
Compatibility: A ceiling system is considerably more expensive when mixing-and-matching brands or, in a renovation, when switching from one to another
18
Inertia as an asset
Cyclicality
19
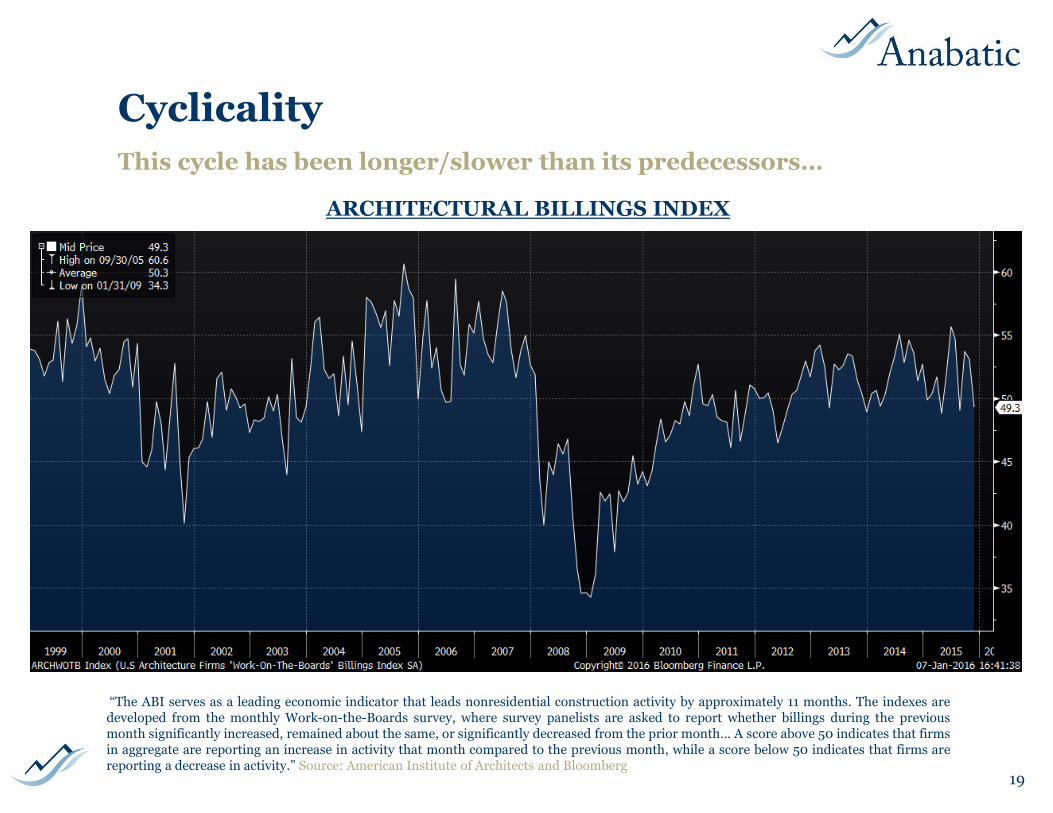
ARCHITECTURAL BILLINGS INDEX
“The ABI serves as a leading economic indicator that leads nonresidential construction activity by approximately 11 months. The indexes aredeveloped from the monthly Work-on-the-Boards survey, where survey panelists are asked to report whether billings during the previousmonth significantly increased, remained about the same, or significantly decreased from the prior month… A score above 50 indicates that firmsin aggregate are reporting an increase in activity that month compared to the previous month, while a score below 50 indicates that firms arereporting a decrease in activity.” Source: American Institute of Architects and Bloomberg
This cycle has been longer/slower than its predecessors…
Cyclicality
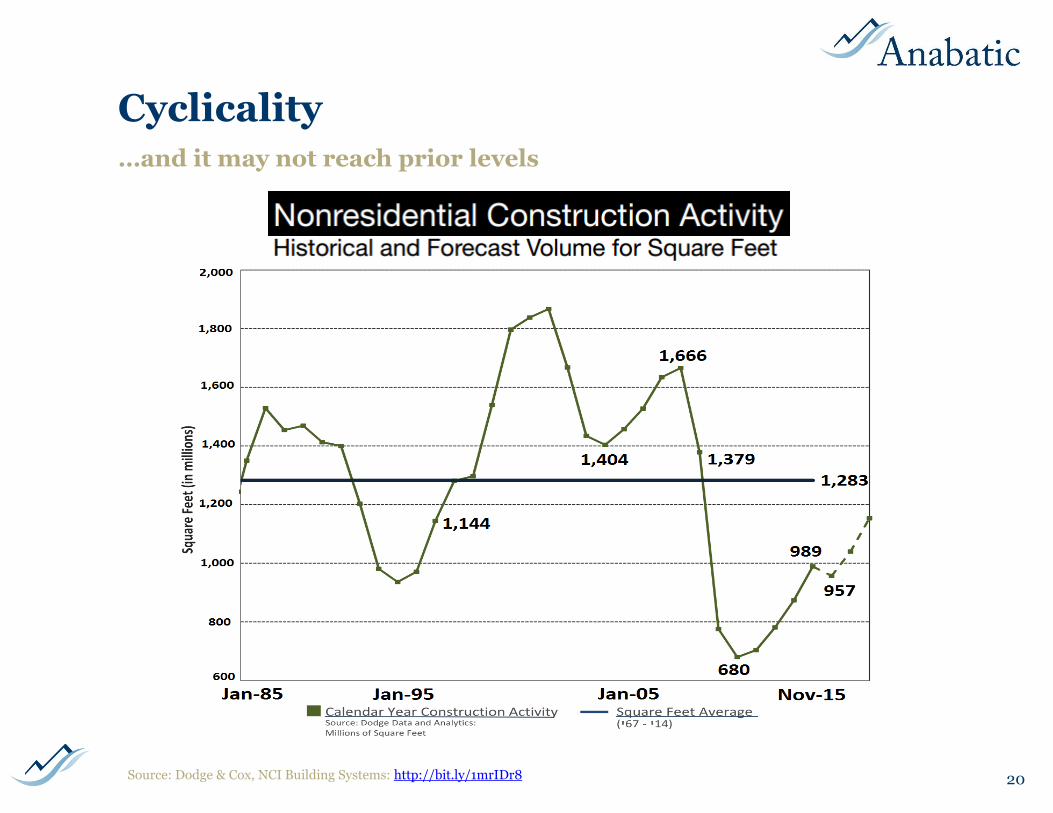
20Source: Dodge & Cox, NCI Building Systems: http://bit.ly/1mrIDr8
…and it may not reach prior levels
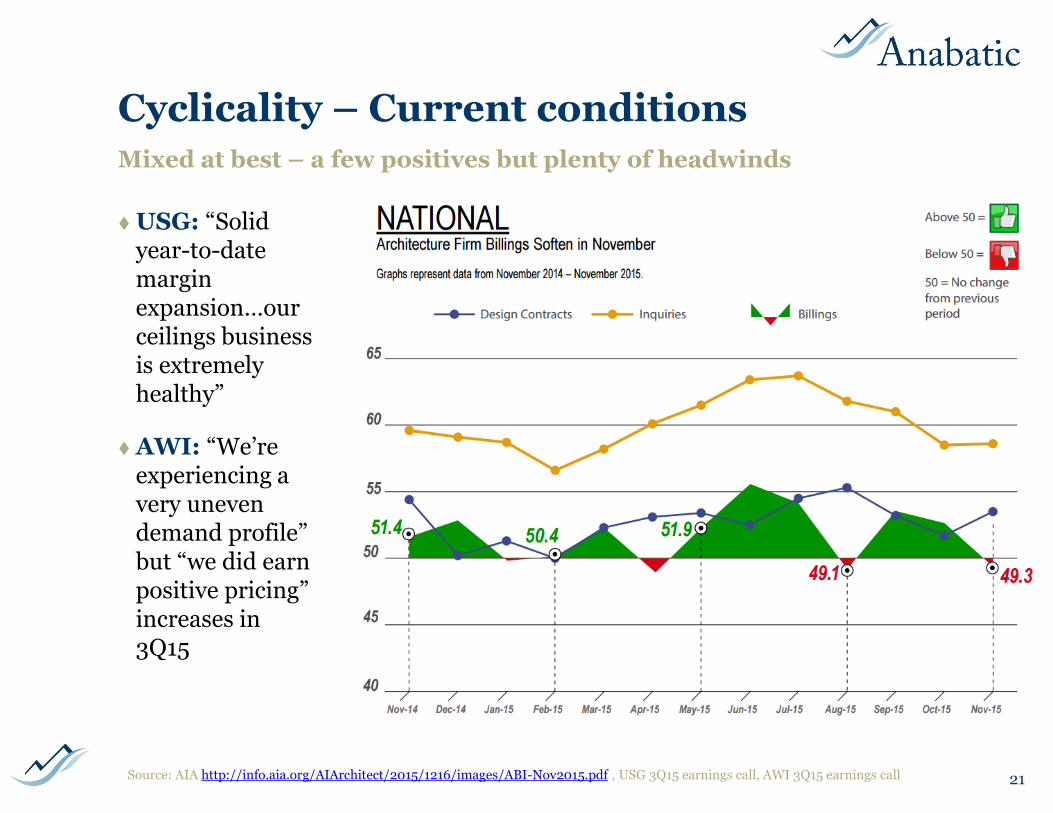
Cyclicality – Current conditions
21Source: AIA http://info.aia.org/AIArchitect/2015/1216/images/ABI-Nov2015.pdf , USG 3Q15 earnings call, AWI 3Q15 earnings call
USG: “Solid year-to-date margin expansion…our ceilings business is extremely healthy”
AWI: “We’re experiencing a very uneven demand profile” but “we did earn positive pricing” increases in 3Q15
Mixed at best – a few positives but plenty of headwinds
Cyclicality
22
Thoughts to consider
Plenty of problems: U.S. economic strength/growth probably slowing; currency and emerging market exposure are headwinds; political gridlock and budget constraints are slowing spending
Past ≠ Prologue: Do not assume we’ll get back to the historical average – many large sources of demand (law firms, financial firms, schools, government) have reduced need for space
Renovation > New Construction: Renovation accounts for 70% or more of the industry
Timing: Renovation projects have a high correlation with GDP and general business confidence; ceiling installs and billing happen on a ~12 month lag to project starts
Cash Flow: The industry is undoubtedly cyclical, but the cash flows are more resilient than many might think
Industry Structure is Important
“Here's a model that we've had trouble with... Many markets get down to two or three big competitors—or five or six. And in some of those markets, nobody makes any money to speak of. But in others, everybody does very well. Over the years, we've tried to figure out why the competition in some markets gets sort of rational from the investor's point of view so that the shareholders do well, and in other markets, there's destructive competition that destroys shareholder wealth.
“If it's a pure commodity like airline seats, you can understand why no one makes any money. As we sit here, just think of what airlines have given to the world—safe travel, greater experience, time with your loved ones, you name it. Yet, the net amount ofmoney that's been made by the shareholders of airlines since Kitty Hawk is now a negative figure—a substantial negative figure. Competition was so intense that, once it was unleashed by deregulation, it ravaged shareholder wealth in the airline business.
“Yet, in other fields—like cereals, for example—almost all the big boys make out. If you're some kind of a medium grade cereal maker, you might make fifteen percent on your capital. And if you're really good, you might make forty percent. But why are cereals so profitable—despite the fact that it looks to me like they're competing like crazy with promotions, coupons and everything else? I don't fully understand it.
“Obviously, there's a brand identity factor in cereals that doesn't exist in airlines. That must be the main factor that accounts for it. And maybe the cereal makers by and large have learned to be less crazy about fighting for market share—because if you get even one person who's hell-bent on gaining market share.... For example, if I were Kellogg and I decided that I had to have sixty percent of the market, I think I could take most of the profit out of cereals. I'd ruin Kellogg in the process. But I think I could do it. In some businesses, the participants behave like a demented Kellogg. In other businesses, they don't. Unfortunately, I do not have a perfect model for predicting how that's going to happen.
“For example, if you look around at bottler markets, you'll find many markets where bottlers of Pepsi and Coke both make a lot of money and many others where they destroy most of the profitability of the two franchises. That must get down to the peculiarities of individual adjustment to market capitalism. I think you'd have to know the people involved to fully understand what was happening.” – Charlie Munger, 1994 speech at USC* (emphasis added)
*Source: Poor Charlie’s Almanack, Expanded Second Edition, pps. 185-187
23
I don’t like to quote the legends – it can enable me to hide my lazy thinking behind someone else’s genuine insights – but this is too good to pass up
USG
Ceilings: A leading supplier of commercial ceilings products with #2 market share in ceiling grid and acoustical ceiling tile worldwide (behind AWI), but accounting for only ~10% of consolidated sales, ~15-20% of operating income
10 manufacturing plants in North America: ceiling tile in U.S. and ceiling grid in U.S. and Canada; Asia-Pac operations placed into 50-50 JV with Boral in 2014
Brands: RADARTM, ECLIPSETM, MARSTM, and HALCYONTM brands of ceiling tile and the DONN®, DX®, FINELINE®, CENTRICITEETM, DXI IDENTITEETM, CURVATURATM and COMPASSOTM brands of ceiling grid
Mostly commercial: ~70% of sales from repair and remodel and ~30% new construction
L&W Supply: USG’s distribution segment delivers LTL quantities of construction materials (including gypsum wallboard, join compound, ceiling tile and grid, insulation, roofing, and fasteners)
Scale benefits might be expected (L&W distributed 7% of all gypsum board in the U.S. in 2014) but instead L&W has shriveled (270 DCs in 2007 to 145 in 2015)
Distribution is not mutually exclusive – many jobs use USG wallboard and AWI ceilings
24
The “other” large ceilings company is less focused on ceilings
Source: SEC filings and usg.com
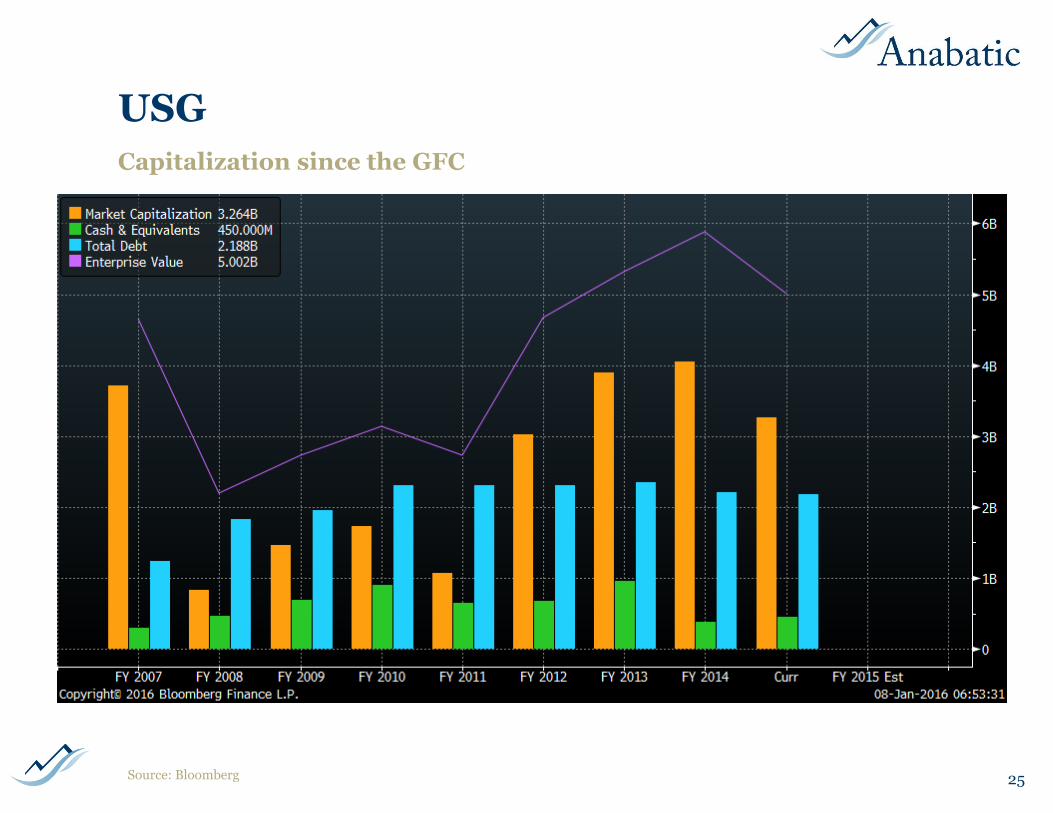
USG
25
Capitalization since the GFC
Source: Bloomberg
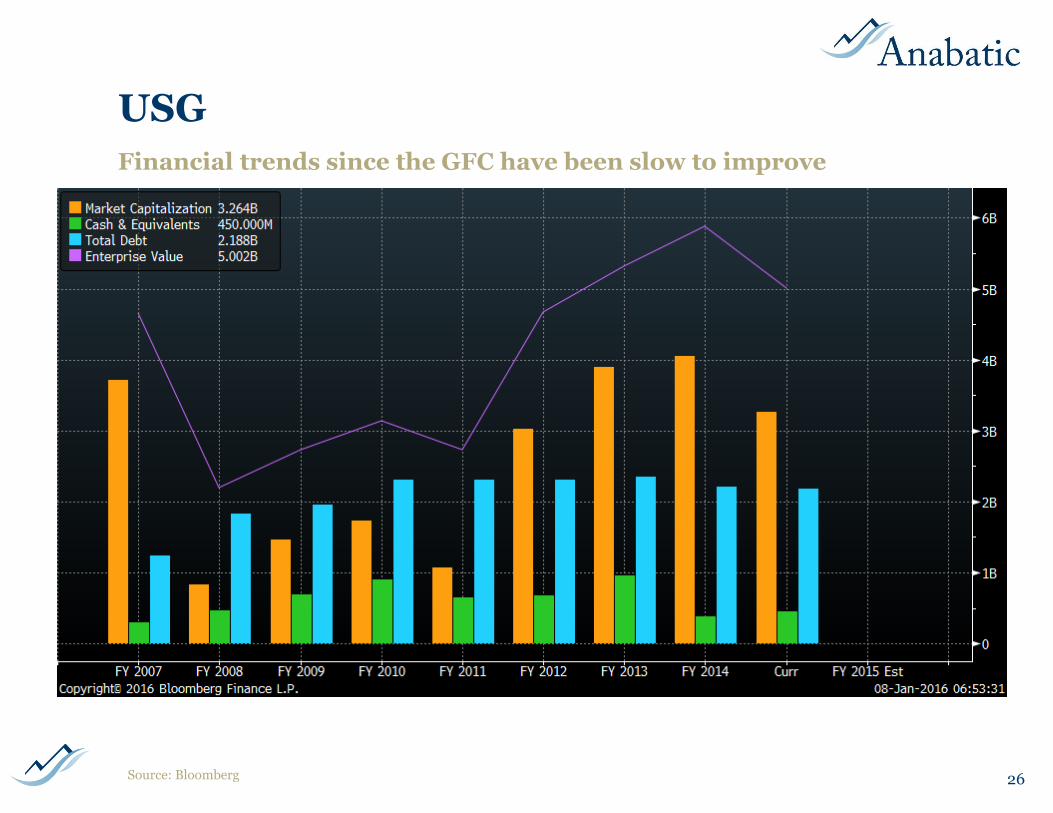
USG
26
Financial trends since the GFC have been slow to improve
Source: Bloomberg
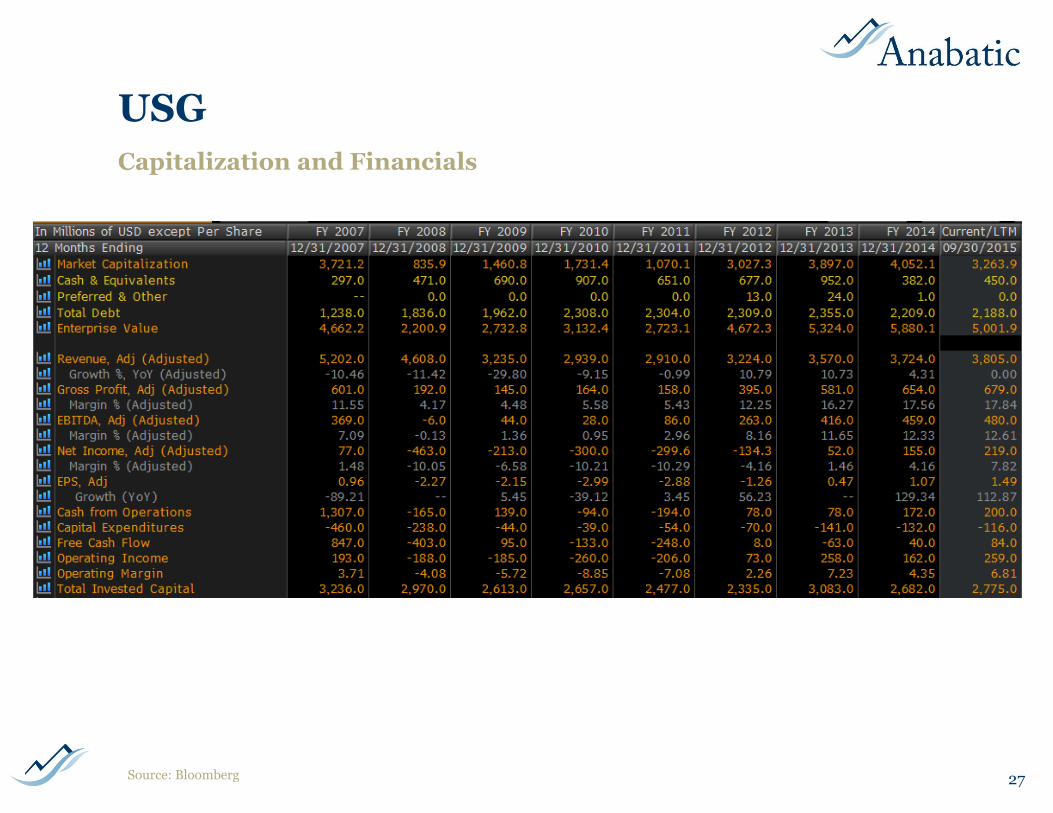
USG
27
Capitalization and Financials
Source: Bloomberg
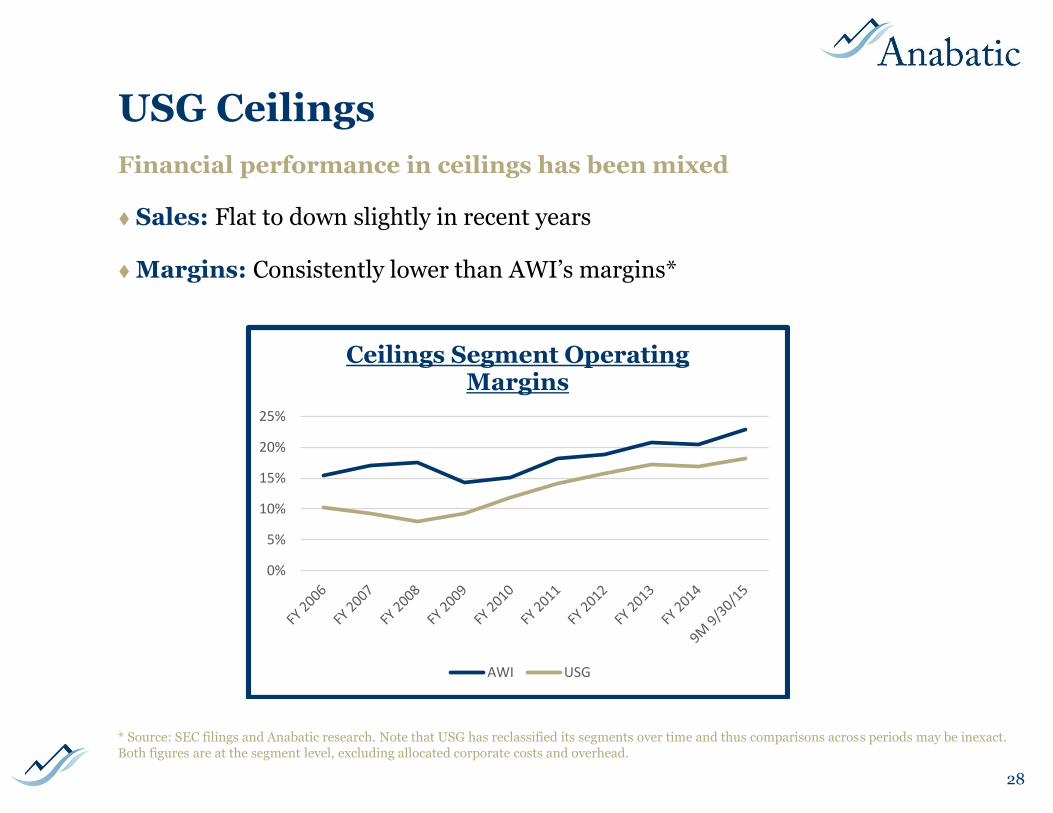
USG Ceilings
Sales: Flat to down slightly in recent years
Margins: Consistently lower than AWI’s margins*
* Source: SEC filings and Anabatic research. Note that USG has reclassified its segments over time and thus comparisons across periods may be inexact. Both figures are at the segment level, excluding allocated corporate costs and overhead.
28
Financial performance in ceilings has been mixed
0%
5%
10%
15%
20%
25%
Ceilings Segment Operating Margins
AWI USG
USG
Berkshire: USG is 29.8% owned by Berkshire Hathaway, a backer of the company dating to an initial 15% stake acquired in 2000
Berkshire, already a large holder, backstopped a 2006 rights offering upon emergence from Chapter 11*; standstill expired August 2013 but 50% cap remains
In Nov. 2008 Berkshire bought part of a $400 million convertible senior note (since converted to common)
Others:
Knauf (building products competitor): 10.1%
Below 5%: London Co. of Virginia, TIAA-CREF, T Rowe Price, Vanguard, Sasco Capital, Harris Associates, Shapiro Capital, Blackrock, Lord Abbett
* Buffett said of USG, "It's the most successful managerial performance in bankruptcy that I've ever seen.” Wall Street Journal, February 15, 2006
29
Shareholders
Source: SEC filings
Other competitors
Saint-Gobain: French multinational conglomerate (SGO.FP) with full line of ceiling products (CertainTeed brand among many others)
Knauf: European family-owned building products company with ceilings segment
OWA: German family-owned ceilings company with full, global offering
Rockwool: Danish building products company (ROCKA.DC) and parent of ROCKFON (acoustic stone wool and metal ceiling suspension systems)
ROCKFON acquired grid manufacturer Chicago Metallic in 2013 ($139 million in 2012 sales) to offer a complete ceiling system with ROCKFON stone wool and specialty metal ceiling panels and Chicago Metallic suspension systems.
“This acquisition is part of the ROCKWOOL Group’s strategy to globalise and develop its ceiling business which today accounts for approximately 10% of Group revenues.” If there is an upstart competitor this is it.
Source: Regulatory filings and company websites
30
Several firms comprise remaining ~20% share of the market
Armstrong World Industries (AWI)
History: Incorporated in Pennsylvania in 1891.
Plant: 31 plants in eight countries, with 7,400 employees
Ch. 11: Filed for bankruptcy protection in 2000 due to asbestos exposure, emerging in 2006
Growing and Shrinking: AWI has a long history of adding and shedding business segments. The current business entails two primary segments: Armstrong Building Products (ABP), which is the core ceilings business, and Armstrong Flooring, Inc. (AFI)
31
Market headwinds: Asbestos, housing/financial crisis, currency fluctuations, emerging markets drama – something is wrong most of the time
Separation: Planned March/April 2016 spinoff of struggling Armstrong Flooring Inc. segment (AFI) from excellent Armstrong Building Products segment (ABP)
Source: SEC filings and www.armstrong.com
Founder Thomas M. Armstrong in 1860
AWI – The Good, The Bad, and the Ugly
Good
Dominant and entrenched position in profitable niche with low competition
Predictable, long-duration cash flows
High ROIC business (obscured by AFI losses and capex) producing lots of FCF
Successful management team in ceilings segment; ValueAct stake, board seat
Bad
Something is usually wrong (macro, FX, commodities) and it’s usually beyond management’s control
Emerging markets investments are painful for now, and they may not pay off
Ugly
Flooring is an unattractive business and there is transaction risk in the (late-cycle) spinoff
32Source: SEC filings, company reports, and Anabatic analysis
AWI – Other Financial Considerations
Earnings and cash flow
Since 2006, gain in price + mix more than double the rate of inflation
~$1 billion in remaining NOLs
No cash pension contributions for ~20 years
Capital allocation
$1.3 billion in special dividends paid since 2009 (due to Injury Trust?); no regular dividend
Only $260 million of share repurchases (mostly in 2014)
Likely to retain ~$1 billion of debt post-AFI spin against >$350 million of cash
33Source: SEC filings, company reports, and Anabatic analysis
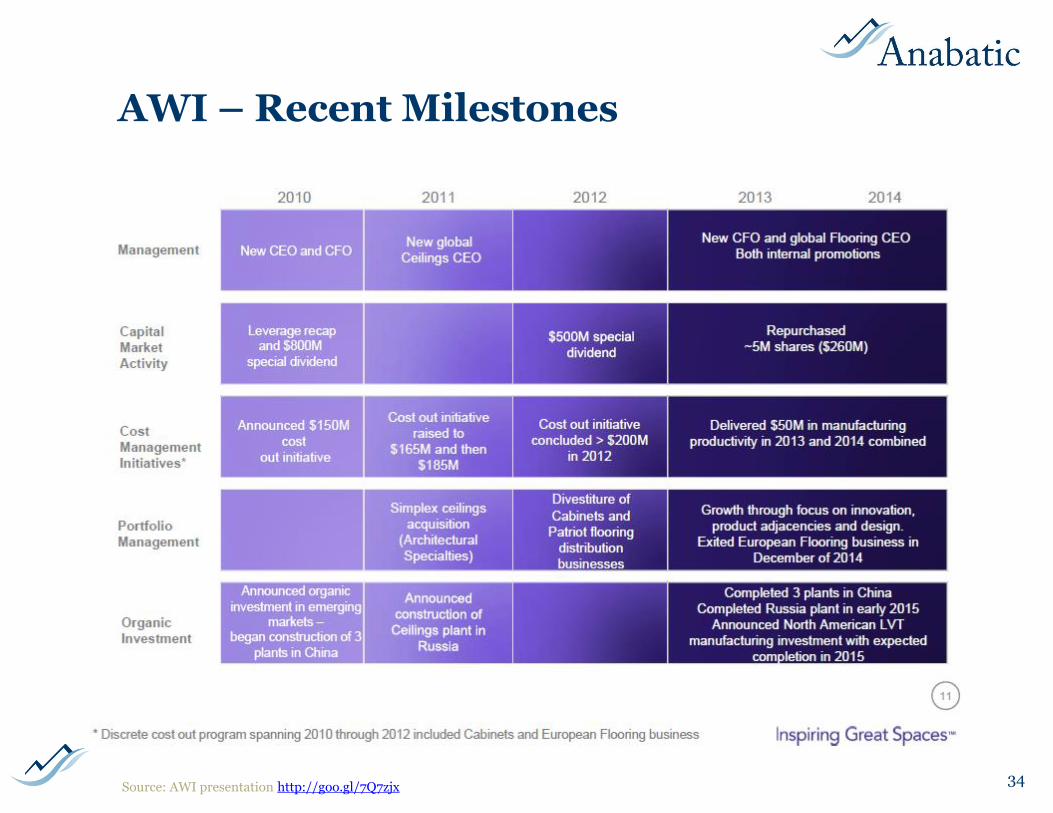
AWI – Moving Parts
Gin rummy: Many segments reshuffled over many years
2007: European and sports flooring segment sold to NPM Capital
2011: Acquired Canada’s Intalite/Simplex specialty metal ceilings business
2012: Armstrong Cabinets (kitchen and bathroom cabinetry with $136 million of 2011 sales) sold to American Industrial Partners; since renamed Echelon Cabinetry
2012: Sold Patriot flooring distribution business to Belknap White Group
2014: Ceased funding of European flooring subsidiary (resulting in insolvency)*
2014: Completes $41 million Lancaster flooring plant expansion
2015: Closed flooring plants in China and Australia
* “Armstrong acquired DLW in 1998 to establish a stronghold and serve as a catalyst for the development of its European flooring business. DLWsubsequently struggled with declining market conditions as a result of the ongoing economic crisis, including a significant decrease in public funding,which particularly affected the business's key commercial segments, notably hospitals and schools. These developments contributed to intensified pricepressure and overcapacities within the whole European flooring industry, further weakening DLW's competitive position. ‘Despite investingapproximately $150 million in the business since 2007, DLW has been unable to generate profit or achieve its strategic plans.’” – CEOMatt Espe (http://goo.gl/IeiCMM )
35
In addition to five new plants built since 2009, lots of buying/selling
Source: SEC filings and AWI press releases
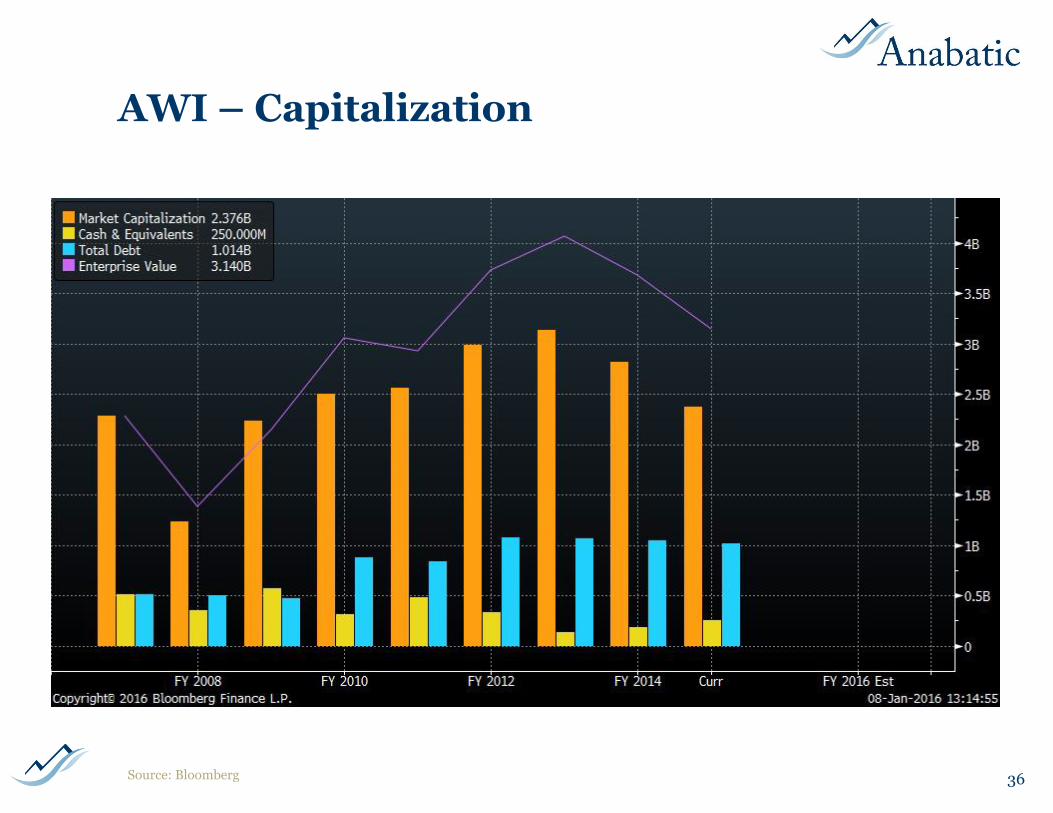
AWI – Capitalization
36Source: Bloomberg
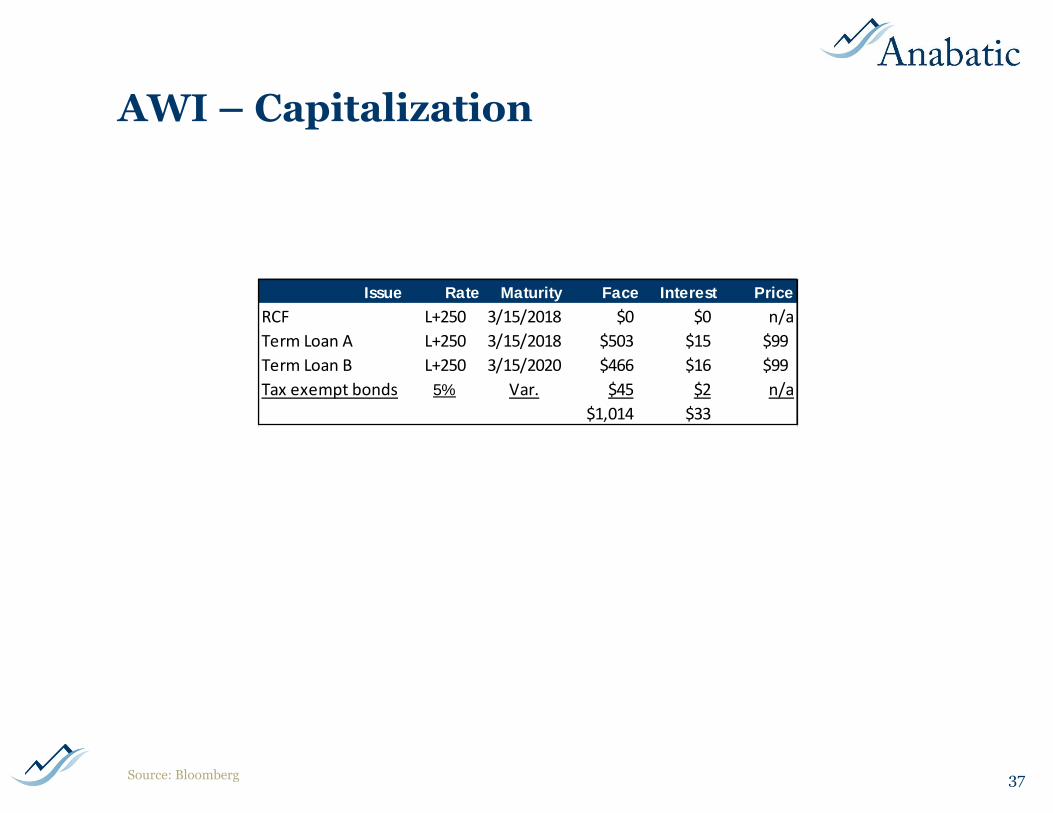
AWI – Capitalization
37Source: Bloomberg
Issue Rate Maturity Face Interest Price
RCF L+250 3/15/2018 $0 $0 n/a
Term Loan A L+250 3/15/2018 $503 $15 $99
Term Loan B L+250 3/15/2020 $466 $16 $99
Tax exempt bonds 5% Var. $45 $2 n/a
$1,014 $33
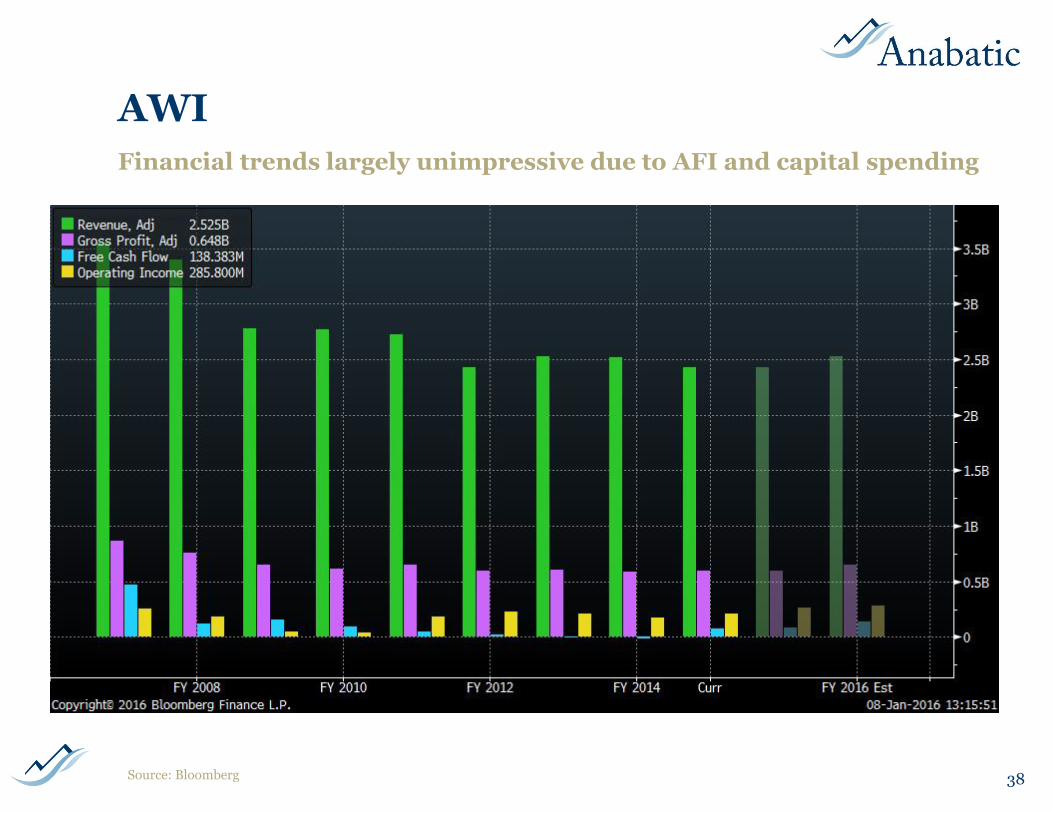
AWI
38
Financial trends largely unimpressive due to AFI and capital spending
Source: Bloomberg
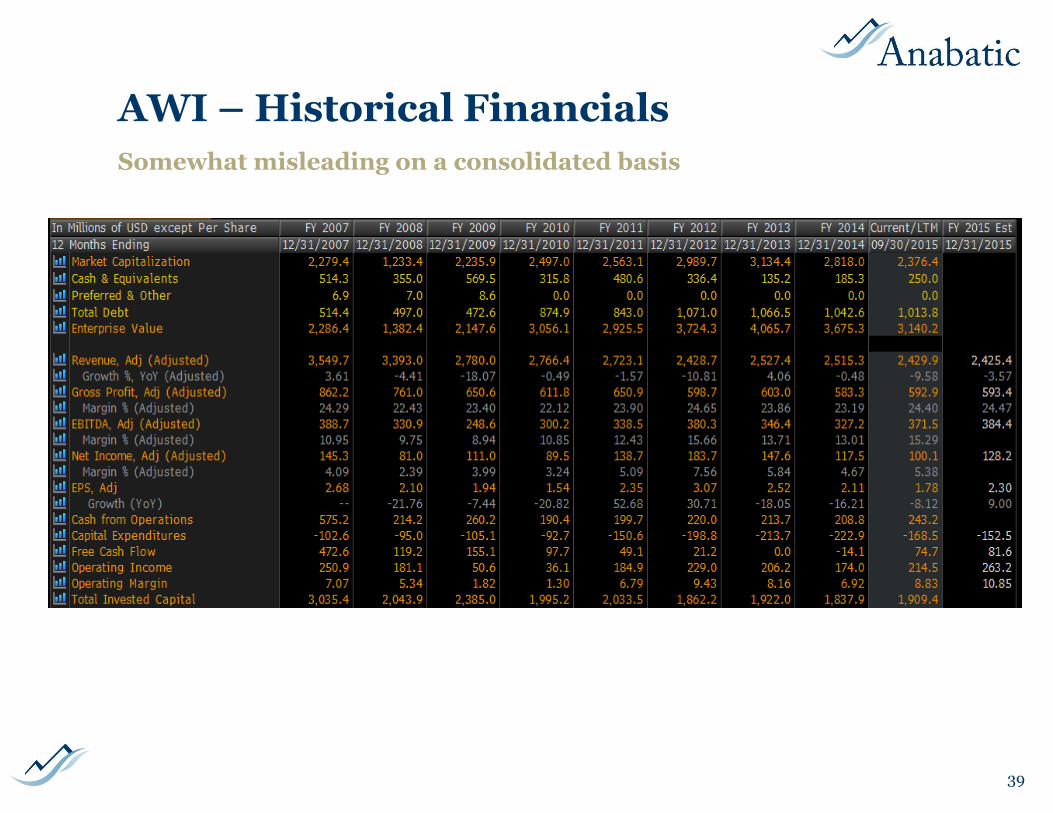
AWI – Historical Financials
39
Somewhat misleading on a consolidated basis
Armstrong Building Products (ABP)
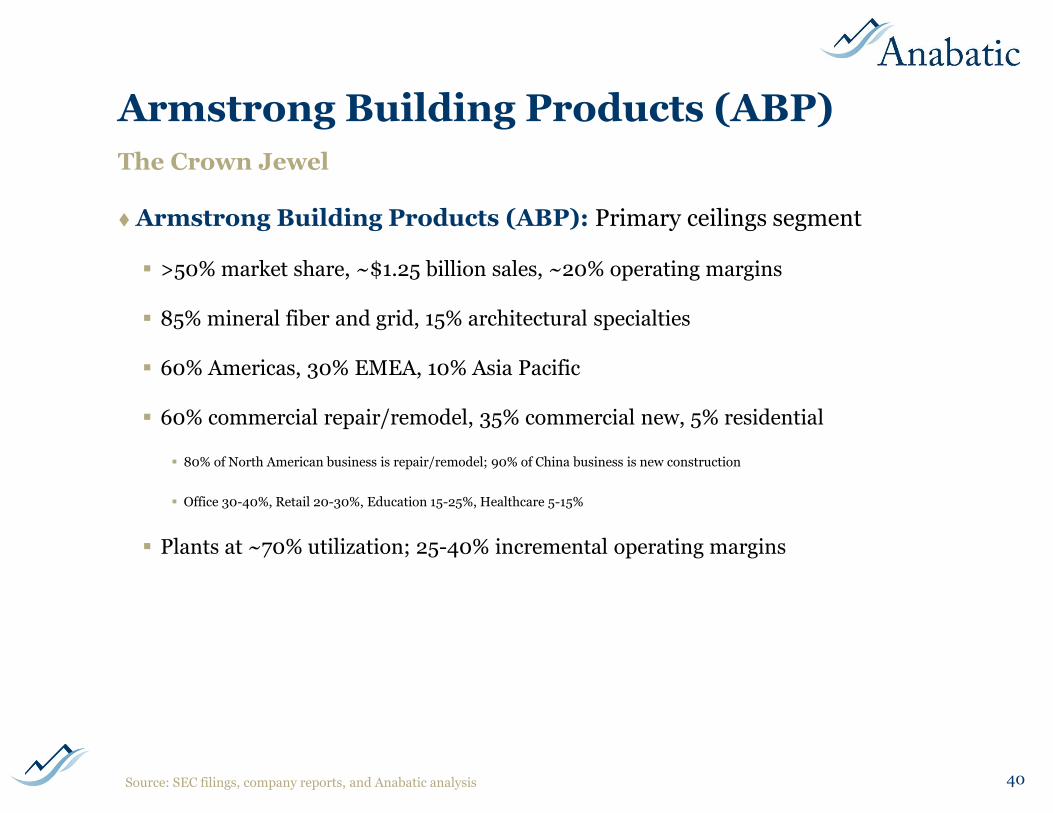
Armstrong Building Products (ABP): Primary ceilings segment
>50% market share, ~$1.25 billion sales, ~20% operating margins
85% mineral fiber and grid, 15% architectural specialties
60% Americas, 30% EMEA, 10% Asia Pacific
60% commercial repair/remodel, 35% commercial new, 5% residential
80% of North American business is repair/remodel; 90% of China business is new construction
Office 30-40%, Retail 20-30%, Education 15-25%, Healthcare 5-15%
Plants at ~70% utilization; 25-40% incremental operating margins
40
The Crown Jewel
Source: SEC filings, company reports, and Anabatic analysis
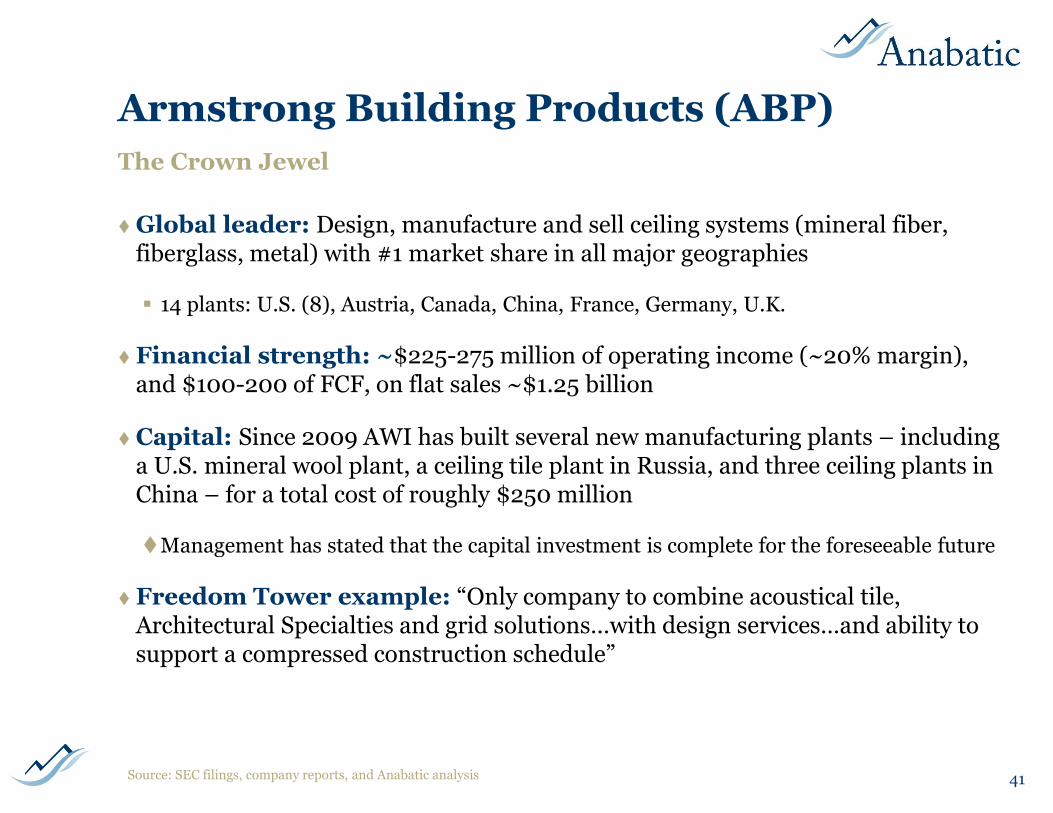
Armstrong Building Products (ABP)
Global leader: Design, manufacture and sell ceiling systems (mineral fiber, fiberglass, metal) with #1 market share in all major geographies
14 plants: U.S. (8), Austria, Canada, China, France, Germany, U.K.
Financial strength: ~$225-275 million of operating income (~20% margin), and $100-200 of FCF, on flat sales ~$1.25 billion
Capital: Since 2009 AWI has built several new manufacturing plants – including a U.S. mineral wool plant, a ceiling tile plant in Russia, and three ceiling plants in China – for a total cost of roughly $250 million
Management has stated that the capital investment is complete for the foreseeable future
Freedom Tower example: “Only company to combine acoustical tile, Architectural Specialties and grid solutions…with design services…and ability to support a compressed construction schedule”
41
The Crown Jewel
Source: SEC filings, company reports, and Anabatic analysis
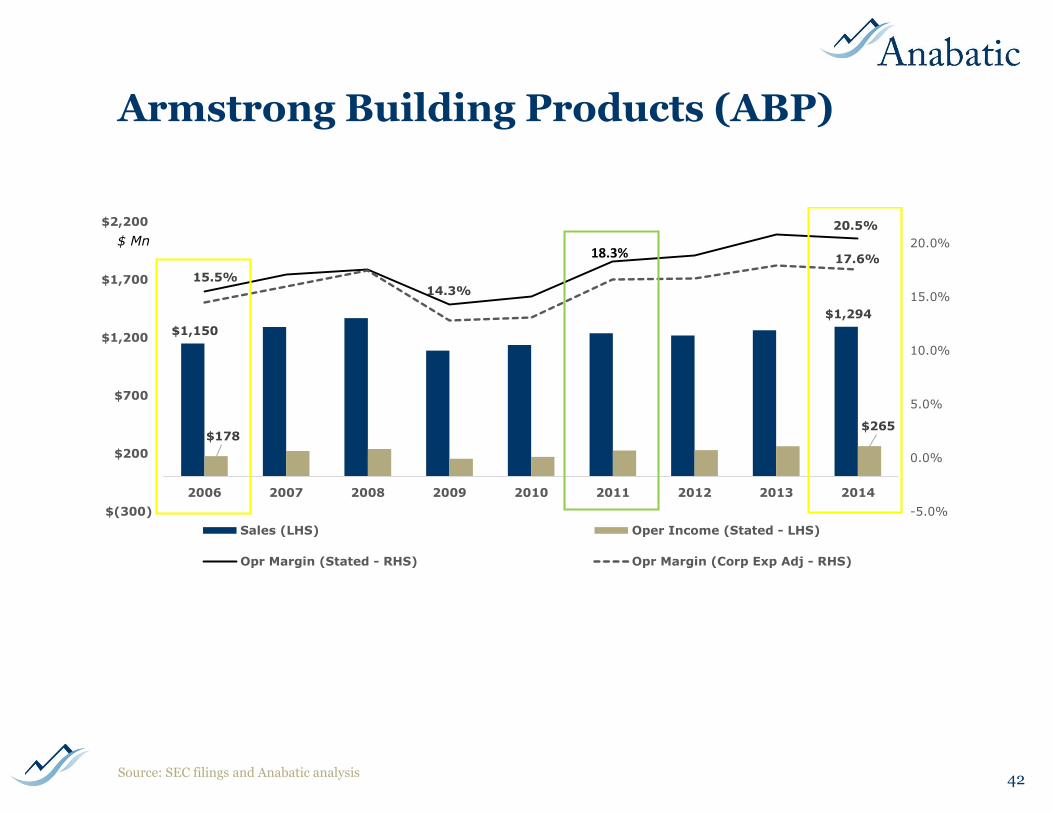
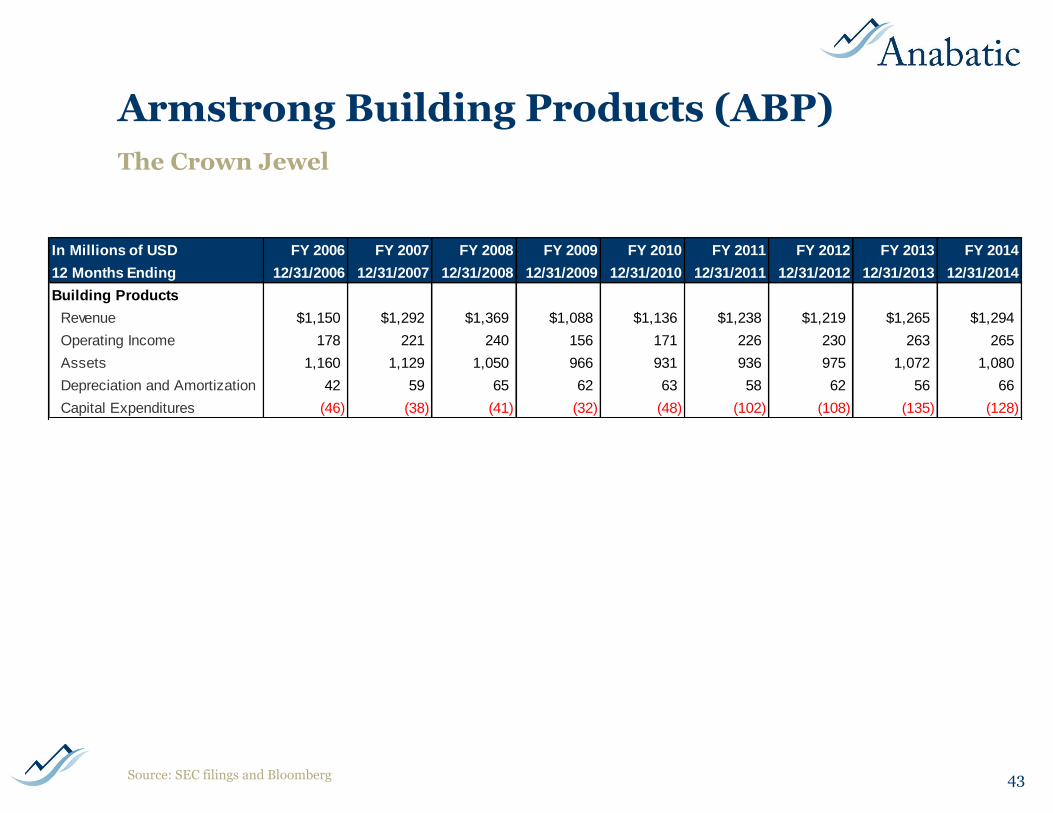
Armstrong Building Products (ABP)
42
$1,150
$1,294
$178 $265
15.5%14.3%
20.5%
17.6%
-5.0%
0.0%
5.0%
10.0%
15.0%
20.0%
$(300)
$200
$700
$1,200
$1,700
$2,200
2006 2007 2008 2009 2010 2011 2012 2013 2014
Sales (LHS) Oper Income (Stated - LHS)
Opr Margin (Stated - RHS) Opr Margin (Corp Exp Adj - RHS)
$ Mn
Source: SEC filings and Anabatic analysis
18.3%
Armstrong Building Products (ABP)
43
The Crown Jewel
Source: SEC filings and Bloomberg
In Millions of USD FY 2006 FY 2007 FY 2008 FY 2009 FY 2010 FY 2011 FY 2012 FY 2013 FY 2014
12 Months Ending 12/31/2006 12/31/2007 12/31/2008 12/31/2009 12/31/2010 12/31/2011 12/31/2012 12/31/2013 12/31/2014
Building Products
Revenue $1,150 $1,292 $1,369 $1,088 $1,136 $1,238 $1,219 $1,265 $1,294
Operating Income 178 221 240 156 171 226 230 263 265
Assets 1,160 1,129 1,050 966 931 936 975 1,072 1,080
Depreciation and Amortization 42 59 65 62 63 58 62 56 66
Capital Expenditures (46) (38) (41) (32) (48) (102) (108) (135) (128)
Armstrong Building Products (ABP)
Customer relationships: Architects and distributors have strong preferences (and often explicit needs/requirements) to work with a given company
Armstrong’s customer relationships are well established over many years and would be very difficult to disrupt
Plants are well situated and complimentary; distributor relationships are exclusive and switches are costly
It is expensive to switch from one grid to another, so replacement tile ~ annuity stream
Incremental value: Ceilings are an important part of a project but a small piece of the budget
So long as Armstrong delivers on its brand, it doesn’t get much attention scrutiny if it earns high margins and takes price
Concentration: AWI’s consolidated sales by channel are roughly two-thirds to distributors, 15% to large home centers, and the remainder to contractors and small retailers; no customer accounted for 10% or more of AWI’s consolidated sales
44
The Crown Jewel
Source: SEC filings, company reports, and Anabatic analysis
Armstrong Building Products (ABP)
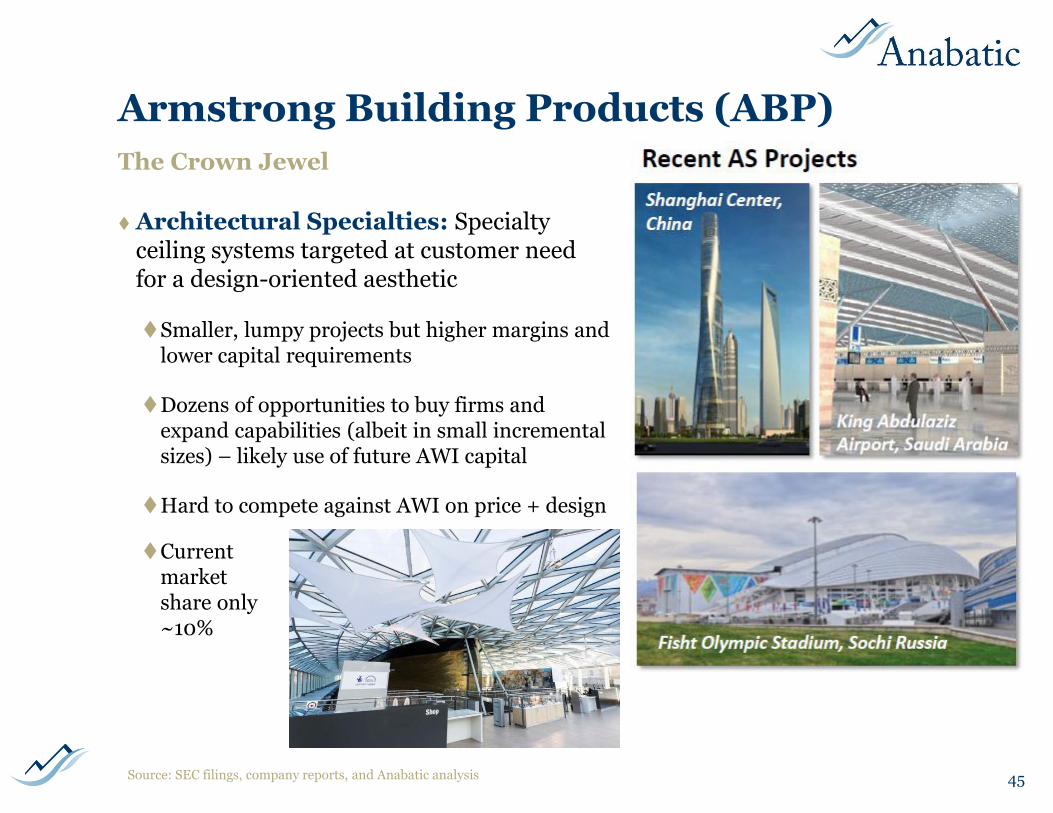
Architectural Specialties: Specialty ceiling systems targeted at customer need for a design-oriented aesthetic
Smaller, lumpy projects but higher margins and lower capital requirements
Dozens of opportunities to buy firms and expand capabilities (albeit in small incremental sizes) – likely use of future AWI capital
Hard to compete against AWI on price + design
45
The Crown Jewel
Source: SEC filings, company reports, and Anabatic analysis
Current market share only ~10%
WAVE – Worthington Armstrong Venture
History: 50-50 JV with Worthington Steel Co. established in 1992 *
Efficient grid manufacturing: Suspension system (grid) products manufactured by WAVE are sold by both Armstrong and WAVE
10 plants in five countries: U.S. (5), U.K. (2), France, China, and India
Financial success: Cumulative distributions have vastly exceeded the original investment balance and ongoing cash distributions are material
1992: $10 million of initial capital; 2005-2014: $724 million of cash dividends
Large and consistent annual cash distributions driven by high margins, capital efficiency
No ongoing need for capital: $238 million of debt (against $151 million of operating income), negative equity, capex of $5-8 million (against sales of $350-400 million)
Note: Figures as of as of WAVE’s 12-31-14 filing: http://www.sec.gov/Archives/edgar/data/7431/000119312515057190/d875160dex991.htm or according to Joint Venture Agreement (see prior page)
* The Worthington Steel Company is a subsidiary of Worthington Industries, Inc. (NYSE: WOR); JV Agreement: http://goo.gl/d8um8l
** WAVE was not part of AWI’s bankruptcy filing. WAVE files its own audited financial statements as an exhibit to AWI’s filings. AWI’s recorded investment is higher than its 50% share of the carrying values reported in WAVE’s financial statements due to AWI’s adoption of fresh-start accounting – upon emergence from bankruptcy AWI had to mark to fair value WAVE’s intangibles and other assets, a process that did not apply to WAVE as a non-debtor entity. The fair value adjustments are broken out in AWI’s filings. 46
Substantial cash generation, little capital
WAVE
47
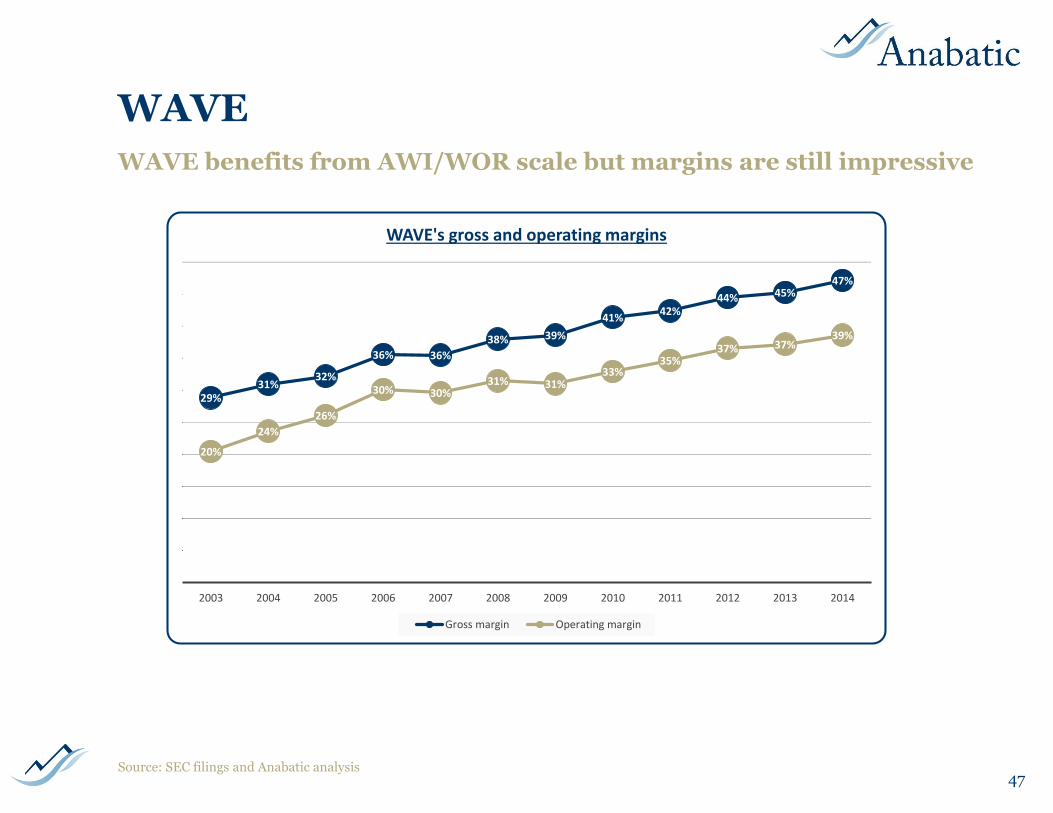
WAVE benefits from AWI/WOR scale but margins are still impressive
Source: SEC filings and Anabatic analysis
29%31%
32%
36% 36%
38% 39%
41%42%
44% 45%47%
20%
24%
26%
30% 30%31% 31%
33%35%
37% 37%39%
2003 2004 2005 2006 2007 2008 2009 2010 2011 2012 2013 2014
WAVE's gross and operating margins
Gross margin Operating margin
WAVE
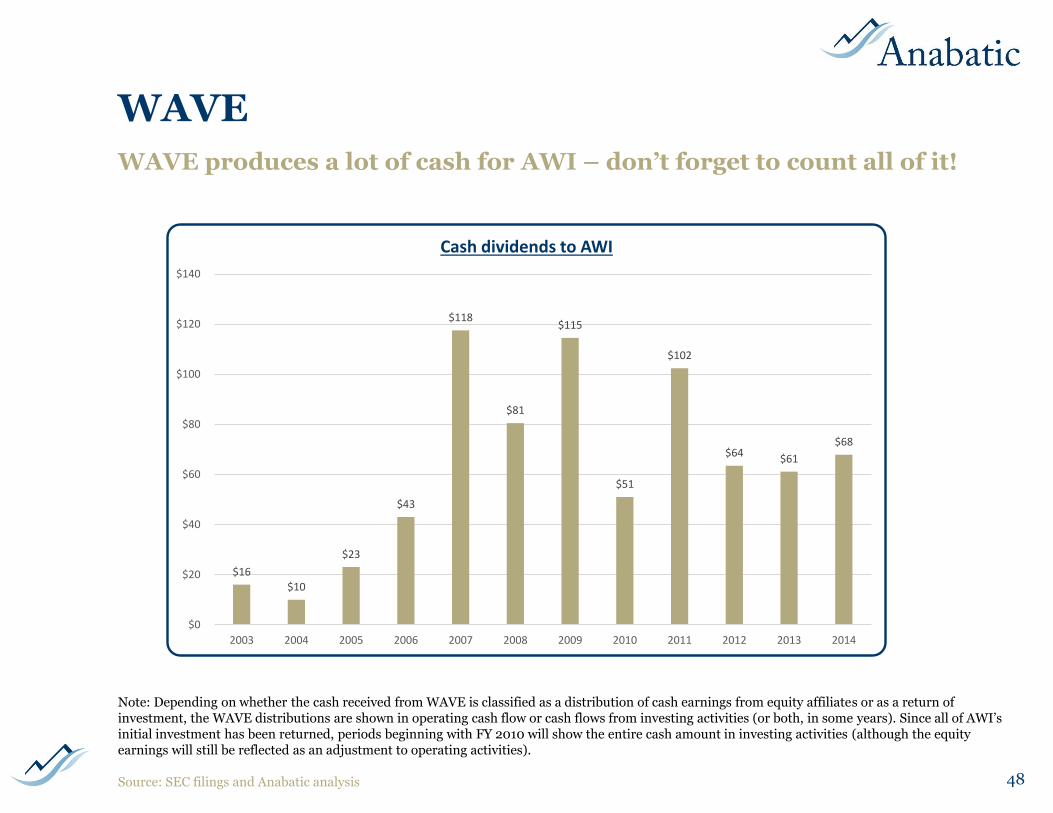
48
WAVE produces a lot of cash for AWI – don’t forget to count all of it!
Note: Depending on whether the cash received from WAVE is classified as a distribution of cash earnings from equity affiliates or as a return of investment, the WAVE distributions are shown in operating cash flow or cash flows from investing activities (or both, in some years). Since all of AWI’s initial investment has been returned, periods beginning with FY 2010 will show the entire cash amount in investing activities (although the equity earnings will still be reflected as an adjustment to operating activities).
Source: SEC filings and Anabatic analysis
$16
$10
$23
$43
$118
$81
$115
$51
$102
$64 $61
$68
$0
$20
$40
$60
$80
$100
$120
$140
2003 2004 2005 2006 2007 2008 2009 2010 2011 2012 2013 2014
Cash dividends to AWI
WAVE
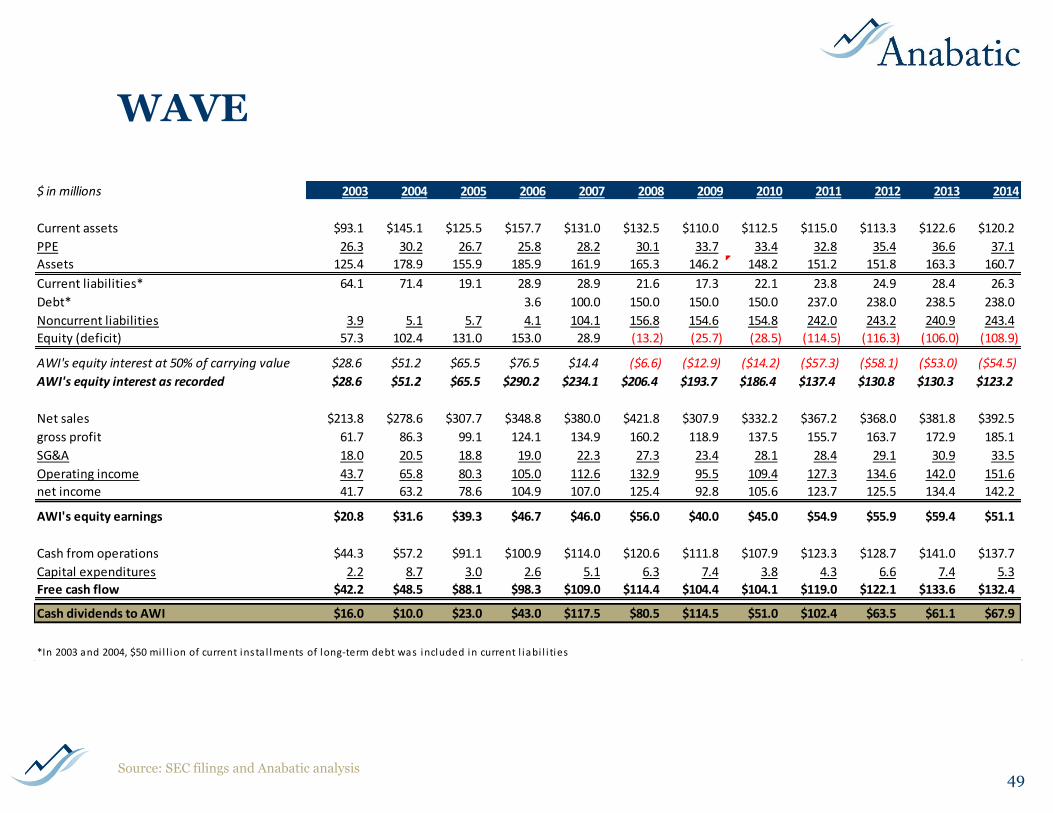
49
$ in millions 2003 2004 2005 2006 2007 2008 2009 2010 2011 2012 2013 2014
Current assets $93.1 $145.1 $125.5 $157.7 $131.0 $132.5 $110.0 $112.5 $115.0 $113.3 $122.6 $120.2
PPE 26.3 30.2 26.7 25.8 28.2 30.1 33.7 33.4 32.8 35.4 36.6 37.1
Assets 125.4 178.9 155.9 185.9 161.9 165.3 146.2 148.2 151.2 151.8 163.3 160.7
Current liabilities* 64.1 71.4 19.1 28.9 28.9 21.6 17.3 22.1 23.8 24.9 28.4 26.3
Debt* 3.6 100.0 150.0 150.0 150.0 237.0 238.0 238.5 238.0
Noncurrent liabilities 3.9 5.1 5.7 4.1 104.1 156.8 154.6 154.8 242.0 243.2 240.9 243.4
Equity (deficit) 57.3 102.4 131.0 153.0 28.9 (13.2) (25.7) (28.5) (114.5) (116.3) (106.0) (108.9)
AWI's equity interest at 50% of carrying value $28.6 $51.2 $65.5 $76.5 $14.4 ($6.6) ($12.9) ($14.2) ($57.3) ($58.1) ($53.0) ($54.5)
AWI's equity interest as recorded $28.6 $51.2 $65.5 $290.2 $234.1 $206.4 $193.7 $186.4 $137.4 $130.8 $130.3 $123.2
Net sales $213.8 $278.6 $307.7 $348.8 $380.0 $421.8 $307.9 $332.2 $367.2 $368.0 $381.8 $392.5
gross profit 61.7 86.3 99.1 124.1 134.9 160.2 118.9 137.5 155.7 163.7 172.9 185.1
SG&A 18.0 20.5 18.8 19.0 22.3 27.3 23.4 28.1 28.4 29.1 30.9 33.5
Operating income 43.7 65.8 80.3 105.0 112.6 132.9 95.5 109.4 127.3 134.6 142.0 151.6
net income 41.7 63.2 78.6 104.9 107.0 125.4 92.8 105.6 123.7 125.5 134.4 142.2
AWI's equity earnings $20.8 $31.6 $39.3 $46.7 $46.0 $56.0 $40.0 $45.0 $54.9 $55.9 $59.4 $51.1
Cash from operations $44.3 $57.2 $91.1 $100.9 $114.0 $120.6 $111.8 $107.9 $123.3 $128.7 $141.0 $137.7
Capital expenditures 2.2 8.7 3.0 2.6 5.1 6.3 7.4 3.8 4.3 6.6 7.4 5.3
Free cash flow $42.2 $48.5 $88.1 $98.3 $109.0 $114.4 $104.4 $104.1 $119.0 $122.1 $133.6 $132.4
Cash dividends to AWI $16.0 $10.0 $23.0 $43.0 $117.5 $80.5 $114.5 $51.0 $102.4 $63.5 $61.1 $67.9
*In 2003 and 2004, $50 mi l l ion of current insta l lments of long-term debt was included in current l iabi l i ties
Source: SEC filings and Anabatic analysis
Armstrong Flooring Inc. (AFI)
Armstrong Flooring Inc. (AFI): Dead-weight flooring segment
~$1.2 billion sales, ~0-5% operating margins
~60% N.A. residential, ~20% N.A. commercial, ~20% international commercial
65% residential, 35% commercial (70-75% remodel in each sector)
Education 20-30%, Healthcare 20-30%, Retail 15-25%, Office 5-15%, Other 15-25%
Capital: Since 2009 AWI has invested in several manufacturing facilities at a cost of more than $125 million
Restructuring ad nauseam: Streamlining in bankruptcy didn’t work* despite favorable markets, nor did multiple rounds of capital spending, marketing investments and plant closures in the nine year since bankruptcy
* “…we used the time in Chapter 11 to restructure our flooring business to make it more competitive…we made substantial improvements in our cost structure by closing several plants and streamlining our workforce in the U.S. We have also expanded capacity to manufacture wood flooring, broadened our product lines and improved product quality and customer service.” – CEO Lockhart in 2006
50
The Albatross
Source: SEC filings, company reports, and Anabatic analysis
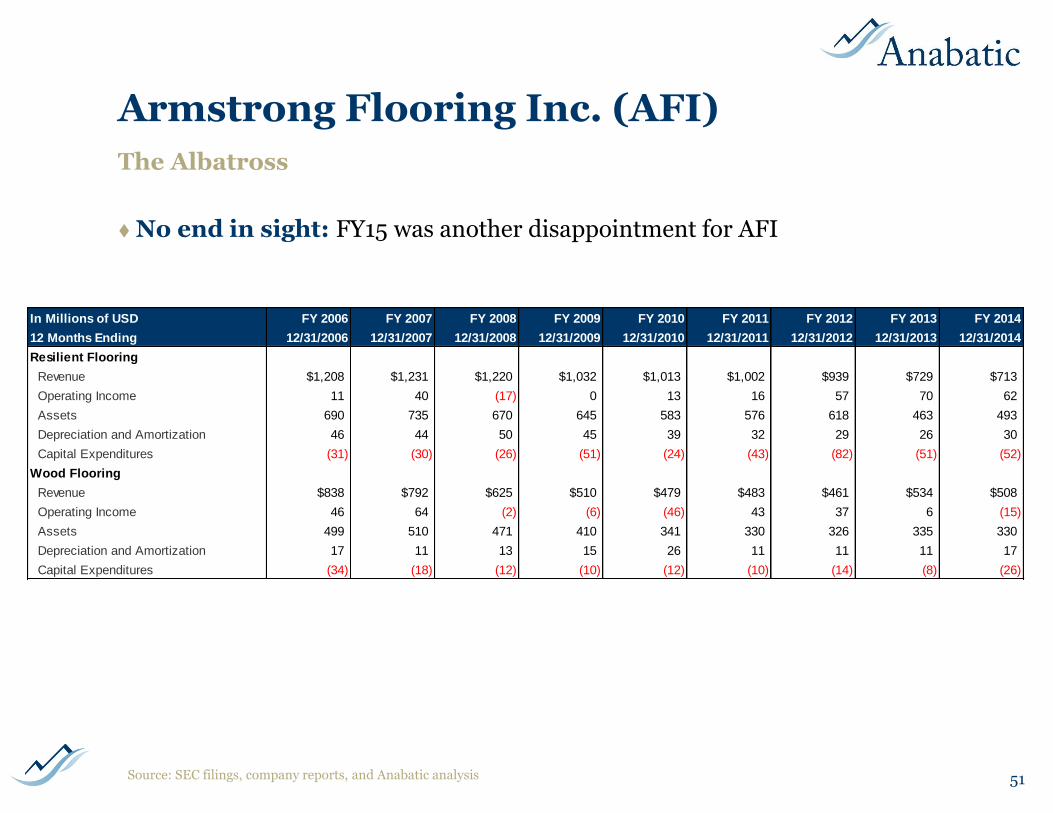
Armstrong Flooring Inc. (AFI)
No end in sight: FY15 was another disappointment for AFI
51
The Albatross
Source: SEC filings, company reports, and Anabatic analysis
In Millions of USD FY 2006 FY 2007 FY 2008 FY 2009 FY 2010 FY 2011 FY 2012 FY 2013 FY 2014
12 Months Ending 12/31/2006 12/31/2007 12/31/2008 12/31/2009 12/31/2010 12/31/2011 12/31/2012 12/31/2013 12/31/2014
Resilient Flooring
Revenue $1,208 $1,231 $1,220 $1,032 $1,013 $1,002 $939 $729 $713
Operating Income 11 40 (17) 0 13 16 57 70 62
Assets 690 735 670 645 583 576 618 463 493
Depreciation and Amortization 46 44 50 45 39 32 29 26 30
Capital Expenditures (31) (30) (26) (51) (24) (43) (82) (51) (52)
Wood Flooring
Revenue $838 $792 $625 $510 $479 $483 $461 $534 $508
Operating Income 46 64 (2) (6) (46) 43 37 6 (15)
Assets 499 510 471 410 341 330 326 335 330
Depreciation and Amortization 17 11 13 15 26 11 11 11 17
Capital Expenditures (34) (18) (12) (10) (12) (10) (14) (8) (26)
The AFP Spin-off
Approved by Board on Feb. 19, 2015 with distribution expected March/April 2016
Typical set-up of high-margin, high-quality business (ABP) spinning-off a lower-margin segment (AFI)
Distribution ratio and capital structure TBD, but management has mentioned ~2x leverage on AFI or ~$150-175 million (likely be sent back to AWI, net of ~$50 million of cash)
So far, the turnaround hasn’t turned – if it eventually works the rewards will be substantial, but if not…
Difficult to value given low margins, volatile results, TBD capital structure/debt
Management may be unsettled
Division CEO left in 2014 to be CFO of Starwood Hotels
Current CEO Don Maier joined AWI in 2010 as SVP of Ops/Supply Chain but resigned in March 2014 only to rejoin as CEO of Flooring in August 2014; Maier was previously an operating manager for several companies (including former holder TPG)
Note: please refer to the latest AFI filing http://goo.gl/aVkJh2 and armstrong.com for future updates
52
Details pending – tread carefully
Source: SEC filings, company reports, and Anabatic analysis
A Word about Spin-offs
53
Historically a good place to fish…but caveat emptor today
Genius?: The well-founded Greenblatt framework still applies but…
Attention: Spin-offs get far more attention now than they used to (multiple full-time analysts, blogs, ETFs, etc.)
Cyclical: Spin-offs are cyclical, like most things, and what the wise man did in the beginning the fool does in the end
Look closely as to why activists or management are teams pursuing spin-offs now …
Capital structure and insider incentives are crucial considerations
Invert: The old playbook of focusing on or buying the spun-off company might need to be flipped on its head
Data: Approx. 60 U.S. spinoffs in 2014 (3rd highest on record to 1980s, behind only 1999 and 2000); 2015 only slightly behind with ~45
Many recent spin-off disasters (BNED, RYAM, PGN, CVEO, TMST, CC, KLXI, KN, etc.)
Source: SEC filings and Anabatic analysis
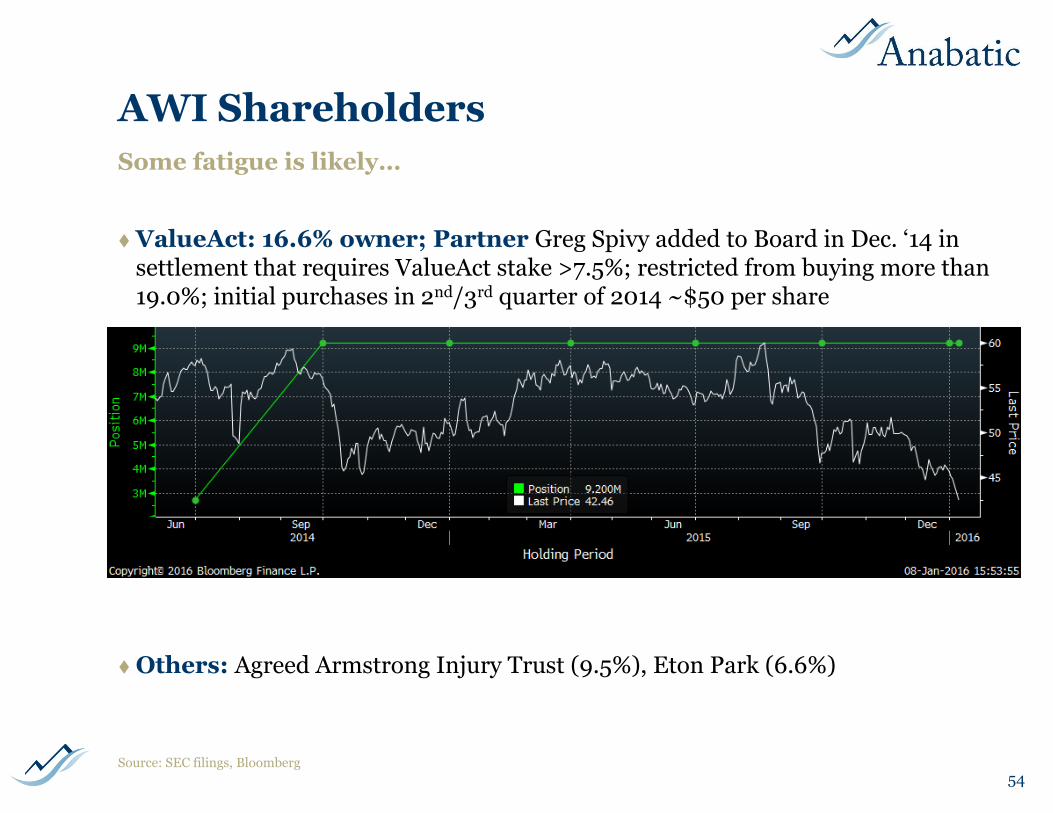
AWI Shareholders
ValueAct: 16.6% owner; Partner Greg Spivy added to Board in Dec. ‘14 in settlement that requires ValueAct stake >7.5%; restricted from buying more than 19.0%; initial purchases in 2nd/3rd quarter of 2014 ~$50 per share
Others: Agreed Armstrong Injury Trust (9.5%), Eton Park (6.6%)
54
Some fatigue is likely…
Source: SEC filings, Bloomberg
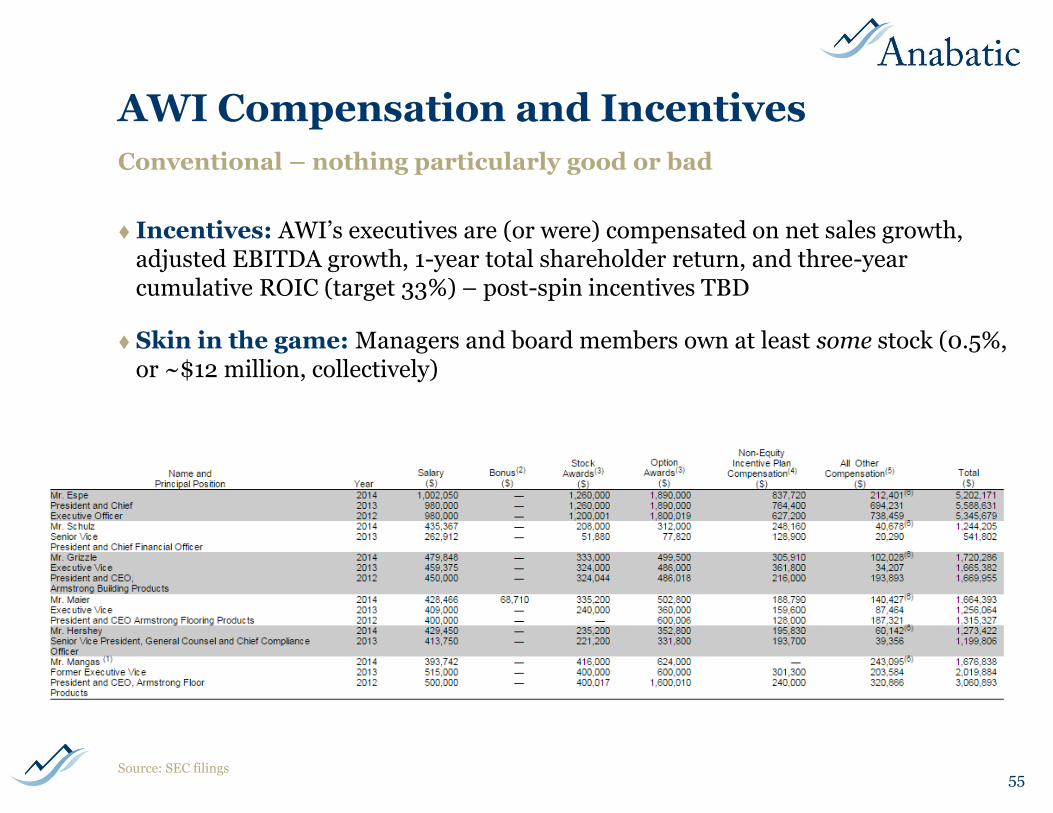
AWI Compensation and Incentives
Incentives: AWI’s executives are (or were) compensated on net sales growth, adjusted EBITDA growth, 1-year total shareholder return, and three-year cumulative ROIC (target 33%) – post-spin incentives TBD
Skin in the game: Managers and board members own at least some stock (0.5%, or ~$12 million, collectively)
55
Conventional – nothing particularly good or bad
Source: SEC filings
Risks and Pre-mortem
Cyclical/macro factors: Construction levels are hard to forecast with precision and they fluctuate based on cyclical and macroeconomic factors
Materials and labor: Natural gas, steel, labor and other inputs can hurt margins
Competition: New entrants are unlikely and market share losses would be difficult to achieve but the issue bears watching
Capital allocation: A clean capital structure and lots of incoming cash flow could be tempting – not likely to do a dumb acquisition or pursue wasteful capital expenditures but the concern exists
56
Plenty can go wrong
Scenarios
Volumes decline: Obviously a negative, but a manageable one (assuming a prudent capital structure) – FCF would likely remain positive, and AWI could play offense in terms of capital allocation (~20%?)
Volumes stagnate: Not ideal, but could still result in a good outcome given industry structure, ROIC, and pricing power (~55%?)
Volumes improve: Even a slight improvement would be a huge positive, as incremental returns would be excellent (~20%?)
Volumes jump: If volumes ever increase dramatically the sky is the limit for this company (~5%?)
57
Volumes will drive incremental change, so what are the odds?
AWI Investment Merits
Valuation: What is the right price for a business with these characteristics? Is an implied ~7-8% forward FCF yield and ~8-10% operating yield too generous?
Qualitative considerations:
A bad outcome is unlikely given ABP’s quality and stability (but the equity is probably not going to double soon either)
Time is the friend of a good business – return on capital will rule the day so long as management is prudent
Heavy capital investment and a disastrous 2-3 years at AFI may be obscuring ABP’s value
Several years of “false starts” in construction recovery combined with poor management guidance may be driving investor fatigue
Consolidated financials are unattractive to screeners
Sell-side is “waiting for clarity” on AFI spin and some investors may be doing the same
Management is new – proven operationally but untested with full control over the company
58
Investors need to weigh the odds at this price
Source: Anabatic estimates
IV. Appendix
59
Armstrong Injury Trust
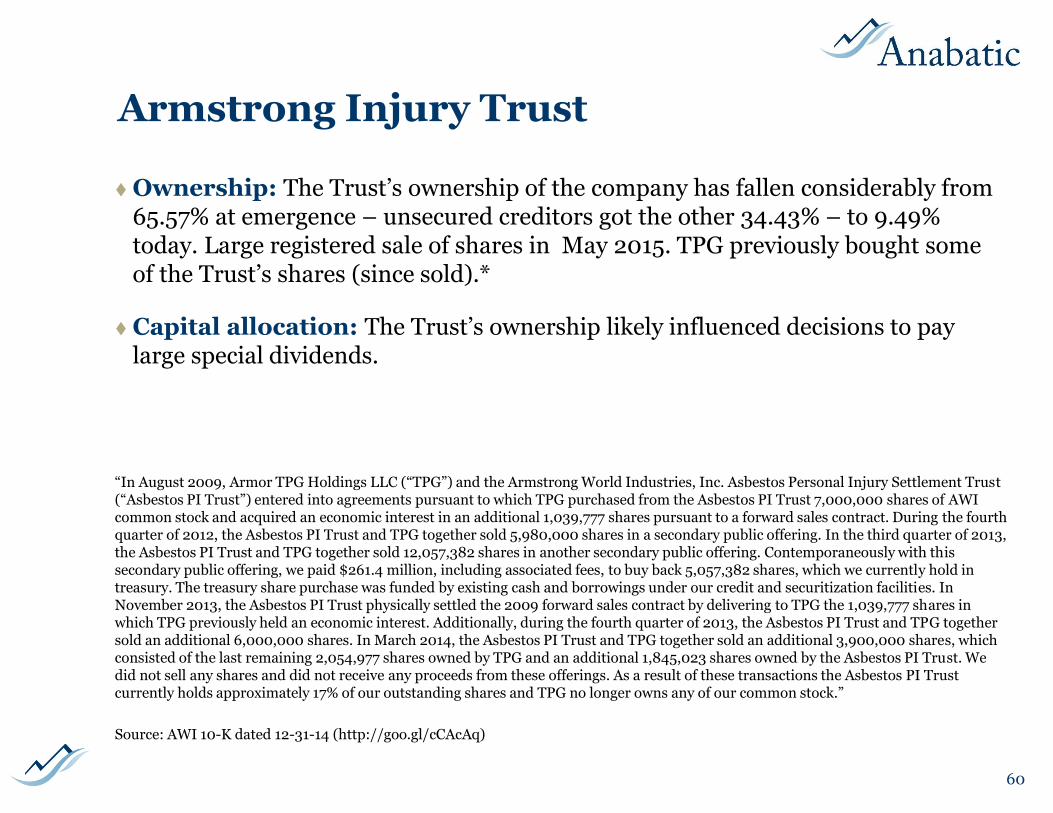
Ownership: The Trust’s ownership of the company has fallen considerably from 65.57% at emergence – unsecured creditors got the other 34.43% – to 9.49% today. Large registered sale of shares in May 2015. TPG previously bought some of the Trust’s shares (since sold).*
Capital allocation: The Trust’s ownership likely influenced decisions to pay large special dividends.
“In August 2009, Armor TPG Holdings LLC (“TPG”) and the Armstrong World Industries, Inc. Asbestos Personal Injury Settlement Trust (“Asbestos PI Trust”) entered into agreements pursuant to which TPG purchased from the Asbestos PI Trust 7,000,000 shares of AWIcommon stock and acquired an economic interest in an additional 1,039,777 shares pursuant to a forward sales contract. During the fourth quarter of 2012, the Asbestos PI Trust and TPG together sold 5,980,000 shares in a secondary public offering. In the third quarter of 2013, the Asbestos PI Trust and TPG together sold 12,057,382 shares in another secondary public offering. Contemporaneously with this secondary public offering, we paid $261.4 million, including associated fees, to buy back 5,057,382 shares, which we currently hold in treasury. The treasury share purchase was funded by existing cash and borrowings under our credit and securitization facilities. In November 2013, the Asbestos PI Trust physically settled the 2009 forward sales contract by delivering to TPG the 1,039,777 shares in which TPG previously held an economic interest. Additionally, during the fourth quarter of 2013, the Asbestos PI Trust and TPG together sold an additional 6,000,000 shares. In March 2014, the Asbestos PI Trust and TPG together sold an additional 3,900,000 shares, which consisted of the last remaining 2,054,977 shares owned by TPG and an additional 1,845,023 shares owned by the Asbestos PI Trust. We did not sell any shares and did not receive any proceeds from these offerings. As a result of these transactions the Asbestos PI Trust currently holds approximately 17% of our outstanding shares and TPG no longer owns any of our common stock.”
Source: AWI 10-K dated 12-31-14 (http://goo.gl/cCAcAq)
60
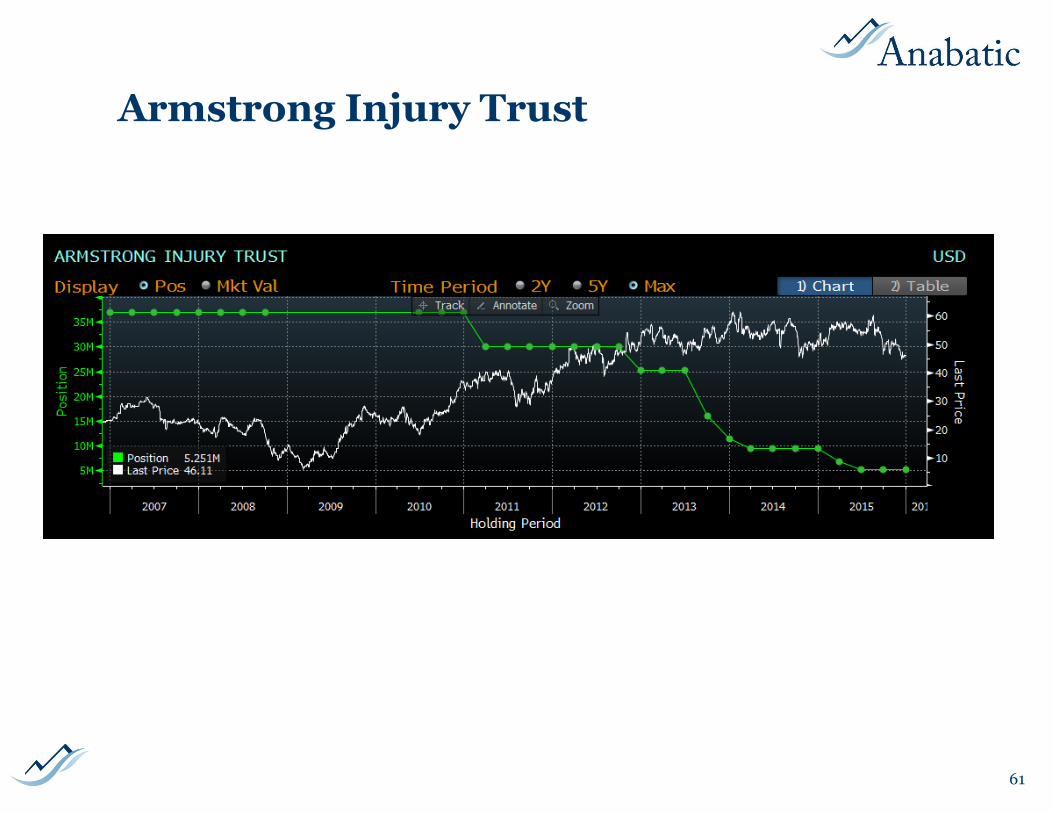
Armstrong Injury Trust
61
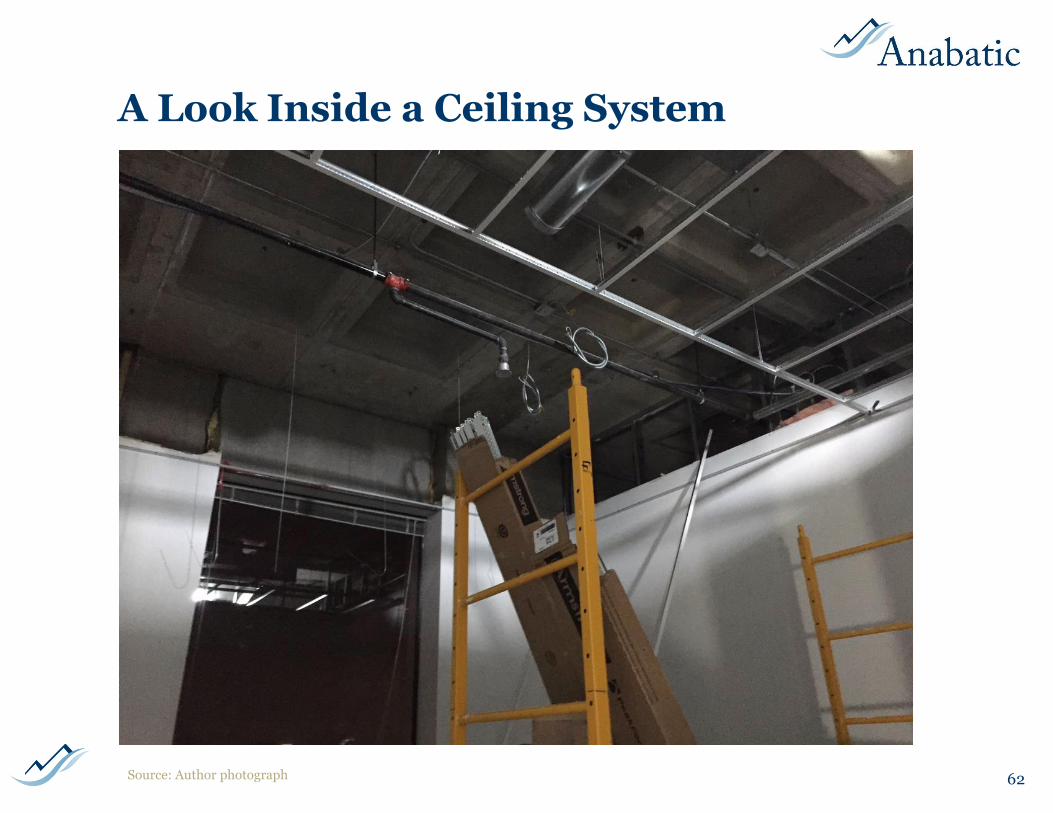
A Look Inside a Ceiling System
62Source: Author photograph
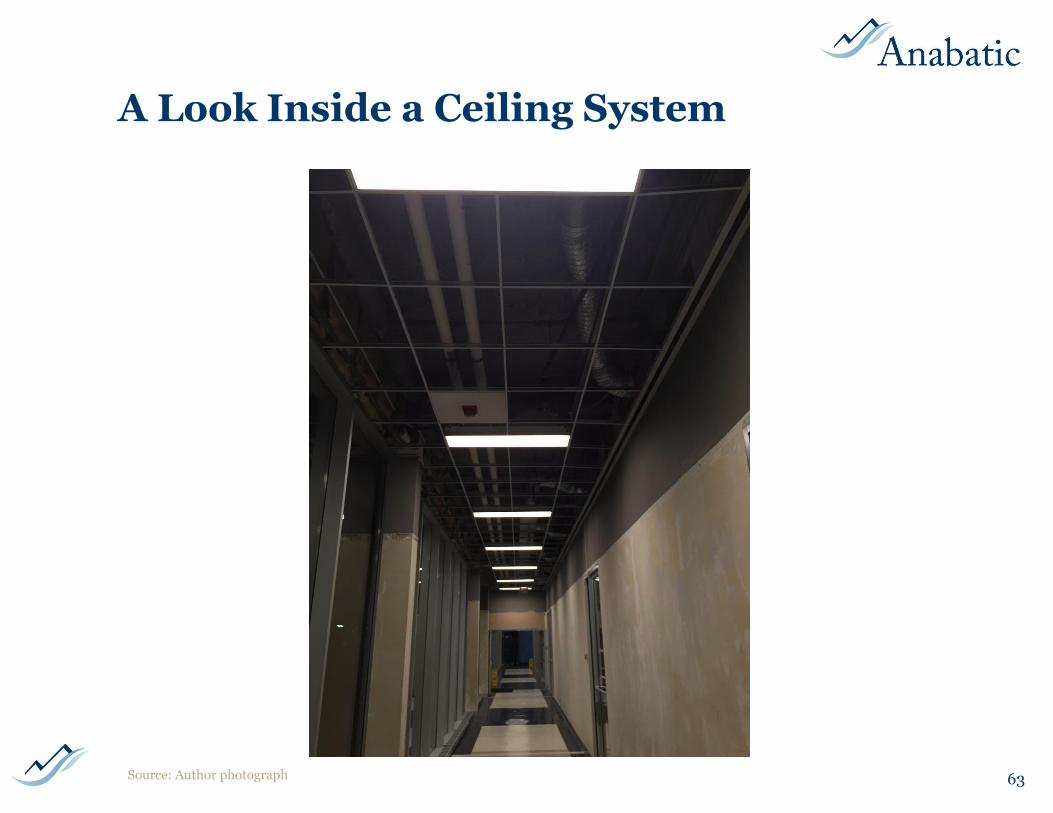
A Look Inside a Ceiling System
63Source: Author photograph
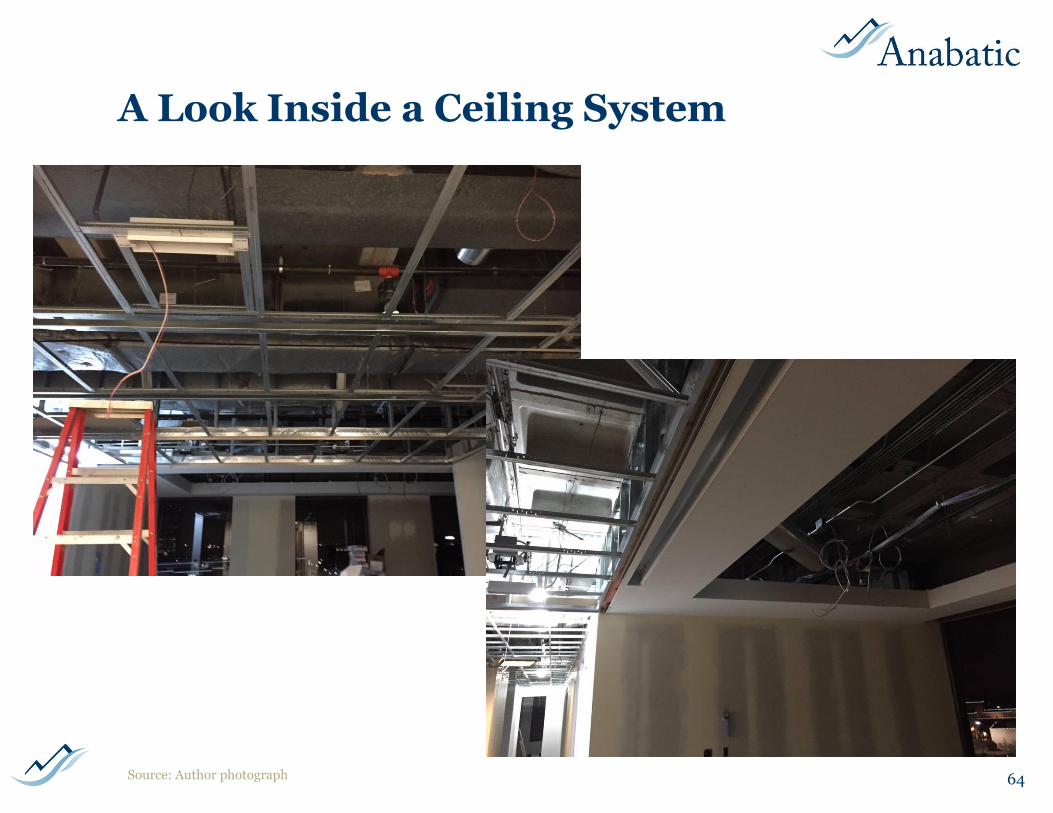
A Look Inside a Ceiling System
64Source: Author photograph
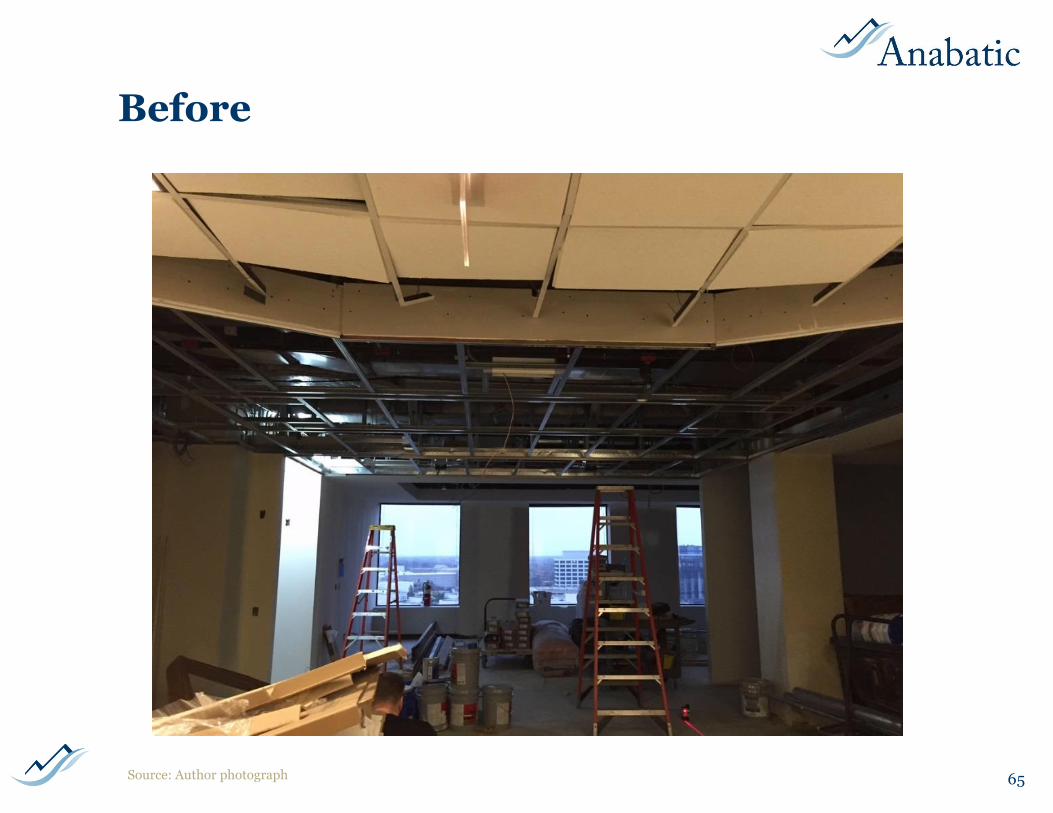
Before
65Source: Author photograph
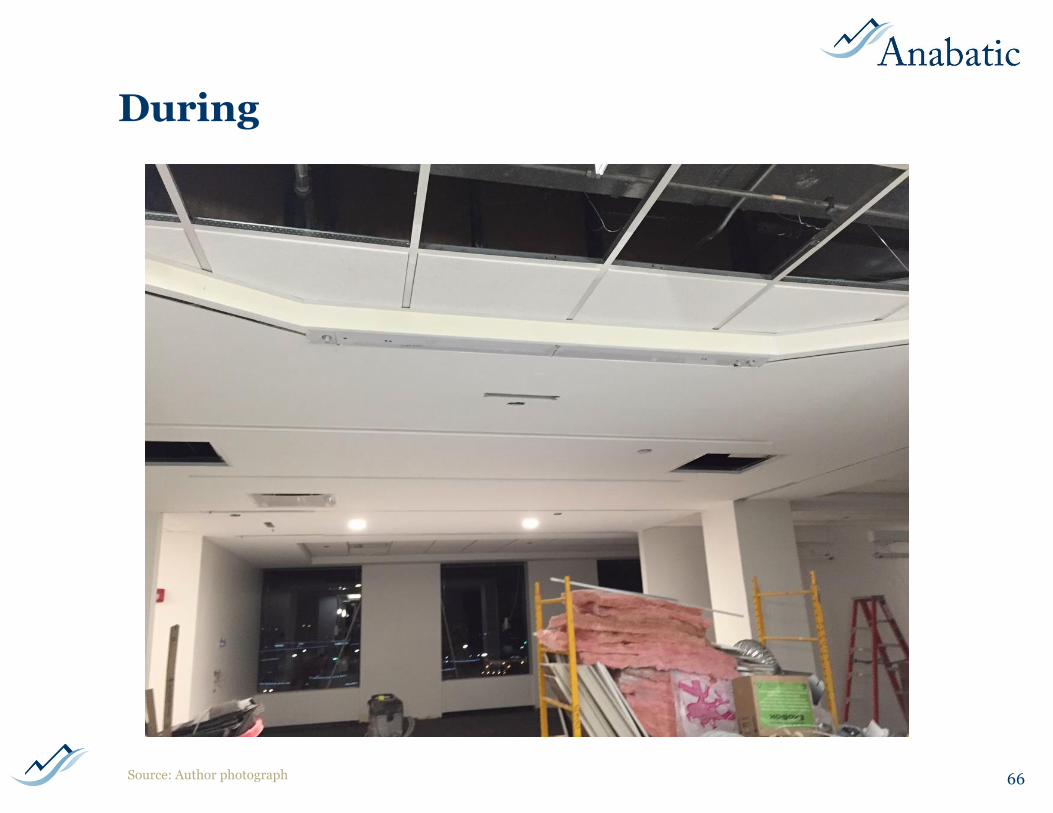
During
66Source: Author photograph
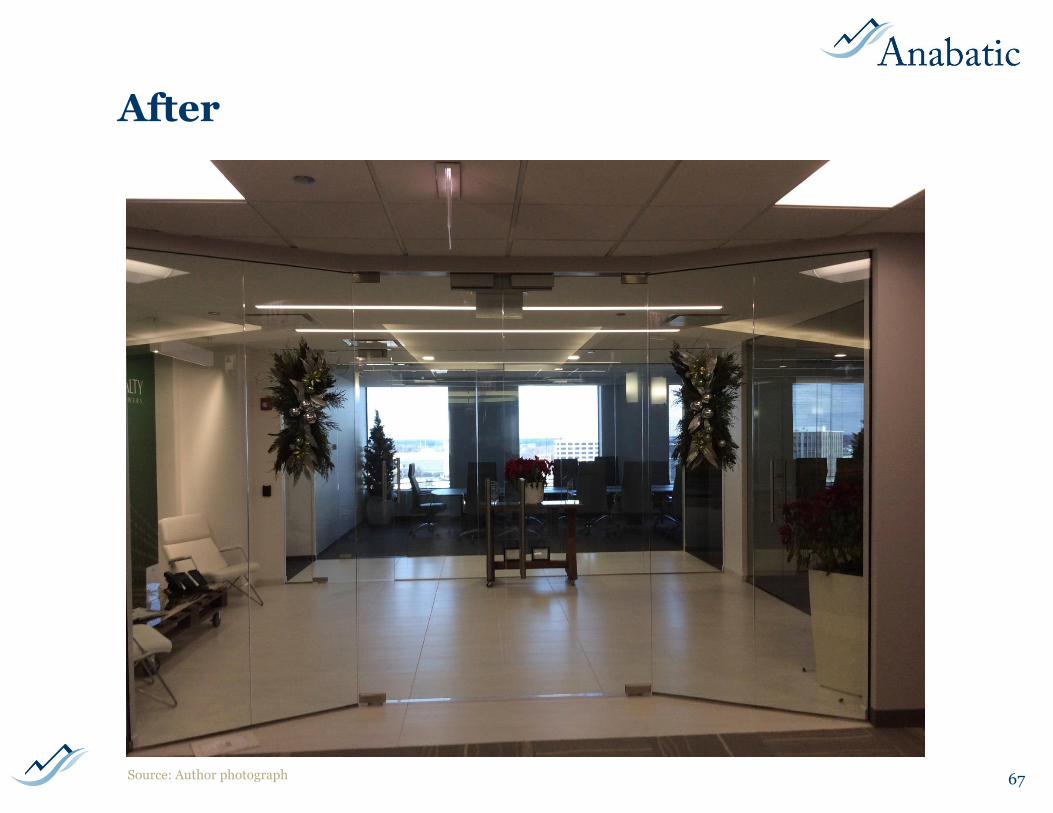
After
67Source: Author photograph
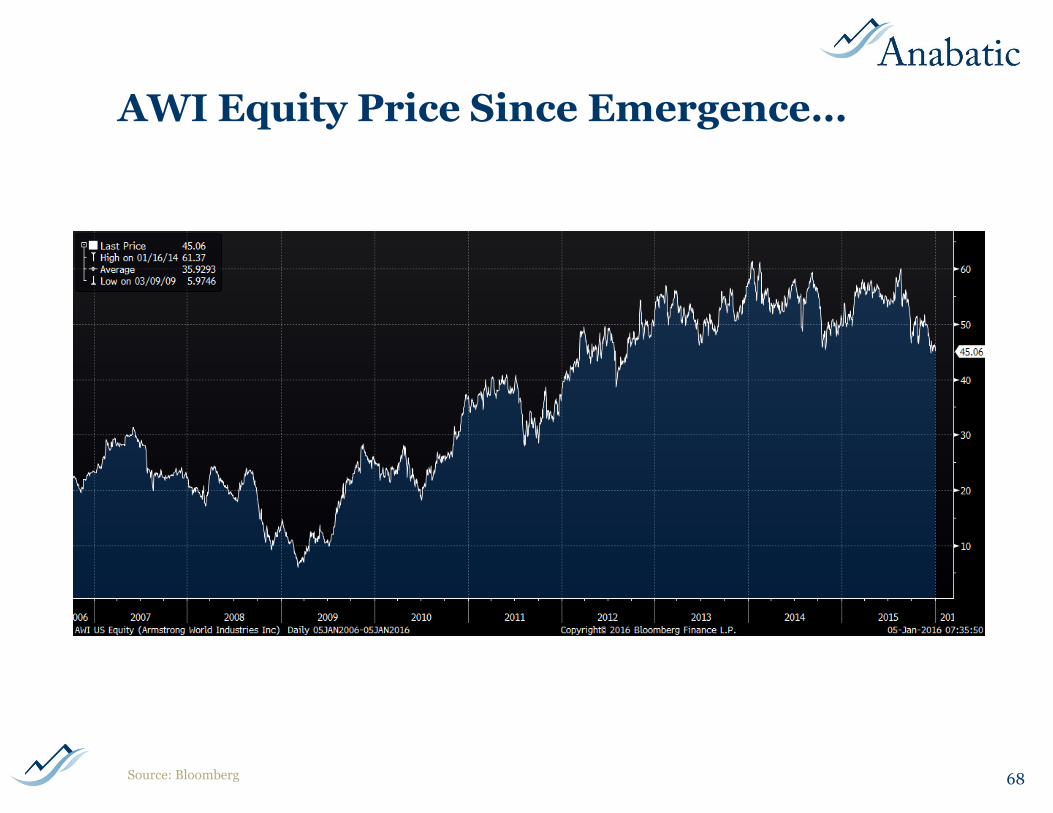
AWI Equity Price Since Emergence…
68Source: Bloomberg
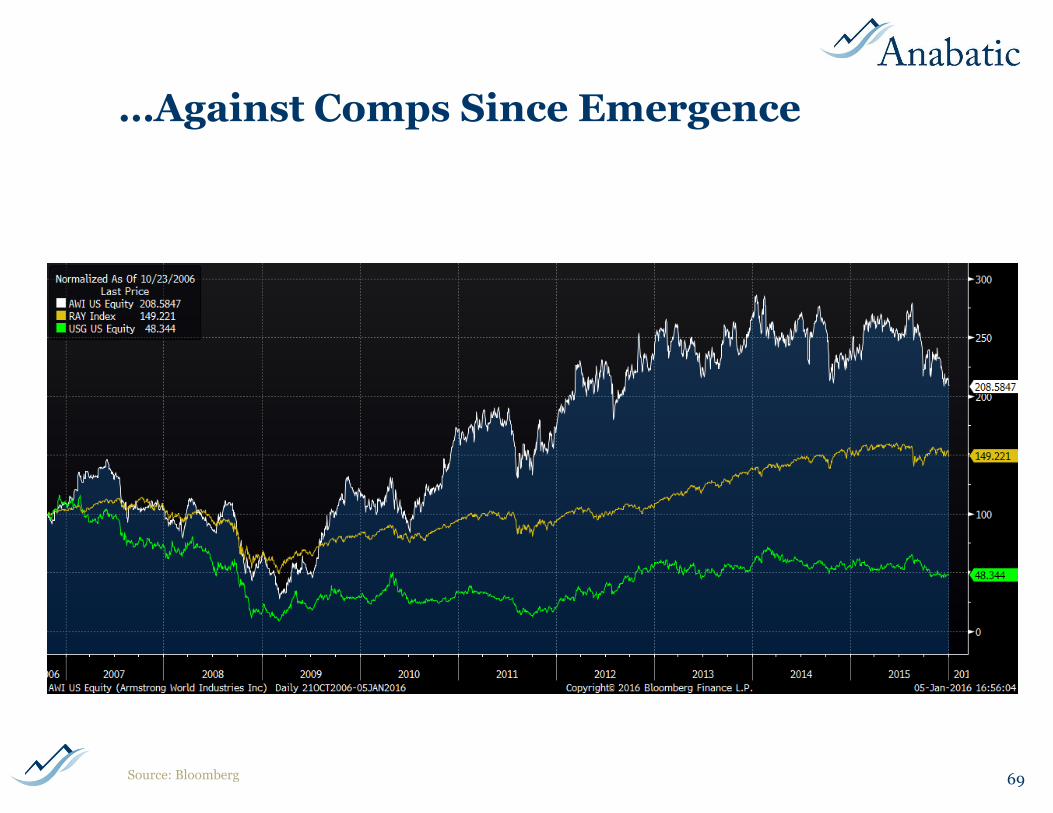
…Against Comps Since Emergence
69Source: Bloomberg
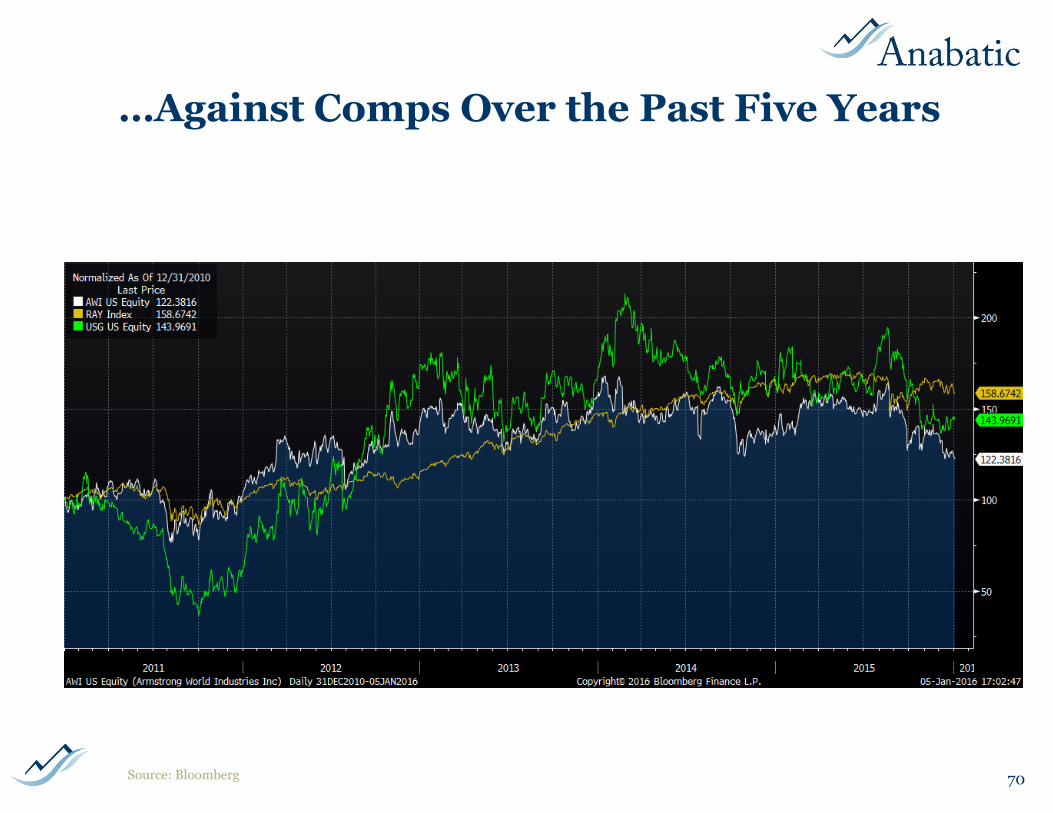
…Against Comps Over the Past Five Years
70Source: Bloomberg
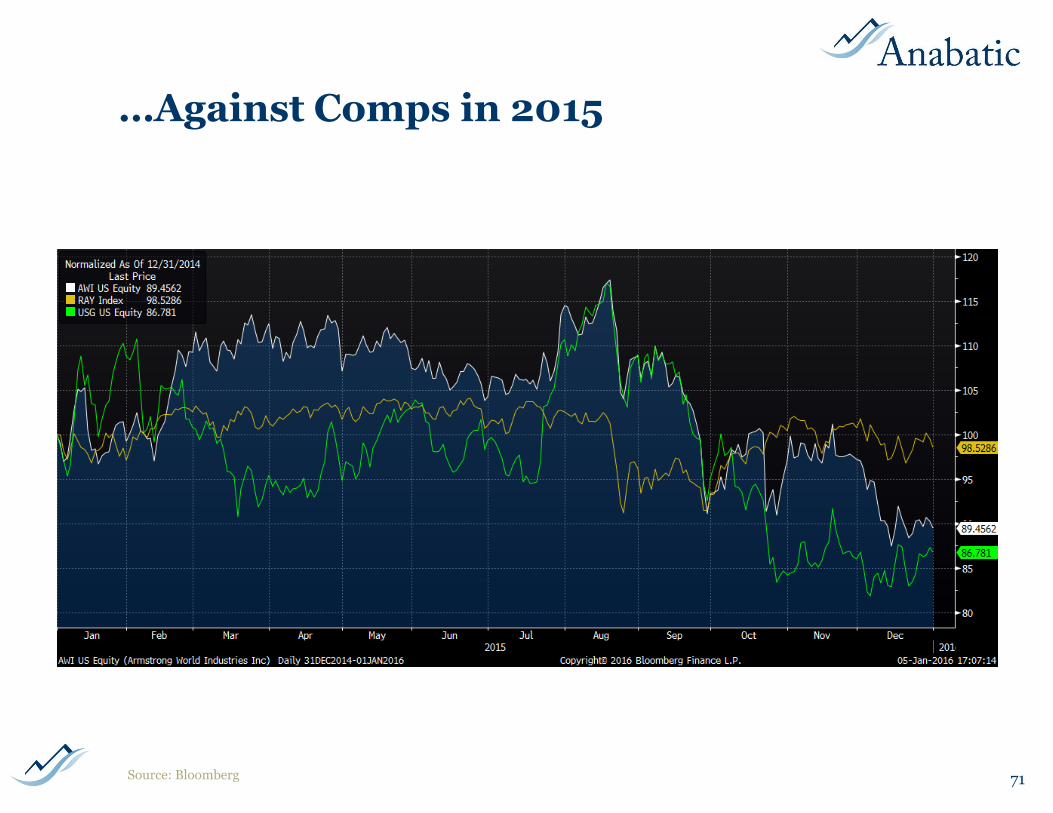
…Against Comps in 2015
71Source: Bloomberg
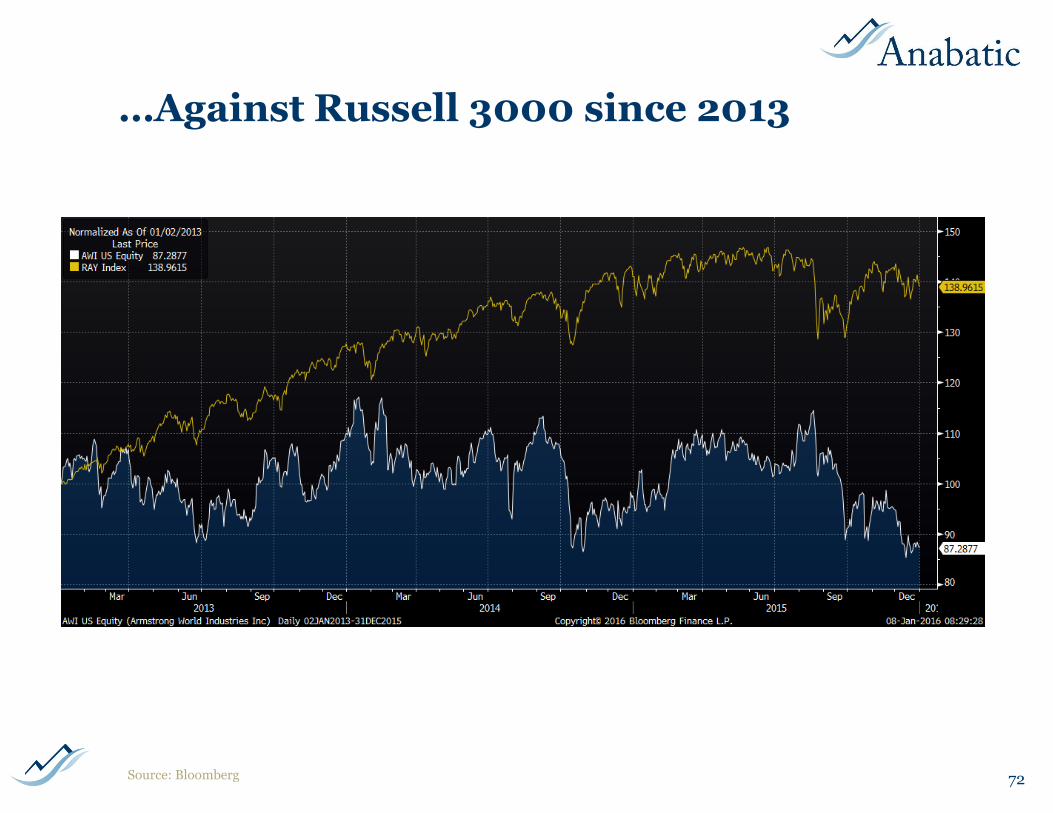
…Against Russell 3000 since 2013
72Source: Bloomberg
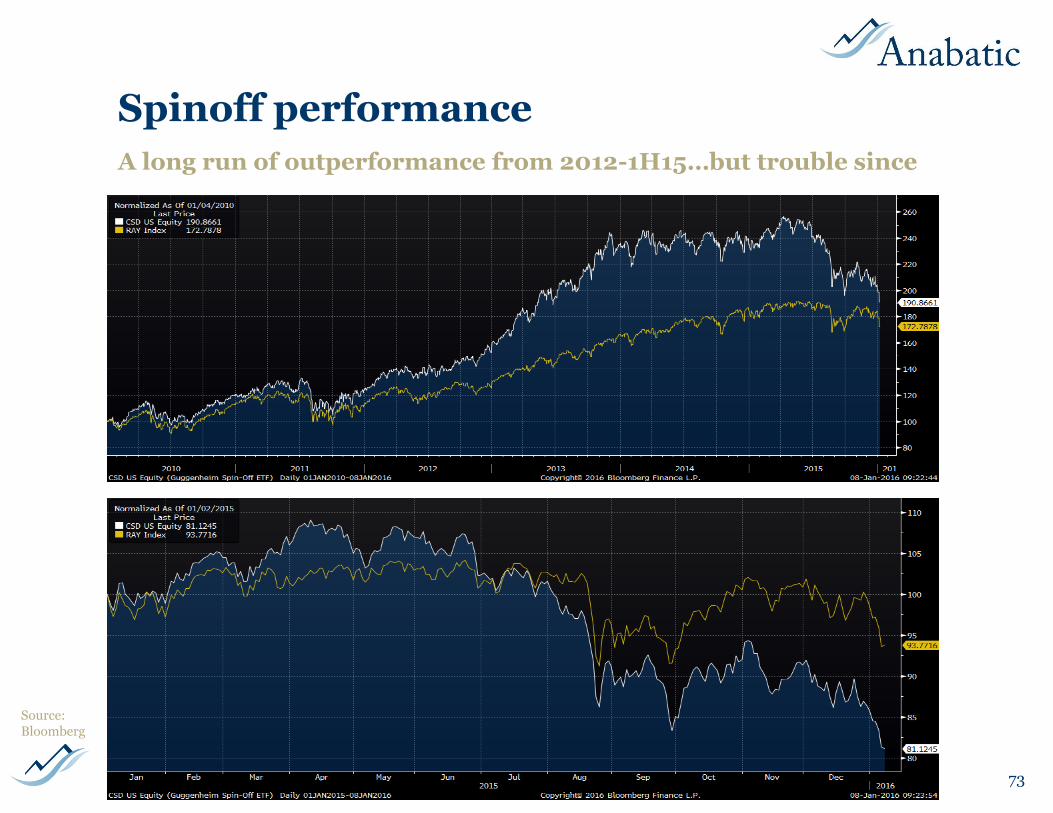
Spinoff performance
73
A long run of outperformance from 2012-1H15…but trouble since
Source: Bloomberg
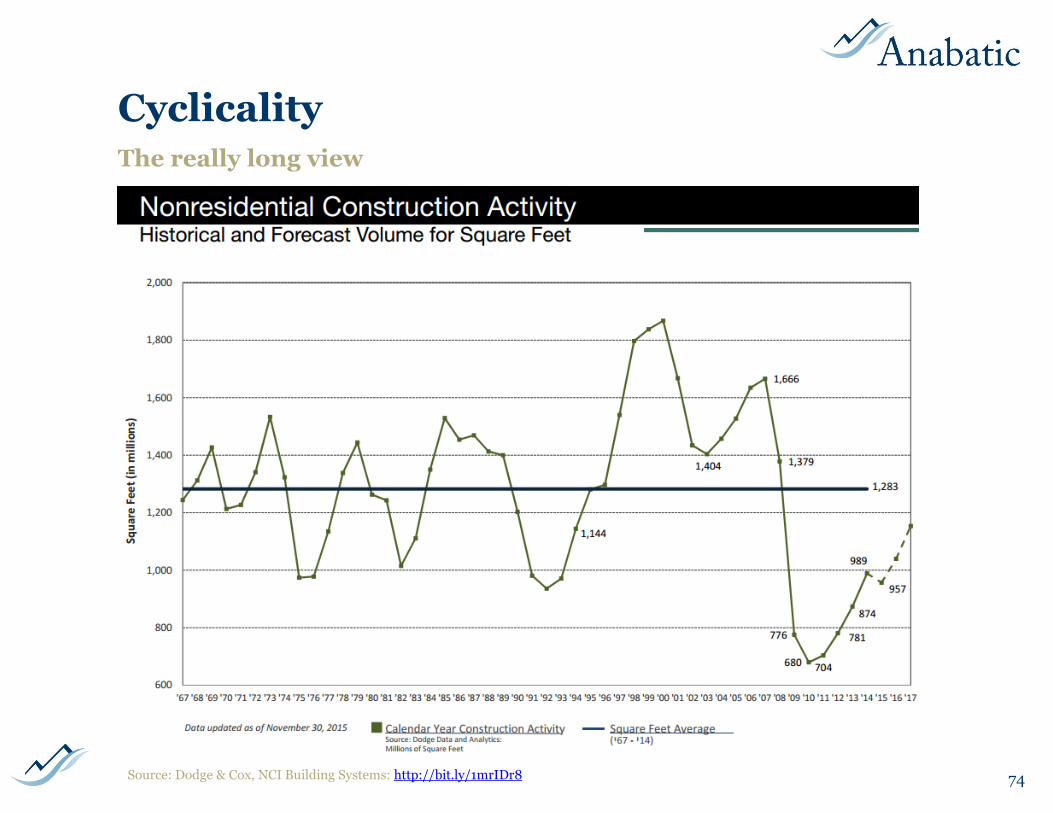
Cyclicality
74Source: Dodge & Cox, NCI Building Systems: http://bit.ly/1mrIDr8
The really long view
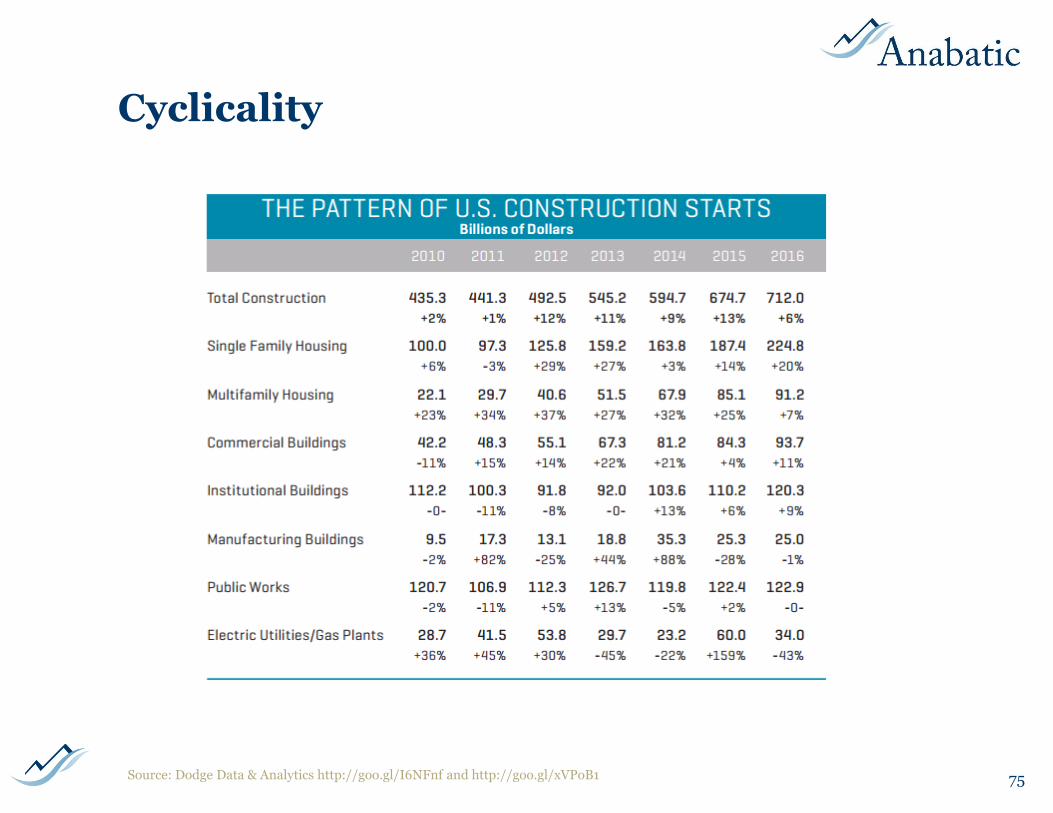
Cyclicality
75Source: Dodge Data & Analytics http://goo.gl/I6NFnf and http://goo.gl/xVPoB1
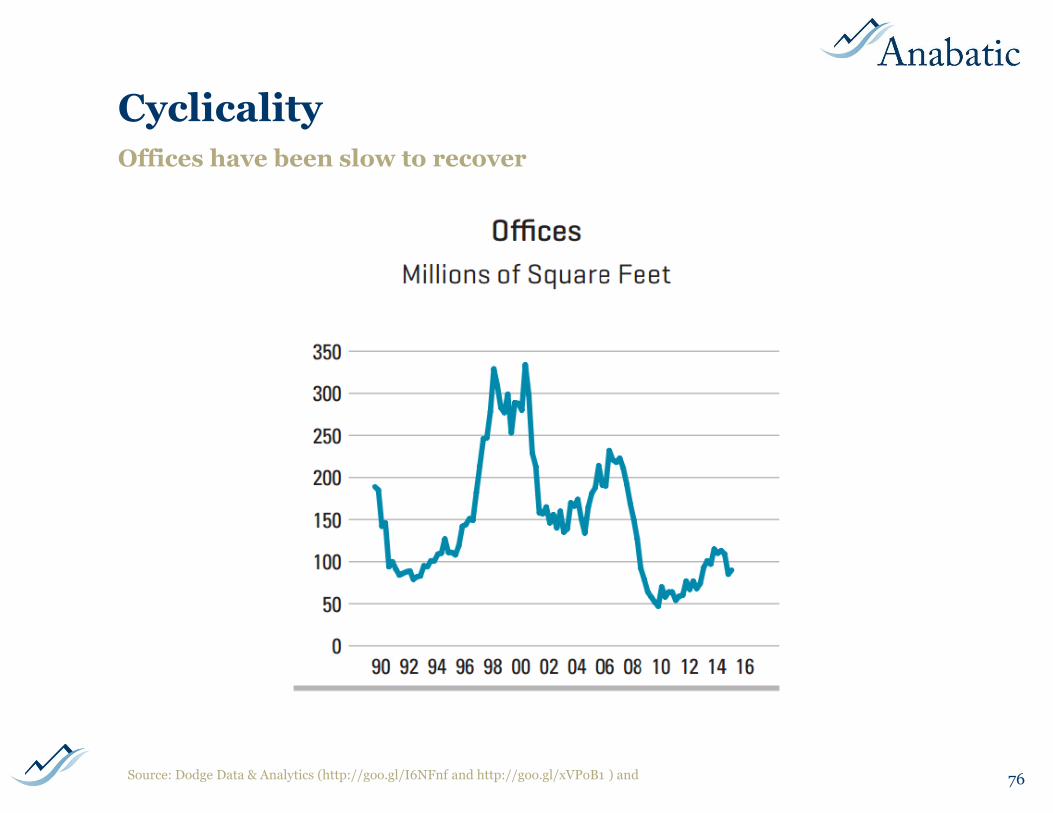
Cyclicality
76
Offices have been slow to recover
Source: Dodge Data & Analytics (http://goo.gl/I6NFnf and http://goo.gl/xVPoB1 ) and
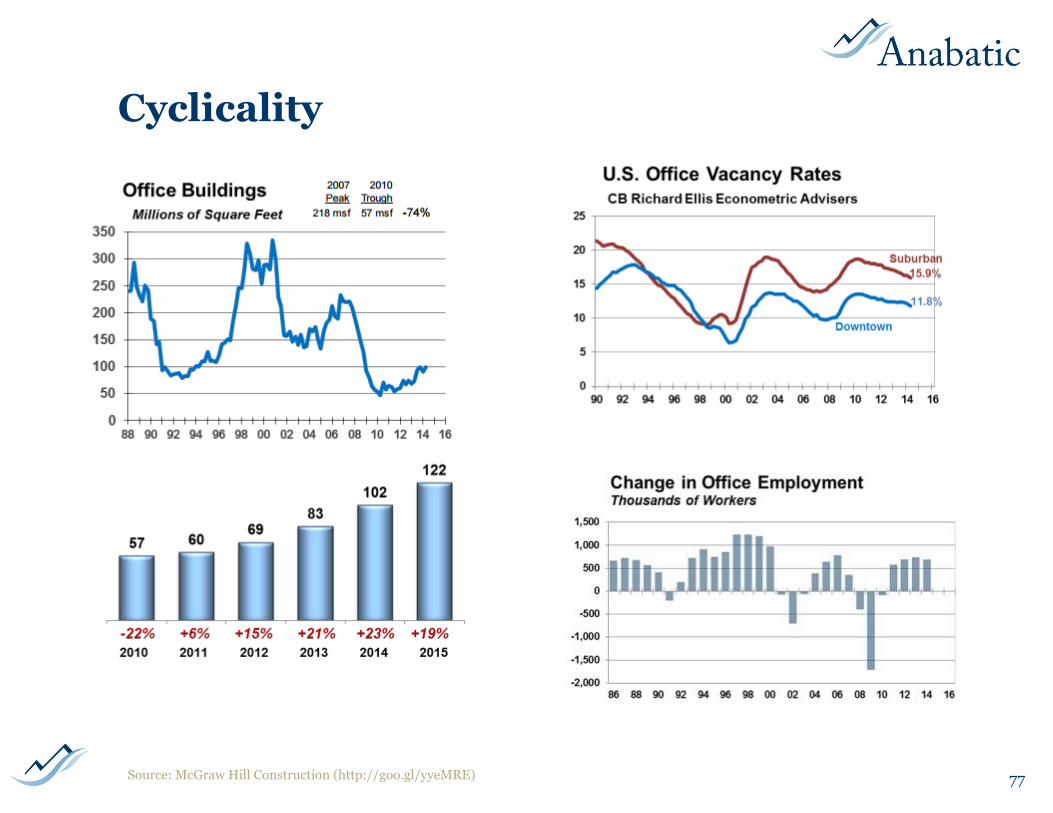
Cyclicality
77Source: McGraw Hill Construction (http://goo.gl/yyeMRE)
Other Resources
SEC filings: There is no substitute for original-source documents
Armstrong’s Fourth Amended Plan of Reorganization: http://goo.gl/0RWZdf
Armstrong’s Disclosure Statement: http://goo.gl/h3bvYB
Other websites/publications:
The American Institute of Architects: http://www.aia.org/
McGraw-Hill / Dodge Data & Analytics: http://construction.com/
78
Special Thanks
79
A special thanks to Karan Saberwal for his help in preparing sections of this presentation
Karan Saberwal
V. Contact Information
80
Philip C. Ordway
Managing Principal
Anabatic Investment Partners LLC
Office: (630) 481-4134
Mobile: (312) 965-4396
Questions, comments, and feedback are always welcome!