Embed Size (px)
Citation preview
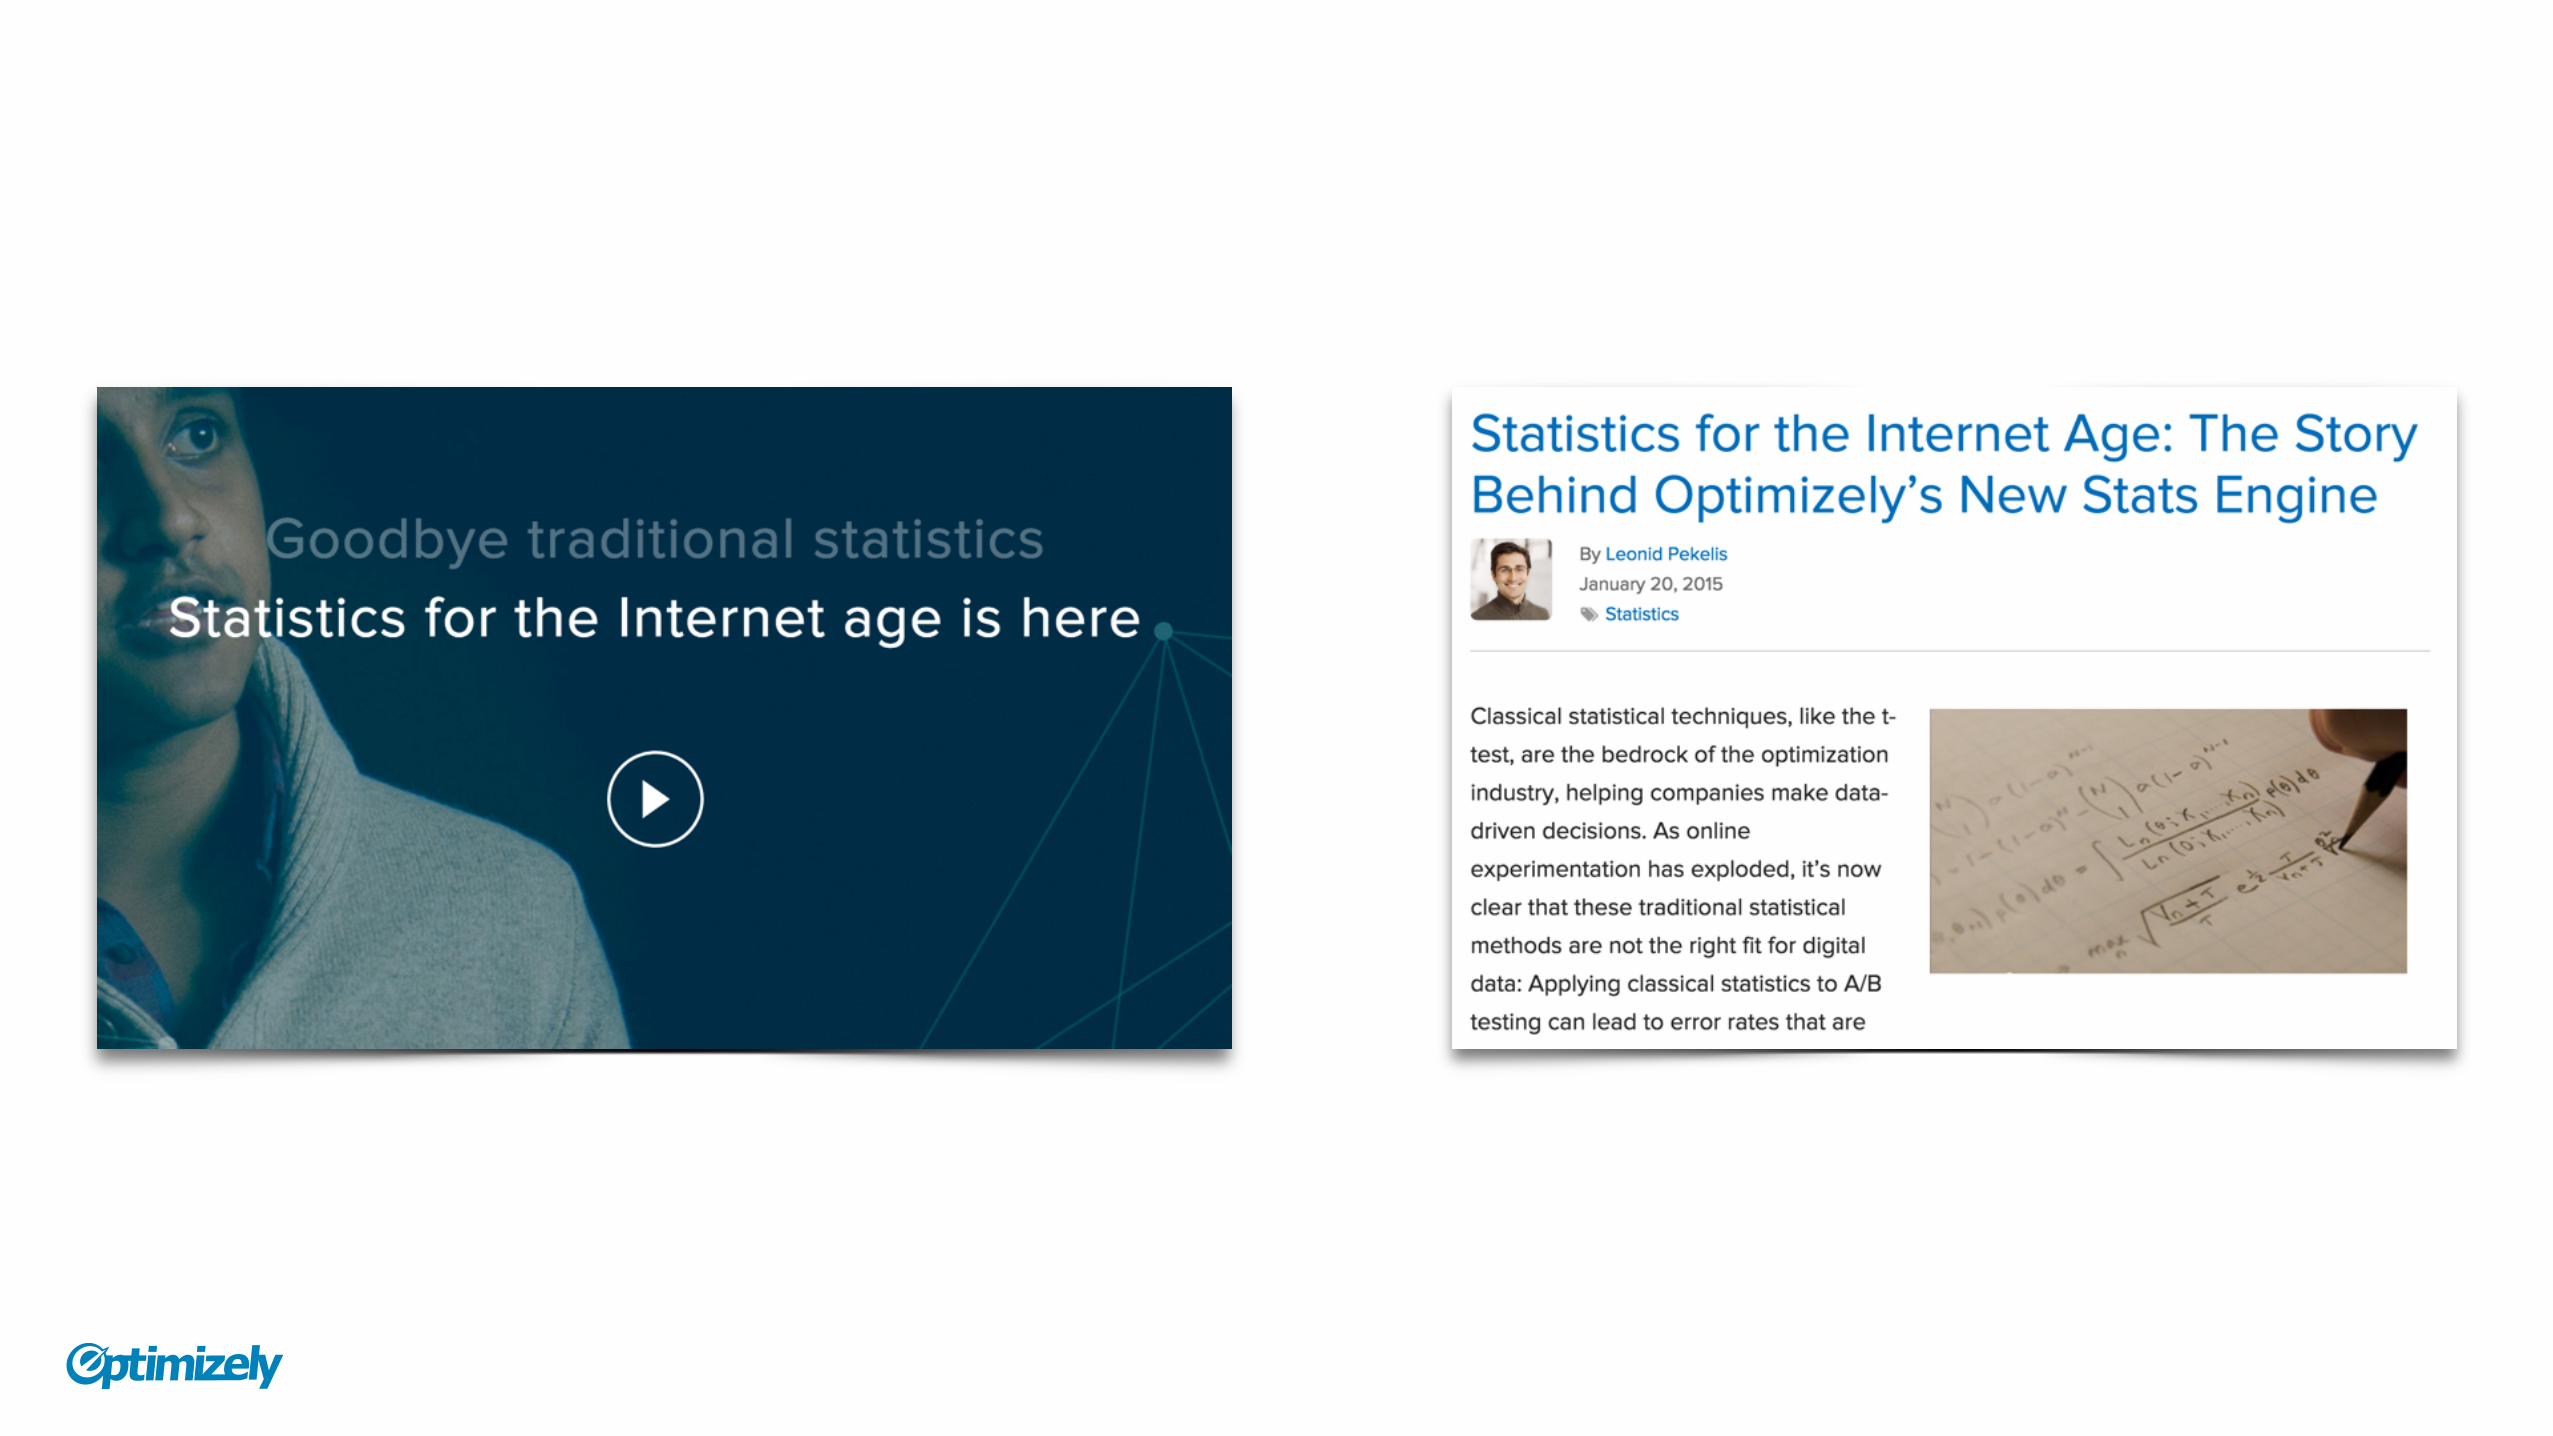
Testing with Stats Engine Why it’s harder to find winners with Optimizely
Pete KoomenCo-founder & CTO, Optimizely
#opticon2015
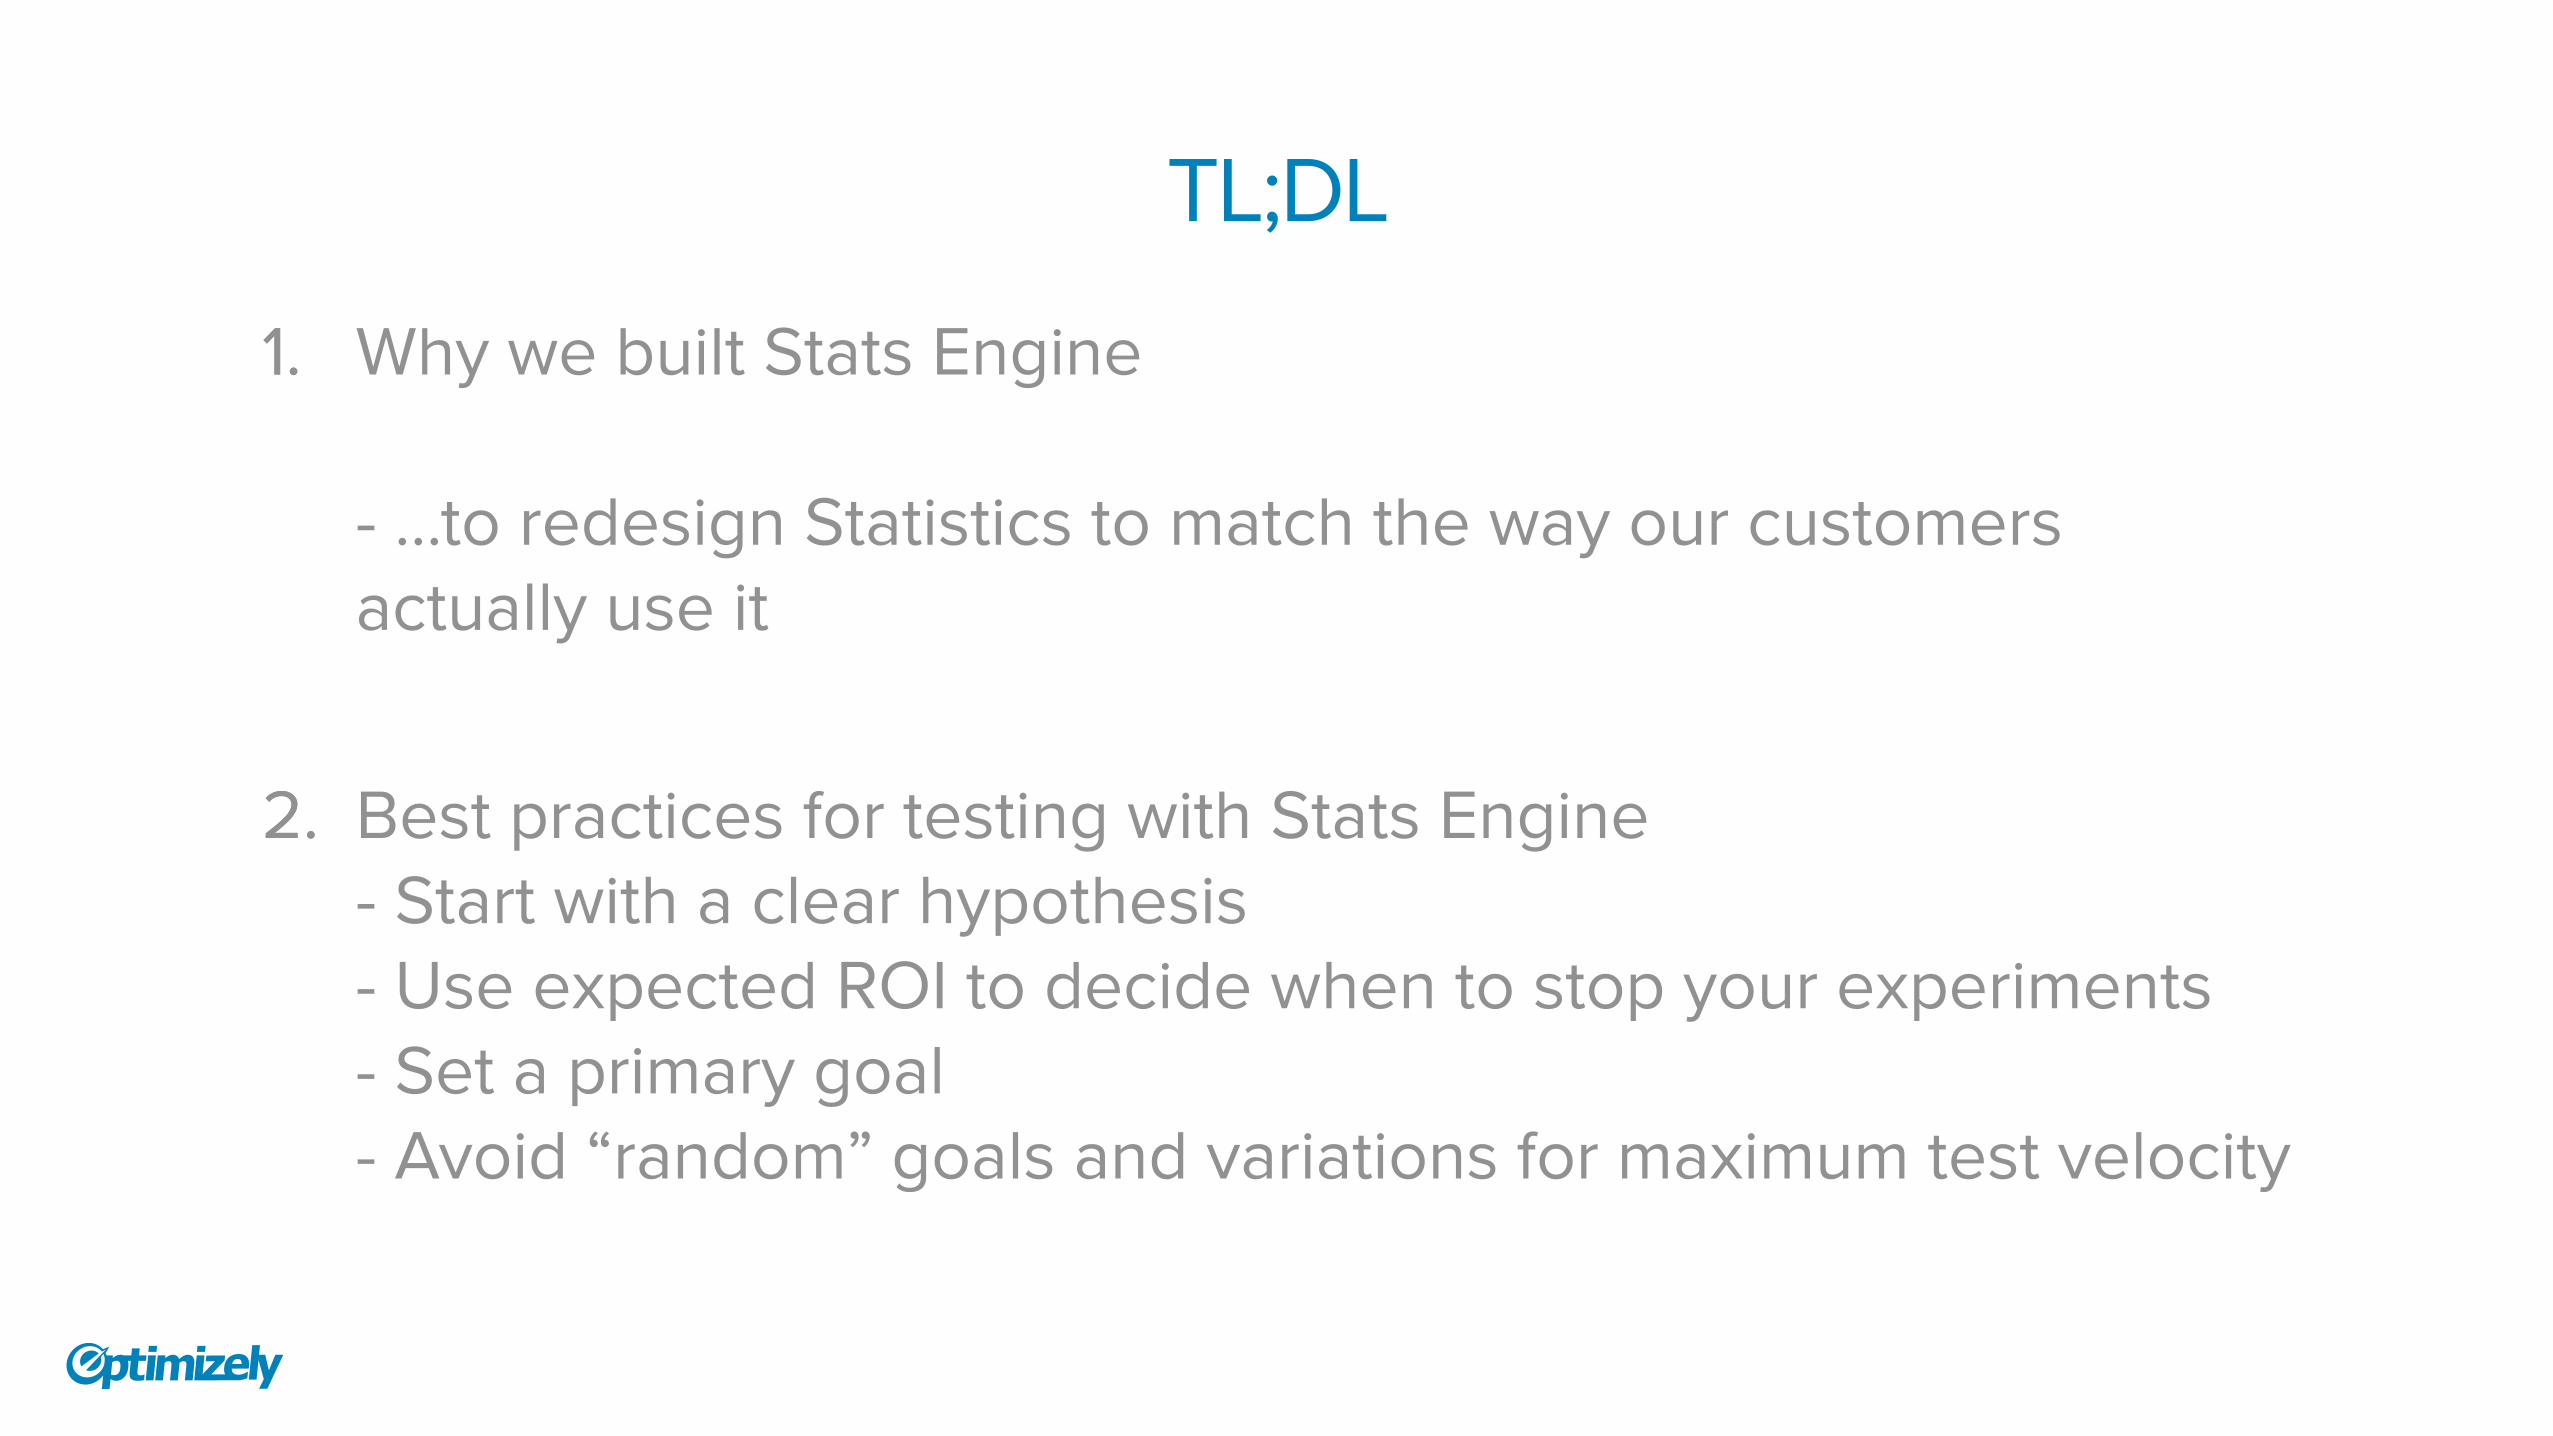
1. Why we built Stats Engine
2. Best practices for testing with Stats Engine
1. - …to redesign Statistics to match the way our customers actually use it
2. - Start with a clear hypothesis- Use expected ROI to decide when to stop your experiments- Set a primary goal- Avoid “random” goals and variations for maximum test velocity
TL;DL
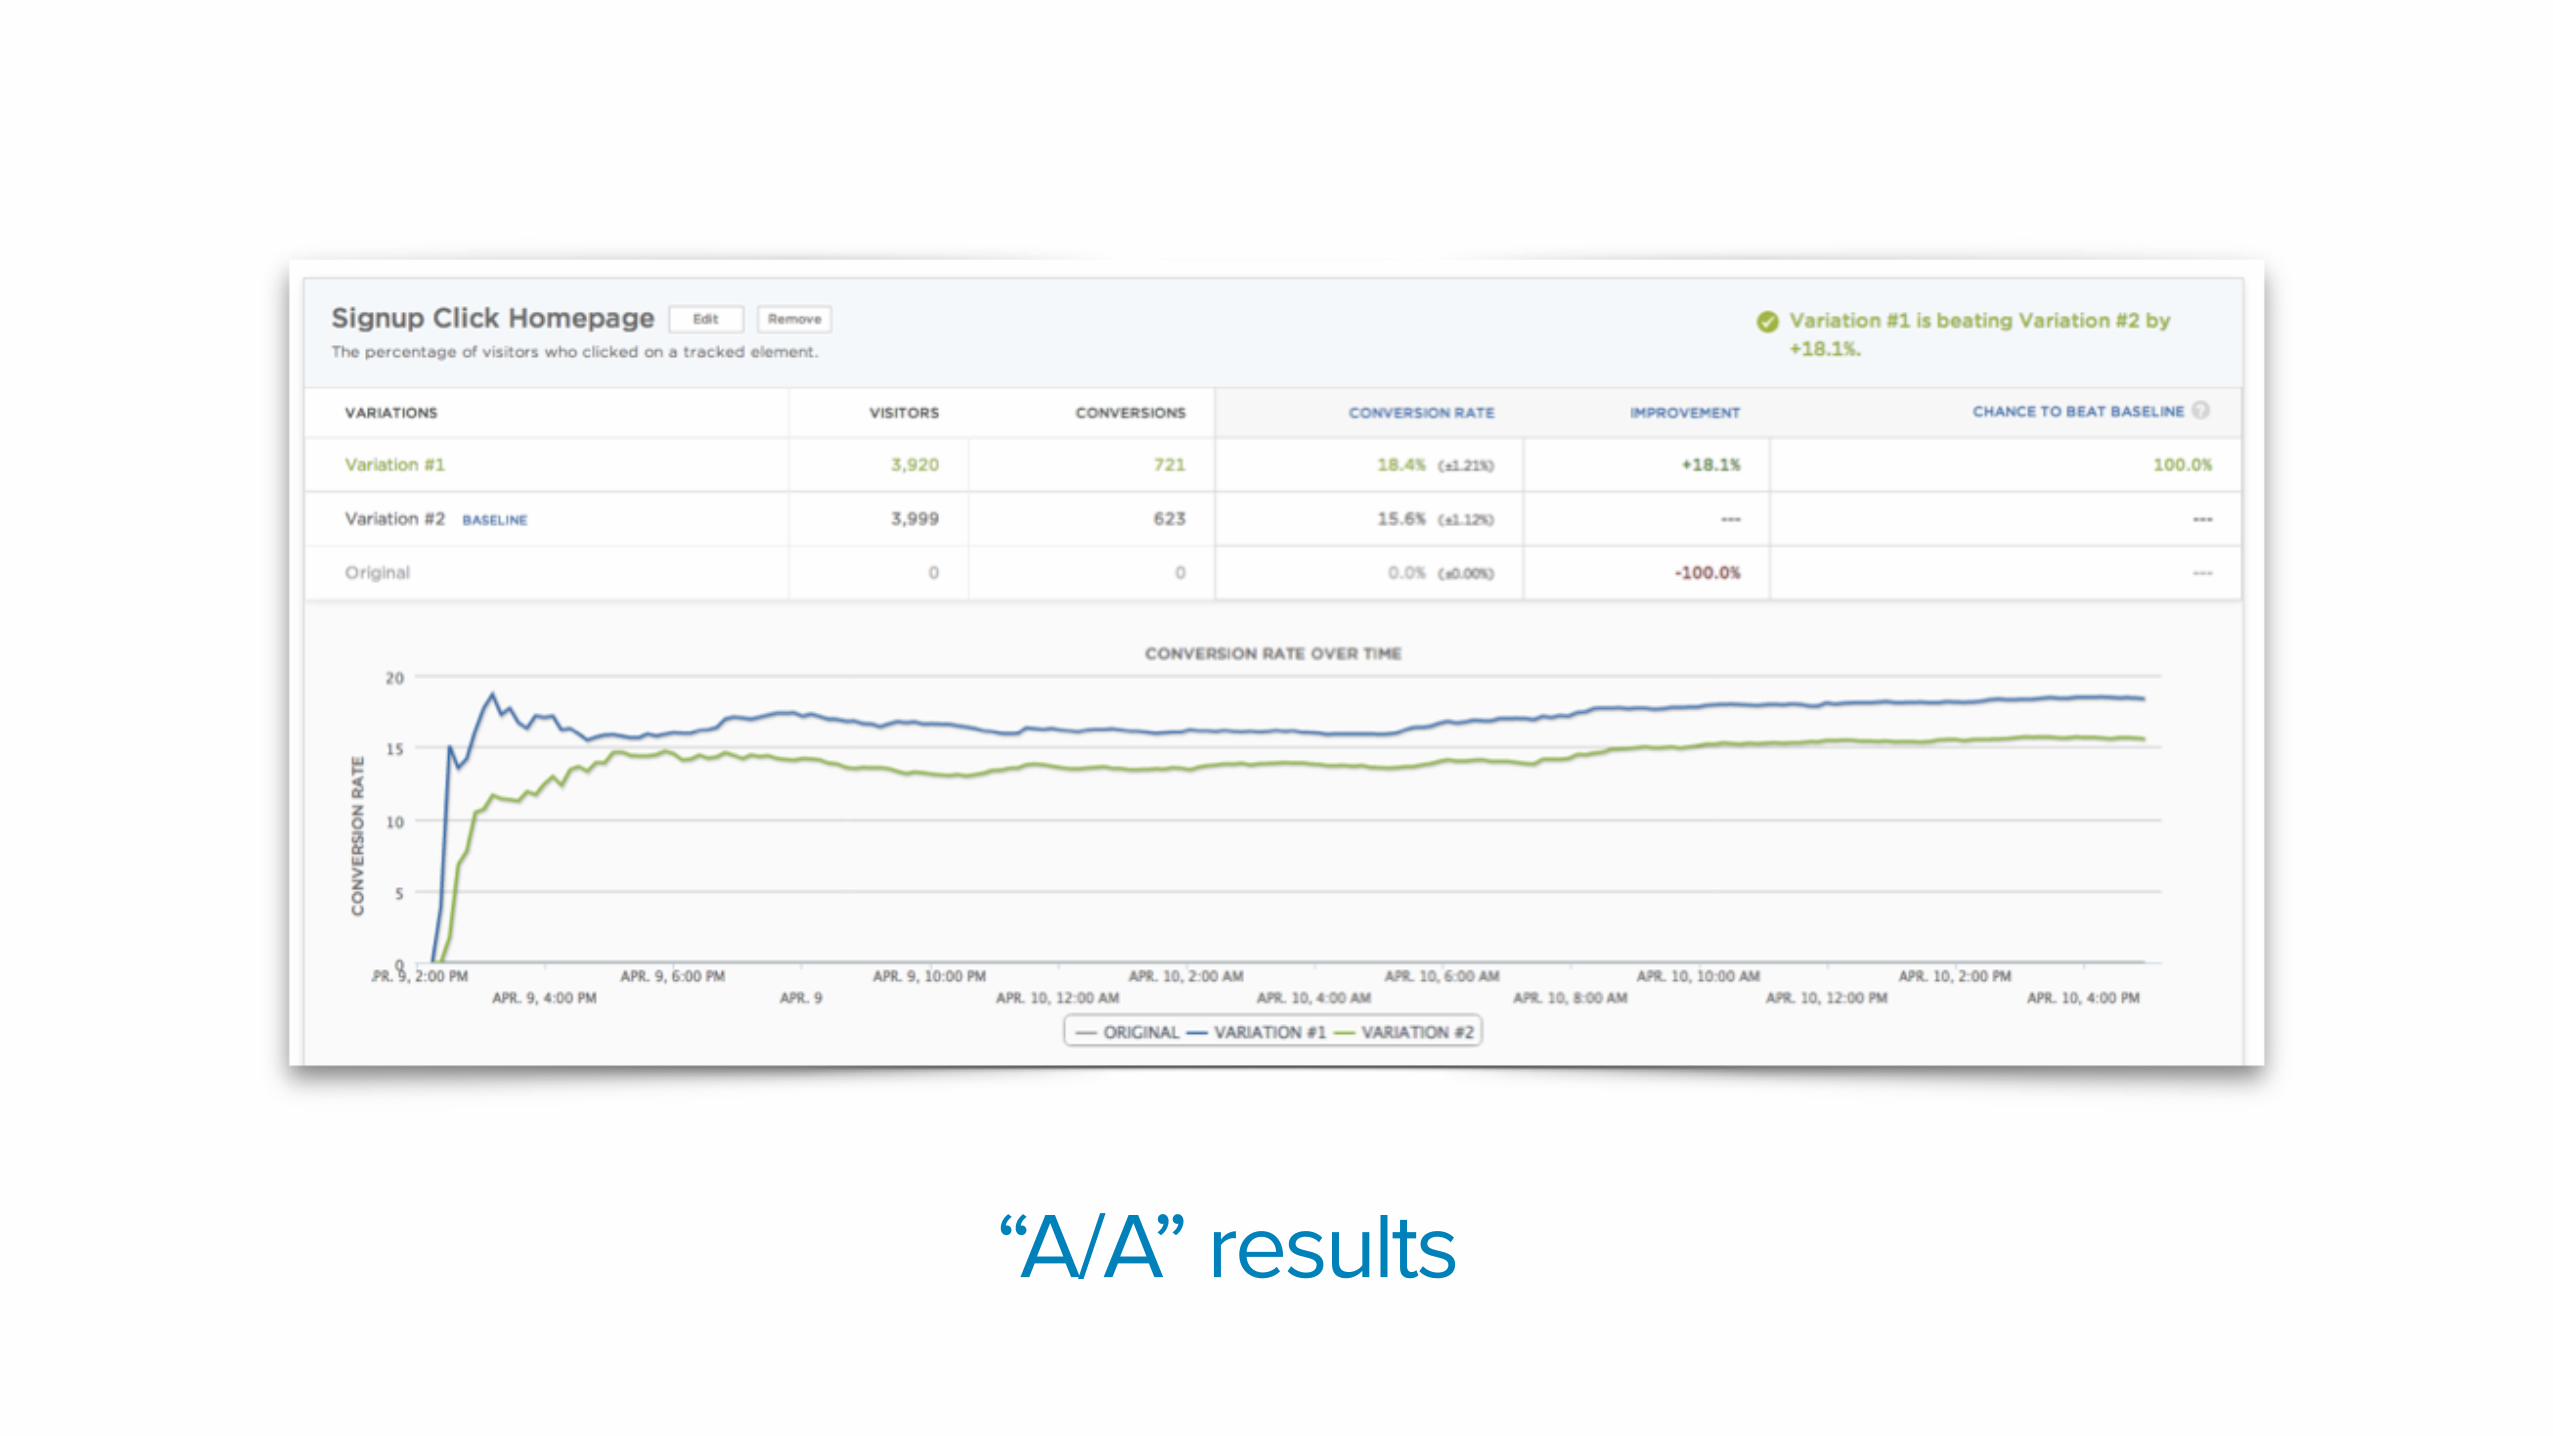
“A/A” results

What’s going on here?
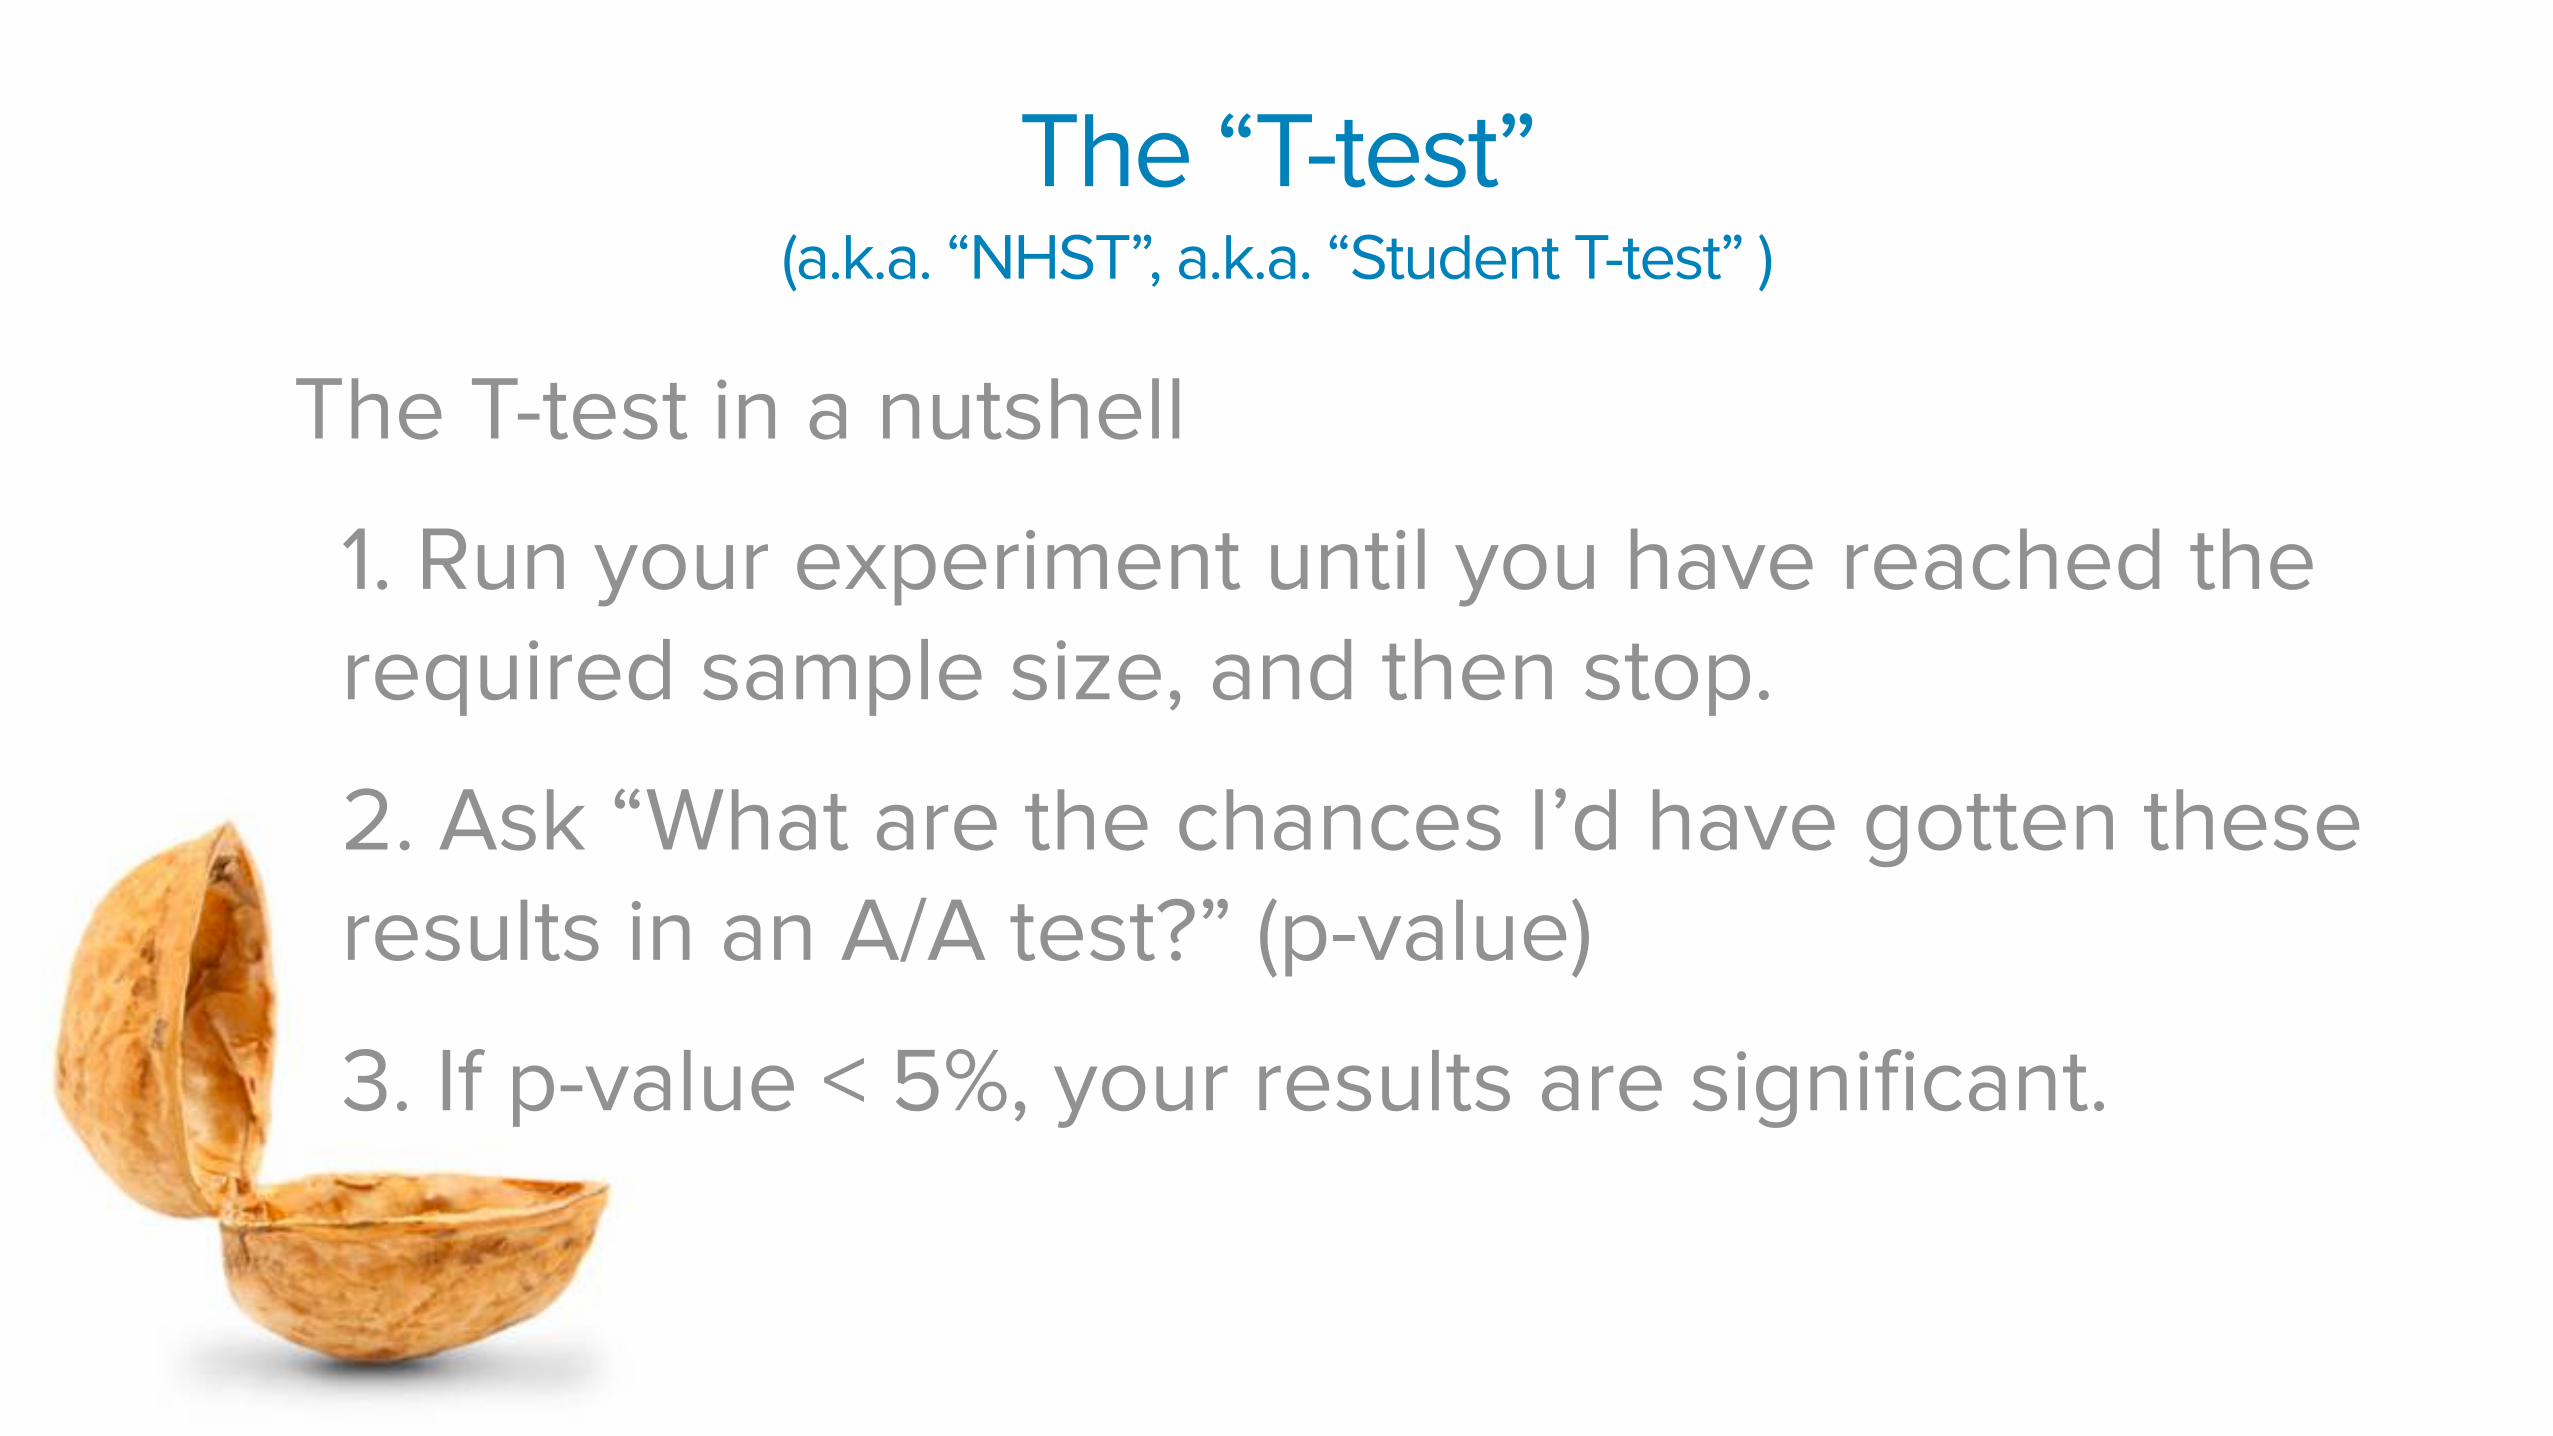
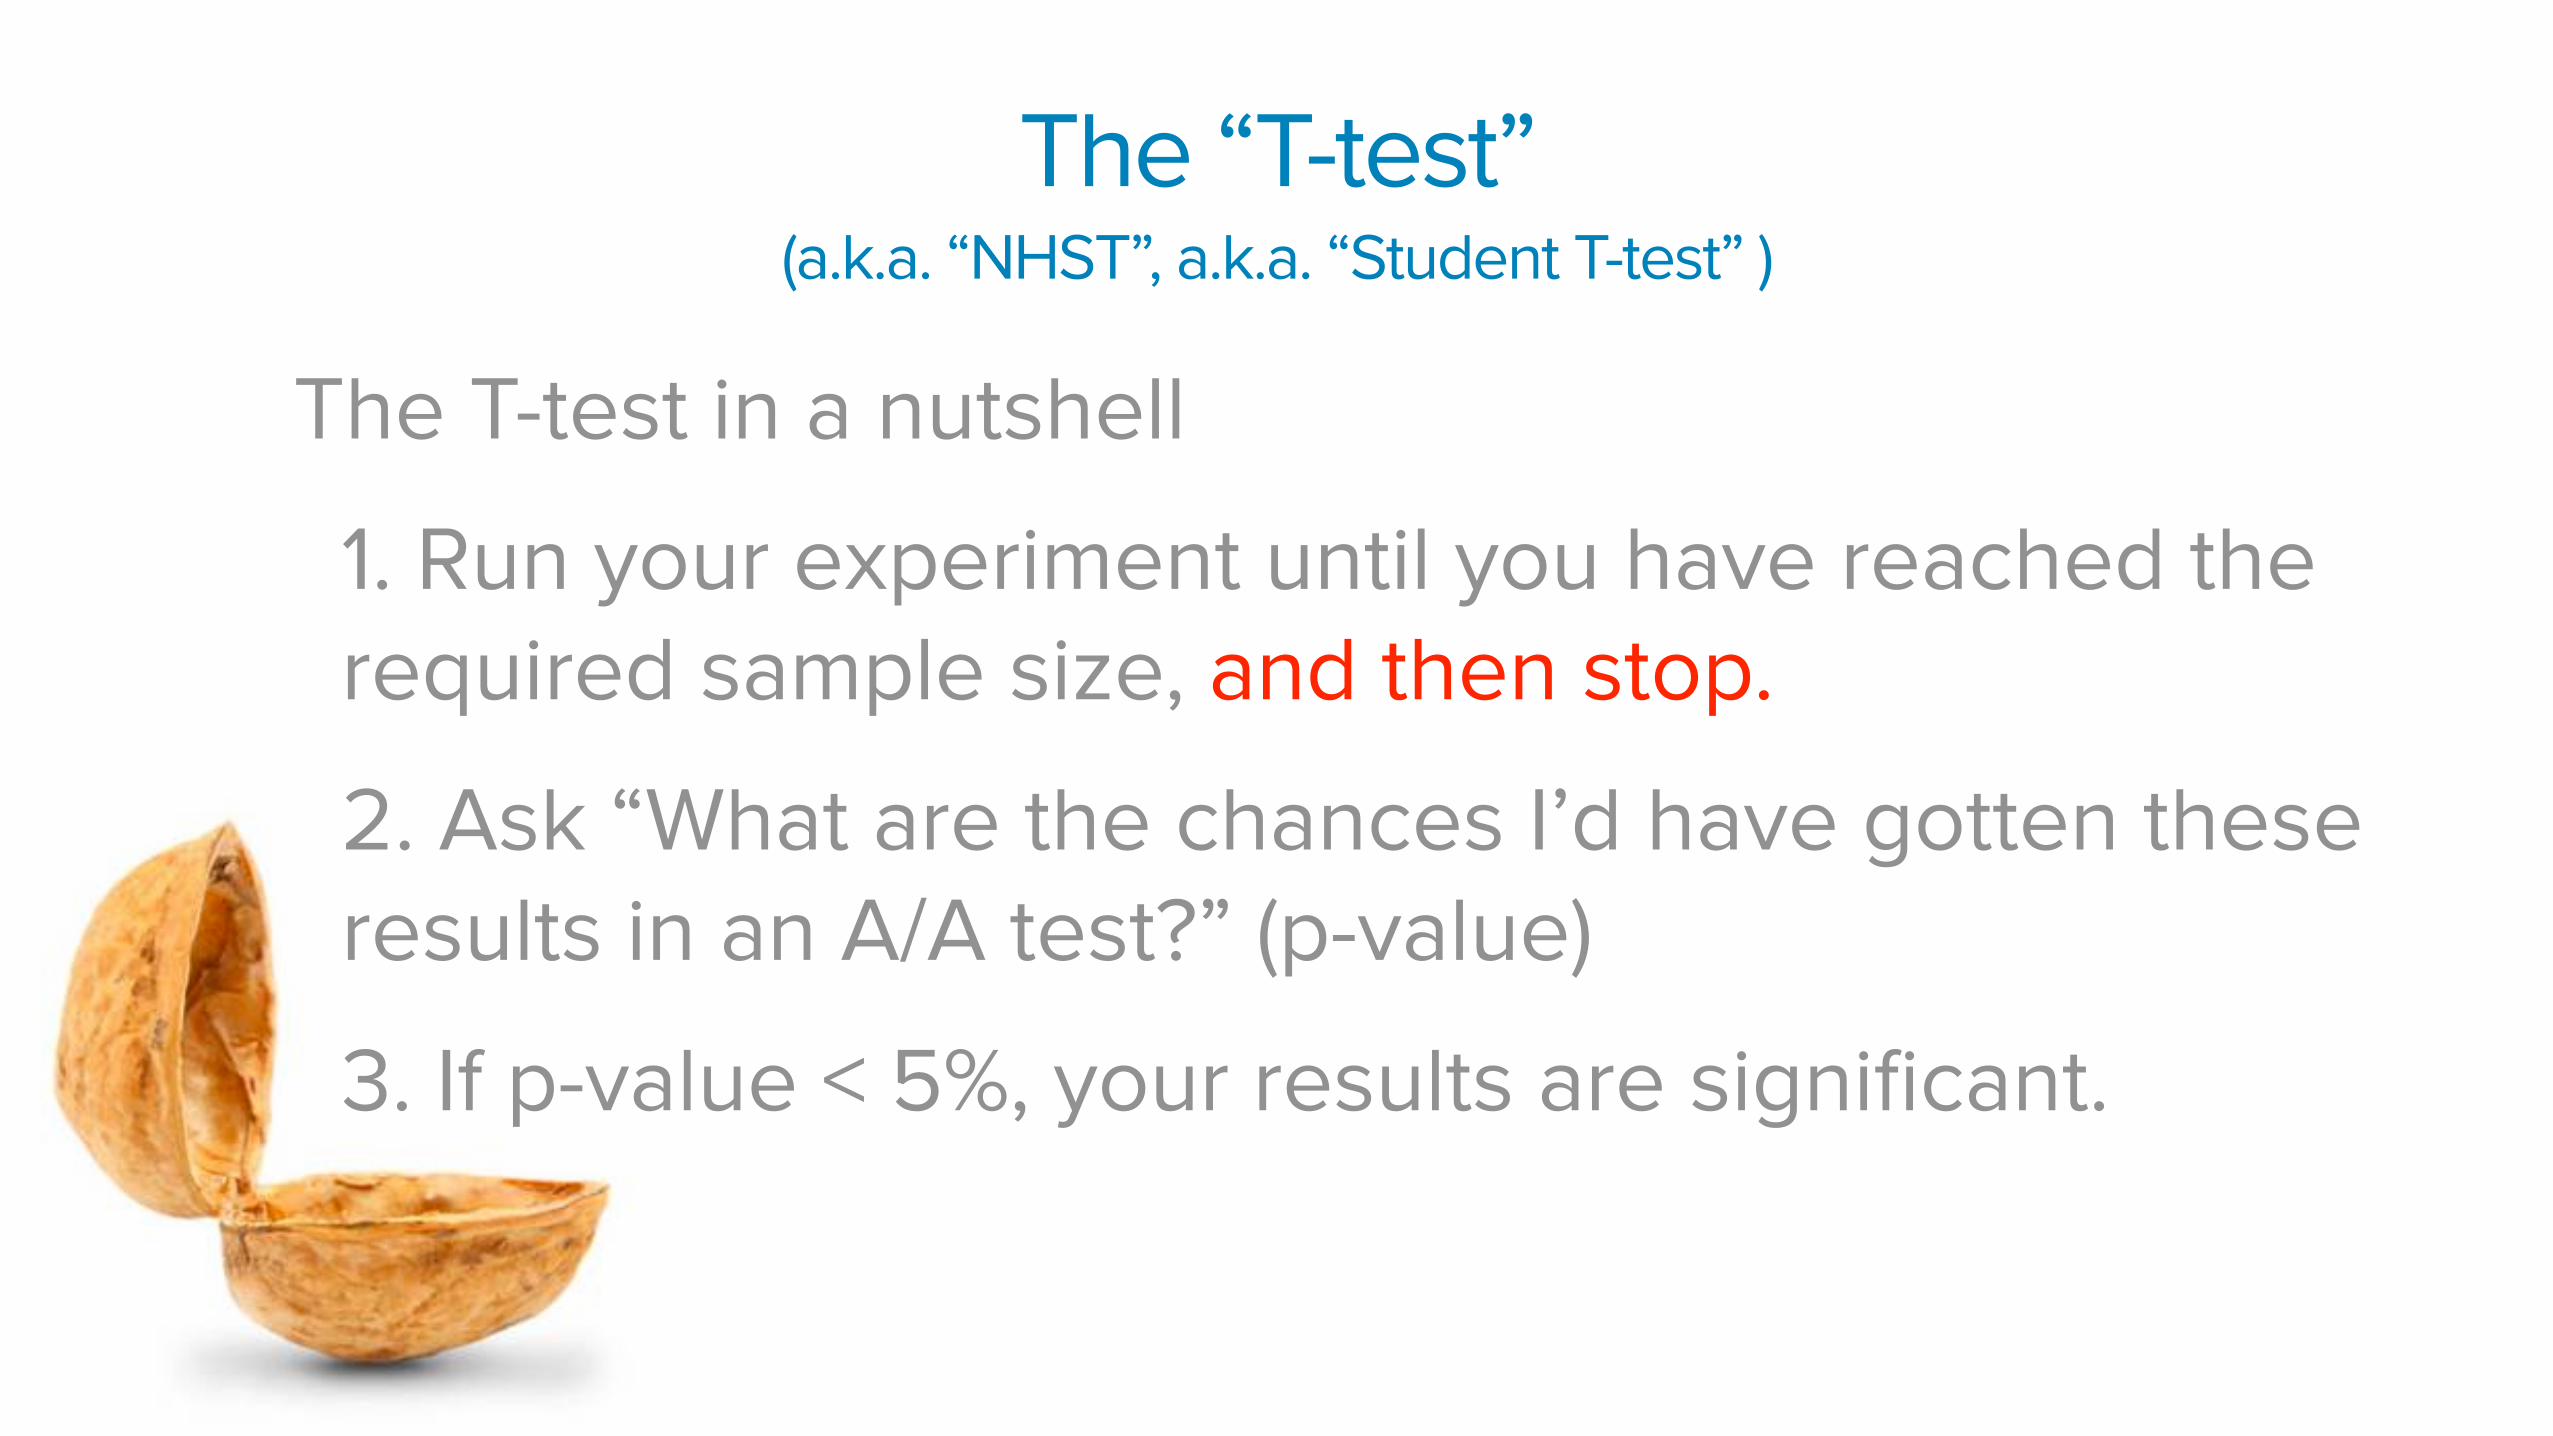
The “T-test” (a.k.a. “NHST”, a.k.a. “Student T-test” )
The T-test in a nutshell
1. Run your experiment until you have reached the required sample size, and then stop.
2. Ask “What are the chances I’d have gotten these results in an A/A test?” (p-value)
3. If p-value < 5%, your results are significant.
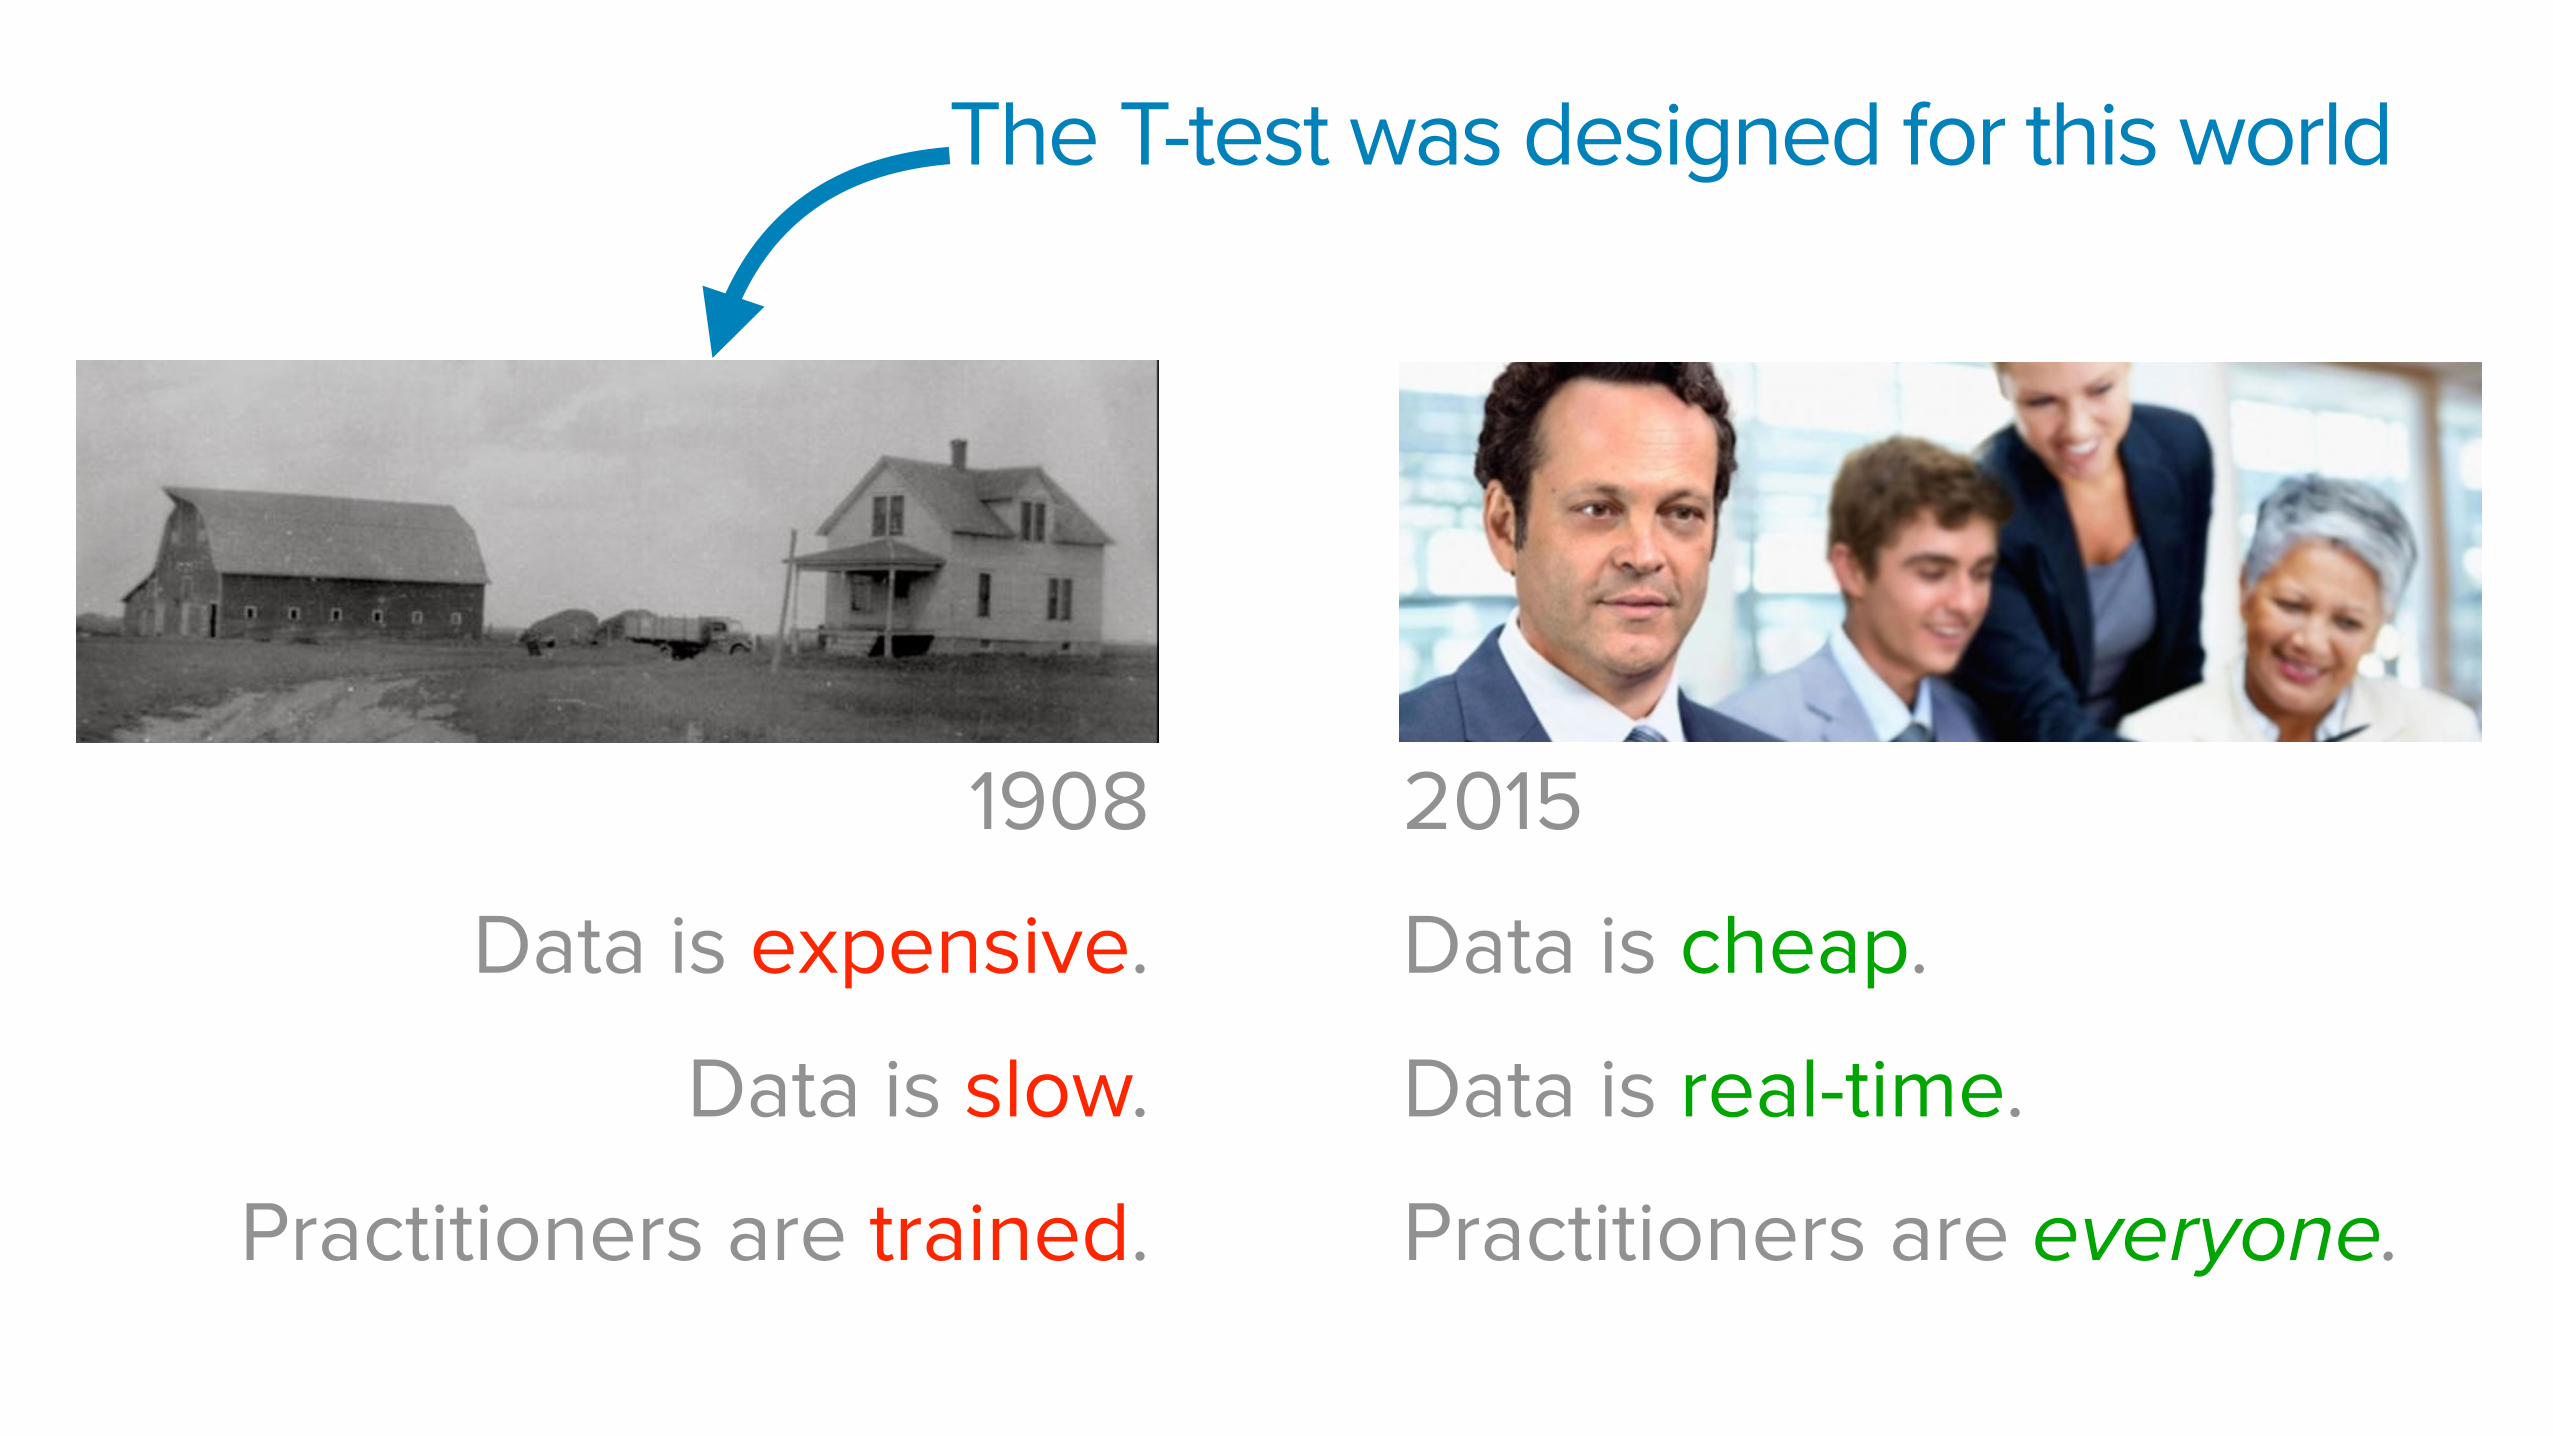
1908
Data is expensive.
Data is slow.
Practitioners are trained.
2015
Data is cheap.
Data is real-time.
Practitioners are everyone.
The T-test was designed for this world
The world has changed, and statistics hasn’t kept up
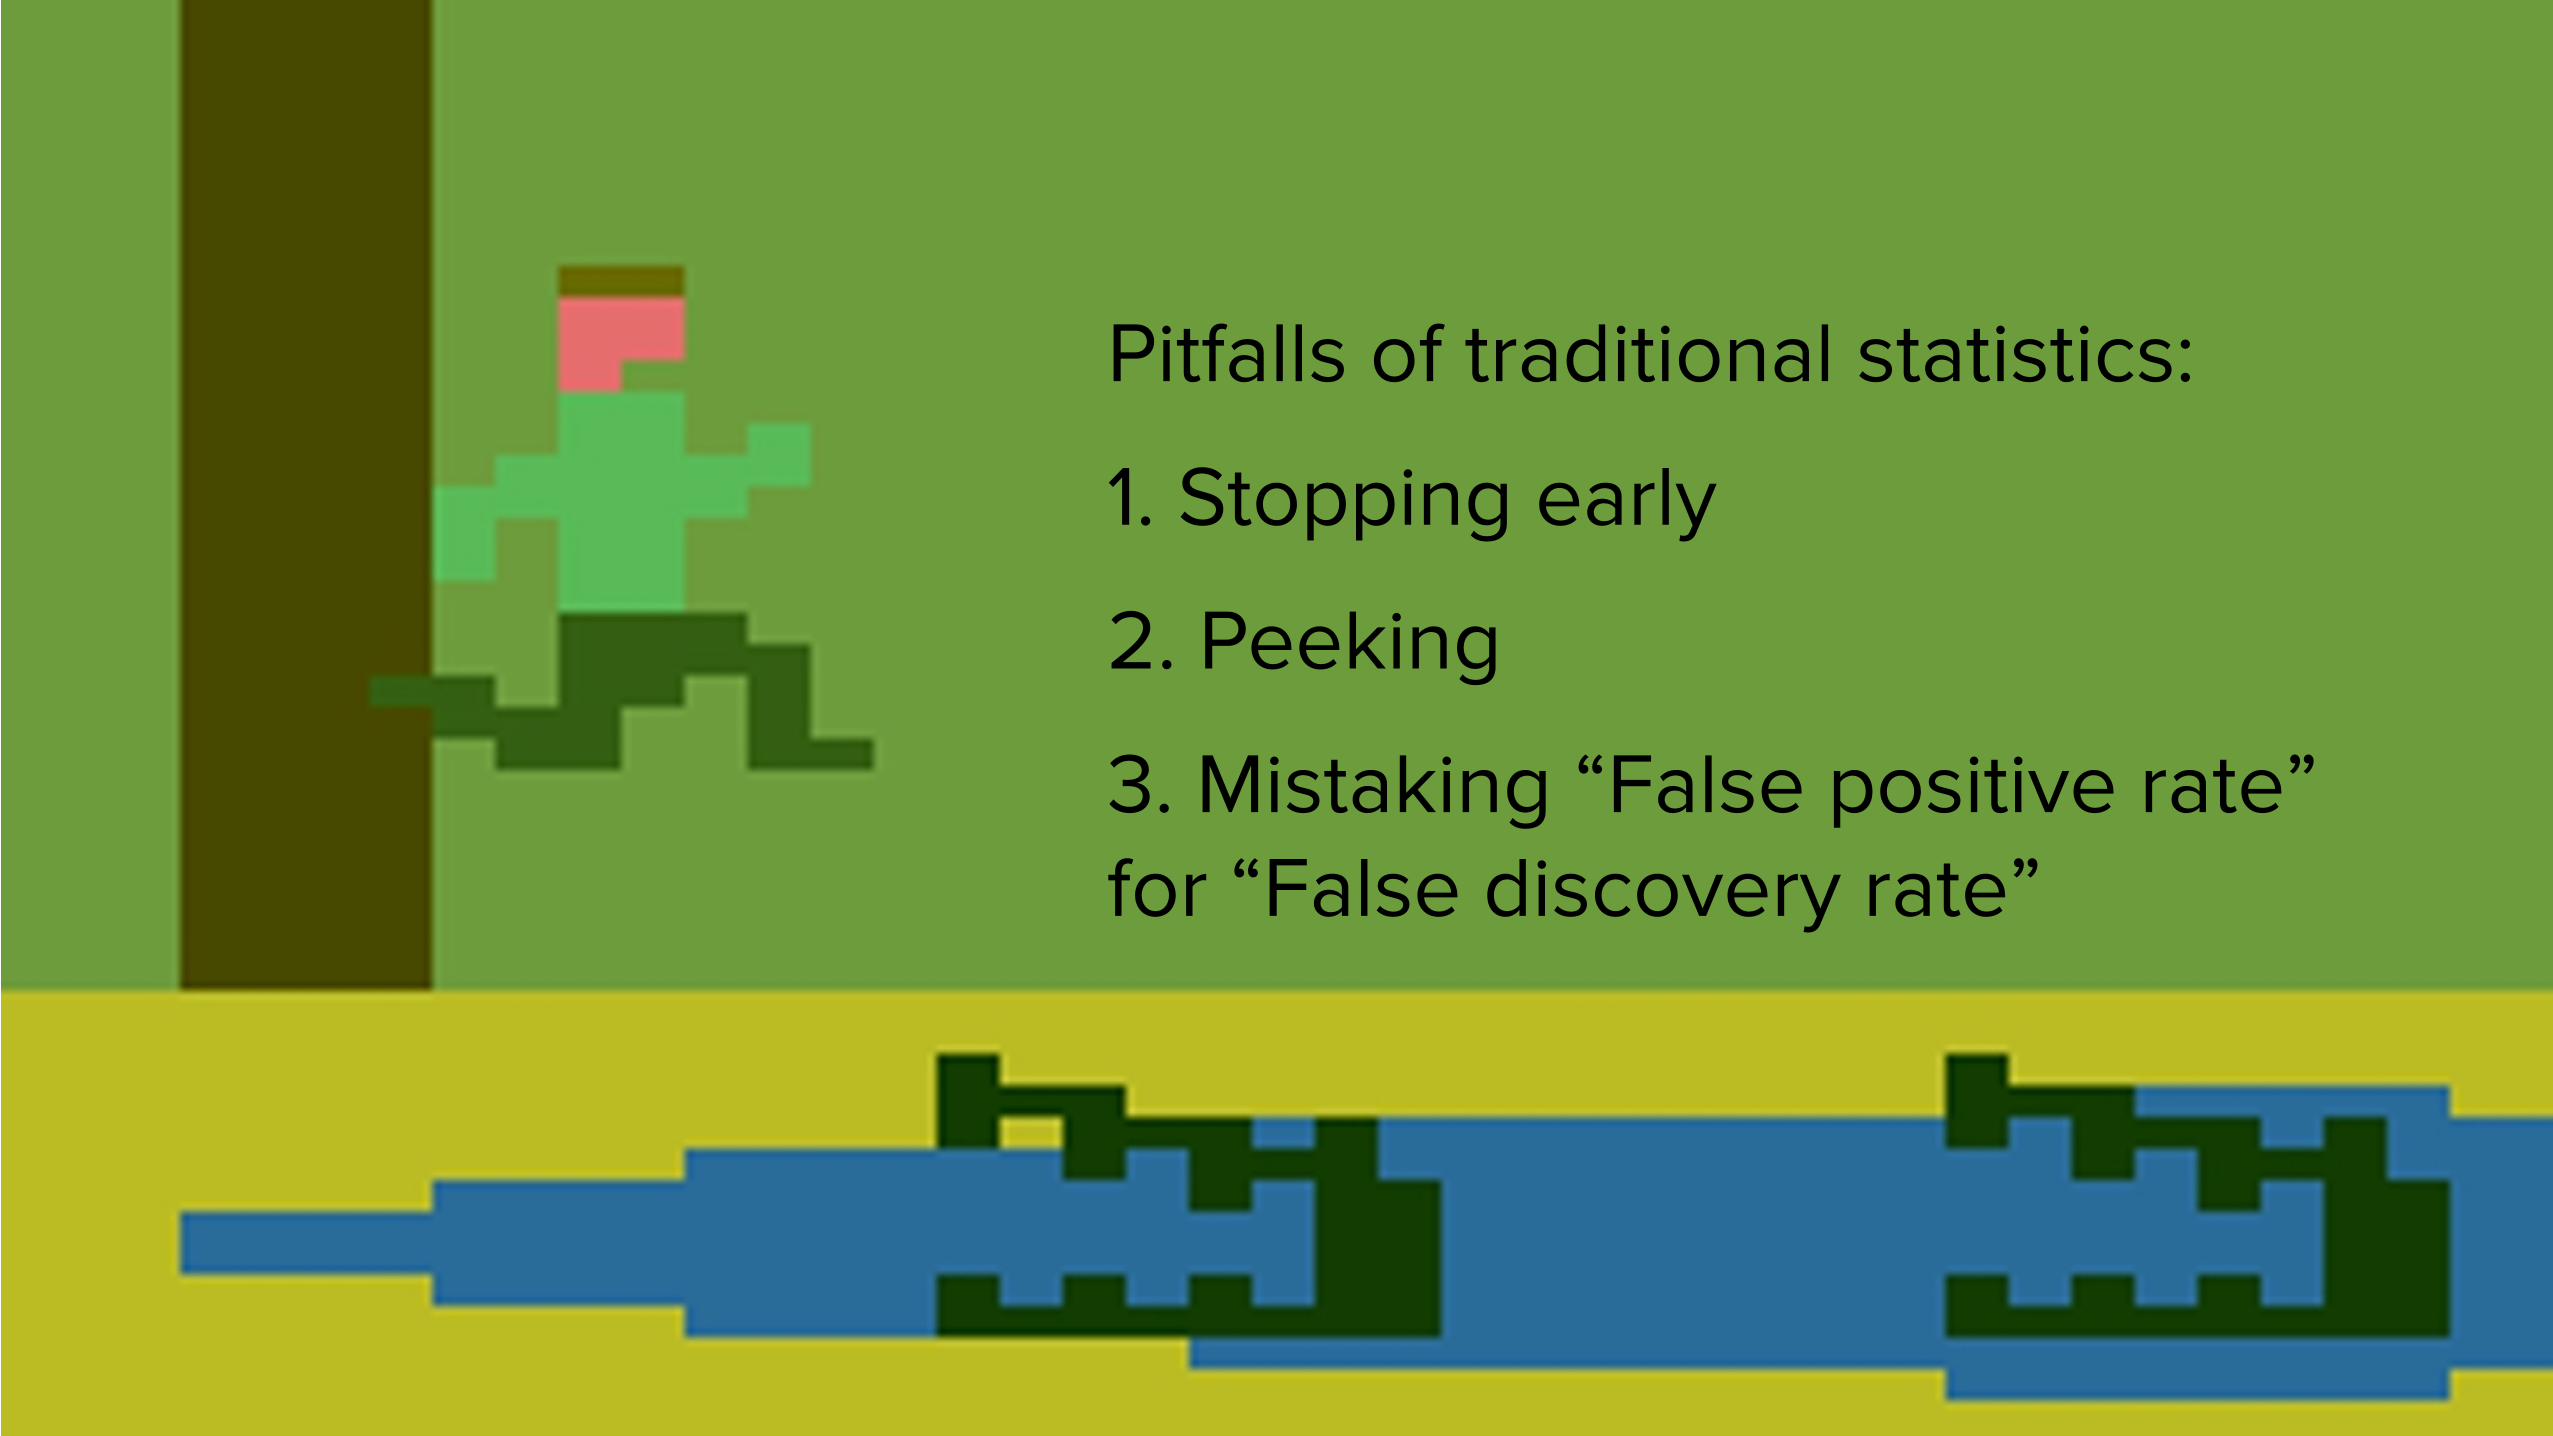
Pitfalls of traditional statistics:
1. Stopping early
2. Peeking
3. Mistaking “False positive rate” for “False discovery rate”

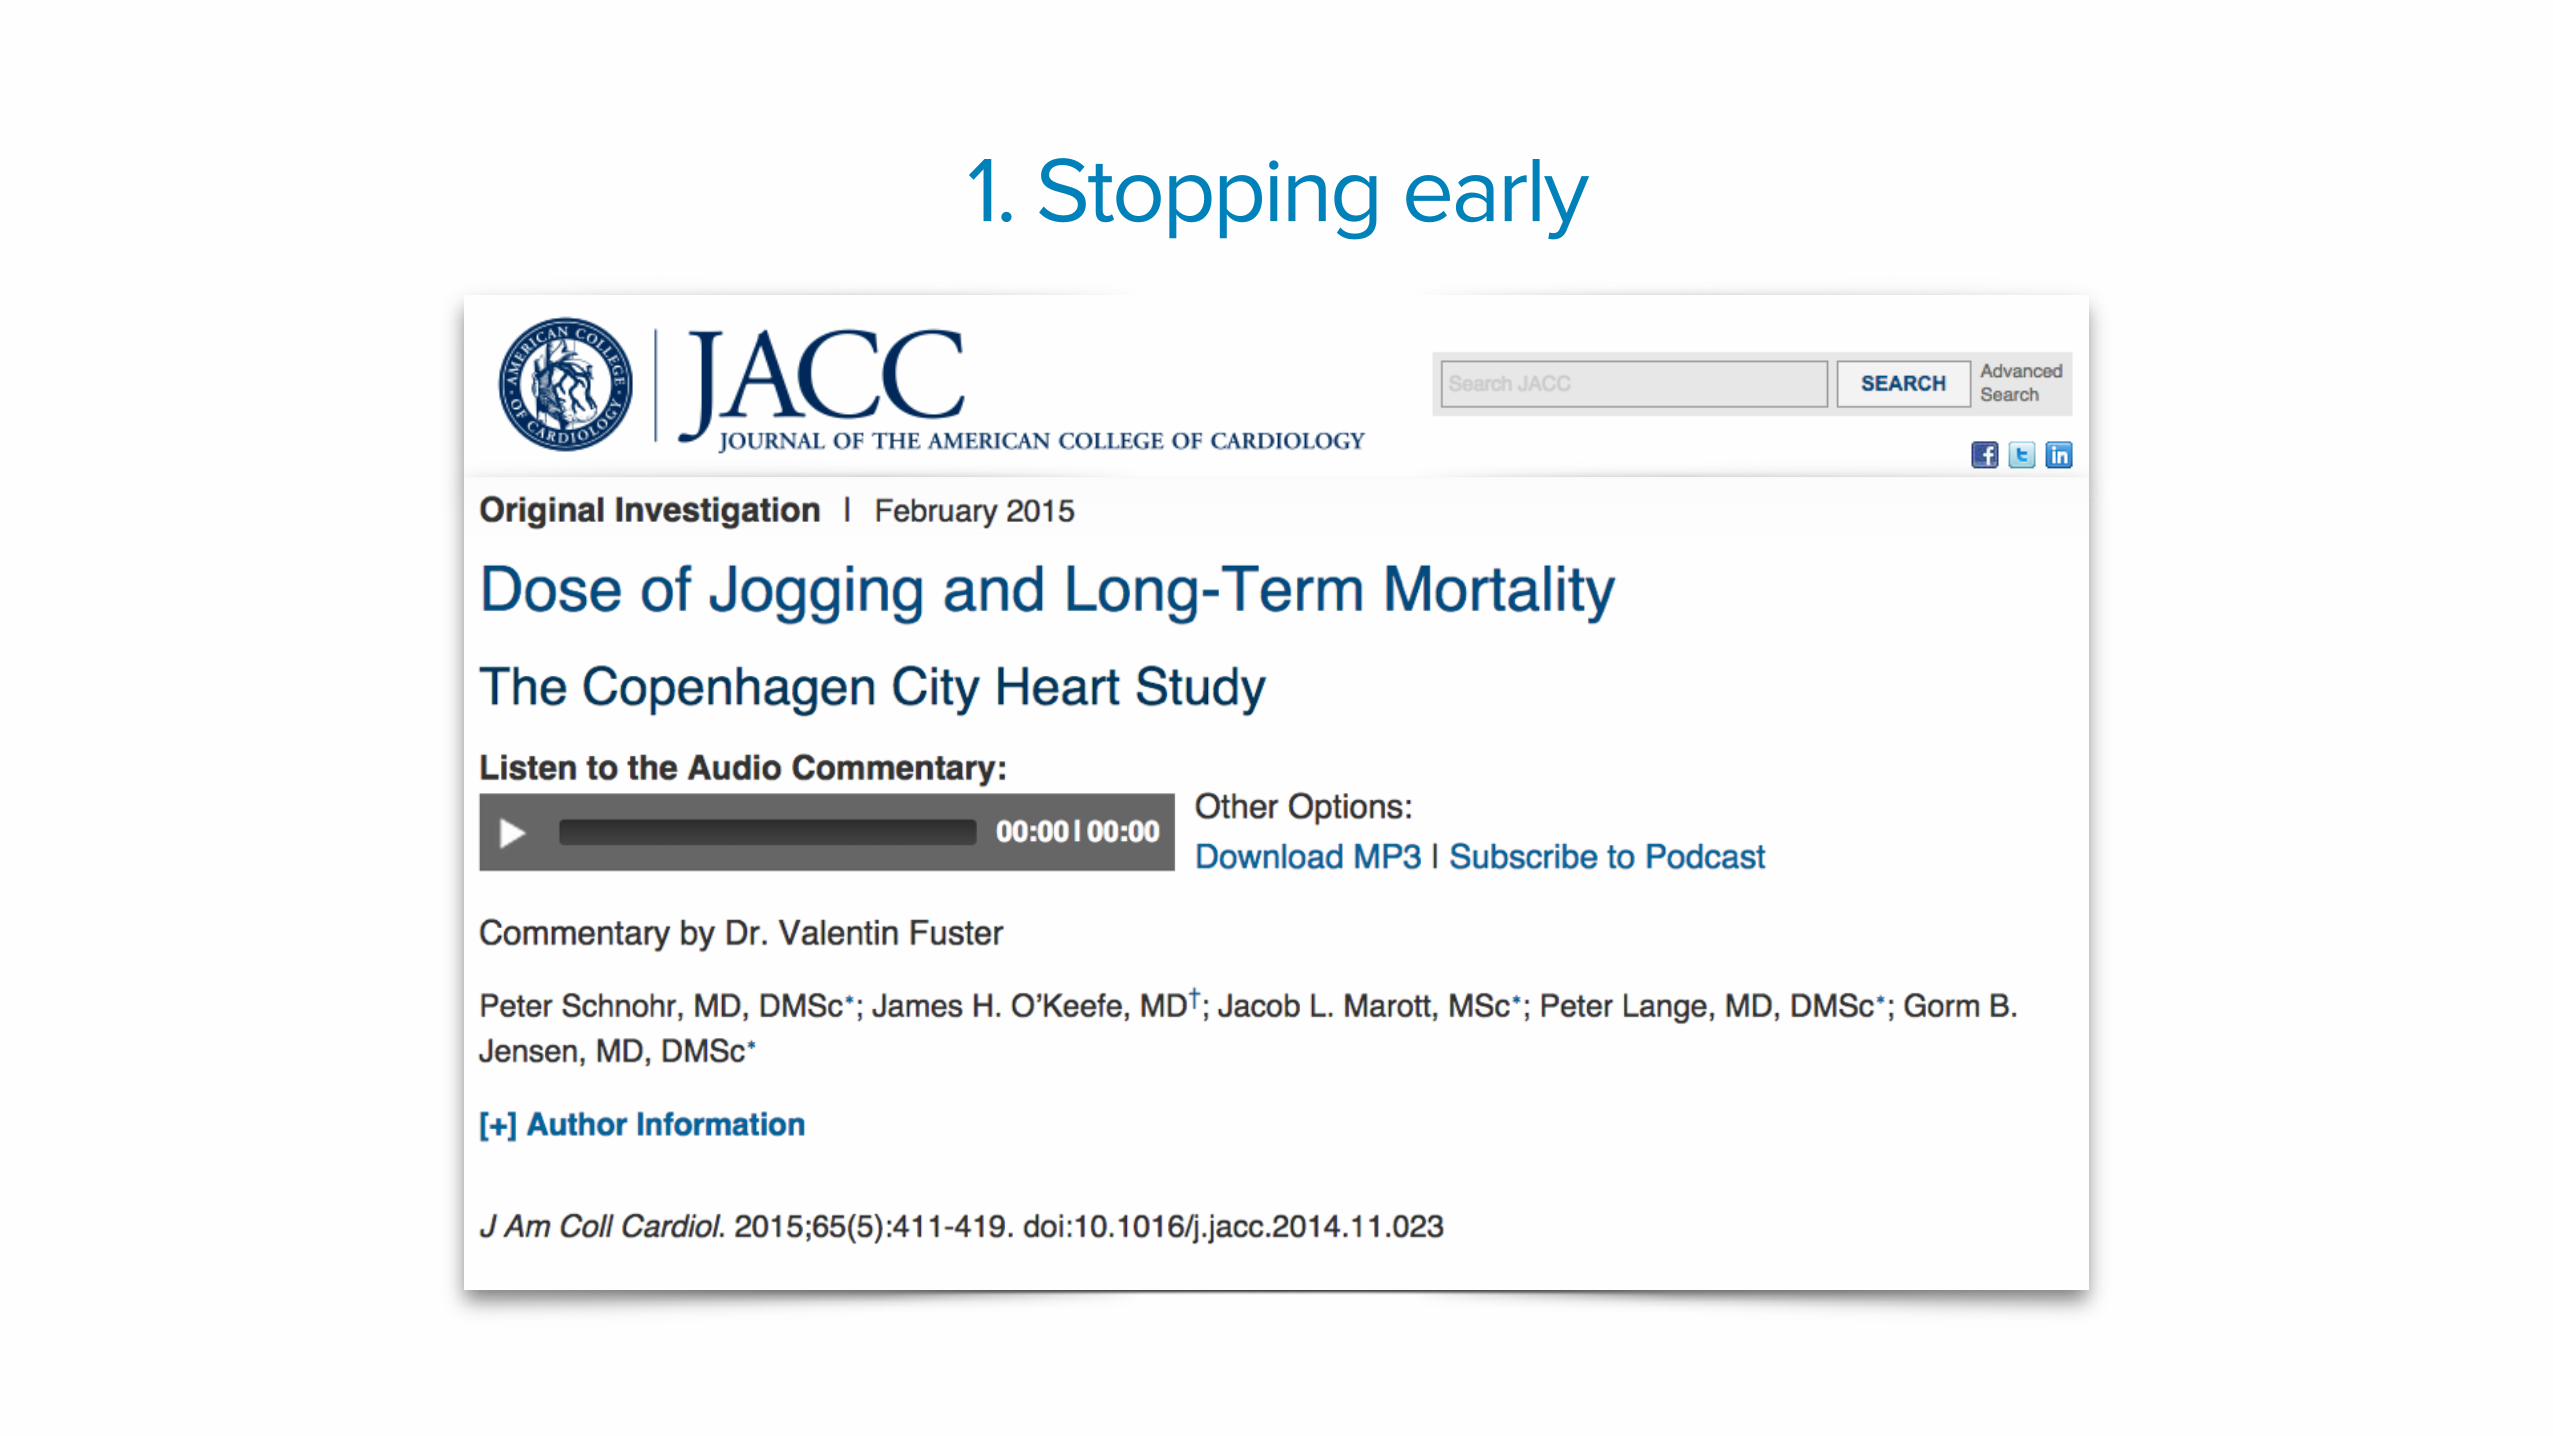
1. Stopping early
1. Stopping early
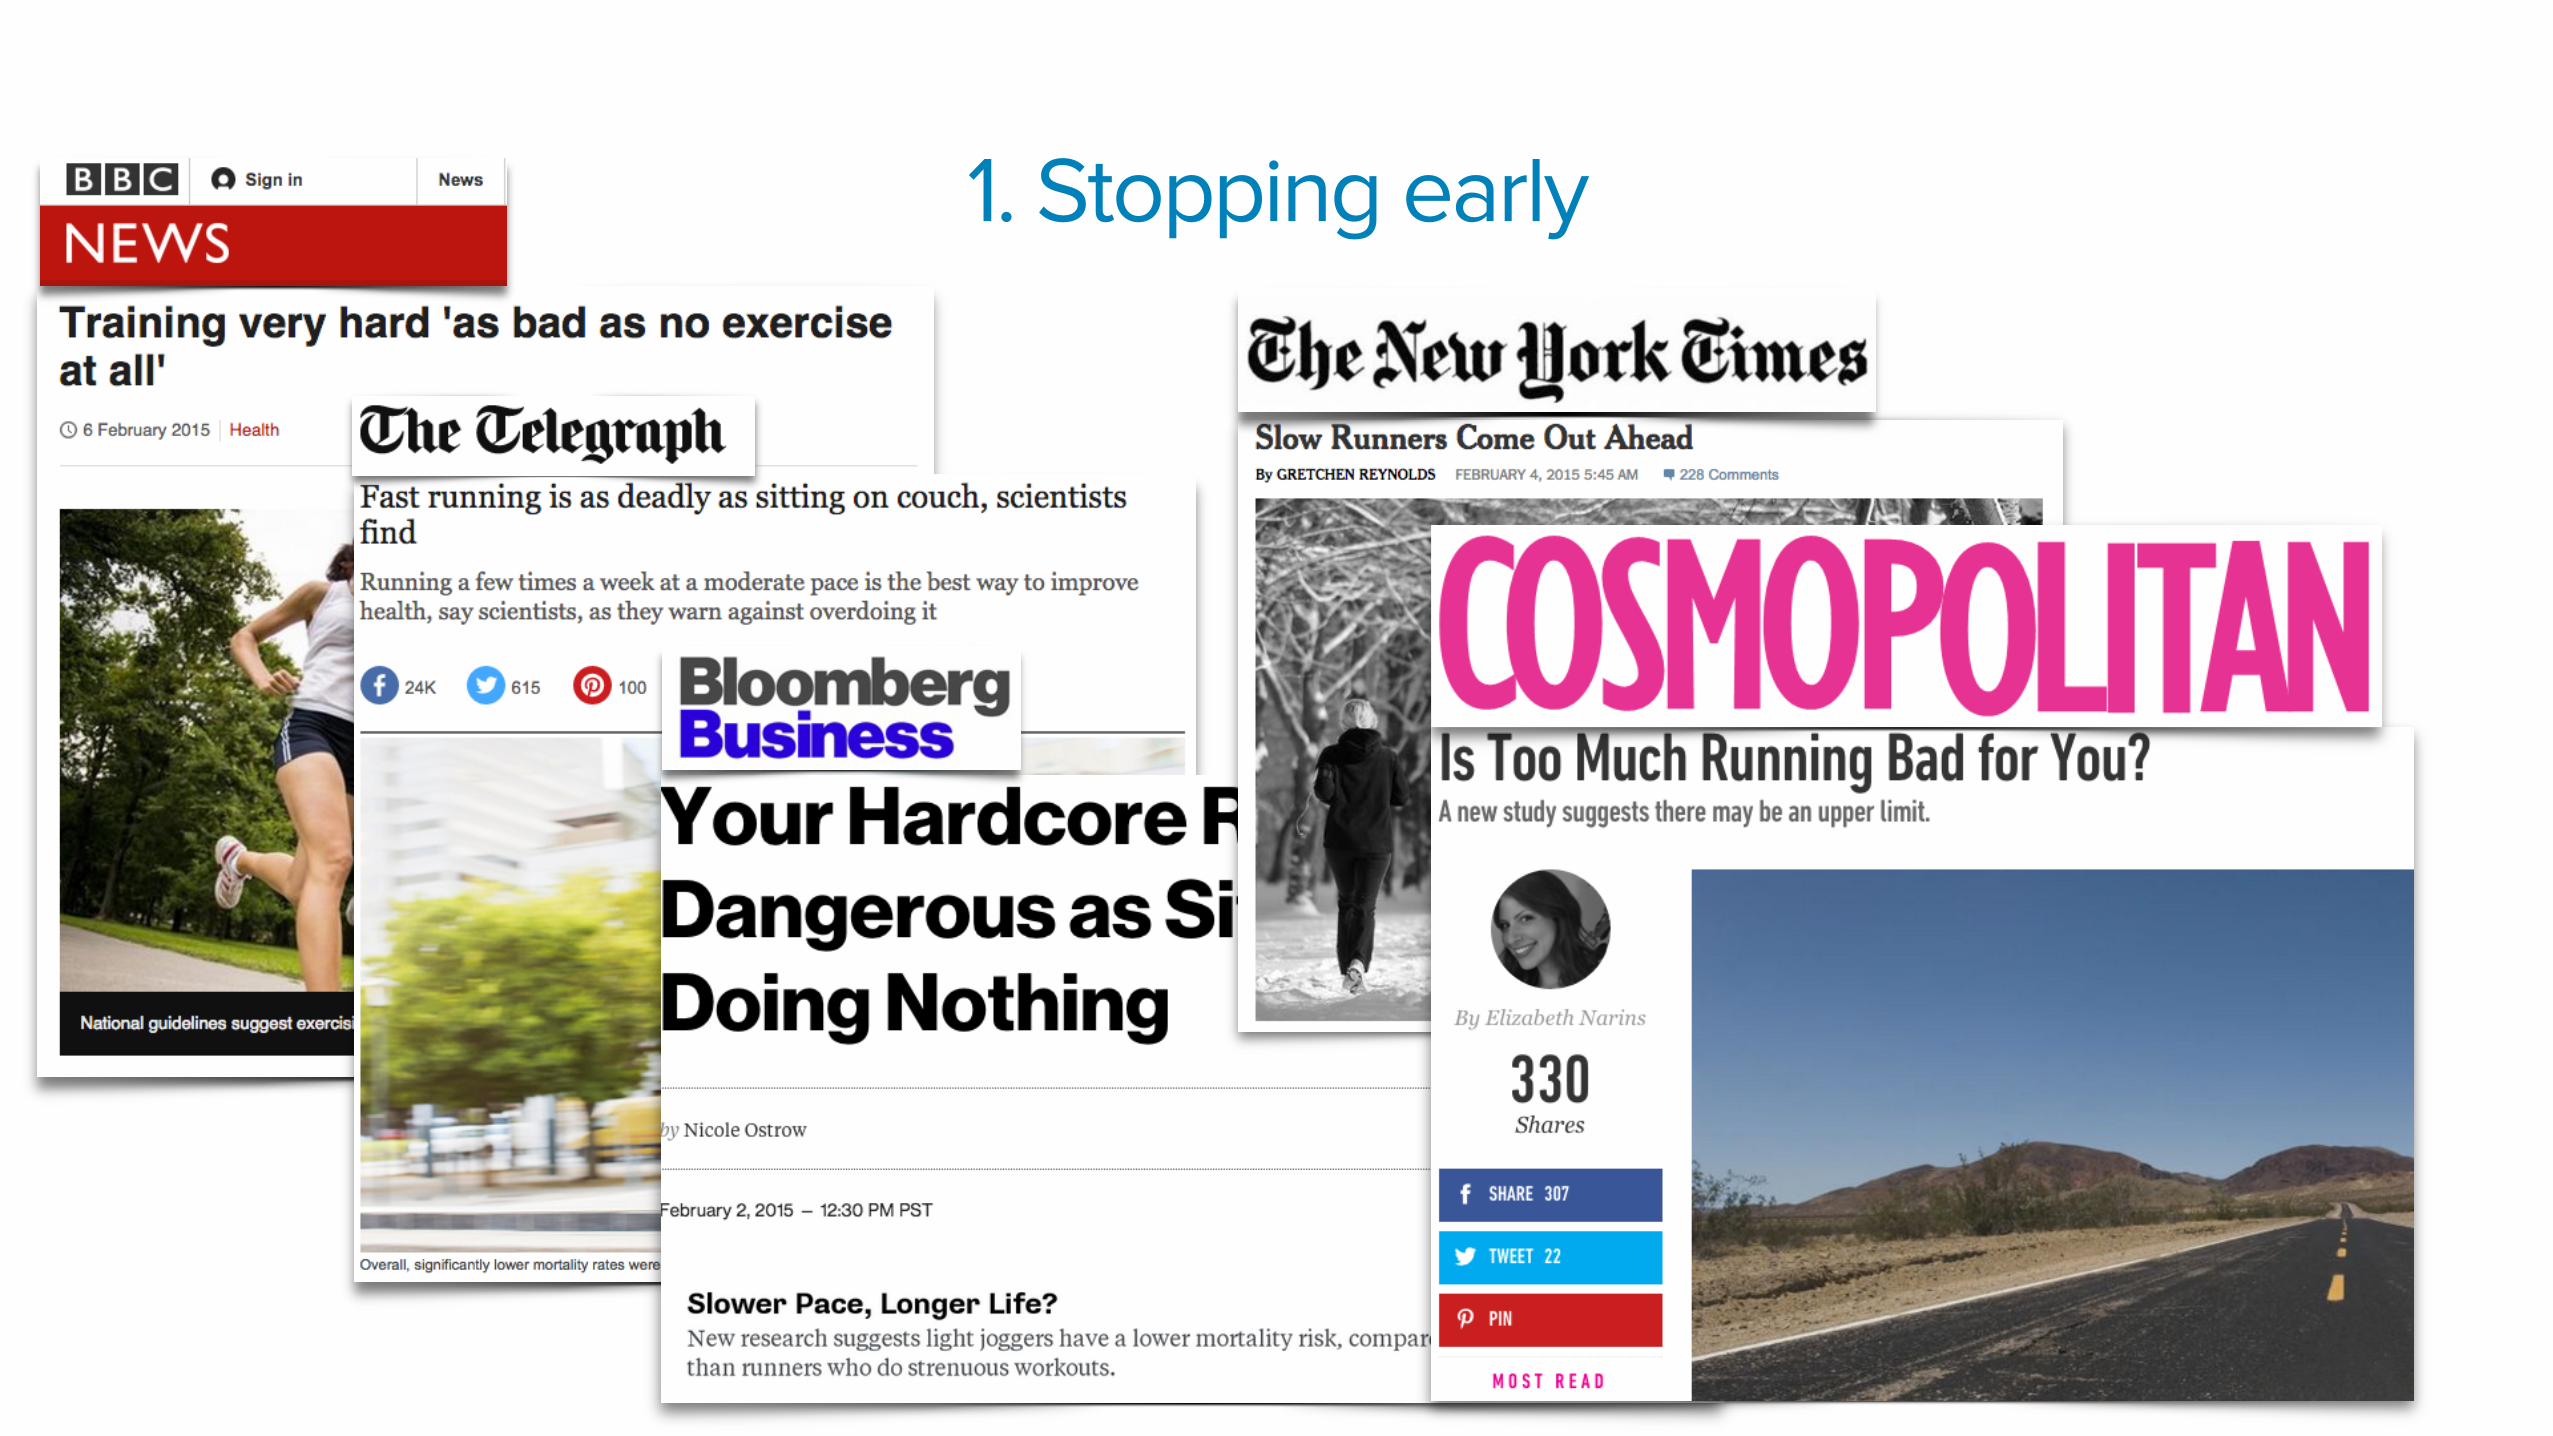
1. Stopping early

Sedentary:Light:Moderate: Strenuous:
128 / 4137 / 5768 / 262
2 / 40
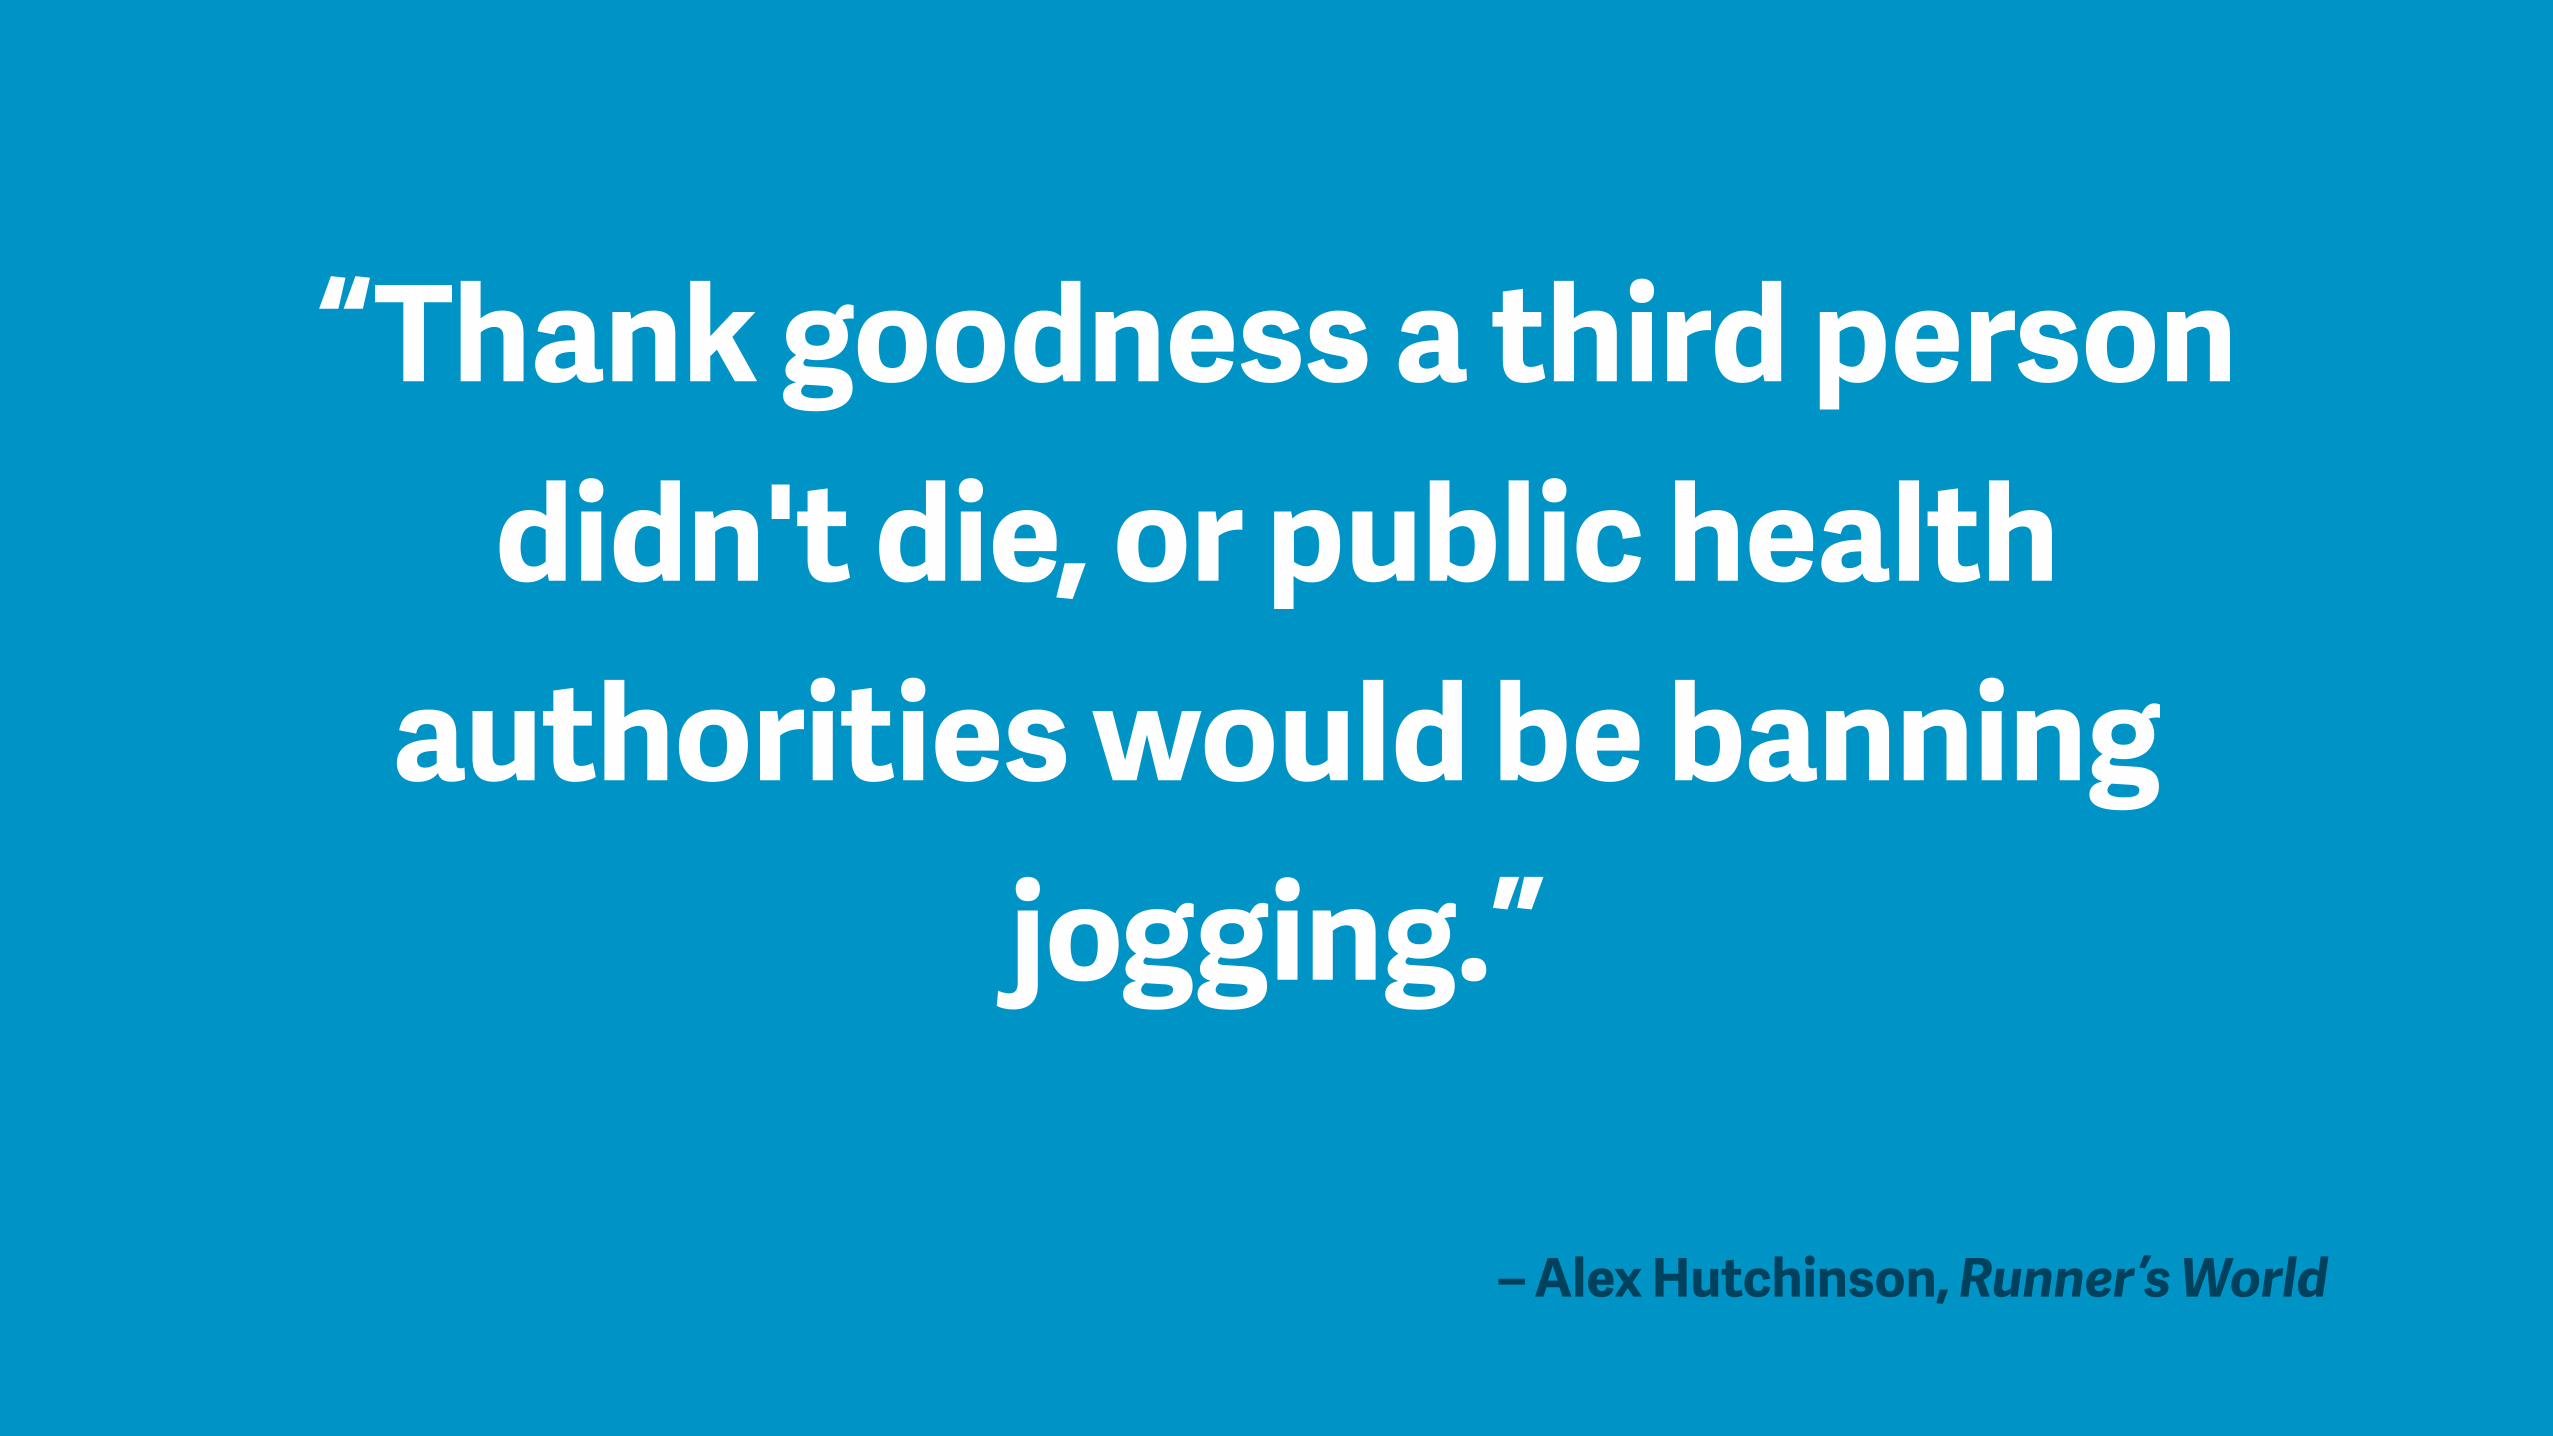
“Thank goodness a third person didn't die, or public health
authorities would be banning jogging.”
– Alex Hutchinson, Runner’s World
1. Stopping early
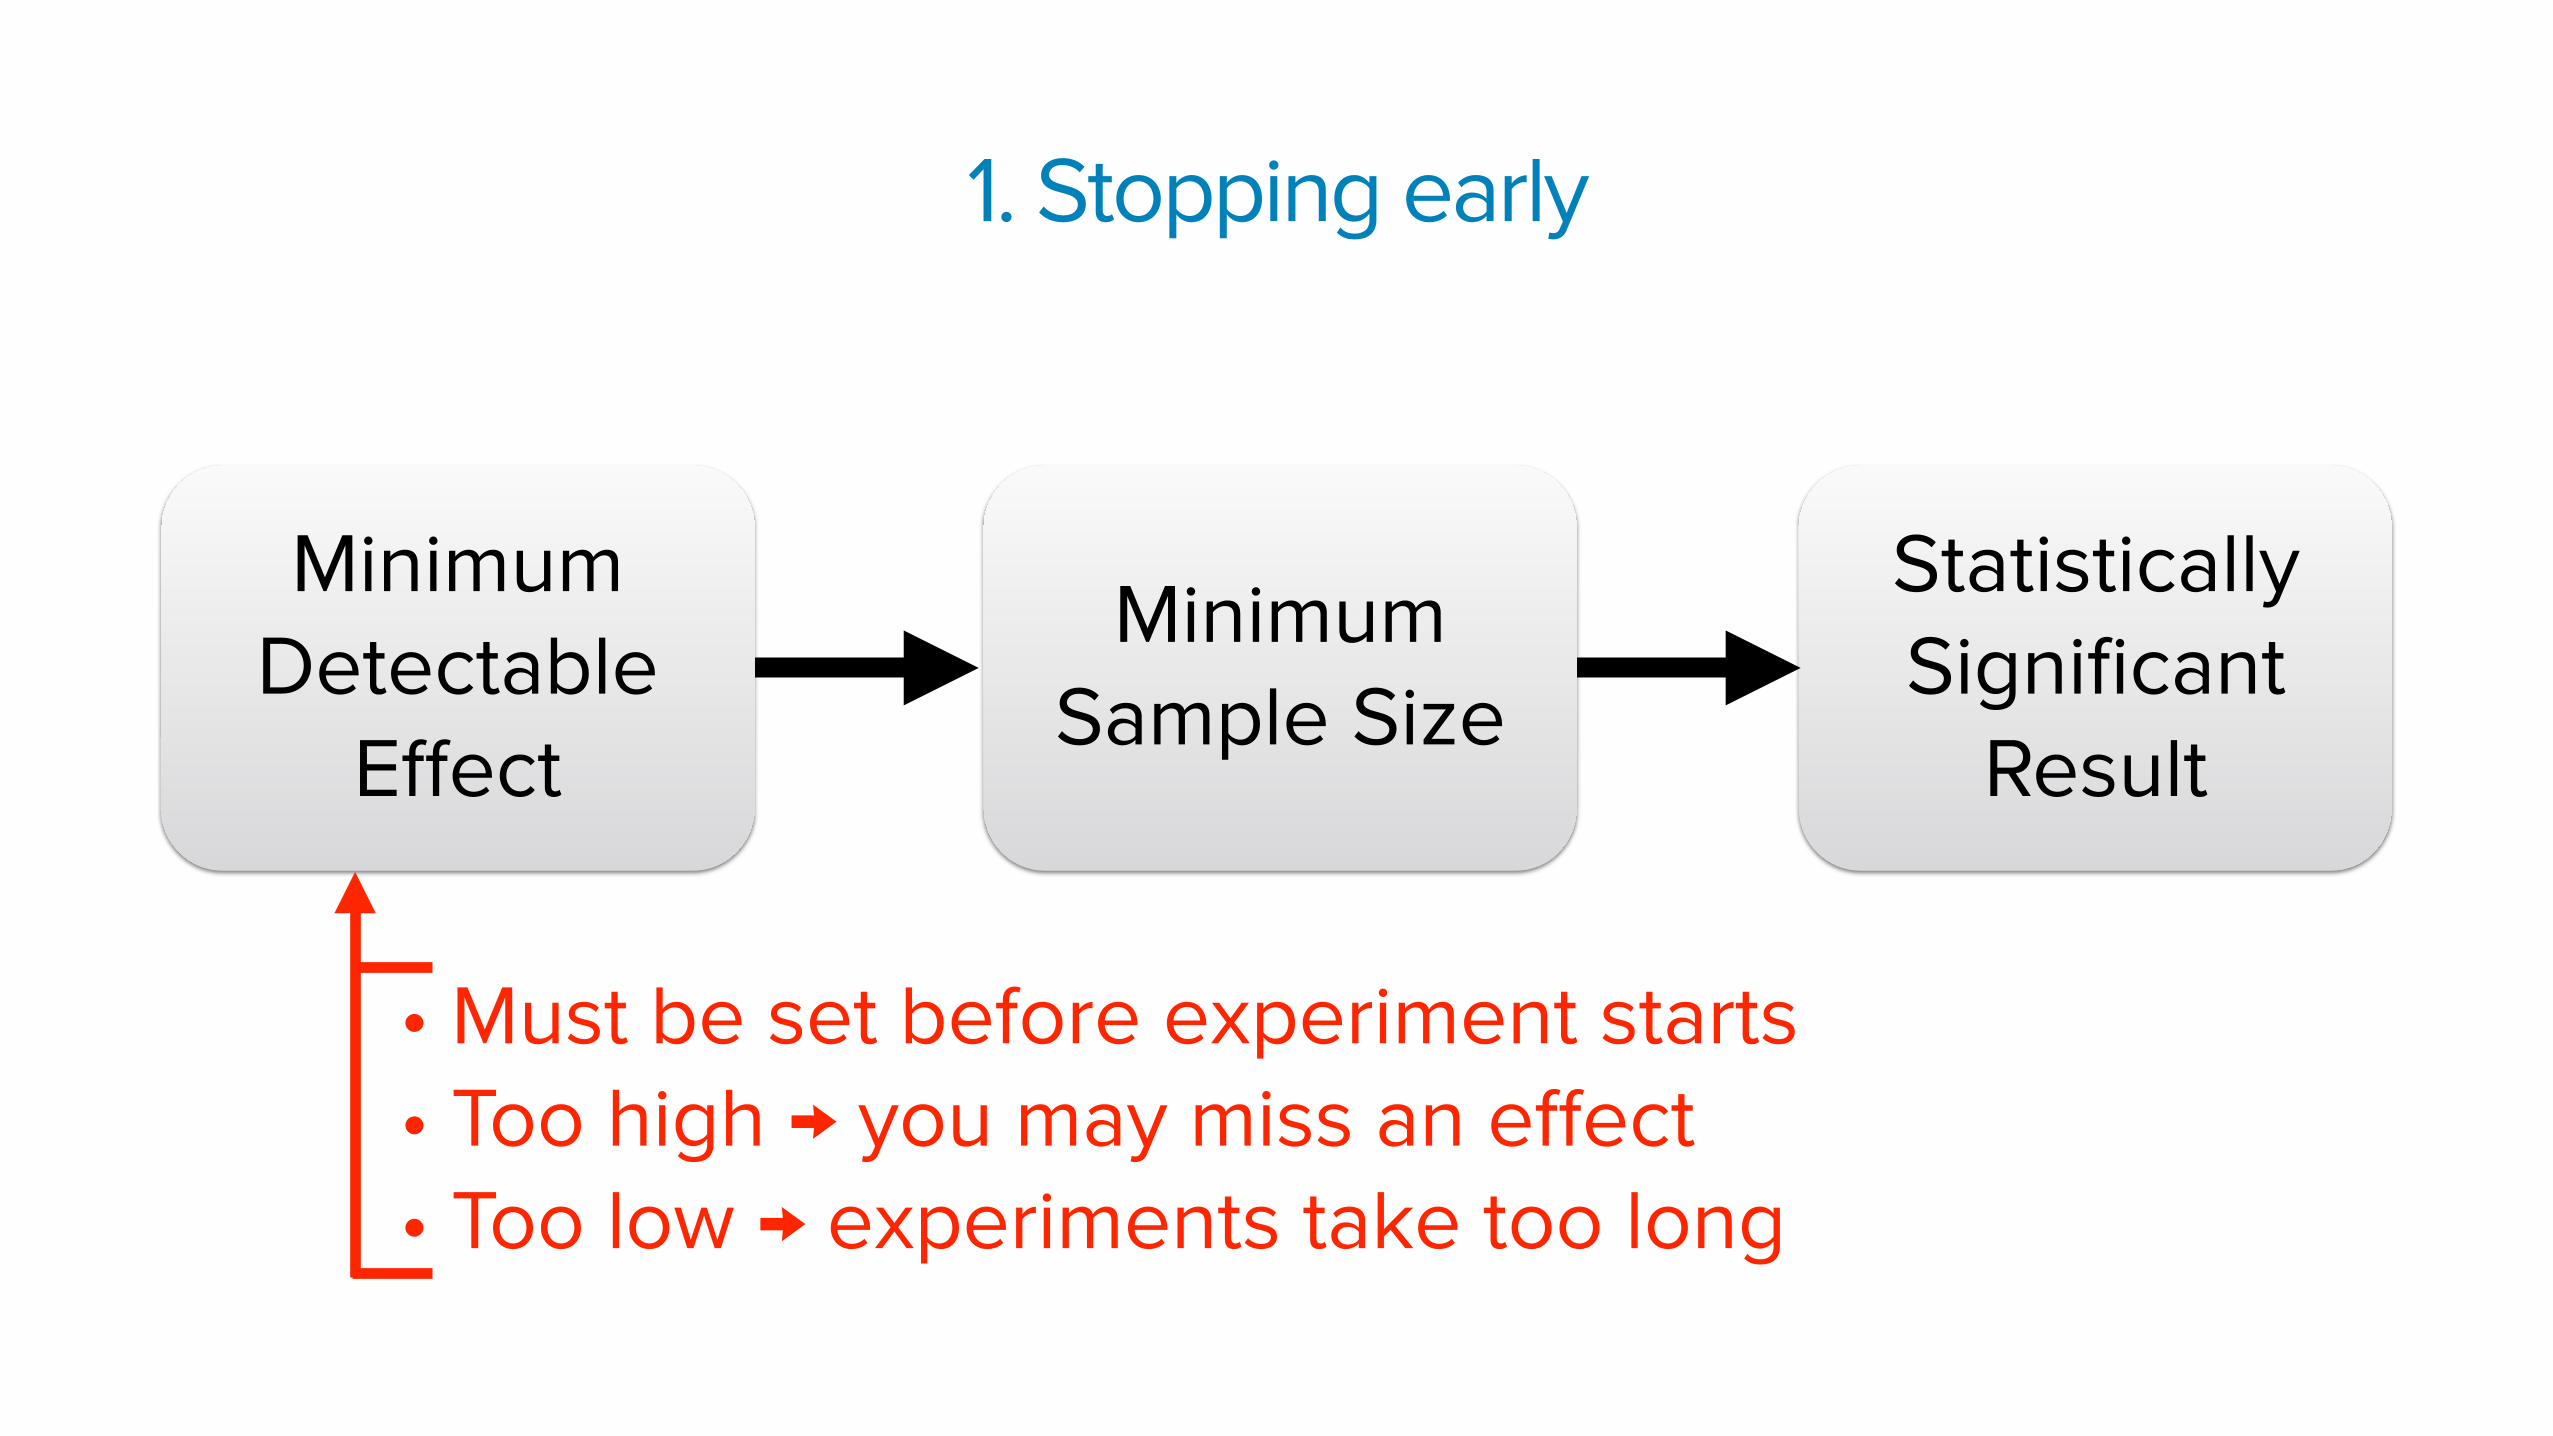
Statistically Significant
Result
Minimum Sample Size
Minimum Detectable
Effect
• Must be set before experiment starts • Too high → you may miss an effect • Too low → experiments take too long
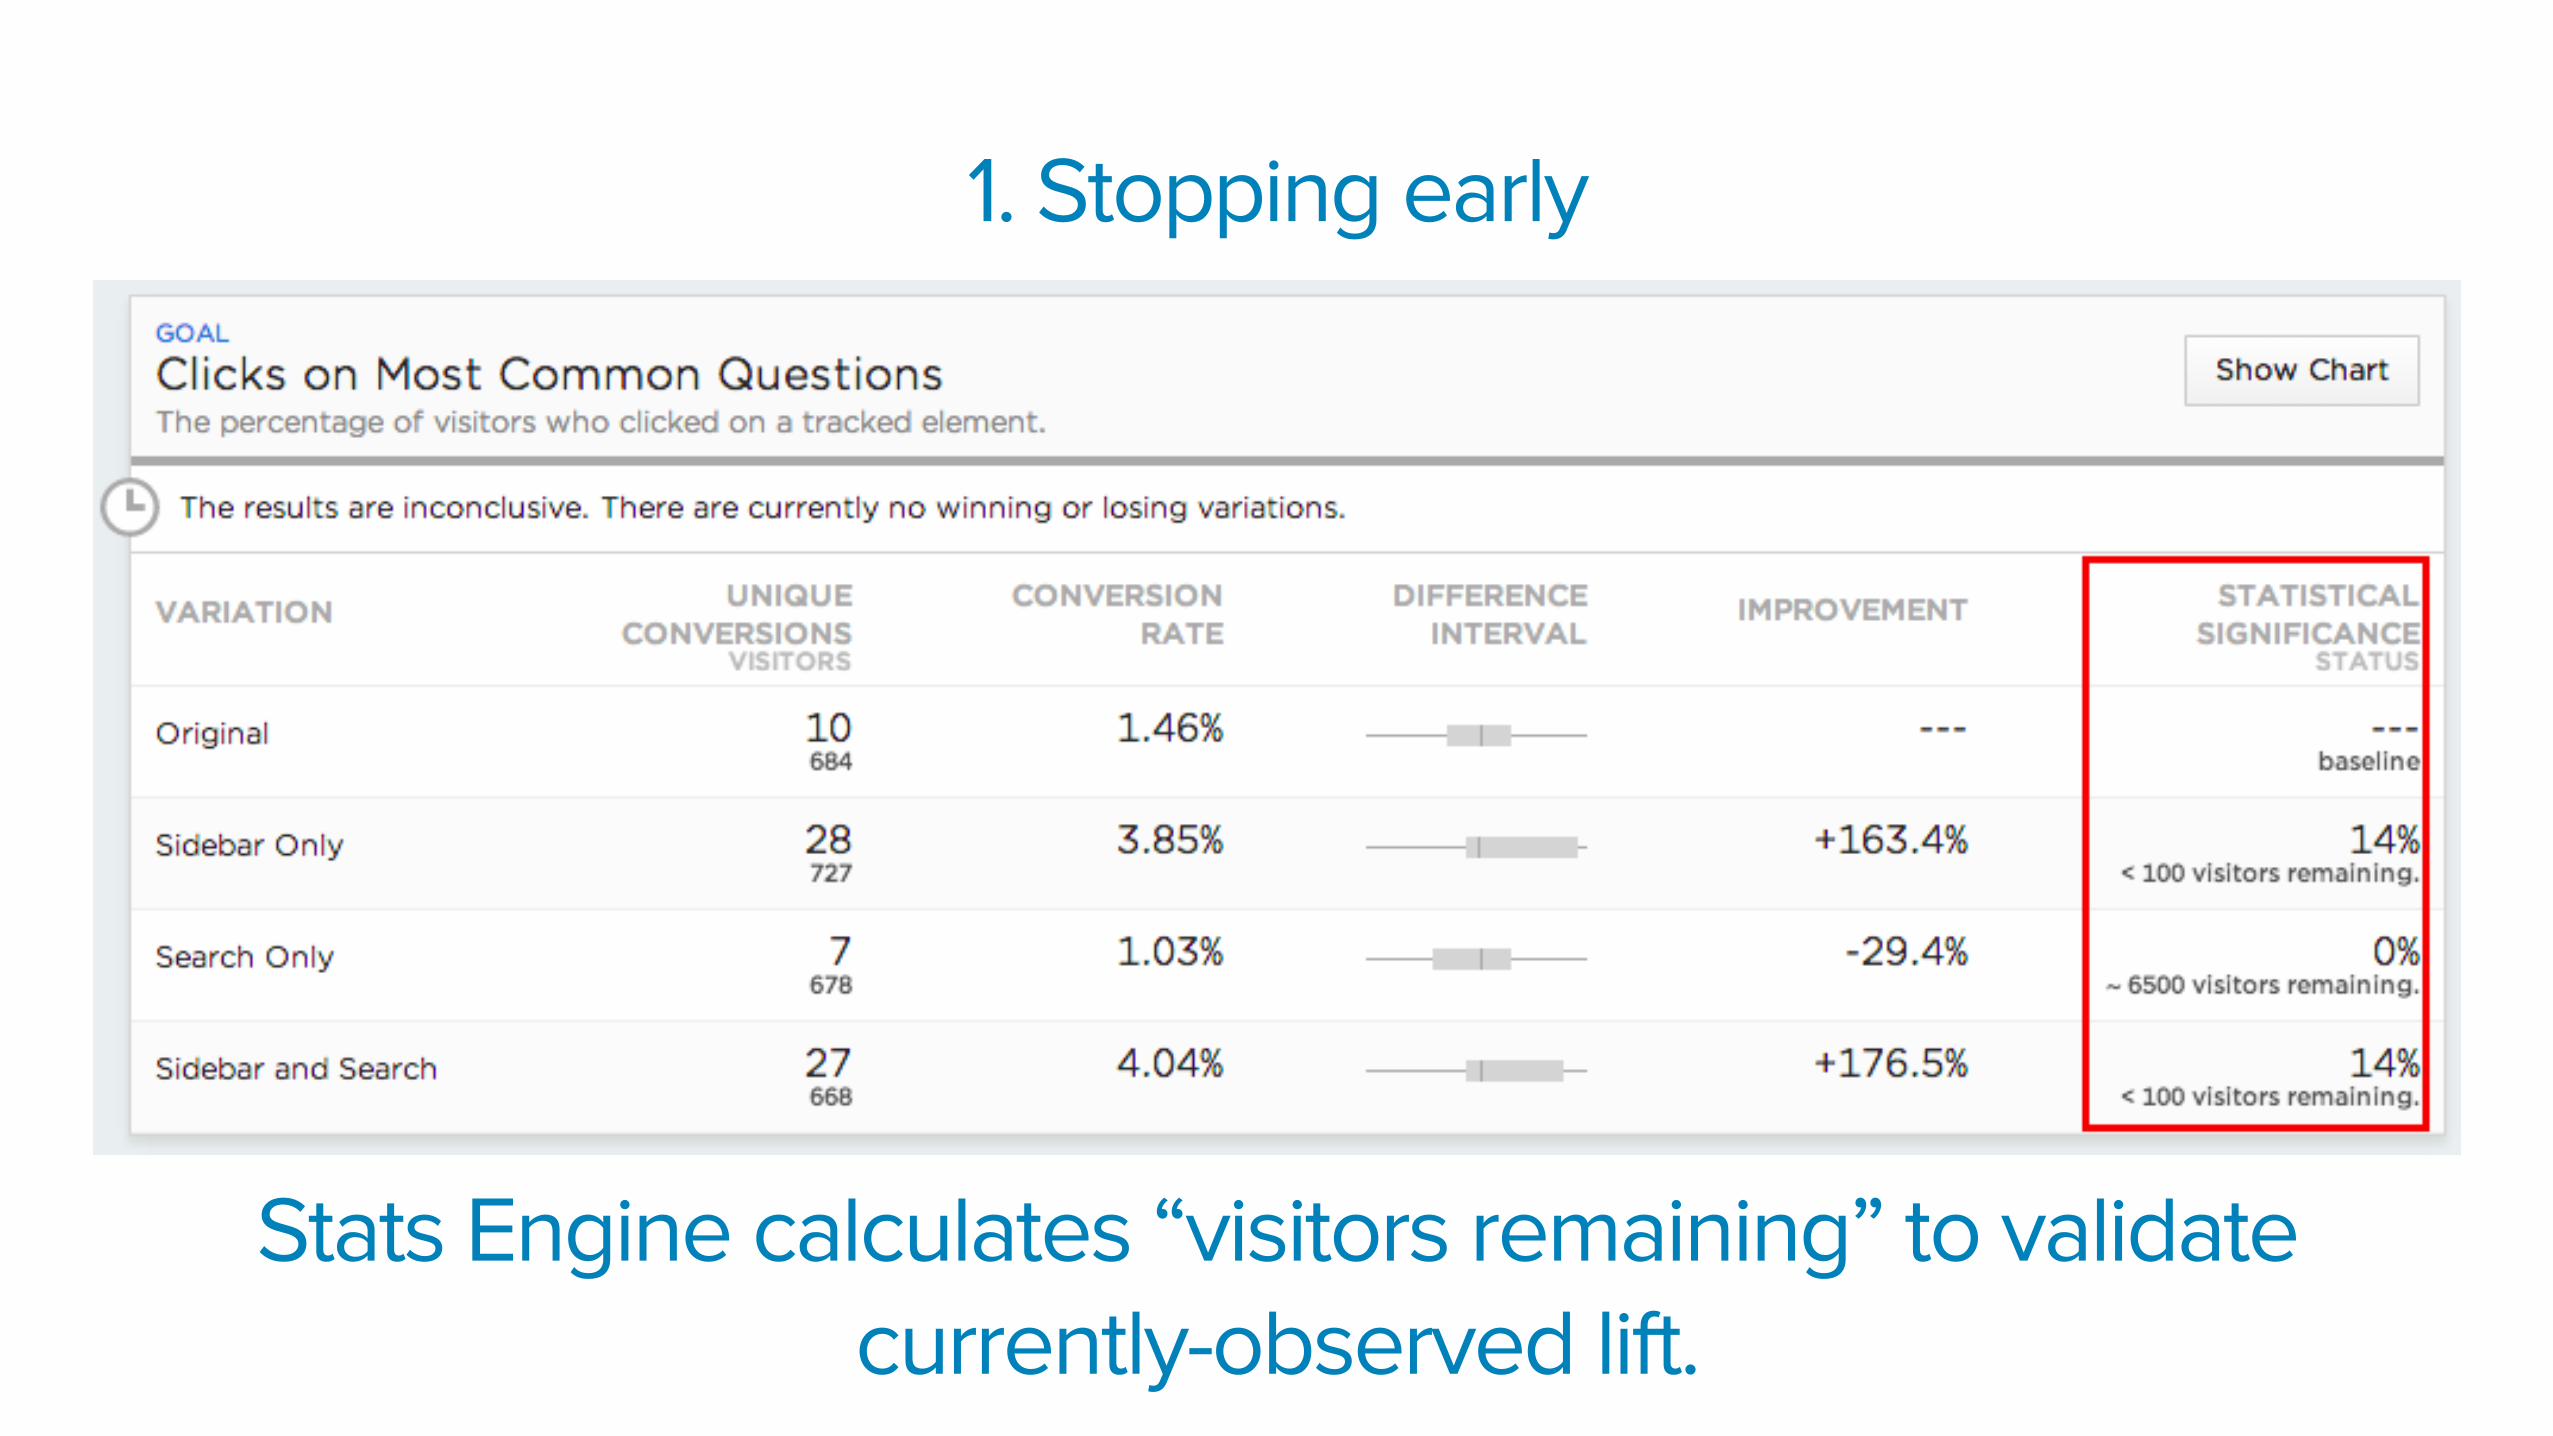
1. Stopping early
Stats Engine calculates “visitors remaining” to validate currently-observed lift.
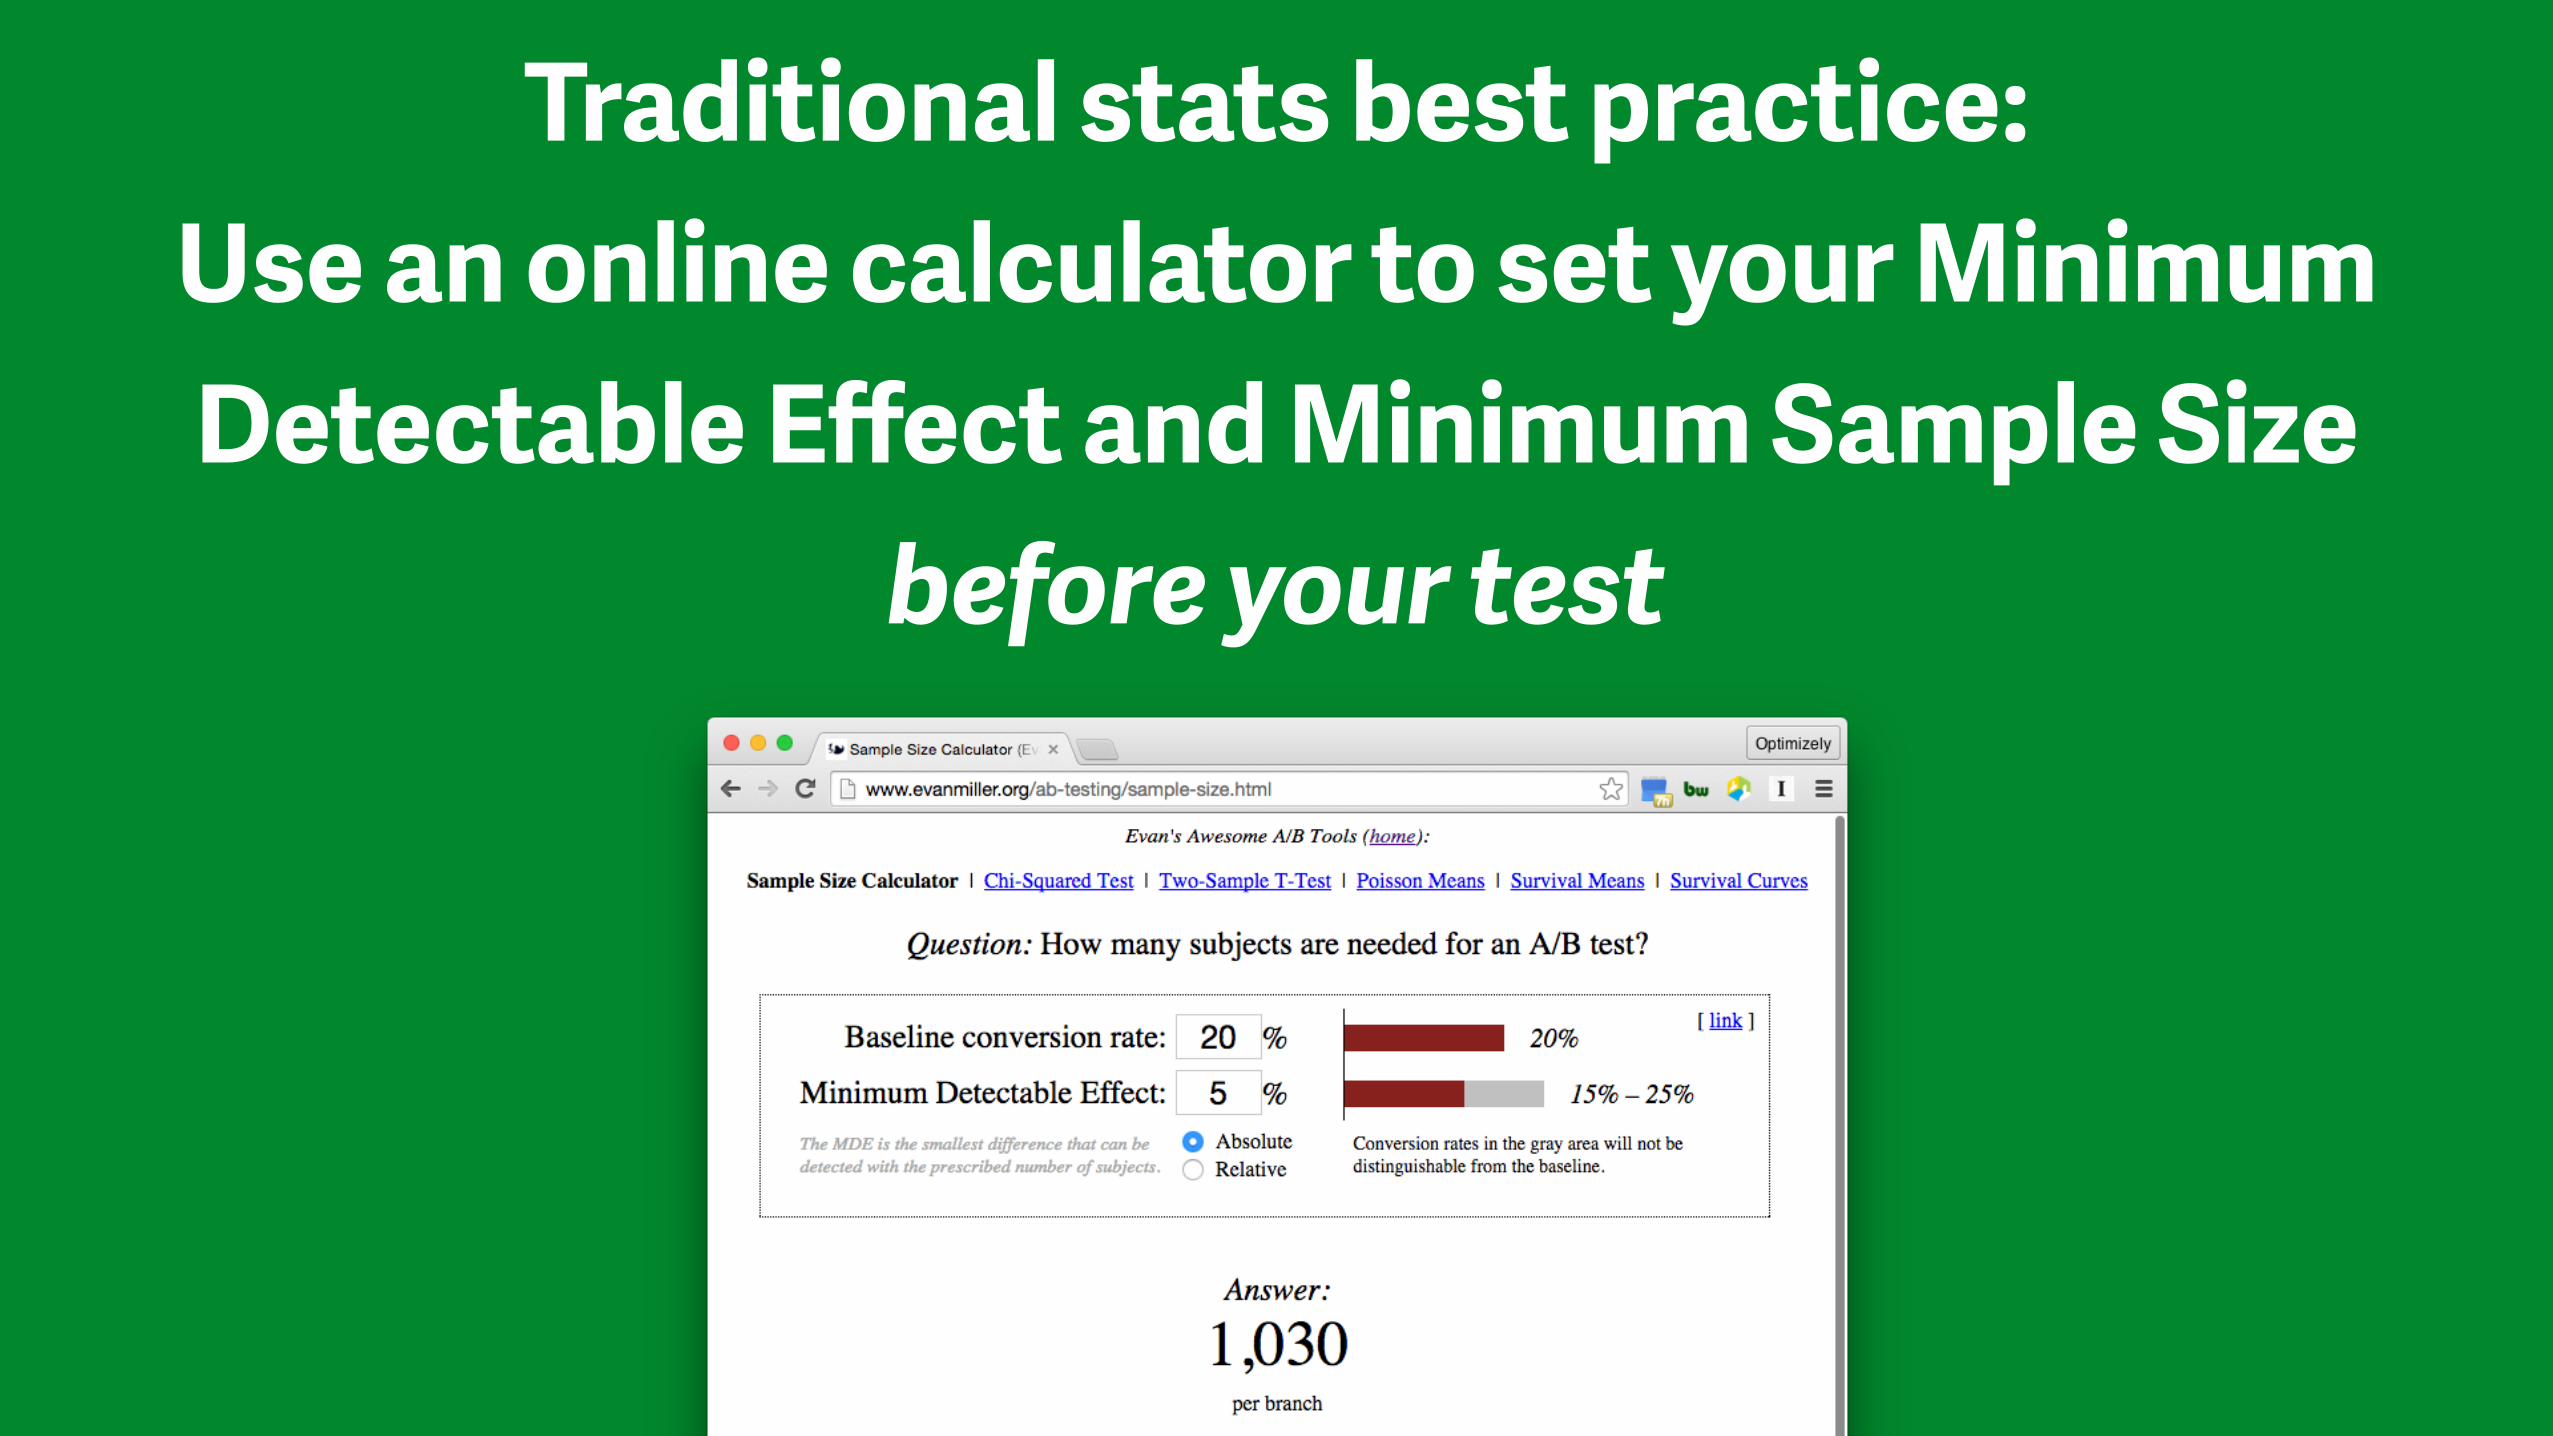
Traditional stats best practice: Use an online calculator to set your Minimum Detectable Effect and Minimum Sample Size
before your test
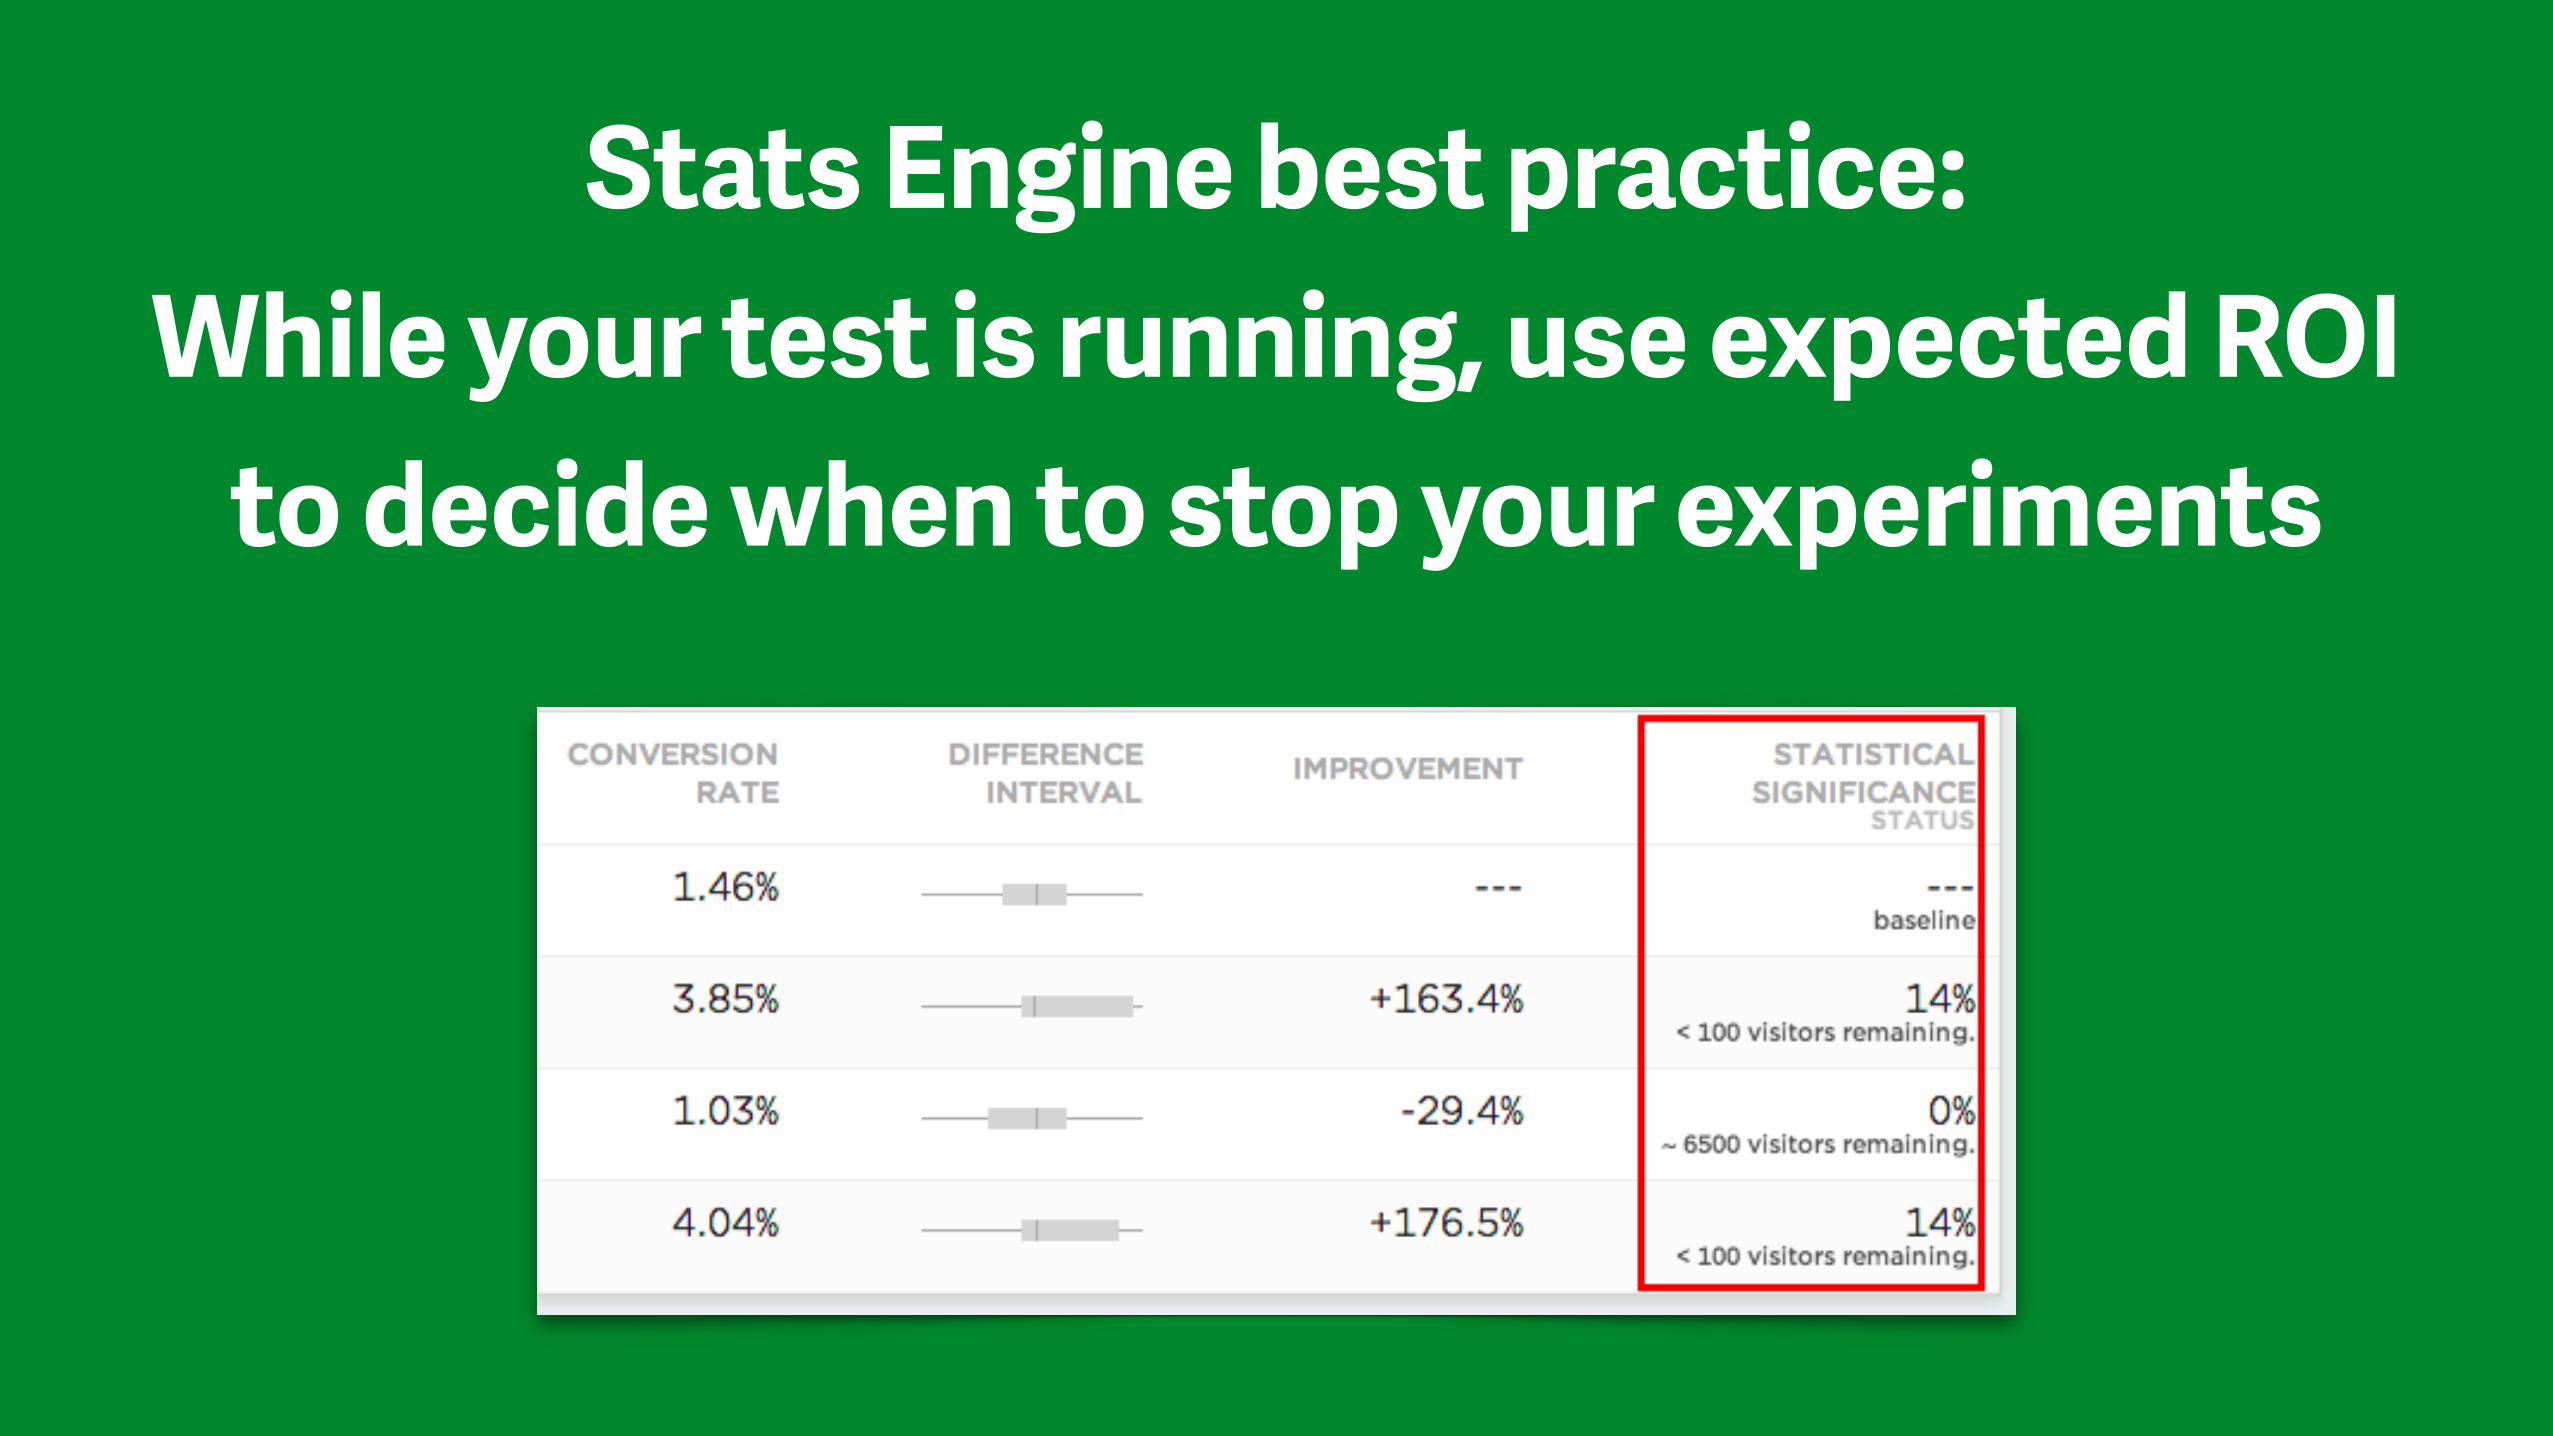
Stats Engine best practice: While your test is running, use expected ROI
to decide when to stop your experiments

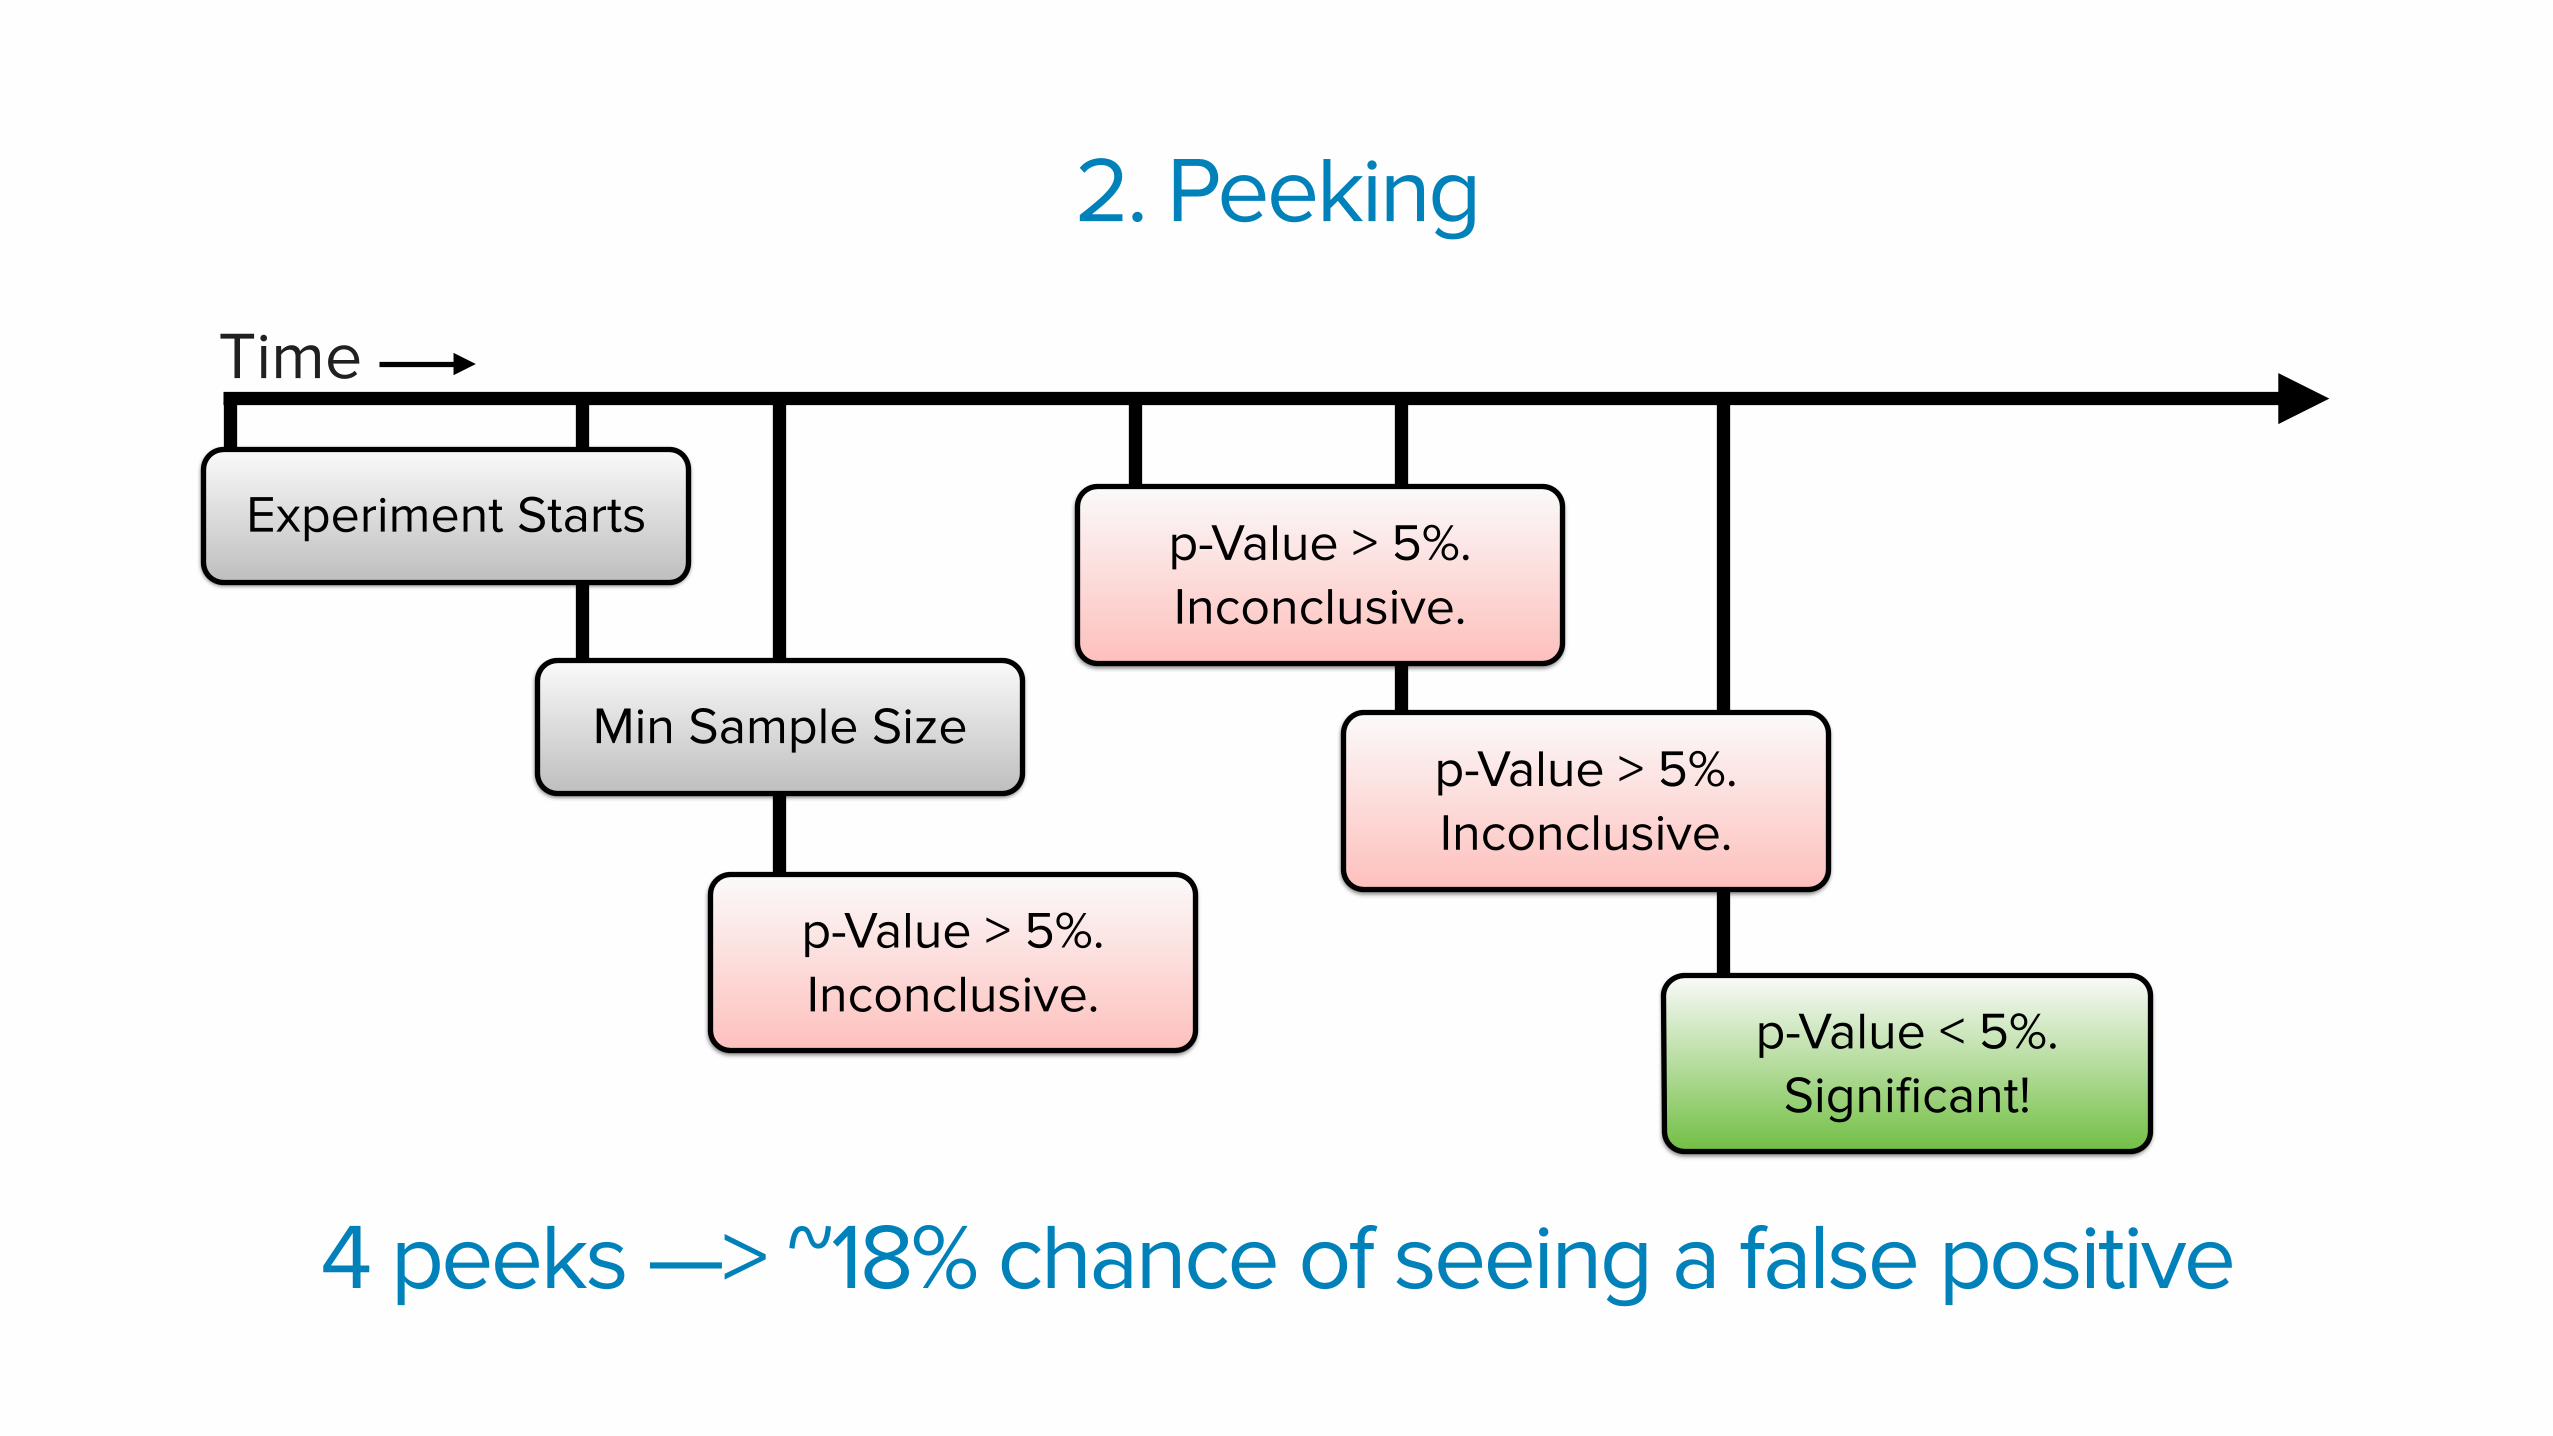
2. Peeking
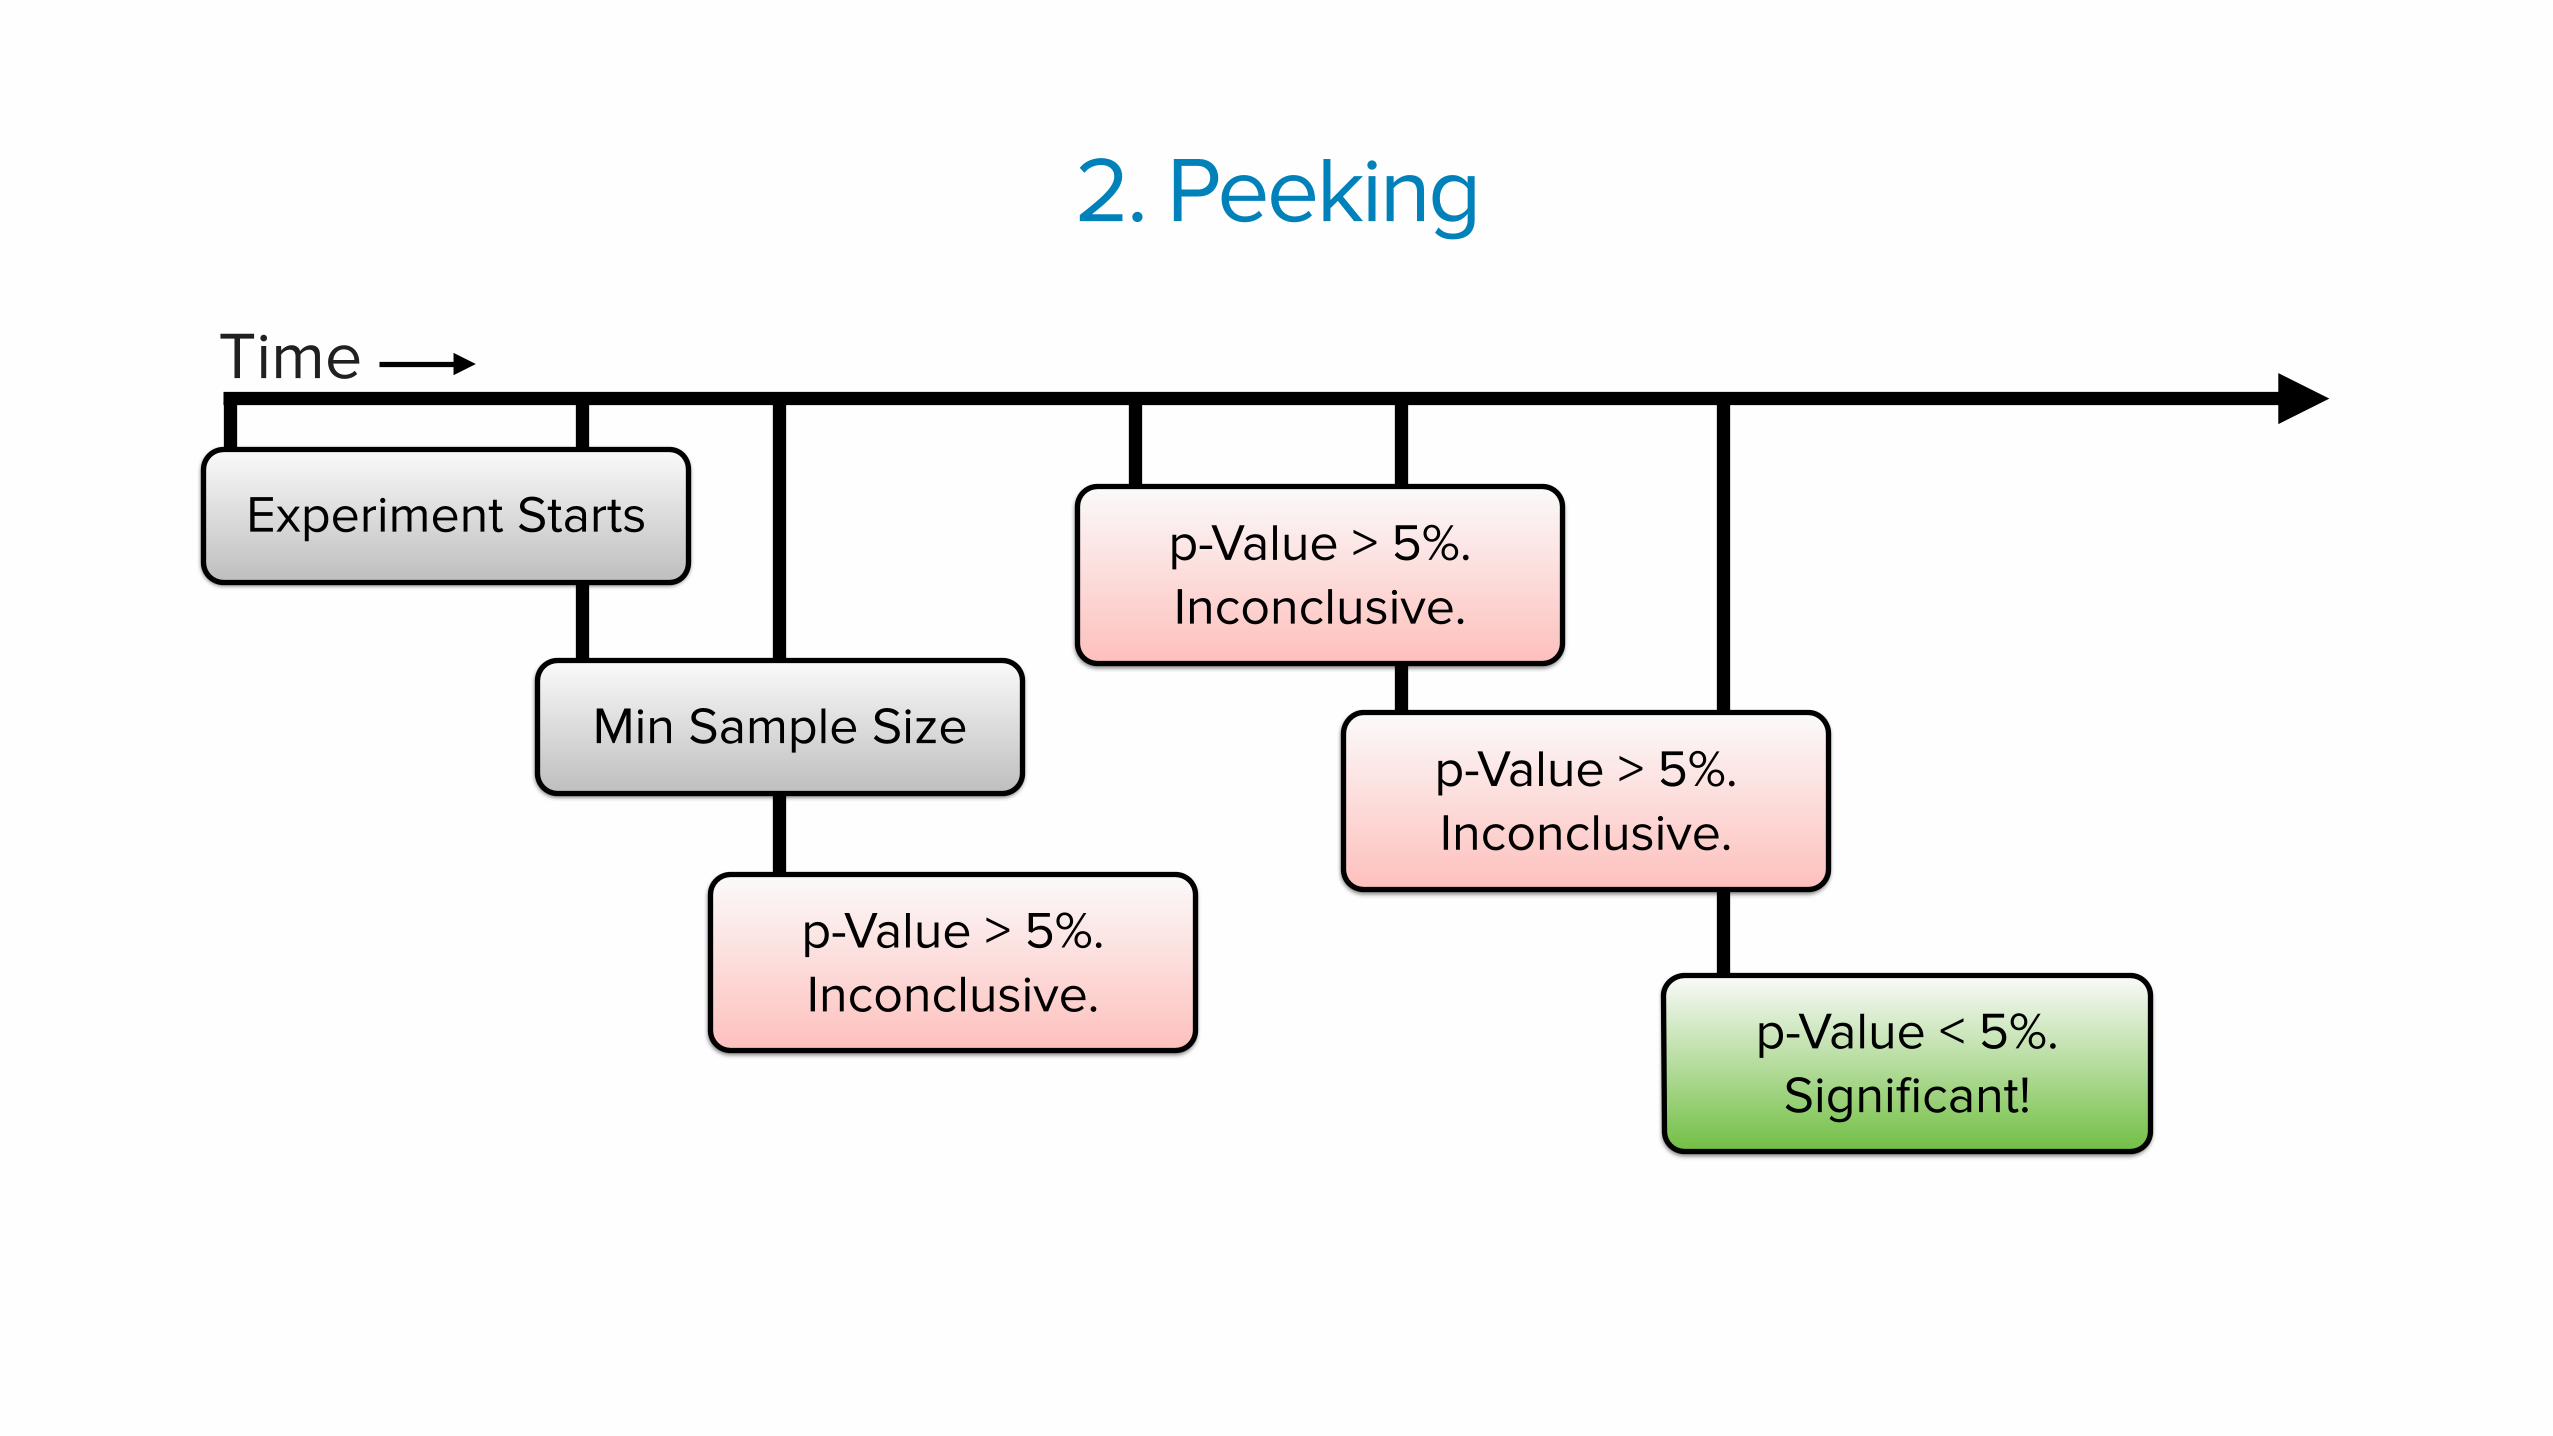
p-Value < 5%. Significant!
p-Value > 5%. Inconclusive.
p-Value > 5%. Inconclusive.
Min Sample Size
2. Peeking
Time
Experiment Starts p-Value > 5%. Inconclusive.
Why is this a problem?
There is a ~5% chance of false positive each time you peek.
p-Value < 5%. Significant!
p-Value > 5%. Inconclusive.
p-Value > 5%. Inconclusive.
Min Sample Size
2. Peeking
Time
Experiment Starts p-Value > 5%. Inconclusive.
4 peeks —> ~18% chance of seeing a false positive
The “T-test” (a.k.a. “NHST”, a.k.a. “Student T-test” )
The T-test in a nutshell
1. Run your experiment until you have reached the required sample size, and then stop.
2. Ask “What are the chances I’d have gotten these results in an A/A test?” (p-value)
3. If p-value < 5%, your results are significant.

p-Value < 5%. Significant!
p-Value > 5%. Inconclusive.
p-Value > 5%. Inconclusive.
Min Sample Size
2. Peeking
Time
Experiment Starts p-Value > 5%. Inconclusive.
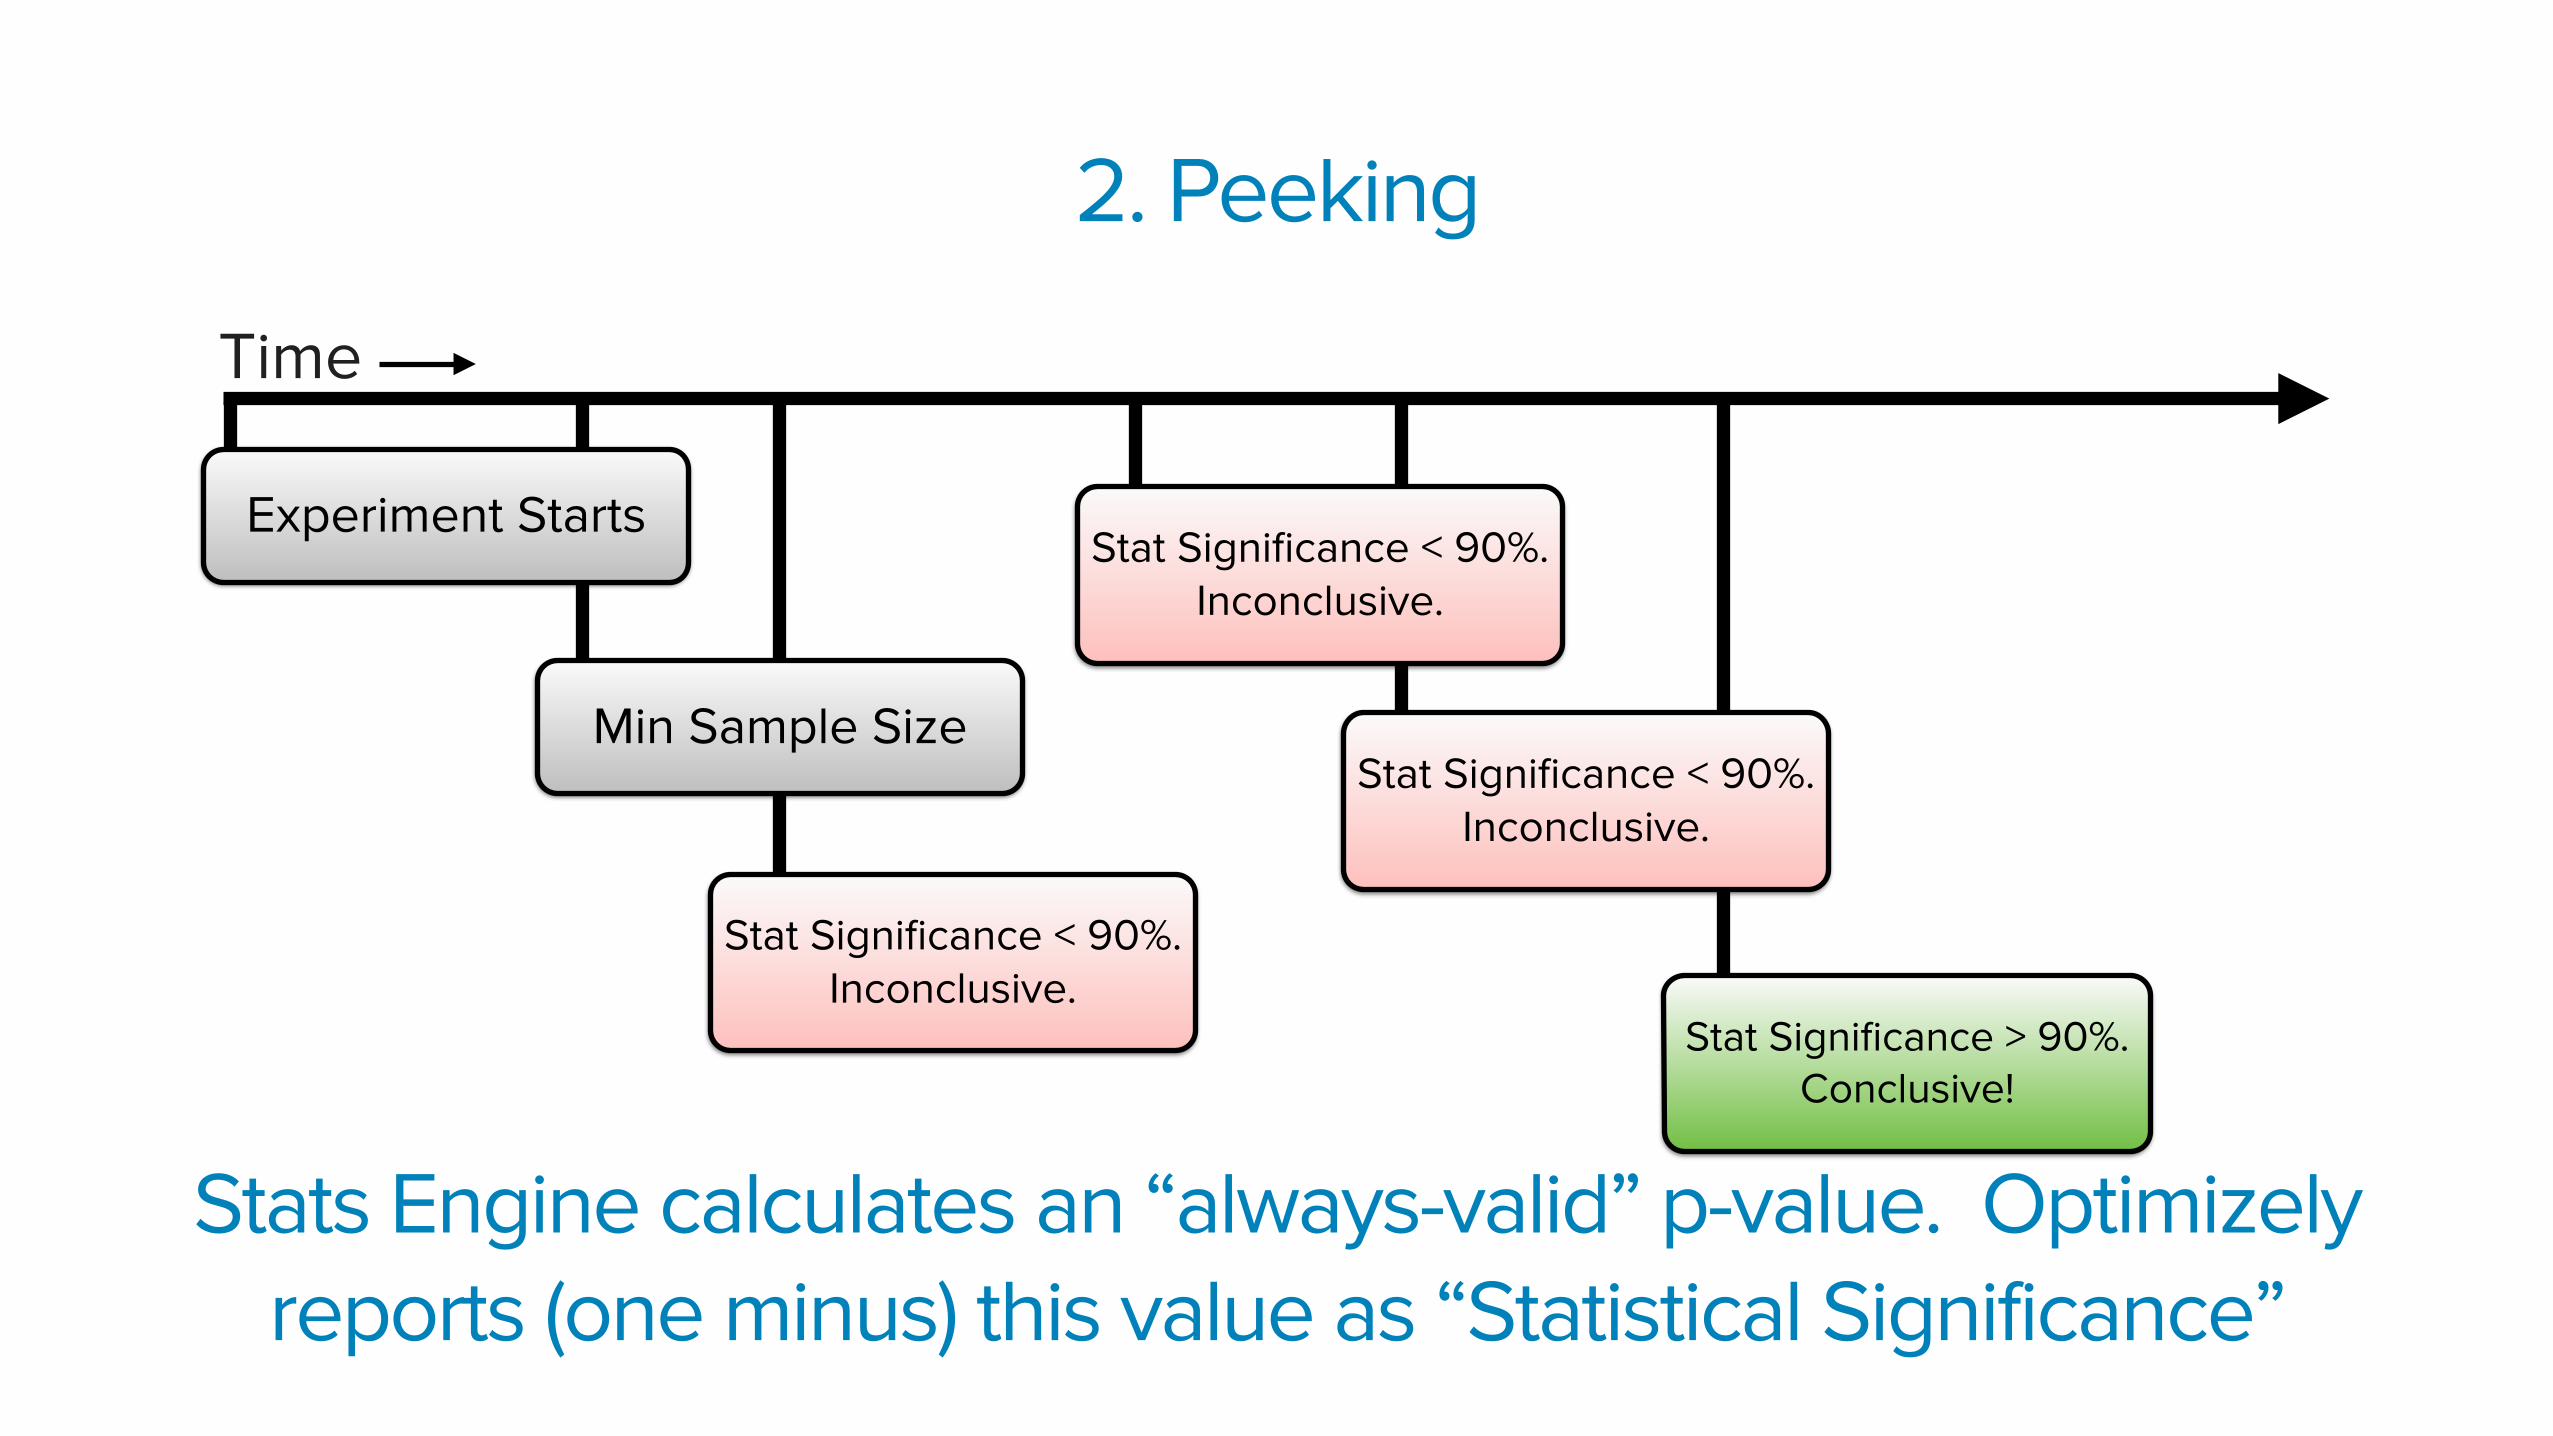
Stats Engine calculates an “always-valid” p-value. Optimizely reports (one minus) this value as “Statistical Significance”
Stat Significance > 90%. Conclusive!
Stat Significance < 90%. Inconclusive.
Stat Significance < 90%. Inconclusive.
Min Sample Size
2. Peeking
Time
Experiment StartsStat Significance < 90%.
Inconclusive.
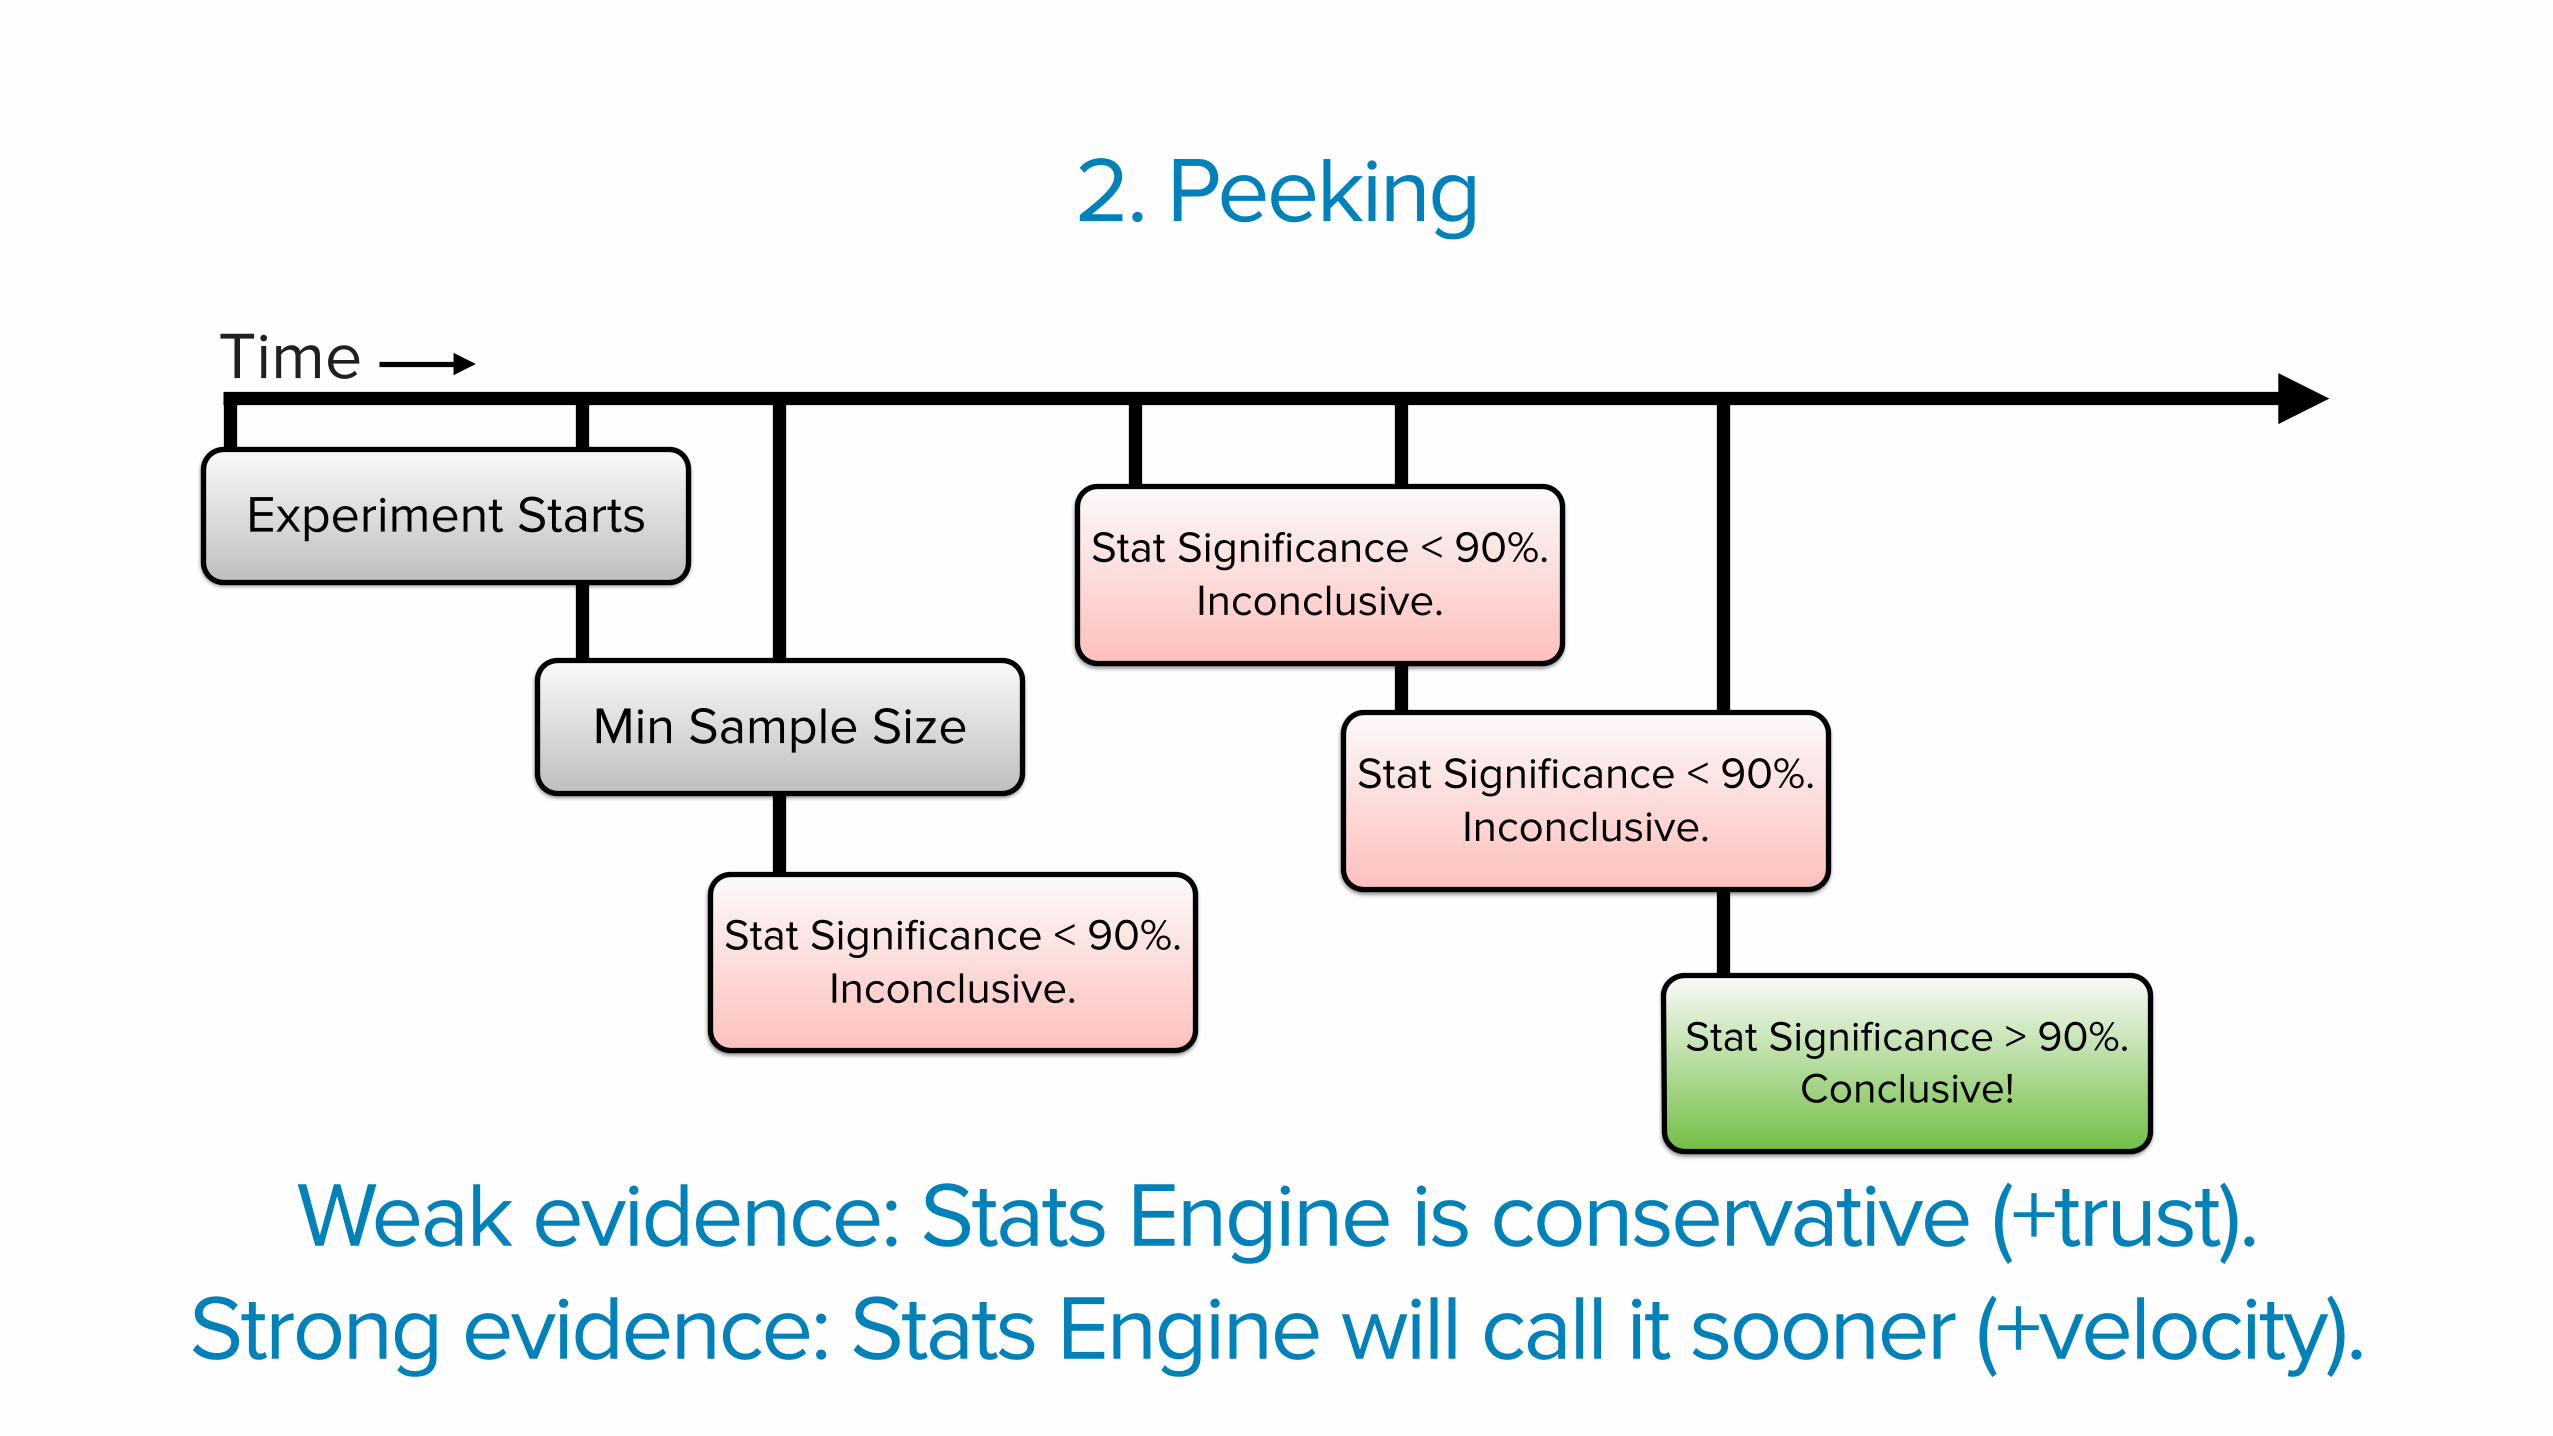
Weak evidence: Stats Engine is conservative (+trust). Strong evidence: Stats Engine will call it sooner (+velocity).
Traditional stats best practice:
Wait until you reach your minimum sample size, and then stop your
test when you look at results
Stats Engine best practice: Peek all you want!
3. Mistaking “False Positive Rate” for “False Discovery Rate”
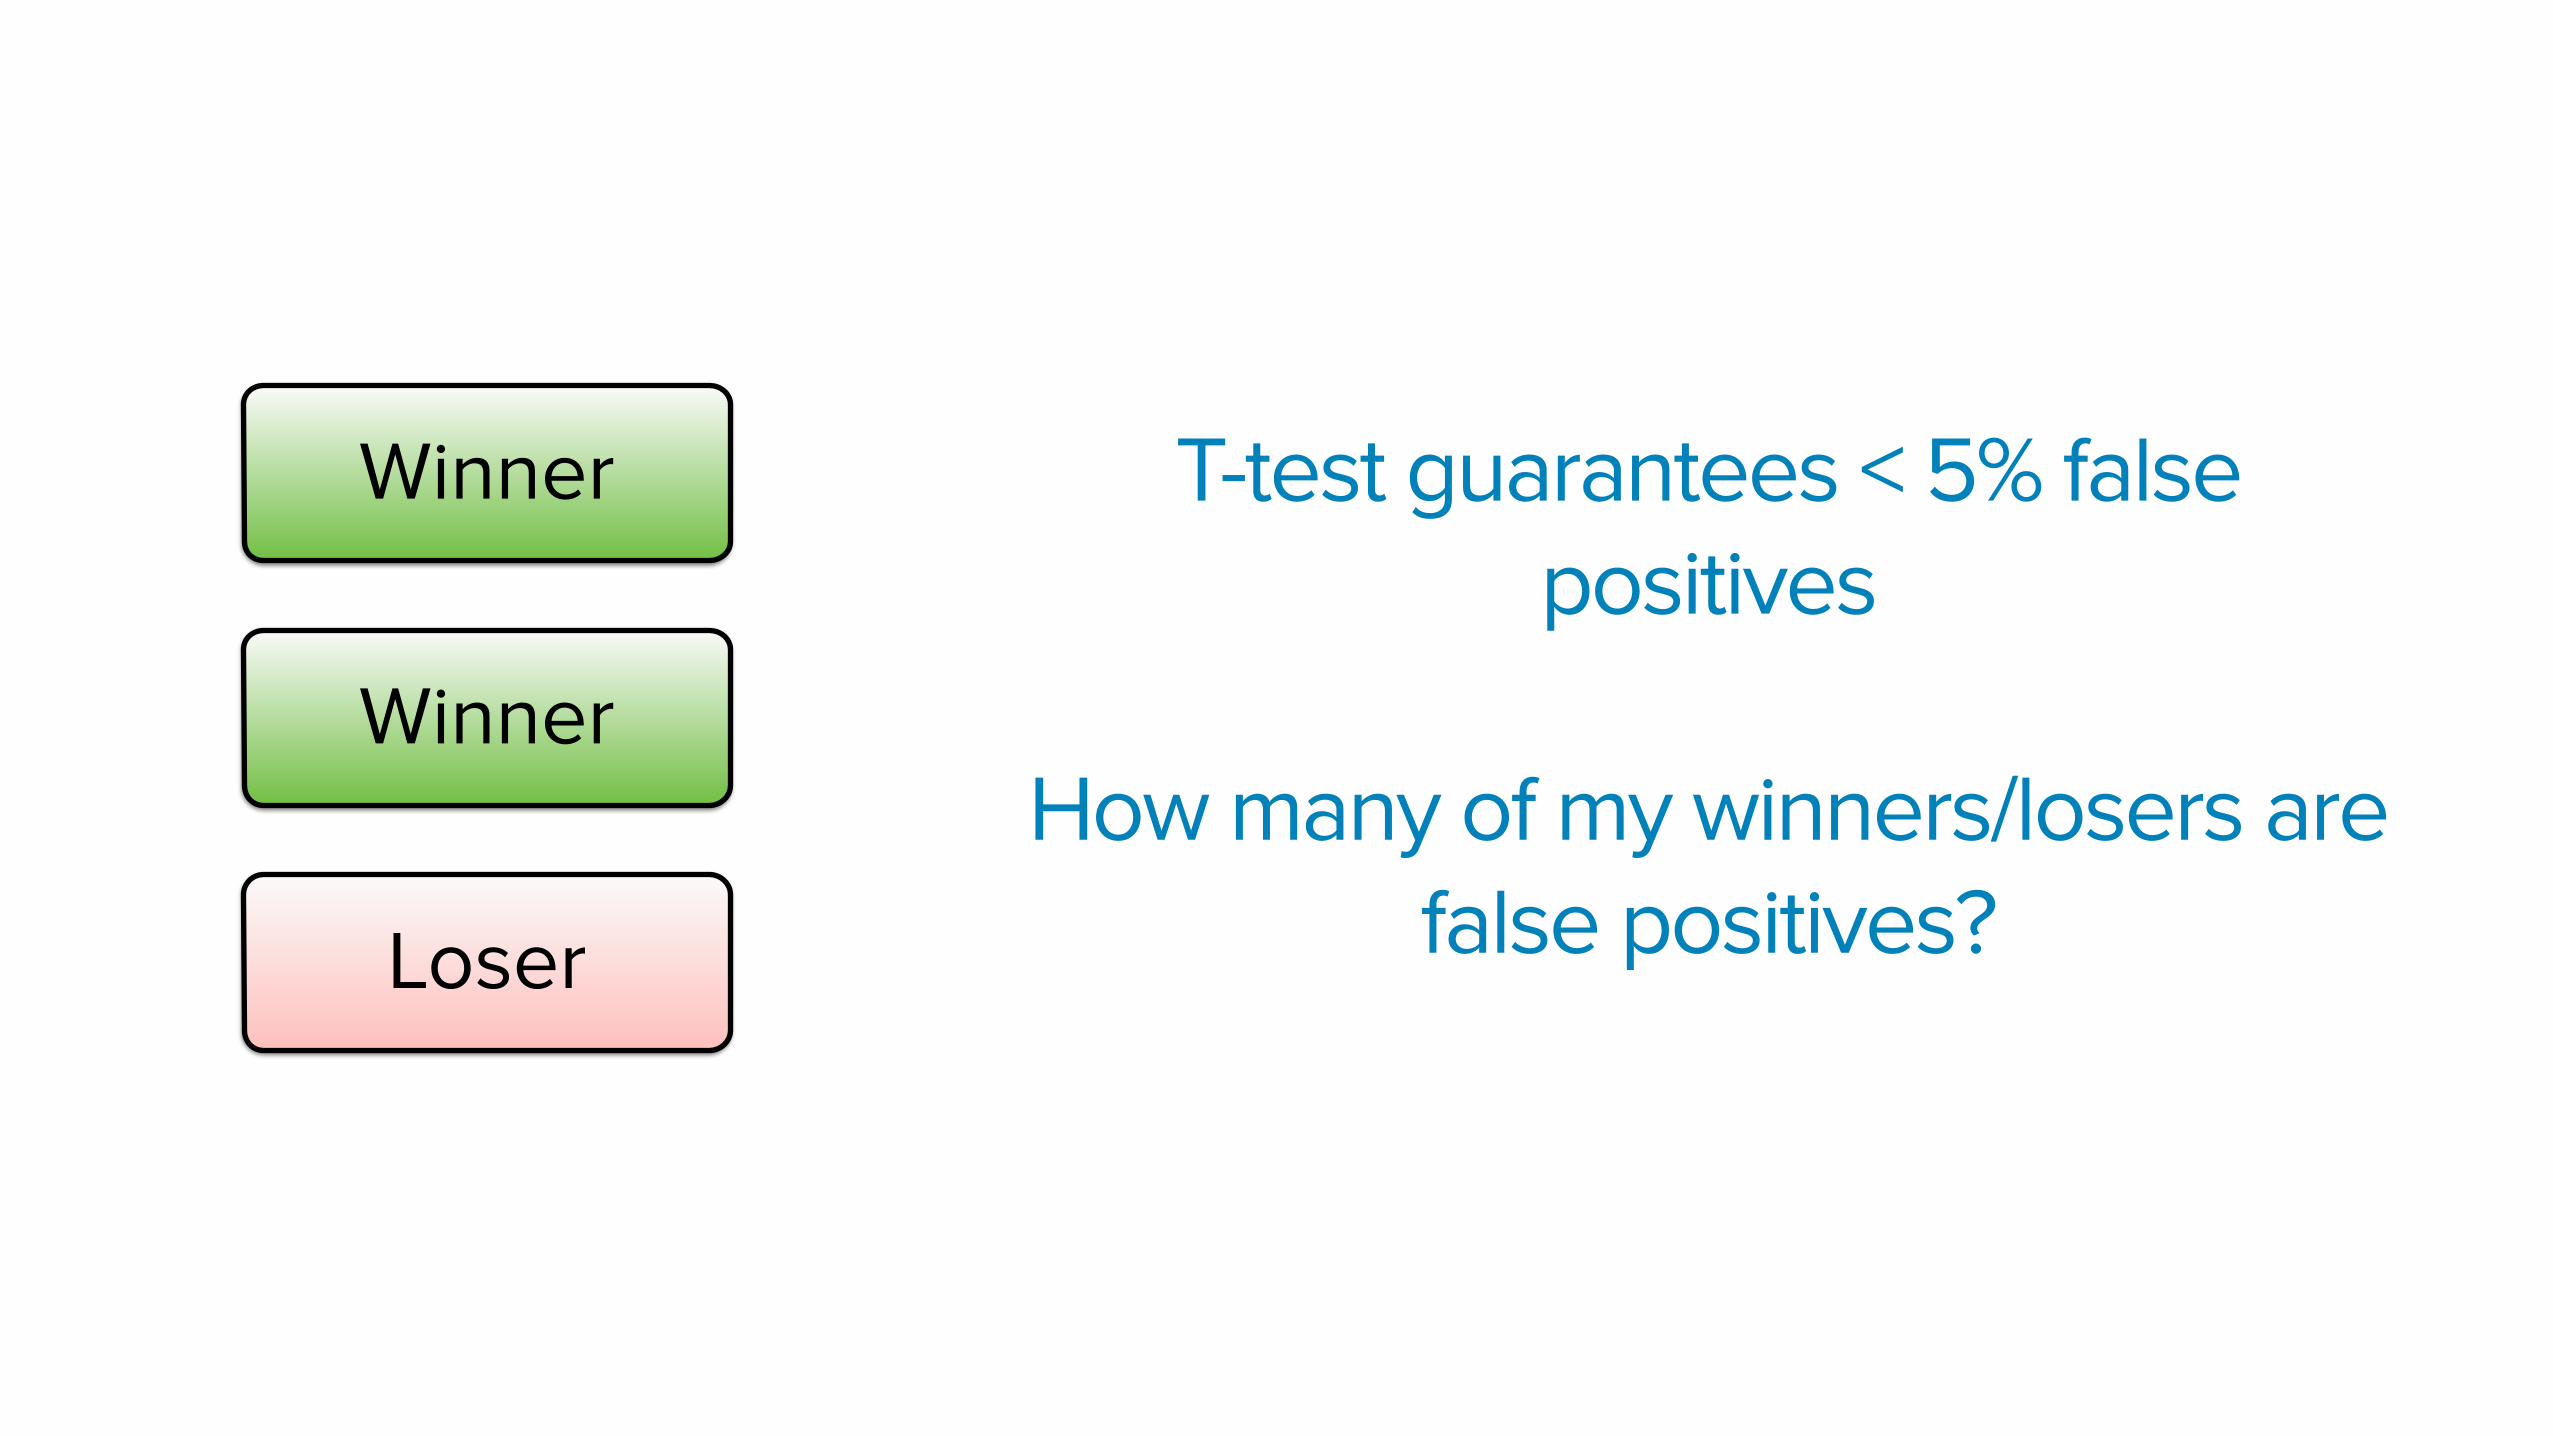
Say I run an experiment.
After I reach my minimum sample size, I stop the experiment and see
2 of my variations beating control and 1 variation losing to control
Winner
Winner
Loser
T-test guarantees < 5% false positives
How many of my winners/losers are false positives?
Winner
Winner
Loser
Inconclusive
Inconclusive
Inconclusive
Inconclusive
Inconclusive
Inconclusive
Inconclusive
Inconclusive
Inconclusive
Inconclusive
Inconclusive
Inconclusive
Inconclusive
Inconclusive
Inconclusive
Inconclusive
Inconclusive
Inconclusive
Inconclusive
Inconclusive
Inconclusive
Inconclusive
Inconclusive
Inconclusive
Inconclusive
Inconclusive
Inconclusive
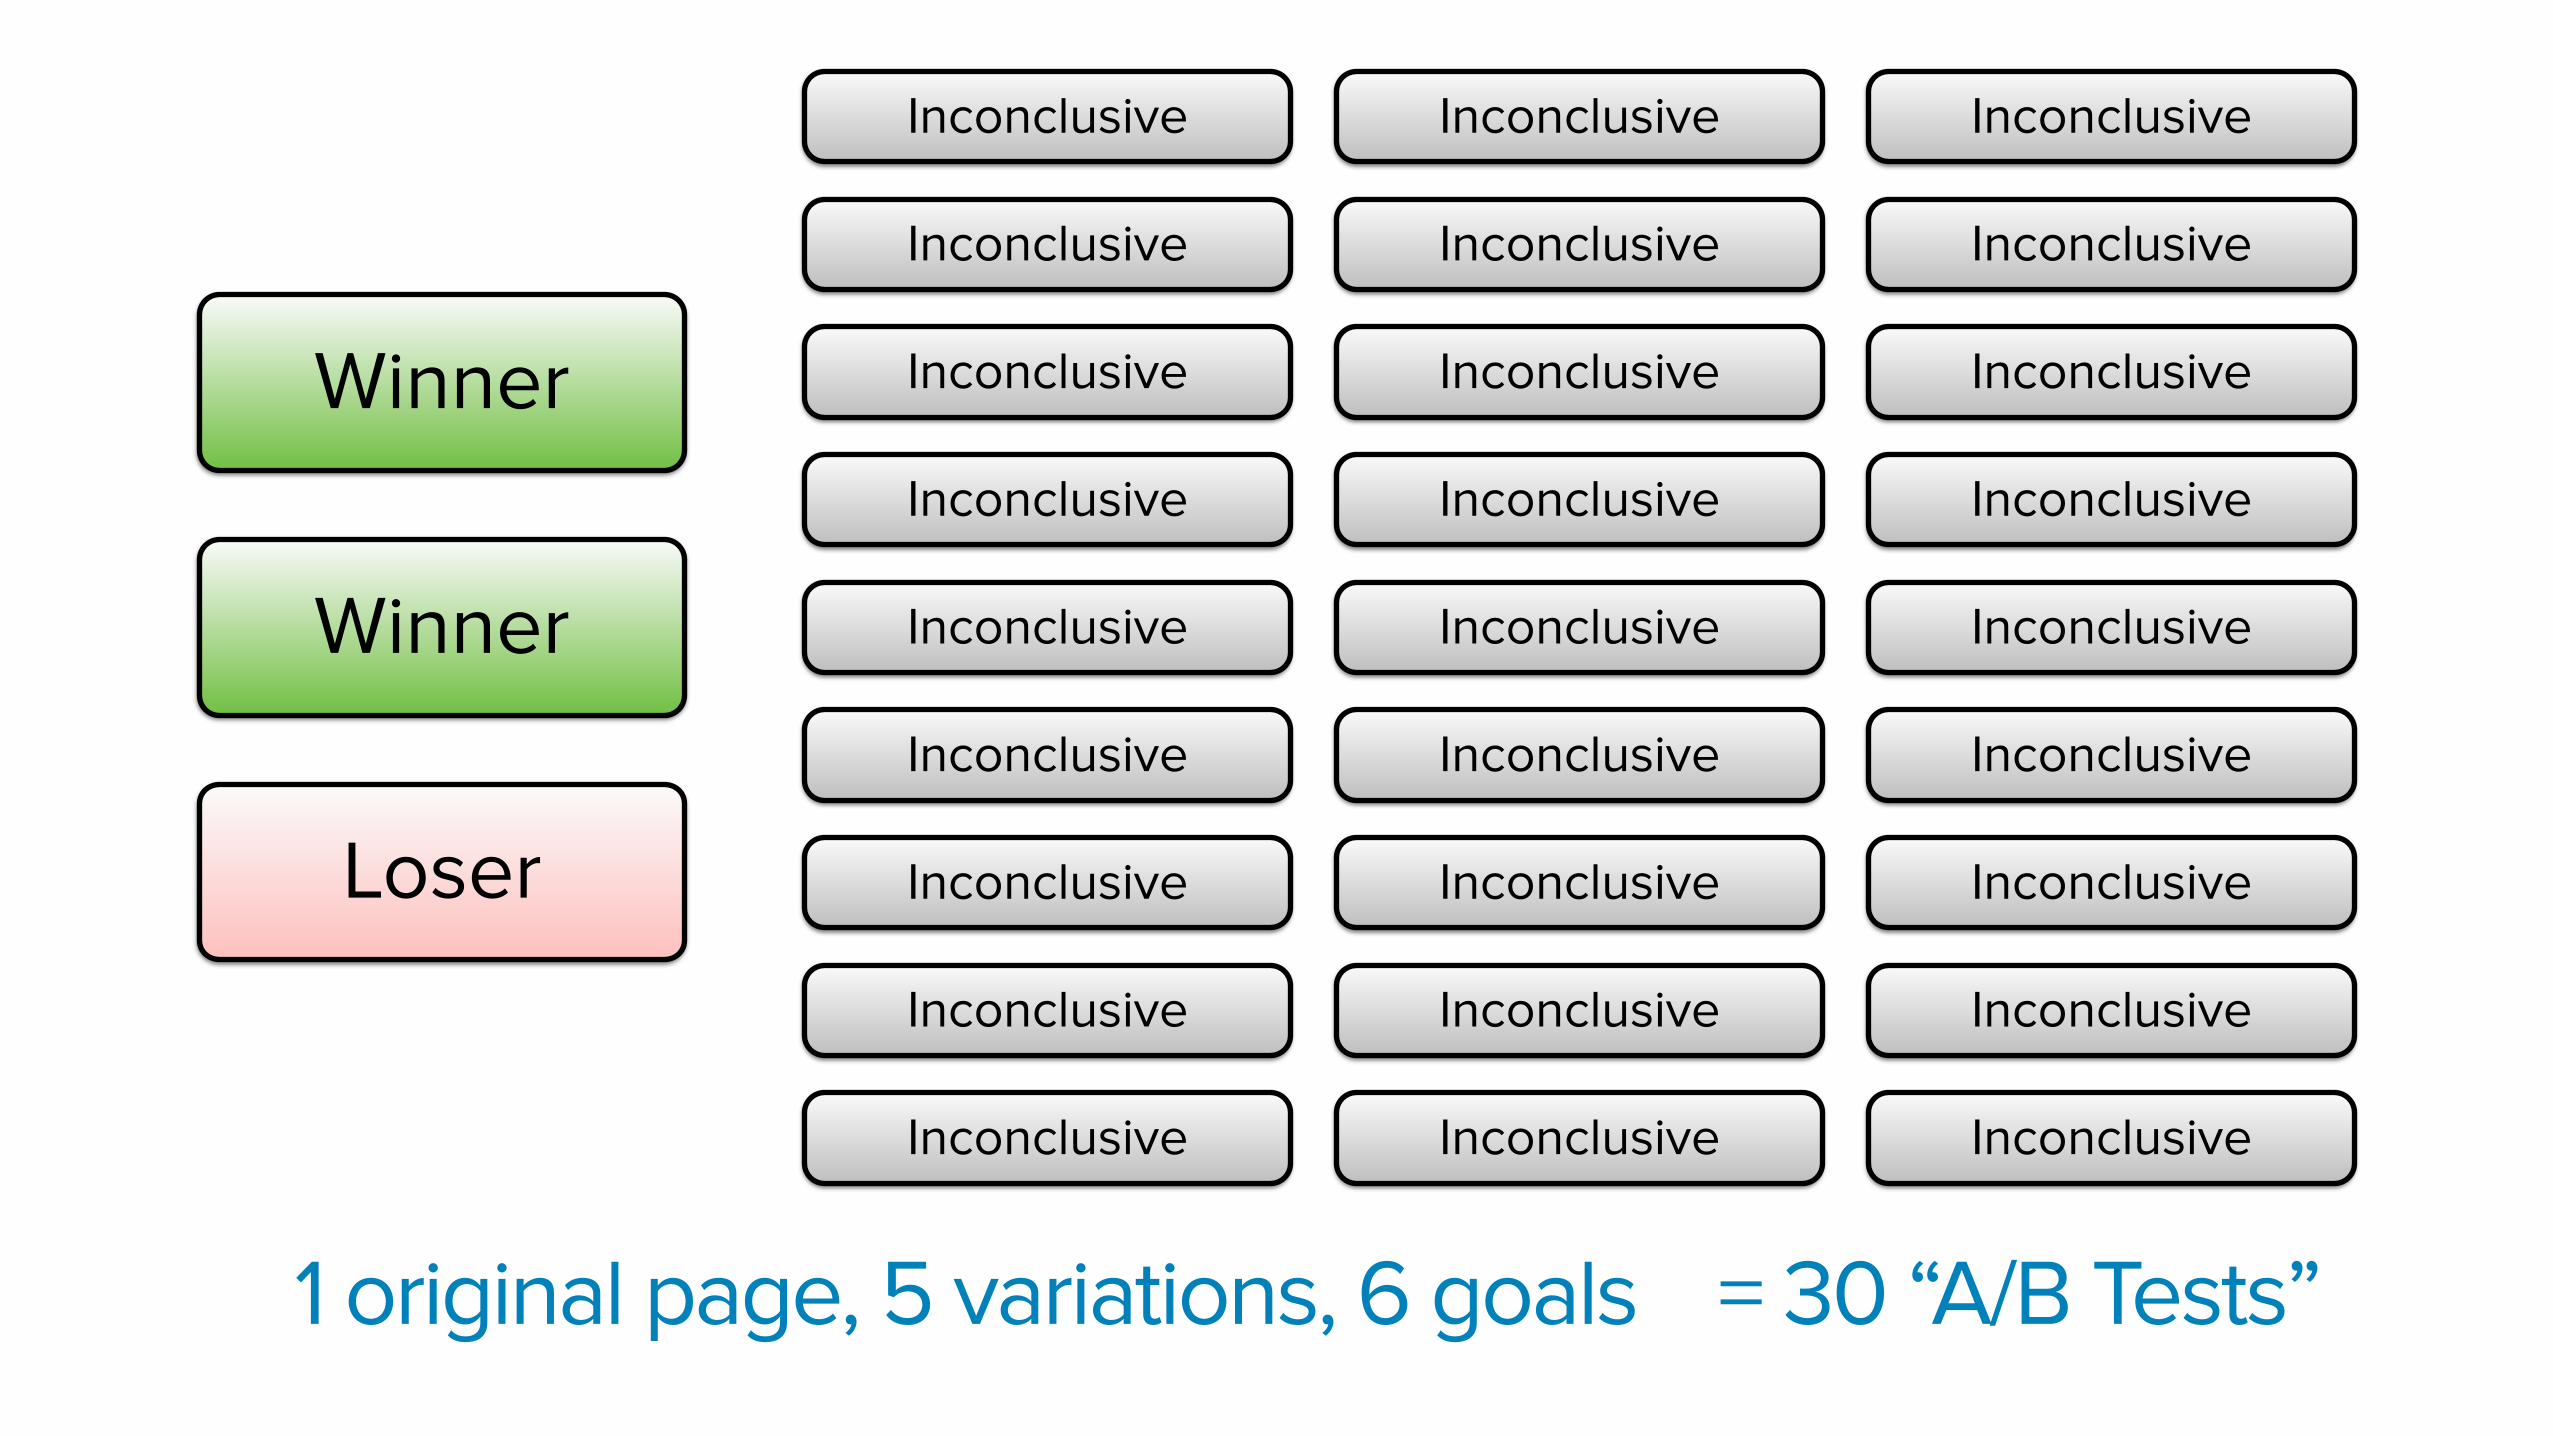
1 original page, 5 variations, 6 goals = 30 “A/B Tests”= 30 “A/B Tests”
Winner
Winner
Loser
Inconclusive
Inconclusive
Inconclusive
Inconclusive
Inconclusive
Inconclusive
Inconclusive
Inconclusive
Inconclusive
Inconclusive
Inconclusive
Inconclusive
Inconclusive
Inconclusive
Inconclusive
Inconclusive
Inconclusive
Inconclusive
Inconclusive
Inconclusive
Inconclusive
Inconclusive
Inconclusive
Inconclusive
Inconclusive
Inconclusive
Inconclusive
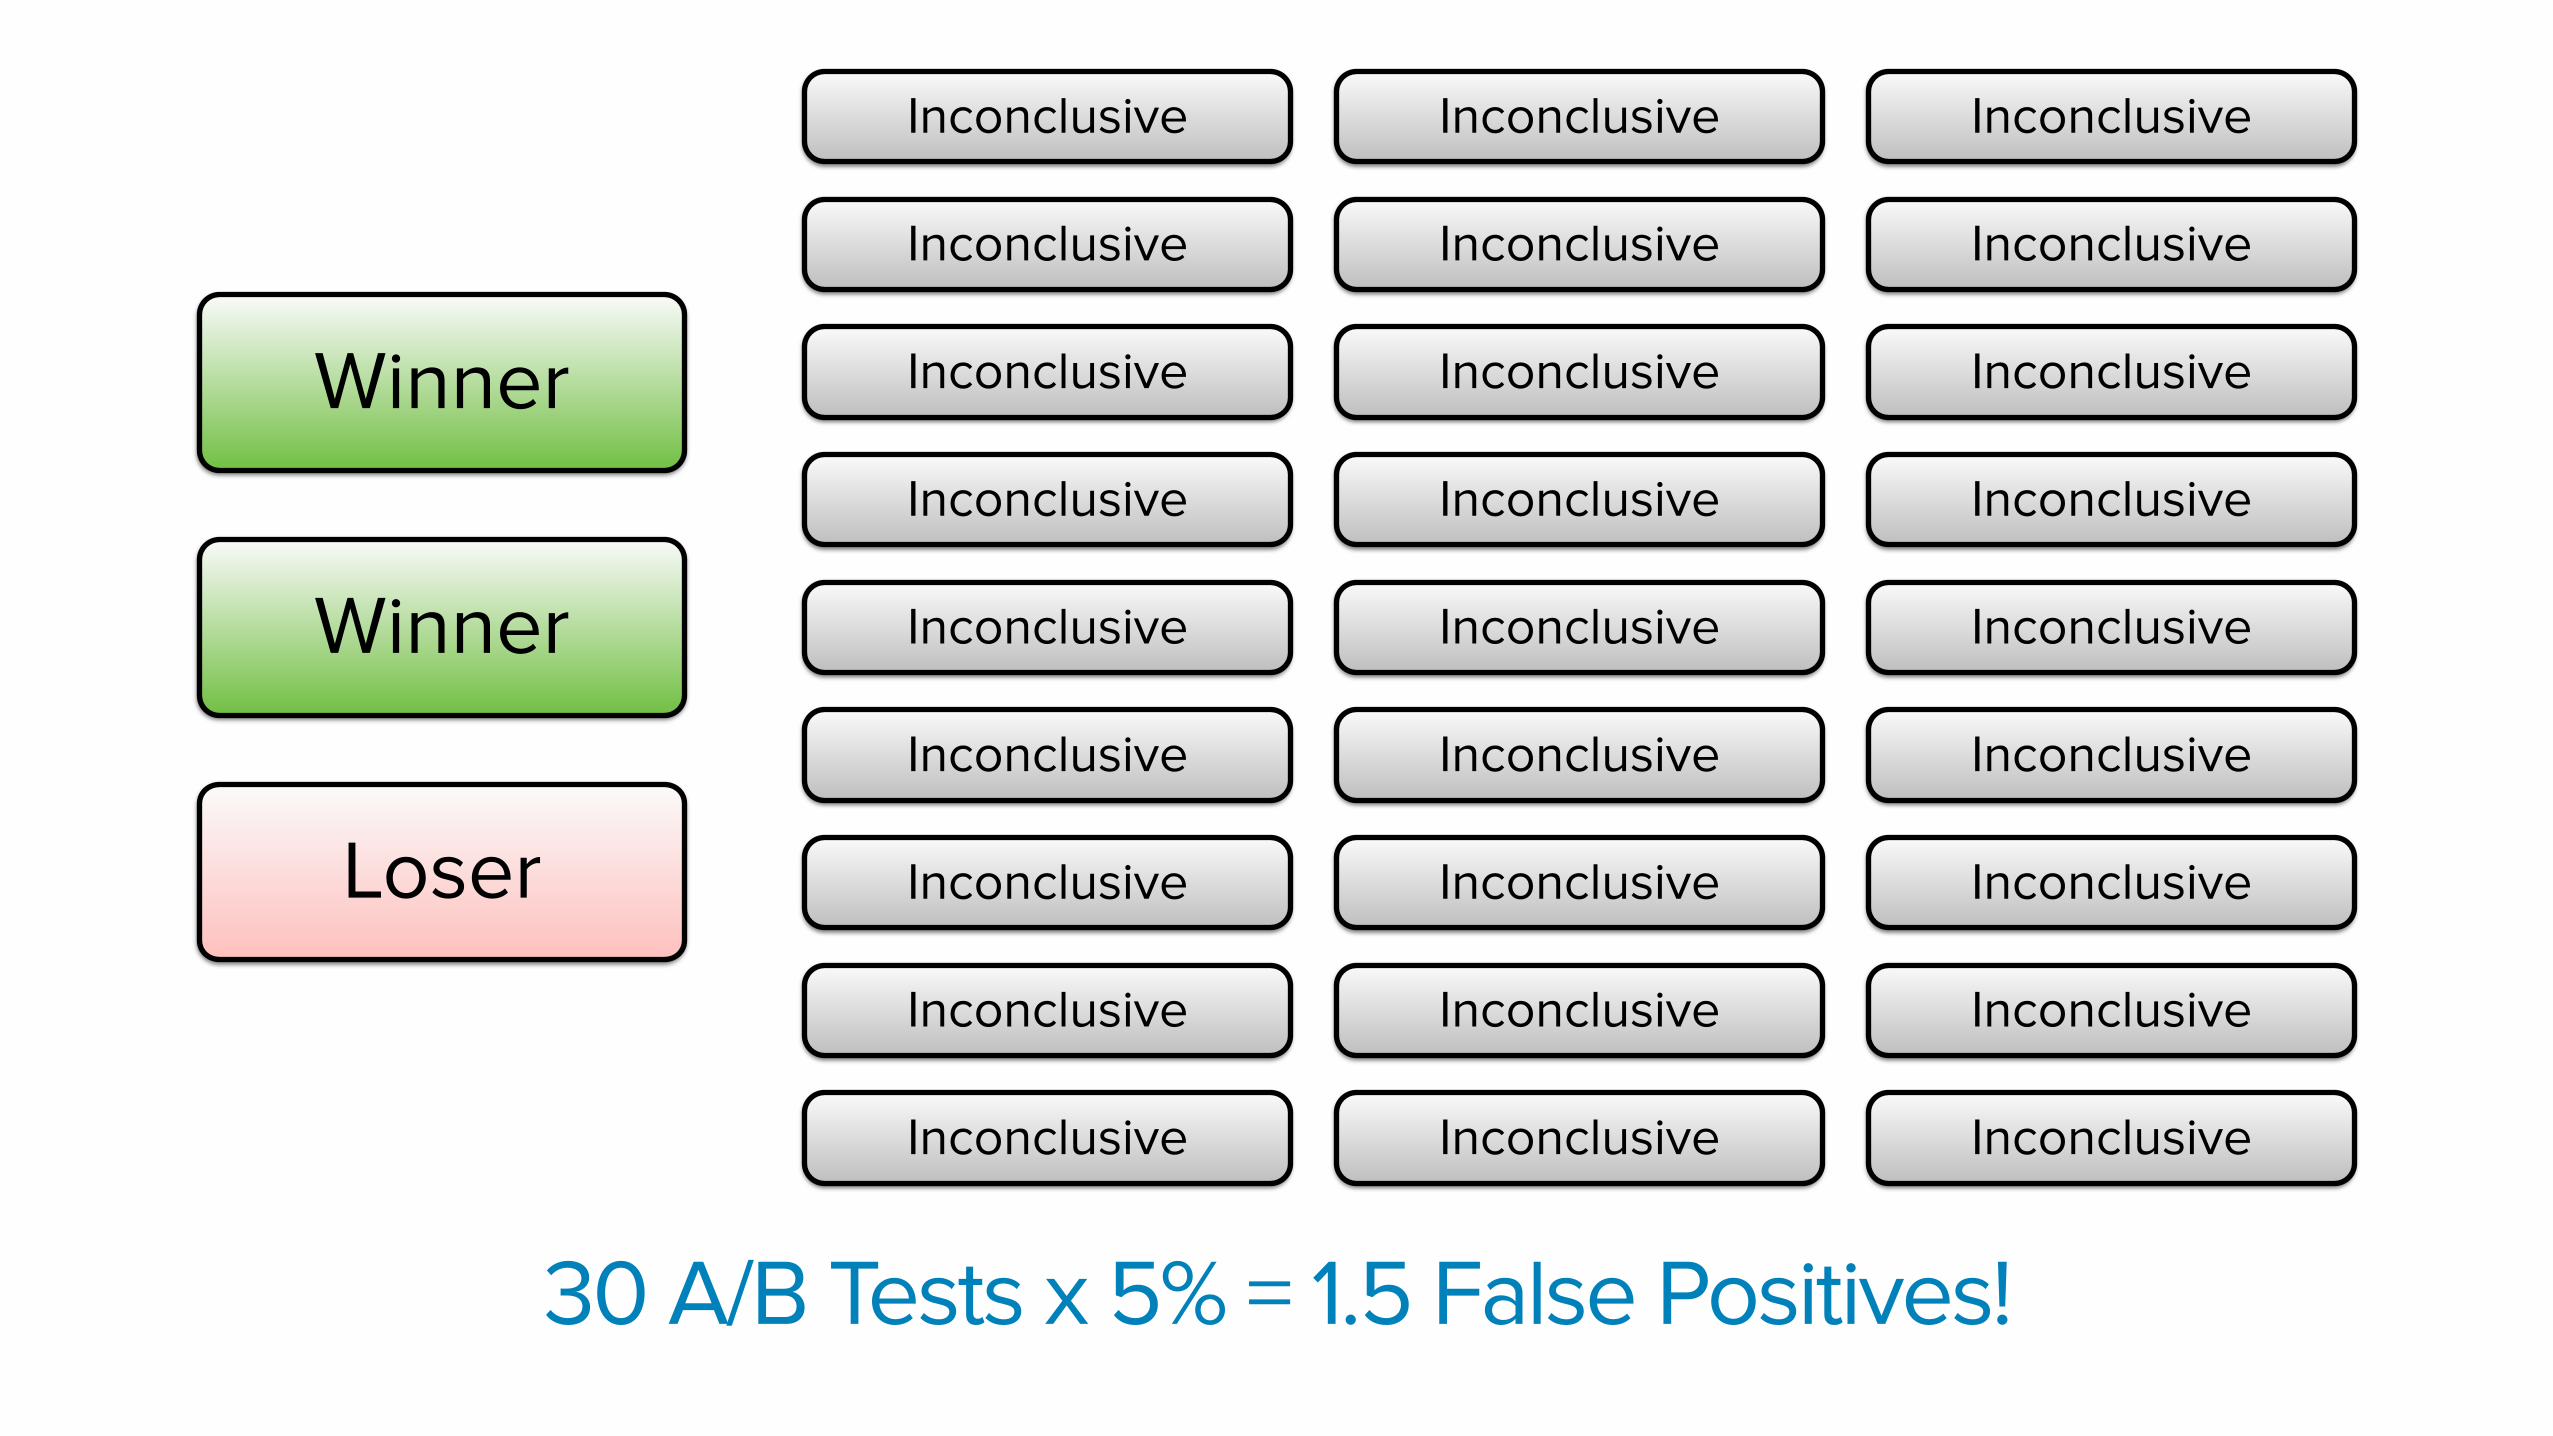
30 A/B Tests x 5% = 1.5 False Positives!
Winner
Winner
Loser
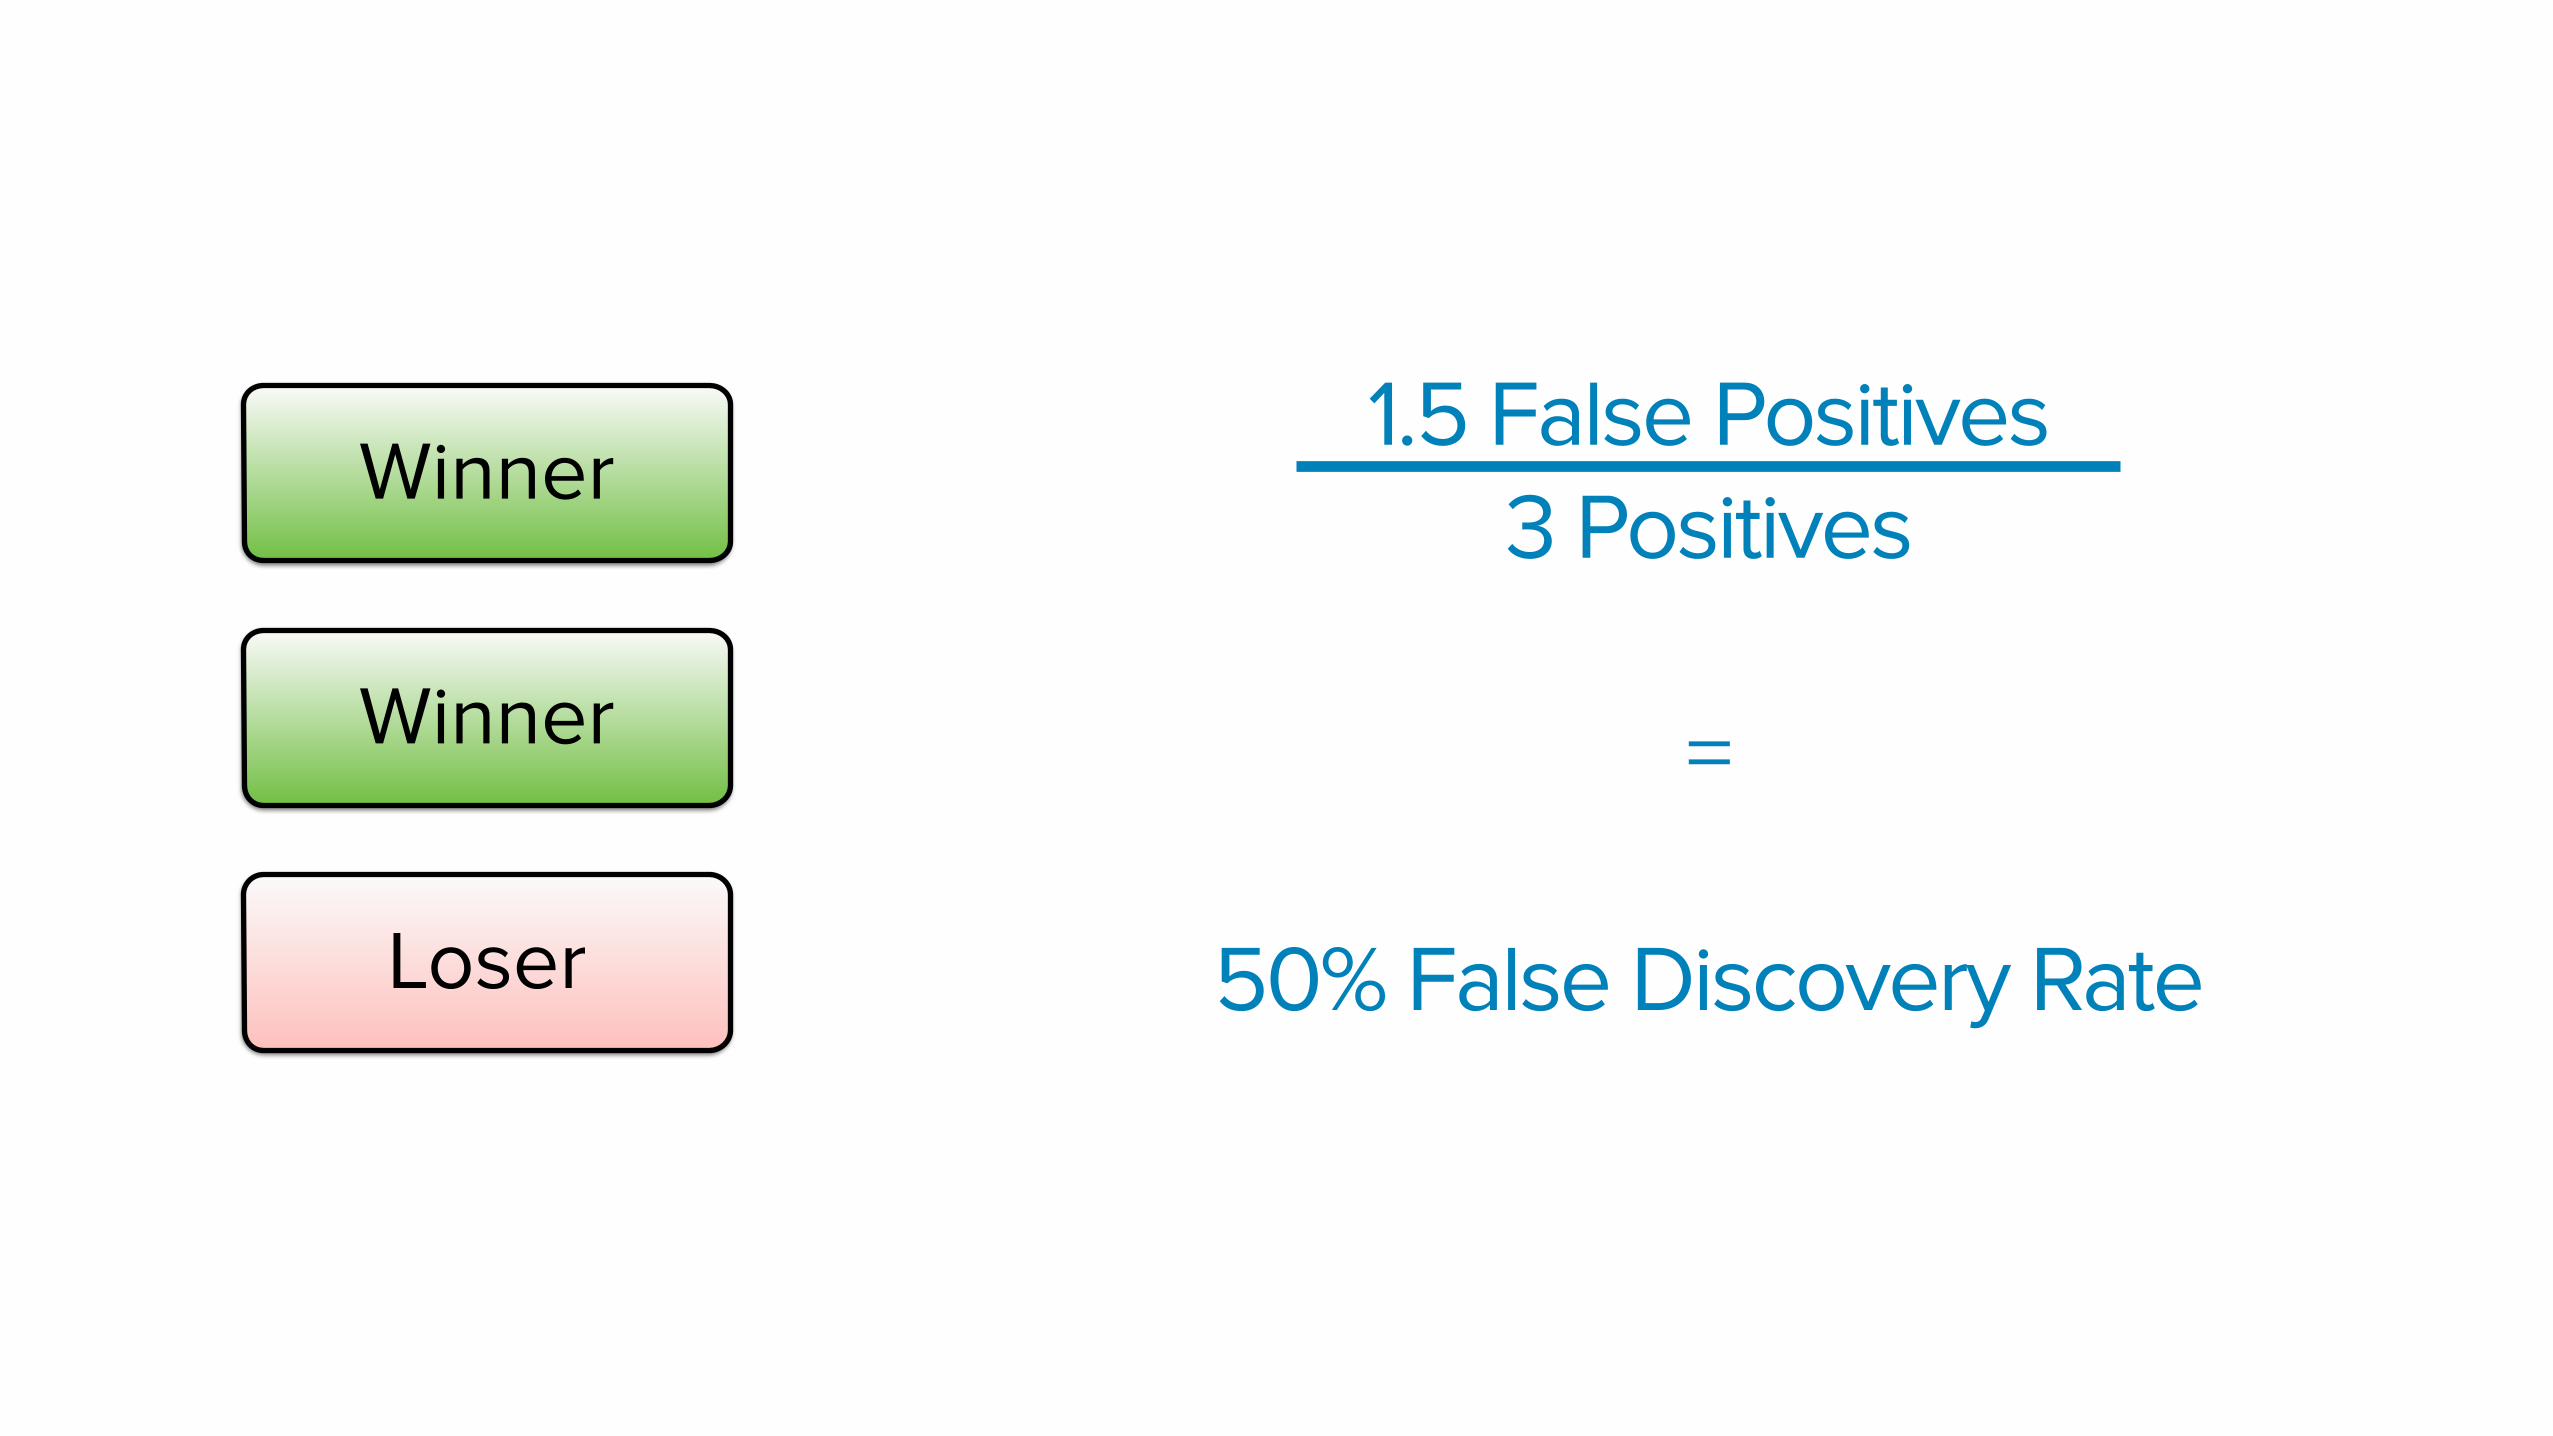
1.5 False Positives 3 Positives
=
50% False Discovery Rate
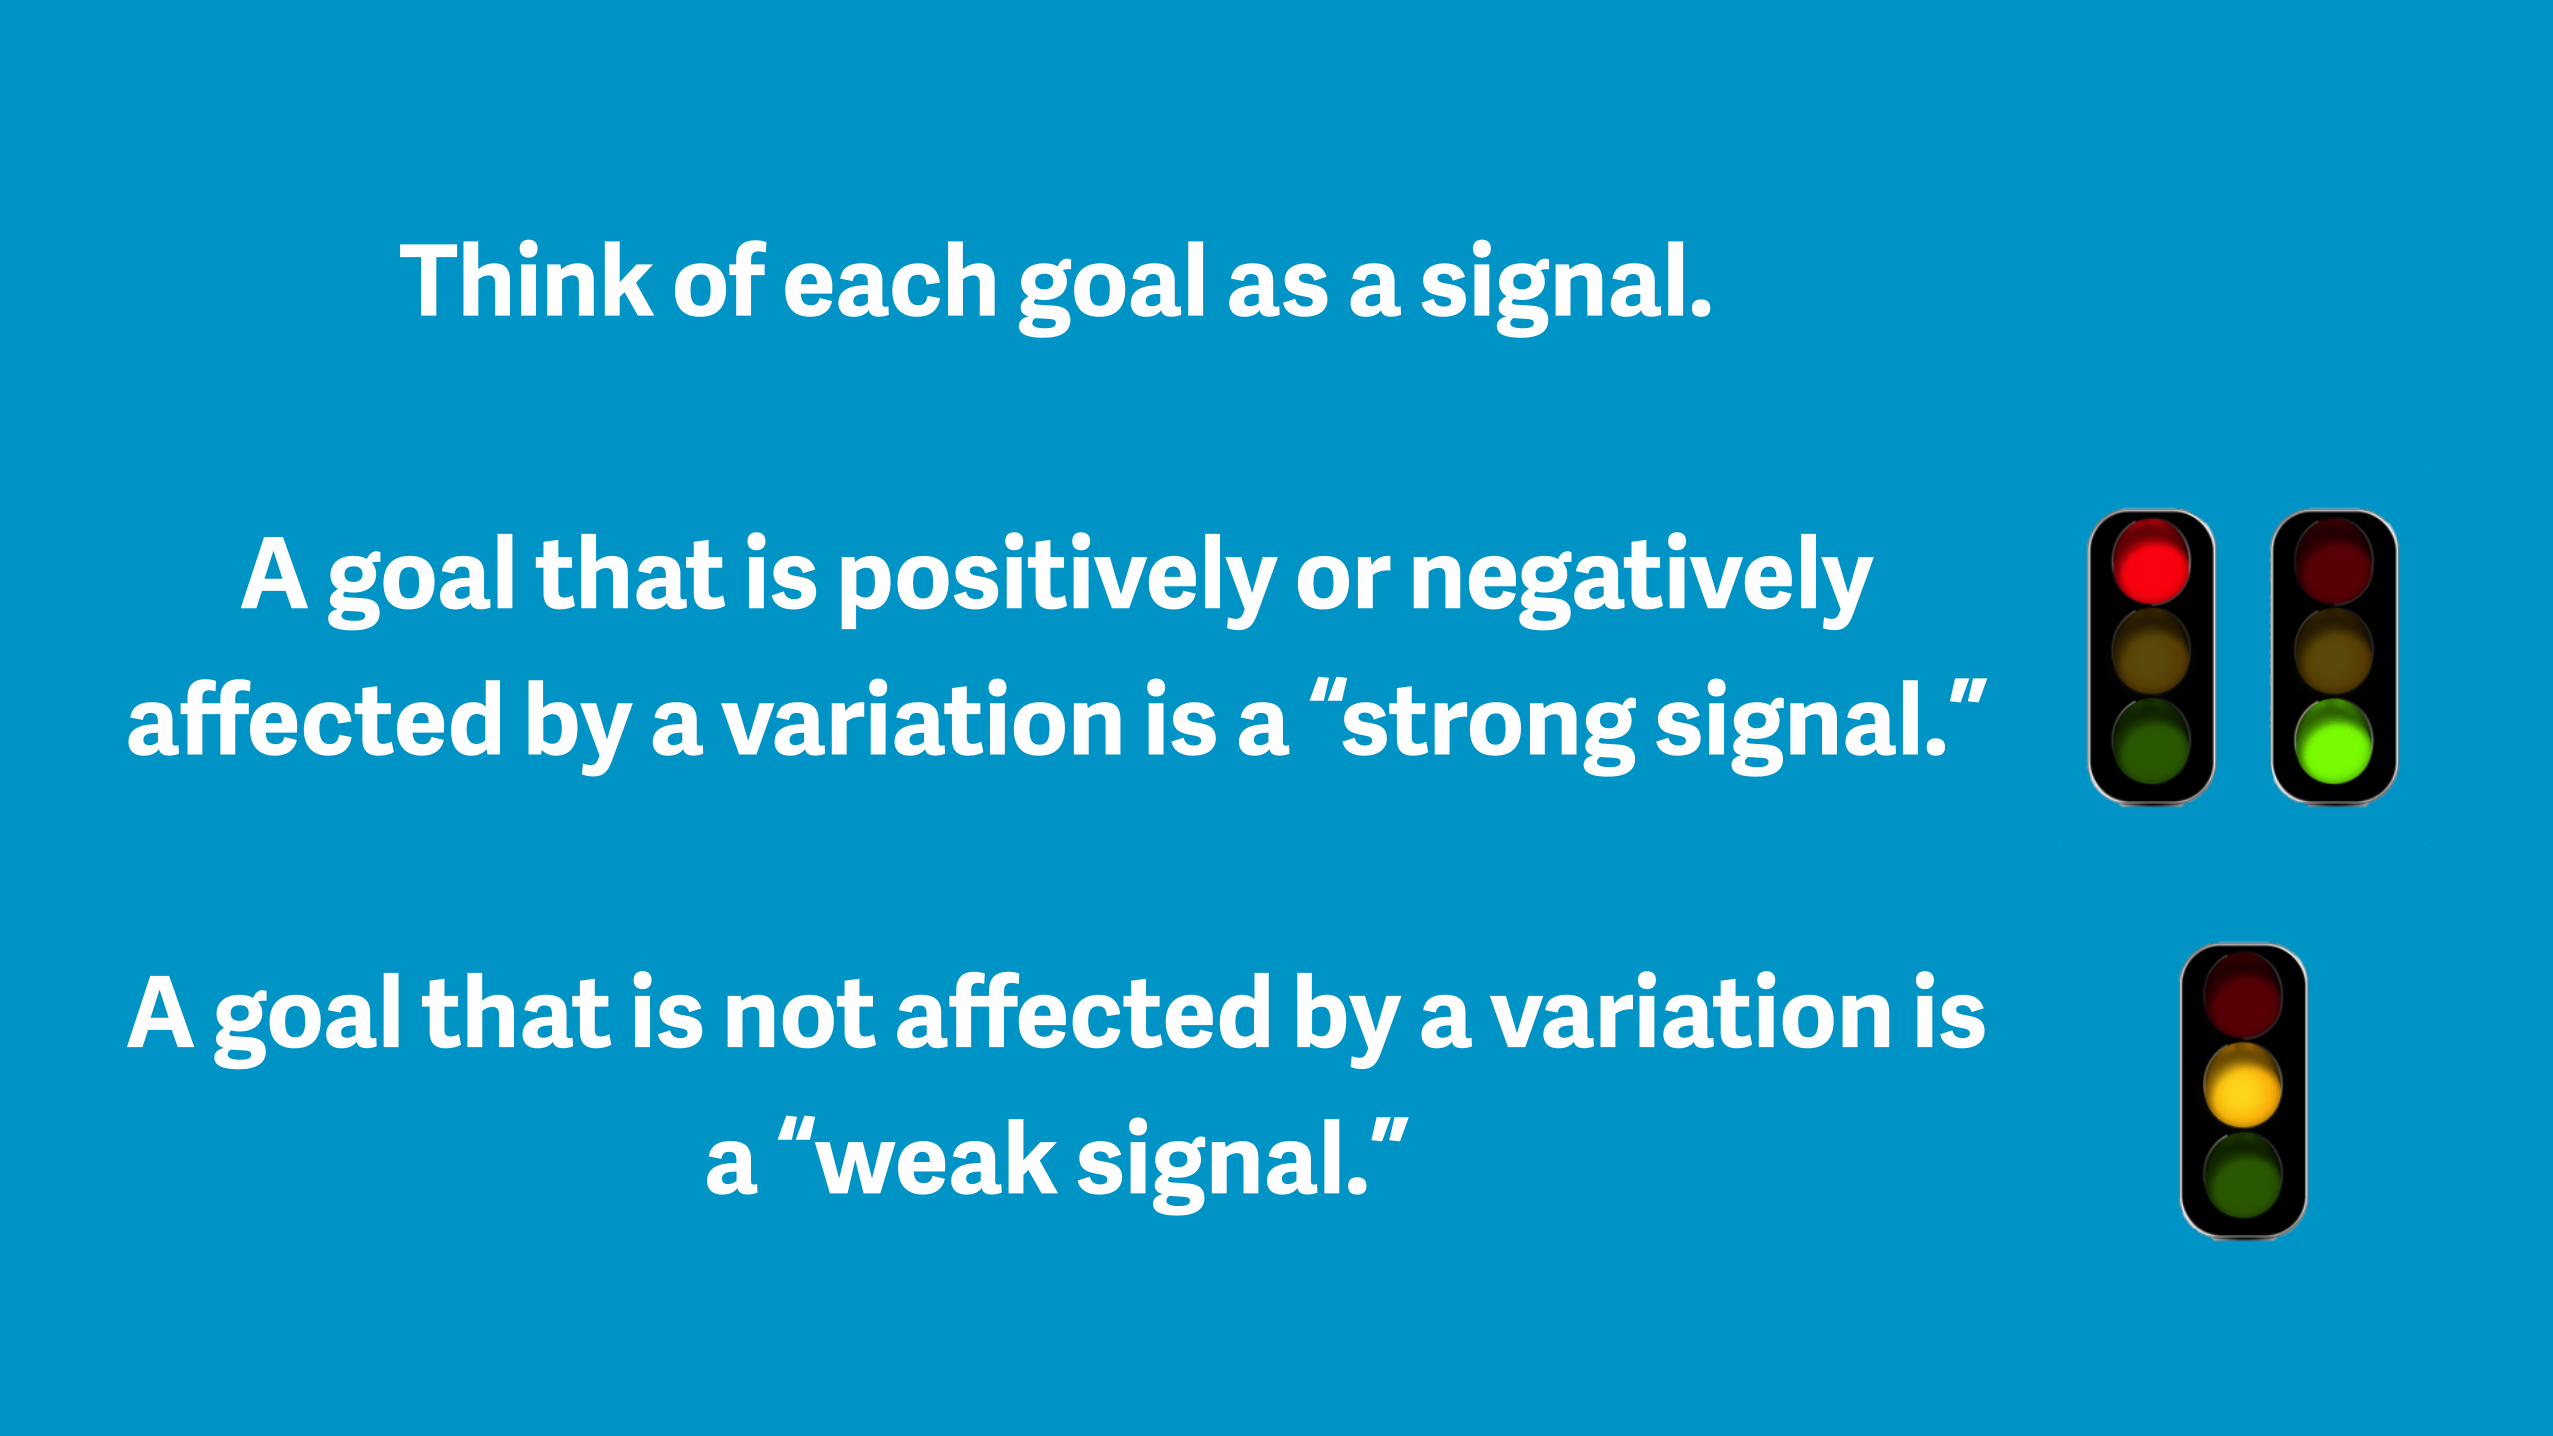
Think of each goal as a signal.
A goal that is positively or negatively affected by a variation is a “strong signal.”
A goal that is not affected by a variation is a “weak signal.”
Stats Engine is more conservative when there are weak signals present
Even when there are also strong signals
So, adding a lot of “random” goals will slow down your experiment
Traditional stats & Stats Engine best practice:
Start with a clear hypothesis
Traditional stats best practice:
Divide your “false positive” (p-value) threshold by the number of goal-
variation pairs in your experiment.
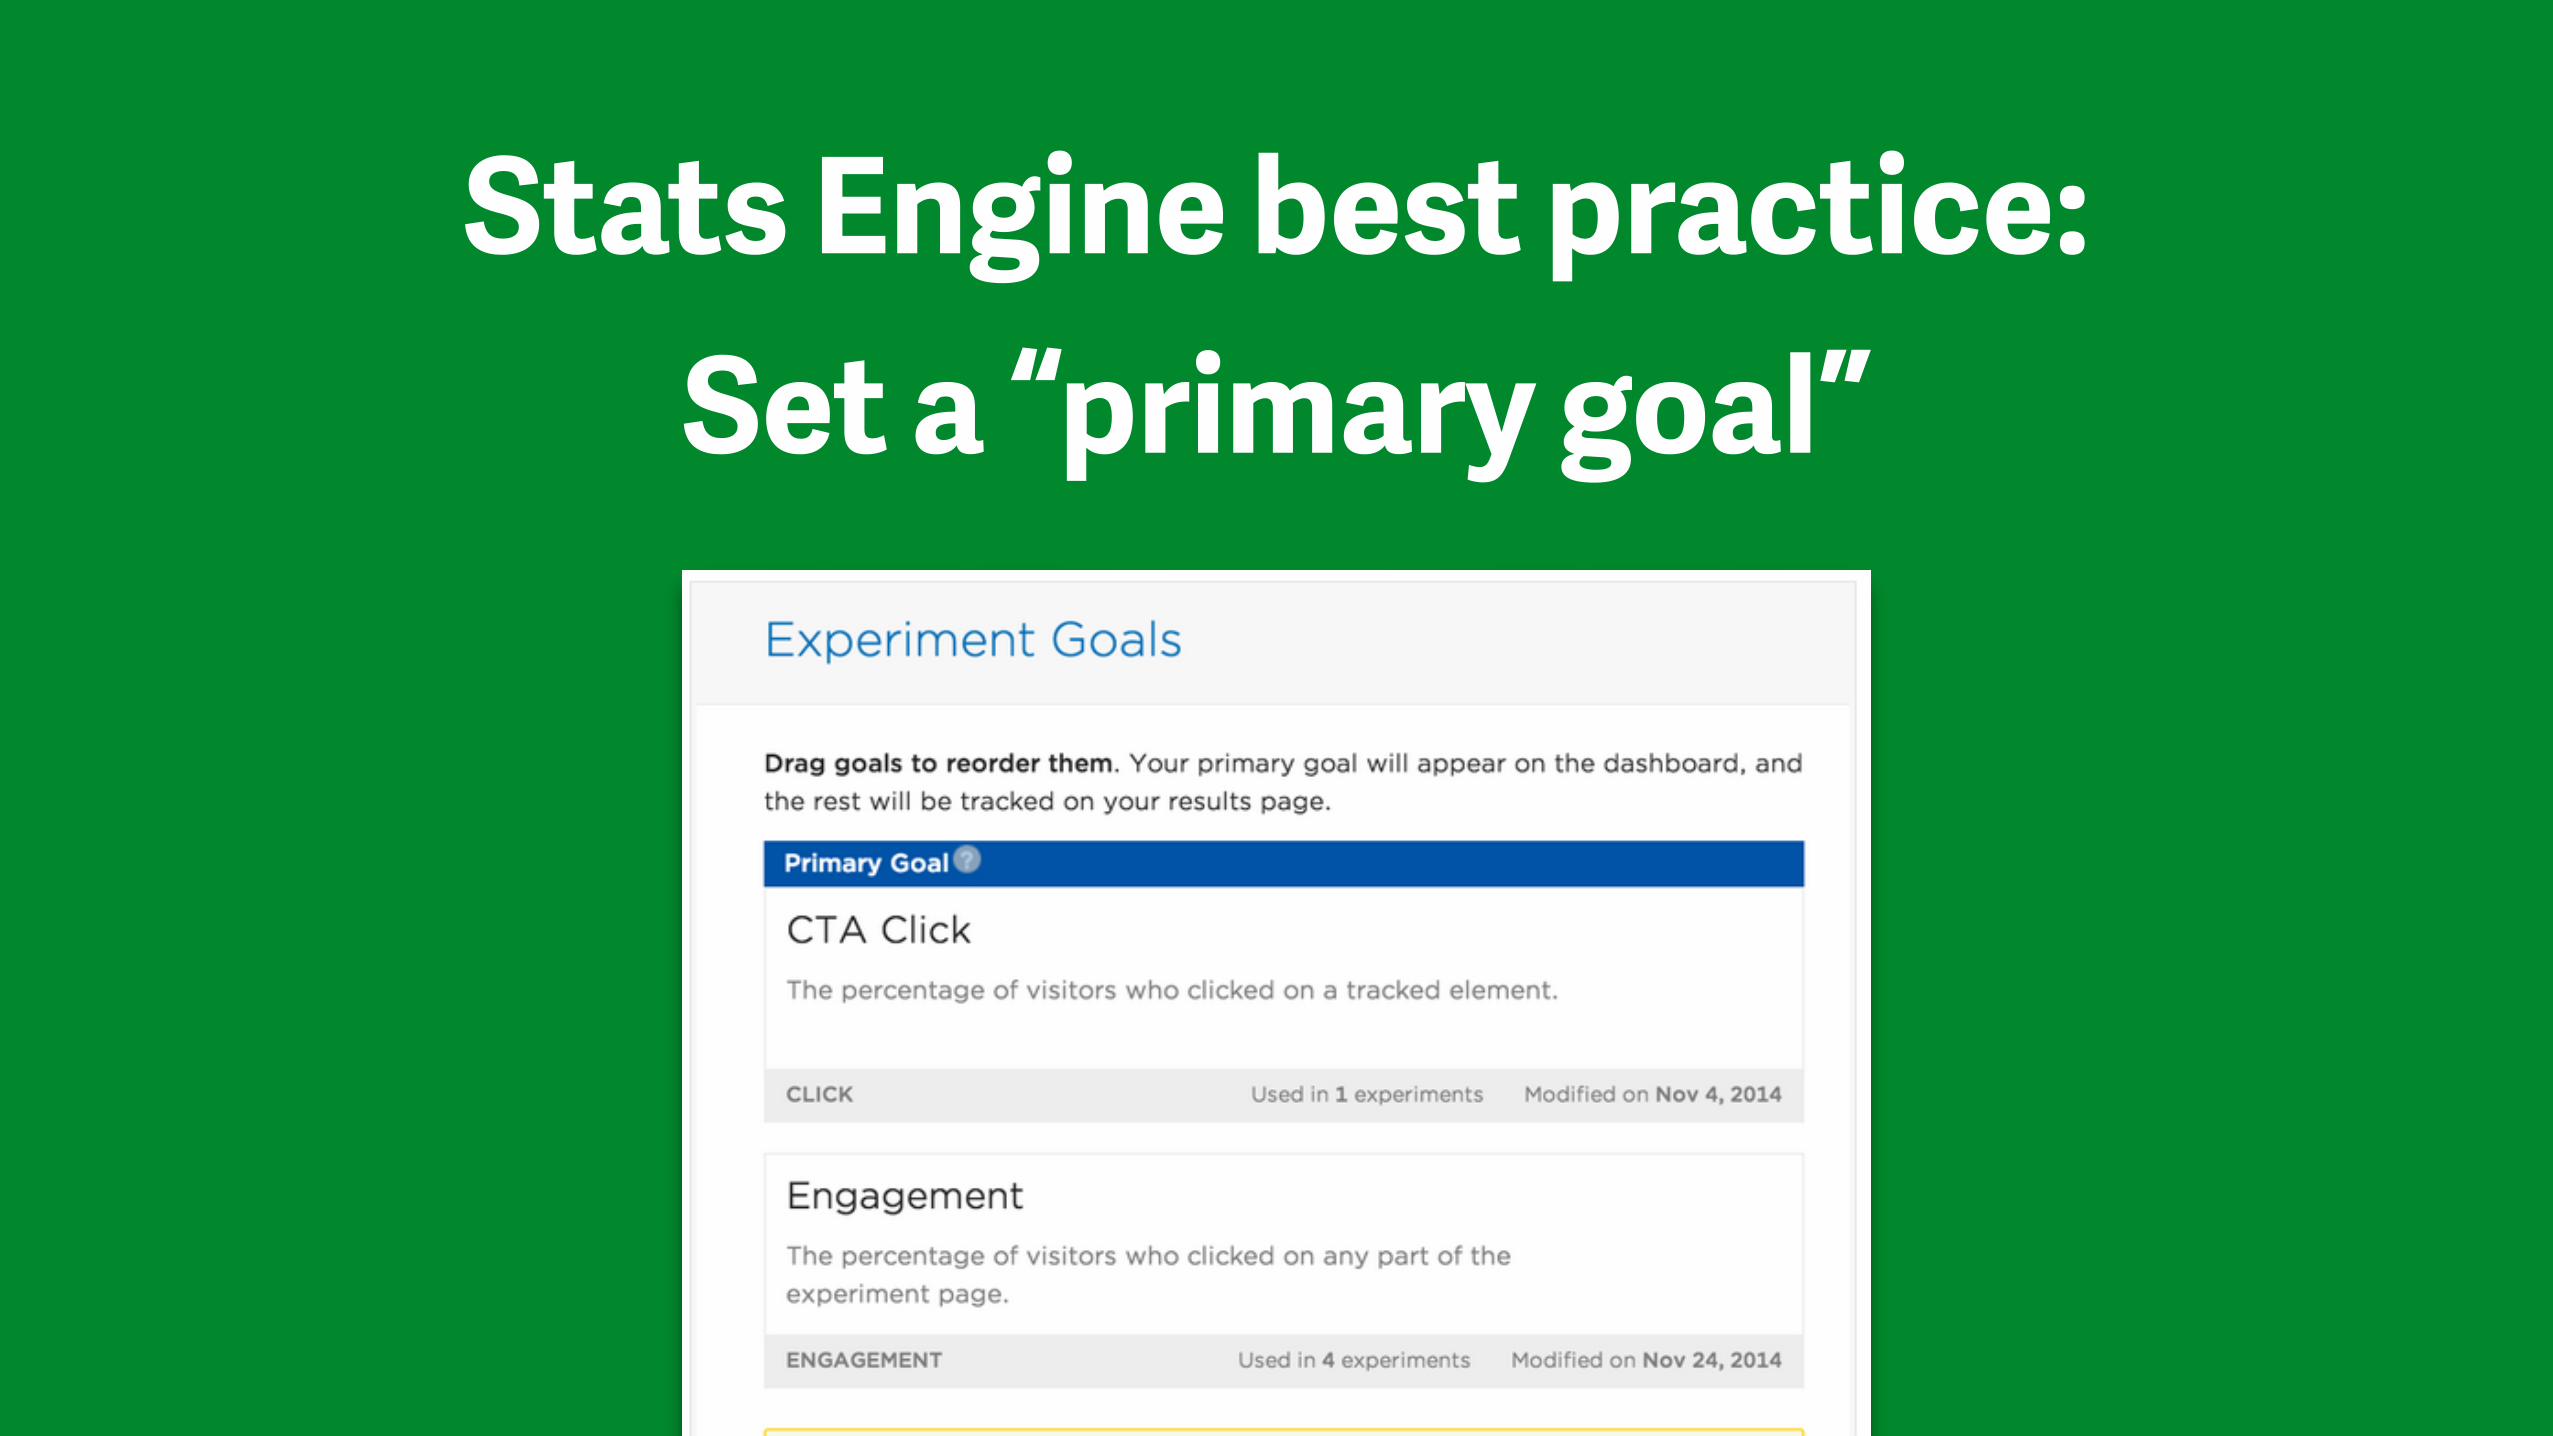
Stats Engine best practice: Set a “primary goal”
Stats Engine best practice: Avoid “random” goals and variations
for maximum velocity

1. Why we built Stats Engine
2. Best practices for testing with Stats Engine
1. - …to redesign Statistics to match the way our customers actually use it
2. - Start with a clear hypothesis- Use expected ROI to decide when to stop your experiments- Set a primary goal- Avoid “random” goals and variations for maximum test velocity
TL;DL
Learn more: optimizely.com/statistics
Q&A
Pete KoomenCo-founder & CTO, Optimizely

Testing with Stats Engine Why it’s harder to find winners with Optimizely
Pete KoomenCo-founder & CTO, Optimizely
#opticon2015