Embed Size (px)
Citation preview

TSX:NMI | TSX: KLG
| BUSINESS COMBINATION |
SIGNIFICANT VALUE CREATION OPPORTUNITY
October 2016

2
Cautionary Note Regarding Forward-Looking Information
This presentation contains statements which constitute “forward-looking information” within the meaning of applicable securities laws, including statements regarding the plans,
intentions, beliefs and current expectations of Kirkland Lake Gold Inc. (“Kirkland Lake Gold”) and Newmarket Gold Inc. (“Newmarket”) with respect to future business activities and
operating performance. Forward-looking information is often identified by the words “may”, “would”, “could”, “should”, “will”, “intend”, “plan”, “anticipate”, “believe”, “estimate”, “expect” or
similar expressions and include information regarding: (i) expectations regarding whether the proposed arrangement to acquire Newmarket (the “Transaction”) will be consummated,
including whether conditions to the consummation of the Transaction will be satisfied, or the timing for completing the Transaction, (ii) expectations for the effects of the Transaction or
the ability of the combined company to successfully achieve business objectives, including integrating the companies or the effects of unexpected costs, liabilities or delays, (iii) the
potential benefits and synergies of the Transaction, (iv) future production, cash costs, free cash flows, and operations, and (v) expectations for other economic, business, and/or
competitive factors.
Investors are cautioned that forward-looking information is not based on historical facts but instead reflect Kirkland Lake Gold’s and Newmarket’s respective management’s
expectations, estimates or projections concerning future results or events based on the opinions, assumptions and estimates of management considered reasonable at the date the
statements are made. Although Kirkland Lake Gold and Newmarket believe that the expectations reflected in such forward-looking information are reasonable, such information
involves risks and uncertainties, and undue reliance should not be placed on such information, as unknown or unpredictable factors could have material adverse effects on future
results, performance or achievements of the combined company. Among the key factors that could cause actual results to differ materially from those projected in the forward-looking
information are the following: the ability to consummate the Transaction; the ability to obtain requisite regulatory and shareholder approvals and the satisfaction of other conditions to
the consummation of the Transaction on the proposed terms and schedule; the ability of Kirkland Lake Gold and Newmarket to successfully integrate their respective operations and
employees and realize synergies and cost savings at the times, and to the extent, anticipated; the potential impact on exploration activities; the potential impact of the announcement
or consummation of the Transaction on relationships, including with regulatory bodies, employees, suppliers, customers and competitors; the re-rating potential following the
consummation of the Transaction; changes in general economic, business and political conditions, including changes in the financial markets; changes in applicable laws; compliance
with extensive government regulation; and the diversion of management time on the Transaction. This forward-looking information may be affected by risks and uncertainties in the
business of Kirkland Lake Gold and Newmarket and market conditions. This information is qualified in its entirety by cautionary statements and risk factor disclosure contained in filings
made by Kirkland Lake Gold and Newmarket with the Canadian securities regulators, including Kirkland Lake Gold’s and Newmarket’s respective annual information form, financial
statements and related MD&A for the financial year ended December 31, 2015 and their interim financial reports and related MD&A for the period ended June 30, 2016 filed with the
securities regulatory authorities in certain provinces of Canada and available at www.sedar.com.
Should one or more of these risks or uncertainties materialize, or should assumptions underlying the forward-looking information prove incorrect, actual results may vary materially
from those described herein as intended, planned, anticipated, believed, estimated or expected. Although Kirkland Lake Gold and Newmarket have attempted to identify important
risks, uncertainties and factors which could cause actual results to differ materially, there may be others that cause results not to be as anticipated, estimated or intended. Kirkland
Lake Gold and Newmarket do not intend, and do not assume any obligation, to update this forward-looking information except as otherwise required by applicable law.
Use of Non-GAAP Measures
This Presentation refers to Free Cash Flows and Cash Costs of Production because certain readers may use this information to assess the Company’s performance and also to determine the Company’sability to generate cash flow. This data is furnished to provide additional information and are non-GAAP measures and do not have any standardized meaning prescribed by GAAP. Free Cash Flows andCash Costs of Production should not be considered in isolation as a substitute for measures of performance prepared in accordance with GAAP and are not necessarily indicative of operating costspresented under GAAP.
Forward Looking Information
3TSX:NMI
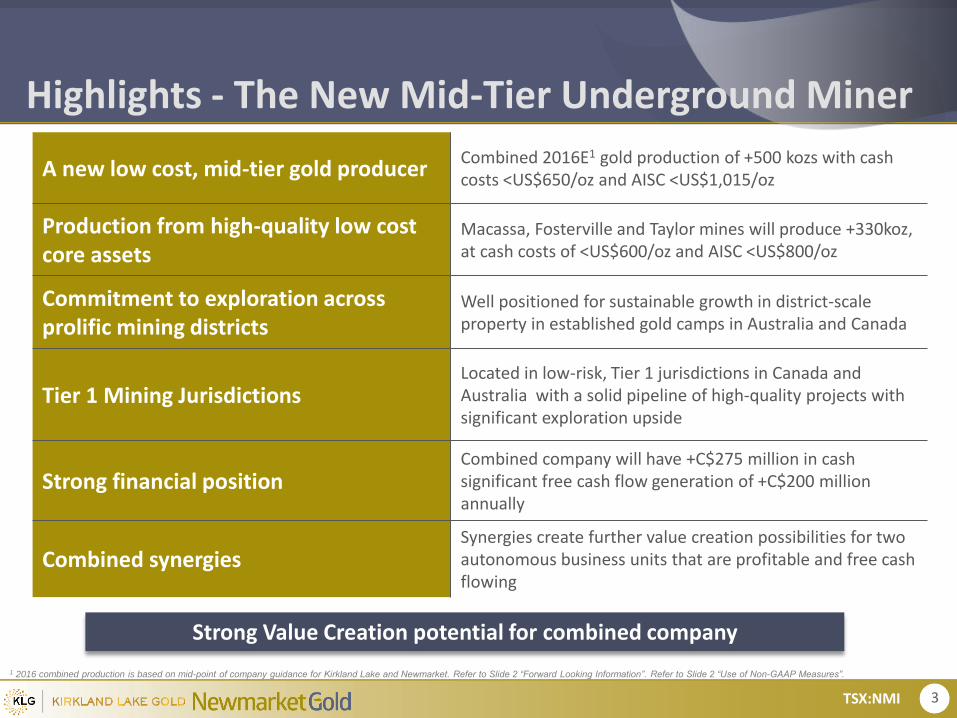
Highlights - The New Mid-Tier Underground Miner
Strong Value Creation potential for combined company
A new low cost, mid-tier gold producerCombined 2016E1 gold production of +500 kozs with cash costs <US$650/oz and AISC <US$1,015/oz
Production from high-quality low cost core assets
Macassa, Fosterville and Taylor mines will produce +330koz, at cash costs of <US$600/oz and AISC <US$800/oz
Commitment to exploration across prolific mining districts
Well positioned for sustainable growth in district-scale property in established gold camps in Australia and Canada
Tier 1 Mining JurisdictionsLocated in low-risk, Tier 1 jurisdictions in Canada and Australia with a solid pipeline of high-quality projects with significant exploration upside
Strong financial positionCombined company will have +C$275 million in cash significant free cash flow generation of +C$200 million annually
Combined synergiesSynergies create further value creation possibilities for two autonomous business units that are profitable and free cash flowing
1 2016 combined production is based on mid-point of company guidance for Kirkland Lake and Newmarket. Refer to Slide 2 “Forward Looking Information”. Refer to Slide 2 “Use of Non-GAAP Measures”.

4TSX:NMI
Detour Tahoe Torex
PF KLG + NMI
0.475 SER
2017E-2019E Consensus
Production kozs 544 636 819 363
Free Cash Flow US$M $160 $286 $313 $120
Cash Cost US$/oz $658 $648 $594 $546
AISC Corp. US$/oz $915 $831 $825 $643
Total Resources (inclusive) Moz AuEq 17.0 21.4 20.5 9.3
Capitalization Summary
Market Capitalization C$M $1,651 $3,895 $4,530 $1,843
Cash Net of Debt C$M $153 ($364) $96 ($436)
Enterprise Value C$M $1,486 $4,177 $4,394 $2,245
H1 Financials
OCF (2016 H1)1 C$M $146 $161 $200 $53
FCF (2016 H1)2 C$M $92 $85 $121 $7
Mineral Reserves & Resources
Total Reserves Moz AuEq 3.2 16.4 9.5 4.3
Total Reserve Grade g/t AuEq 6.11 0.99 1.03 2.76
Pro Forma Vs Peer Group (2017E – 2019E) Consensus
Note: Based on Consensus. All Market Data as of October 11, 2016. 1. OCF before changes in WC, 2. FCF calculated as OCF before changes in WC less Capex. Excludes debt repayment and dividends

5TSX:NMI
Creation of a High Quality Mid-Tier Gold Producer2016 Production (koz AuEq)2
1 Source: 2016 combined production is based on midpoint of company guidance.2 Source: Company guidance (midpoint); adjusted to gold equivalency where relevant. Refer to Slide 2 “Forward Looking Information” .
785
576
535
510
479
400
385
380
370
280
230
205
160
150
148
102
IAMGOLD
Hecla
Detour
Pro Forma
OceanaGold
Silver Standard
Alamos
New Gold
Torex
Kirkland Lake
Newmarket
Primero
Alacer
Guyana
Klondex
Richmont
280
230
510
0
100
200
300
400
500
600
2016 Guidance
Kirkland Lake Newmarket
Combined Gold Production (koz)1

6TSX:NMI
High Grade, Low Cost Cornerstone Assets
Production & cash flow anchored by three high grade, low cost operations:
MACASSA MINE COMPLEX, FOSTERVILLE MINE and the TAYLOR MINE account for 65% of pro-forma production and have the opportunity to generate significant free cash flow.
Macassa Mine Complex
FostervilleMine
Taylor Mine
Consolidated
Reserve Grades (g/t Au) 19.2 g/t 7.0 g/t 6.3 g/t 13.7 g/t2016E Production(mid-point of guidance)
165koz 135koz 40koz > 330kozCash Costs (US$/Oz Sold)H1/16A
US$600 US$475 US$460 < US$600/ozAISC (US$/Oz Sold) H1/16A
US$900 US$775 US$640 < US$800/oz
Source: Company Guidance.
Refer to Slide 44 “NI 43-101 Disclosure”. Refer to slide 2 “Cautionary Language” use of Non-GAAP measures..

7TSX:NMI
Strong Financial Position
(11.0%)
(9.3%)
(6.5%)
(2.6%)
(1.6%)
2.0%
2.9%
6.4%
6.6%
17.6%
25.2%
Northern Star
Richmont
Kirkland Lake (Pro-Forma)
Klondex
Regis
Alamos
Guyana
Detour
OceanaGold
Torex
New Gold
1 Source: Company filings and Capital IQ at September 28, 2016. 2 Includes Pro-Forma cash from Newmarket of US$69.9 million converted at 1.31 CAD/USD. Refer to Slide 2 “Use of Non-GAAP Measures” .
$57 $57
$35
$35
$92
Kirkland Lake Newmarket Combined H1 2016
CASH 2 C$276 millionCash & cash equivalents
DEBT C$119 million convertible debentures
KLG.DB: 6% $15.00 conversion priceC$56.9 million mature Jun/2017
KLG.DB.A: 7.5% $13.70 conversion priceC$62.1 million mature Dec/2017
ISSUED AND OUTSTANDING
201.9 million
Net Debt (Cash) / Market Capitalization(1,2)
Combined Free Cash Flow Profile (C$ millions; H1 2016)

8TSX:NMI
Diversified Portfolio of High Quality AssetsDiversified Production from Seven Mines and Five Mills
Strong Pipeline of Growth Projects
Significant Exploration Potential
• Macassa: Cornerstone, high-grade operation (average reserve grade of 19.2 g/t)
• Fosterville: Flagship operation continuing to demonstrate record production and record grades
• Taylor: Exciting newly-built mine with exploration upside to drive future growth
• Holt-Holloway: Sustainable and profitable production
• Cosmo: New near mine discoveries support improved operations
• Stawell: 30 years of continuous production with near mine exploration discovery
• Holt Mine Complex (Zone 7): Planned production in 2018 will provide >25kozs per year to the Holt Mine production profile
• Hislop Mine: Potential development asset (shallow open pit opportunity proximal to mill)
• Maud Creek: PEA-stage project planned to produce an average of ~50koz Au/year leveraging excess capacity at the 100% owned Union Reefs mill
• Big Hill: Low-cost, shallow oxide open pit opportunity within existing Stawell mining lease
• Kirkland Lake Camp: Drilling to test the extension of the SMC and the historic ‘04/Main break at depth
• Porcupine-Destor Fault Zone: Focus to increase mine-life, as well as drill testing a 120km strike length of prospective ground for new discoveries
• Victoria: New high-grade discovery at Fosterville, active drilling on Aurora B discovery at Stawell, district scale land positions
• Northern Territory: New discoveries at Cosmo including Redbelly & Taipan Lode, with continued exploration success at Sliver Lode
Refer to Reserve and Resource Statements in Appendix of this presentation. Refer to Slide 31 “NI 43-101 Disclosure”.
9TSX:NMI
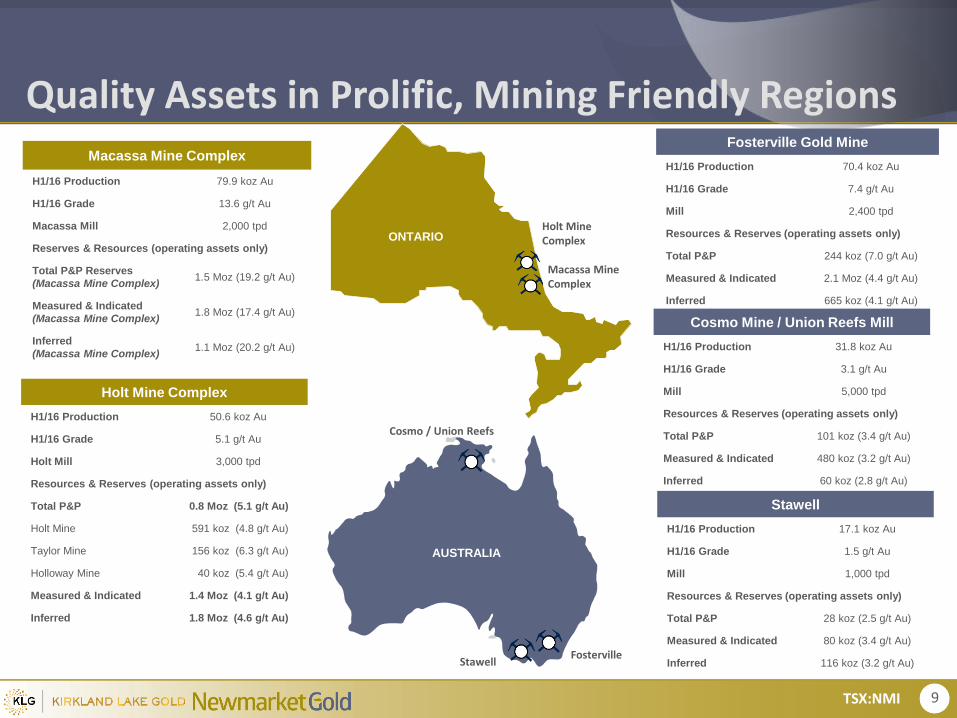
Quality Assets in Prolific, Mining Friendly Regions
Holt Mine Complex
H1/16 Production 50.6 koz Au
H1/16 Grade 5.1 g/t Au
Holt Mill 3,000 tpd
Resources & Reserves (operating assets only)
Total P&P 0.8 Moz (5.1 g/t Au)
Holt Mine 591 koz (4.8 g/t Au)
Taylor Mine 156 koz (6.3 g/t Au)
Holloway Mine 40 koz (5.4 g/t Au)
Measured & Indicated 1.4 Moz (4.1 g/t Au)
Inferred 1.8 Moz (4.6 g/t Au)
Macassa Mine Complex
H1/16 Production 79.9 koz Au
H1/16 Grade 13.6 g/t Au
Macassa Mill 2,000 tpd
Reserves & Resources (operating assets only)
Total P&P Reserves
(Macassa Mine Complex)1.5 Moz (19.2 g/t Au)
Measured & Indicated
(Macassa Mine Complex)1.8 Moz (17.4 g/t Au)
Inferred
(Macassa Mine Complex)1.1 Moz (20.2 g/t Au)
Cosmo / Union Reefs
StawellFosterville
AUSTRALIA
Fosterville Gold Mine
H1/16 Production 70.4 koz Au
H1/16 Grade 7.4 g/t Au
Mill 2,400 tpd
Resources & Reserves (operating assets only)
Total P&P 244 koz (7.0 g/t Au)
Measured & Indicated 2.1 Moz (4.4 g/t Au)
Inferred 665 koz (4.1 g/t Au)
Cosmo Mine / Union Reefs Mill
H1/16 Production 31.8 koz Au
H1/16 Grade 3.1 g/t Au
Mill 5,000 tpd
Resources & Reserves (operating assets only)
Total P&P 101 koz (3.4 g/t Au)
Measured & Indicated 480 koz (3.2 g/t Au)
Inferred 60 koz (2.8 g/t Au)
ONTARIO
Macassa Mine Complex
Holt Mine Complex
Stawell
H1/16 Production 17.1 koz Au
H1/16 Grade 1.5 g/t Au
Mill 1,000 tpd
Resources & Reserves (operating assets only)
Total P&P 28 koz (2.5 g/t Au)
Measured & Indicated 80 koz (3.4 g/t Au)
Inferred 116 koz (3.2 g/t Au)

10TSX:NMI
$3.9
$2.7
$2.5
$2.4
$2.3
$1.8
$1.7
$1.6
$1.2
$1.0
$0.9
$0.7
Detour
New Gold
Alamos
Northern Star
OceanaGold
Torex
Pro Forma
Regis
Guyana
Klondex
Kirkland Lake
Richmont
Increased Scale and Capital Markets ProfilePrice / 2017E Cash Flow1Market Capitalization (C$Bn)1 EV / Production (US$/oz)1
12.4x
11.9x
11.8x
11.7x
11.5x
9.8x
8.3x
7.2x
6.7x
5.7x
5.5x
Alamos
Detour
Klondex
Richmont
Torex
Guyana
Regis
New Gold
OceanaGold
Northern Star
Kirkland Lake
$6,203
$6,174
$6,064
$5,595
$5,131
$5,099
$4,756
$3,938
$3,645
$2,757
$2,223
Torex
Guyana
Detour
Klondex
Alamos
New Gold
Richmont
Regis
OceanaGold
Northern Star
Kirkland LakeGold (PF)
1 Source: Company filings, FactSet and available equity research at October 11, 2016. EV/Production and Cash Flow metrics are broker consensus Refer to Slide 2 “Forward Looking Information”.
Peer Avg. C$2.0B Peer Avg. US$4,936/oz Peer Avg. 9.7x

11TSX:NMI
$19.67
$16.51
$13.35
$7.87
@ $6,000/oz@ $5,000/oz@ $4,000/ozCurrent Price
P / 2017E Cash Flow per Share
Implied Premium to
Current +63% +104% +145%
+85%Implied Premium
to Current+147% +208% +270%
Current Price
Current Price
EV / 2016E Production
Value Creation Opportunity
Kirkland Lake Gold shown pro forma announced Newmarket combination updated Oct 11, 2016; Production and CFPS are consensus estimates
$2,223/oz
2016 Production
$29.12
$24.27
$19.41
$14.56
$7.87
@ 12.0x@ 10.0x@ 8.0x@ 6.0xCurrent Price3.2x
CFPS 2017E

12TSX:NMI
Combined Synergies• High-quality under ground gold mines
o Combined expertise in underground mining provides potential for cost reductions due to shared operational knowledge base
• Tier 1 mining jurisdictionso Australia is the second largest gold producing nation in the worldo Similar geopolitics and foreign exchange metrics
• Combined strong balance sheet and free cash flow will allow new company to withstand fluctuating gold priceso Combined FCF provides self-funding mechanism for pipeline of
development opportunitieso Increased exploration funding to accelerate new discovery
potential in district scale land positions
• Supported by enhanced Board of Directors and Management teamo Addition of technical expertise at the board levelo Two business units can run autonomouslyo Darren Hall will assume the role President, Australian Operations
• Increased scale and capital markets profileo Access to larger institutional shareholder baseo Potential to increase analyst coverageo Enhanced trading liquidity

13TSX:NMI
Kirkland Lake Gold District
• The Kirkland Lake gold camp has been in production for over 100 years
• One of the highest grade gold camps in the world
• Almost 25 Moz’s has been produced to date, from seven mines
• KLG owns five former producing high grade mines with historical production of ~22 Moz’s of gold
• Average head grade of 15.1 g/t
• Currently only mining and exploration on one of these past producers

14TSX:NMI
Macassa Mine Complex OverviewHead Grade (g/t)/ Gold Production (oz)
Prior to 2016 the Company’s year end was May 1 to April 30
F2014A F2015A H12016A
Cash Costs (US$/oz)
$812 $625 $589
AISC (US$/oz) $1,141 $803 $923
• 1,000tpd underground operation • 70% of ore tonnes derived from the higher grade South
Mine Complex, and 30% from the ‘04 Break mineralization• Mining to depths of 5400 feet below surface
• 2,000tpd processing capacity (50% unused)• Conventional CIP milling facility with 4 available mills
grinding to 40 to 45 micron• Recoveries averaging over 95%
• P&P reserves of 1.5 Moz at 19.2 g/t, M&I of 1.8 Moz at 17.4 g/t and Inferred Resources of 1.1M oz at 20.2 g/t
Resources are exclusive of Reserves. Refer to Reserve and Resource Statements in Appendix of this presentation. Refer to Slide 31 “NI 43-101 Disclosure”. Refer to Slide 2 “Use of Non-GAAP Measures” 1 Adjusted to reflect calendar-year production and grade.
Reserves & Resources (Dec. 31, 2014)
144,533155,226 79,983
14.214.4
13.6
Q4/15 Q1/16 Q2/16
Ounces Grade (g/t)
Macassa Mine Complex
SMC
Mineral Reserves (P&P)
1.5 Moz @ 19.2 g/t 2.4M tonnes
0.9 Moz @ 22.3 g/t1.3M tonnes
Mineral Resources (M&I)
1.8 Moz @ 17.4 g/t3.3M tonnes
0.9 Moz @ 22.6 g/t1.3M tonnes
Mineral Resources(Inferred)
1.1 Moz @ 20.2 g/t1.7M tonnes
0.9 Moz @ 22.3 g/t1.2M tonnes
#3 Shaft #2 Shaft

15TSX:NMI
Regional Exploration Across a Prolific Trend
See press release dated January 19, 2016, as filed on SEDAR

16TSX:NMI
South Mine Complex by Level5025 Level
P+P 28,000 Tons @ 0.48 oz/ton 14,000 Oz’sM+I 74,000 Tons @ 0.42 oz/ton 32,000 Oz’s
5300 Level
P+P 561,000 Tons @ 0.47 oz/ton 261,000 Oz’sM+I 245,0000 Tons @ 0.43 oz/ton 107,000 Oz’s
5400 Level
P+P 370,000 Tons @ 0.61 oz/ton 226,000 Oz’sM+I 174,000 Tons @ 0.42 oz/ton 72,000 Oz’s
5600 Level
P+P 239,000 Tons @ 0.77 oz/ton 183,000 Oz’sM+I 186,000 Tons @ 0.63 oz/ton 117,000 Oz’s
5700 Level
P+P 202,000 Tons @ 1.03 oz/ton 208,000 Oz’sM+I 164,000 Tons @ 0.91 oz/ton 96,000 Oz’s
OPEN
*Drawing not to scale, Refer to slide 2 “Cautionary Language”, for Non-GAAP Measures.
5800 to 6600 Level
P+P 50,000 Tons @ 0.83 oz/ton 41,000 Oz’s
M+I 551,000 Tons @ 0.91 oz/ton 499,000 Oz’sOPEN
OPEN
Fully developed and
currently in production
6 stopes in production
Currently in development, while ramp
towards 5700 Level continues
17TSX:NMI
High-Quality, High-Grade - Fosterville Mine
U.S. Dollars unless stated otherwise 1. excludes corporate G&A, see page 26-28 for further 43-101 disclosure
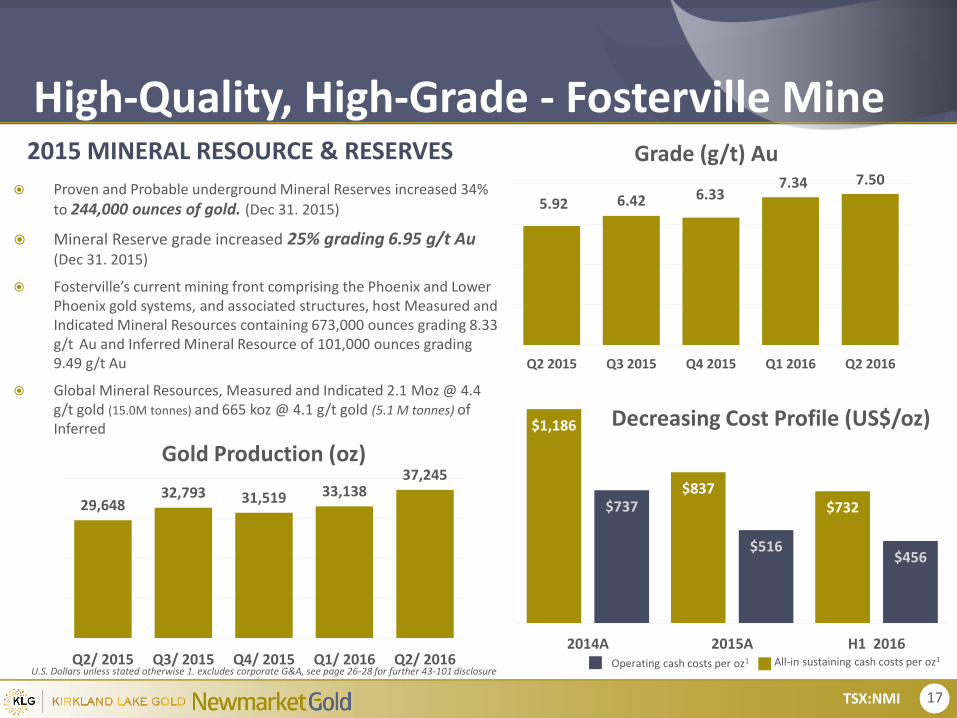
2015 MINERAL RESOURCE & RESERVES
Proven and Probable underground Mineral Reserves increased 34%
to 244,000 ounces of gold. (Dec 31. 2015)
Mineral Reserve grade increased 25% grading 6.95 g/t Au (Dec 31. 2015)
Fosterville’s current mining front comprising the Phoenix and Lower Phoenix gold systems, and associated structures, host Measured and Indicated Mineral Resources containing 673,000 ounces grading 8.33 g/t Au and Inferred Mineral Resource of 101,000 ounces grading 9.49 g/t Au
Global Mineral Resources, Measured and Indicated 2.1 Moz @ 4.4 g/t gold (15.0M tonnes) and 665 koz @ 4.1 g/t gold (5.1 M tonnes) of Inferred $1,186
$837$732$737
$516$456
2014A 2015A H1 2016
Decreasing Cost Profile (US$/oz)
Operating cash costs per oz1 All-in sustaining cash costs per oz1
29,64832,793 31,519 33,138
37,245
Q2/ 2015 Q3/ 2015 Q4/ 2015 Q1/ 2016 Q2/ 2016
Gold Production (oz)
5.92 6.42 6.337.34 7.50
Q2 2015 Q3 2015 Q4 2015 Q1 2016 Q2 2016
Grade (g/t) Au

18TSX:NMI
Fosterville Mine Drilling Success
Harrier Drill Drive
12.5 g/t Au over 2.4m
12.75 g/t Au over 4.5m
Lower Phoenix
Drill Targets
NORTHSOUTH
Mineral Resources, Reserves and mining as at December 31, 2015
Harrier Decline
Harrier
Consistently intersecting high grade gold in multiple zones: Harrier, Lower Phoenix, Lower Phoenix South and Lower Phoenix North with grade increasing at depth on all zones
Key intercepts Lower Phoenix South and North: 12.75 g/t Au over 4.5 metres , 13.4g/t Au over 3.8m, 12.5 g/t Au over 2.4 metres, & 7.3 g/t Au over 13.9 metres
*New High Grade Visual Gold intercepts Harrier Gold Zone; 64.8 g/t Au over 4.3m, 46.2 g/t Au over 6.6m
4.4 g/t Au over 6.1m
6.5 g/t Au over 4.2m
9.3 g/t Au over 3.3m
6,00
0mN
9.2 g/t Au over 11.8m
7.3 g/t Auover 13.9m
80
50
mN
6.2 g/t Au over 1.9m
22.1 g/t Au over 3.3mFirst recorded visualGold from Harrier
16.6 g/t Au over 3.05m
11.99 g/t Au over 3.4m
14.25 g/t Au over 3.6m
11.1 g/t Au over 4.9m
12.8 g/t Au over 8.5m
112 g/t Auover 11.9m
645 g/t Au over 3.4m
501 g/t Au over 4.5m
386 g/t Au over 3.4m16.4 g/t Au over 16.5m
73.2 g/t Au over 7.8m
9 Drill Rigs Operating
64.80 g/t Au over 4.3m (VG)
46.2 g/t Au over 6.6m (VG)
283 g/t Au over 2.8m
13.4 g/t Au over 3.8m
75.7 g/t Au over 5.4m
194 g/t Au over 3.1m

19TSX:NMI
Fosterville Mine Life Expansion
Lower Phoenix
Phoenix
NORTHSOUTH
Mineral Resources, Reserves and MINING as at December 31, 2015
Harrier Decline
Harrier
6,00
0mN
BLOCK A
BLOCK C
BLOCK D
Harrier Drill Drive
1km step-out drillingH2/2016 drill results
5,4
50
mN
BLOCK B
Current Mining Front, UG Reserve 244,000 ounces at 6.95g/t Au with Measured and Indicated resources of 673,000 ounces at 8.33 g/t Au and Inferred Resources of 101,000 ounces at 9.49 g/t Au as of Dec 2015
With additional drilling success blocks A,B, C and D are targeted to add +5 years of additional reserves on top of current reserves and resources (Block B drilling underway testing 1000 metres down plunge from current resources/reserves)
Grade increasing with depth at Harrier, converting resources to reserves and growing resources
Mill Capacity +850k tpa, currently at ~700k tpa. opportunity to open additional mining fronts (three total) in Block A and Block D
Additionally there are over 20 kilometres of potential gold bearing structures on the 500km2 Fosterville property highlighting the exceptional potential of this district
= Visual gold elevation depth, increasing with depth
Current Mining Front
80
50
mN

20TSX:NMI
A New Mine with Significant Potential - Taylor
Resources are exclusive of Reserves. See Reserve and Resource Statements in Appendix of this presentation and refer to Slide 31 “NI 43-101 Disclosure”.
Reserves & Resources (Dec. 31, 2014)Historical Production & Grade (g/t) – by quarter
• St Andrew declared commercial production at Taylor in November 2015• Estimated annual production of between 30 - 40 koz’s of gold
(~550tpd run rate)• Ore is trucked approximately 70km to the Holt Mill for crushing and processing• Mineralization remains open at depth and along strike• Excellent potential for exploration success with planned drilling
View looking north surface
ZoneP&P
ReservesM&I Resources
Inferred
Resources
WPZ156 koz’s
0.8Mt @ 6.3 g/t Au
239 koz’s
1.6Mt @ 4.6 g/t Au
222 koz’s
1.7Mt @ 4.0 g/t Au
Shoot Zone- 116 koz’s
0.7Mt @ 5.2 g/t Au
3 koz’s
20kt @ 5.2 g/t Au
Shaft Zone- - 32 koz’s
205kt @ 5.0 g/t Au
All production prior to January 26,2016 not attributable to KL Gold as acquisition of St Andrew did not close until this date. Q4/15 production only consists of 2 months.
7,347 11,4080
2000
4000
6000
8000
10000
12000
Q1/16 Q2/16Ounces Grade (g/t)
7.6 g/t
7.6 g/t
150m
100m
250m
350m
Bourgois Claim
Bulk Sample
#1
Bulk Sample
#2
1004 Lens
1006-1 Lens
1008-1 Lens
1008-2 Lens
1006-2 Lens
500m
OPEN
21TSX:NMI
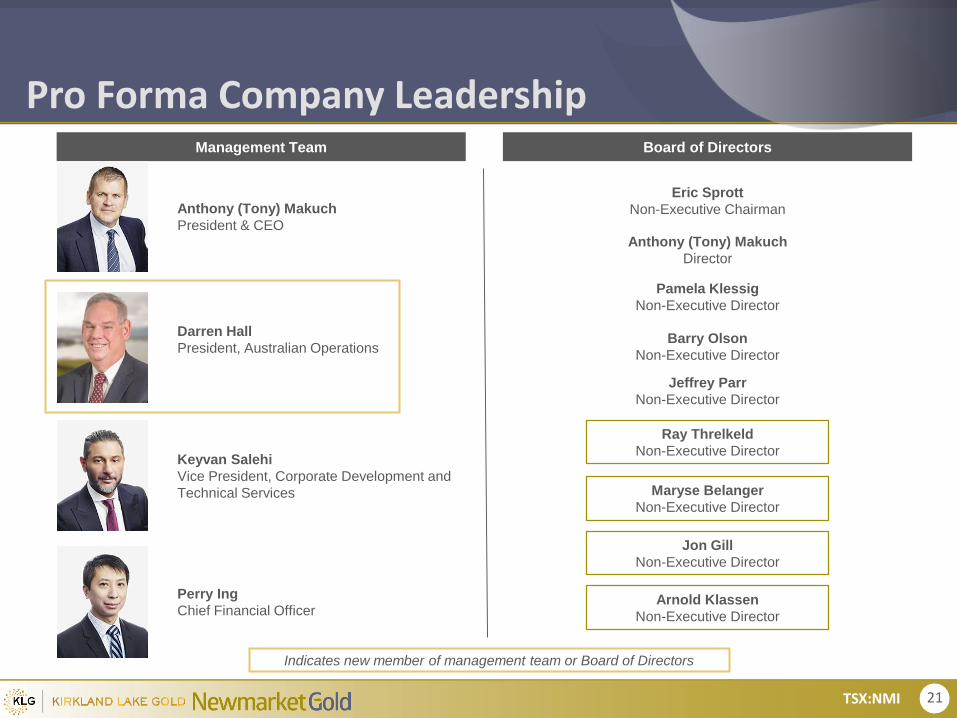
Pro Forma Company LeadershipBoard of DirectorsManagement Team
Anthony (Tony) Makuch
President & CEO
Perry Ing
Chief Financial Officer
Darren Hall
President, Australian Operations
Keyvan Salehi
Vice President, Corporate Development and
Technical Services
Eric Sprott
Non-Executive Chairman
Pamela Klessig
Non-Executive Director
Anthony (Tony) Makuch
Director
Barry Olson
Non-Executive Director
Jeffrey Parr
Non-Executive Director
Ray Threlkeld
Non-Executive Director
Maryse Belanger
Non-Executive Director
Indicates new member of management team or Board of Directors
Jon Gill
Non-Executive Director
Arnold Klassen
Non-Executive Director

22TSX:NMI
Pro Forma Vs Peer Group
2016 H1 Production, Cost, and Free Cash Flow versus Peers
Market Capitalization C$M $1,651 $3,895 $4,530 $2,752 $2,542 $1,843
Enterprise Value C$M $1,486 $4,177 $4,394 $3,230 $2,584 $2,245
Jan 1 - Jun 30 (H1) 2016
Production koz AuEq 250 266 343 263 187 121
Cash Cost US$/oz $662 $664 $491 $497 $778 $571
AISC US$/oz $924 $925 $689 $801 $1,012 $754
Operating Cash Flow C$M $146 $161 $200 $157 $89 $53
Free Cash Flow C$M $92 $85 $121 ($73) ($30) $7
Annualized FCF Yield % 11.1% 4.4% 5.3% (5.3%) (2.4%) 0.7%
Annualized Multiples
P / 2016 OCF ratio 5.6x 12.1x 11.3x 8.8x 14.2x 17.4x
EV / 2016 Production US$/oz $2,974 $7,837 $6,414 $6,139 $6,906 $9,272
Note: As at October 11, 2016, OCF and FCF are shown prior to changes in net working capital, debt repayment and dividends
23TSX:NMI
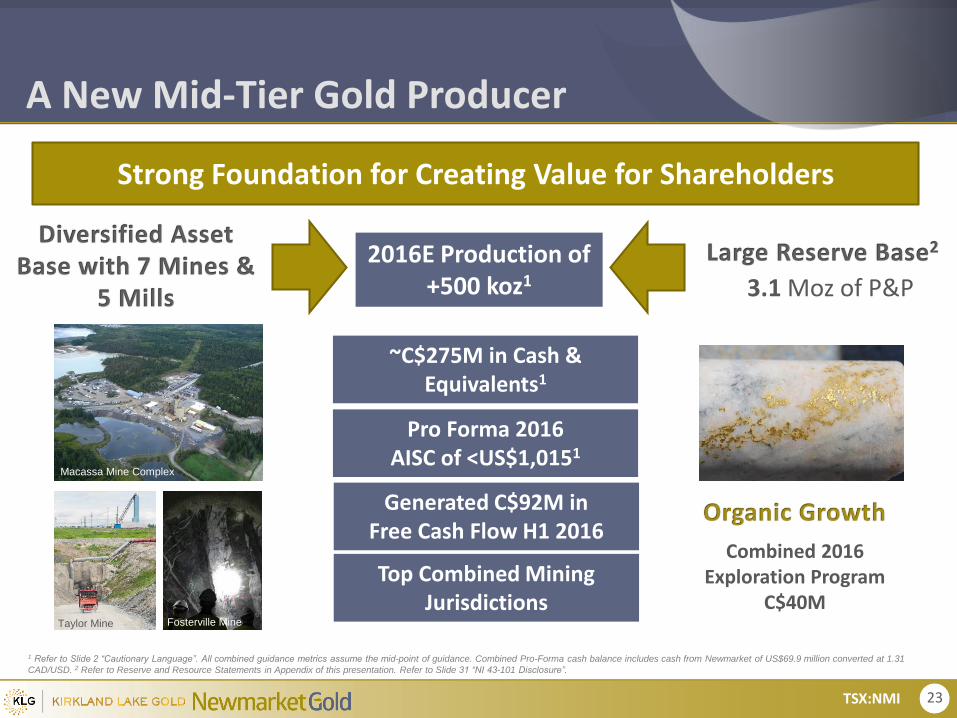
A New Mid-Tier Gold Producer
Strong Foundation for Creating Value for Shareholders
Pro Forma 2016 AISC of <US$1,0151
Combined 2016Exploration Program
C$40M
~C$275M in Cash & Equivalents1
Generated C$92M in Free Cash Flow H1 2016
3.1 Moz of P&P
1 Refer to Slide 2 “Cautionary Language”. All combined guidance metrics assume the mid-point of guidance. Combined Pro-Forma cash balance includes cash from Newmarket of US$69.9 million converted at 1.31
CAD/USD. 2 Refer to Reserve and Resource Statements in Appendix of this presentation. Refer to Slide 31 “NI 43-101 Disclosure”.
Taylor Mine Fosterville Mine
Macassa Mine Complex
2016E Production of +500 koz1
Top Combined Mining Jurisdictions

24TSX:NMI
APPENDIX
Notes, additional disclosure and other information

25TSX:NMI
Transaction Overview

26
$11.12
201.9
211.6
$2,353
$276
$123
$2.2
Share Price (TSX) C$
Basic Shares
OutstandingM
Fully Diluted Shares
Outstanding (ITM)M
Fully Diluted Market
Capitalization (ITM)C$ M
Cash & Short-Term
InvestmentsC$ M
Debt C$ M
Enterprise Value C$ Bn
$4.83
178.0
191.8
$926
$92
$4
$0.8
$11.12
117.4
120.5
$1,339
$184
$119
$1.3
Pro Forma1
Pro Forma Capitalization Summary
Source: Company disclosure. Note: Newmarket balance sheet metrics converted at 1.31 CAD/USD. 1Pro Forma figures calculated based on exchange ratio of 2.1053 Newmarket shares per Kirkland Lake Gold share and concurrent share consolidation of 0.475 post-consolidation share for each existing share, subject to the approval of the Newmarket shareholders. Cash & Short-Term Investments does not include proceeds from the exercise of in-the-money options or the impact of transaction costs.
(Sept 28 2016)

27
(40%)
(20%)
0%
20%
40%
60%
80%
100%
120%
140%
Mar-16 Apr-16 May-16 Jun-16 Jul-16 Aug-16
Silver Standard GDXJ
(20%)
0%
20%
40%
60%
80%
100%
120%
Nov-15 Dec-15 Jan-16 Feb-16 Mar-16 Apr-16 May-16
Kirkland Lake GDXJ
Kirkland Lake – St Andrew Goldfields (November 2015)
Settle Analysis – Case Studies
Silver Standard – Claude (March 2016)
Source: Company filings and FactSet.
Days to recover
from settle: 53 Days to recover
from settle: 40
Announcement Date:
March 7th, 2016Announcement Date:
November 16th, 2015
1-Day Settle: (12%) 1-Day Settle: (11%)
Transaction
CloseTransaction
Close
Considerable share price settle on announcement, however acquirer's share price eventually
recovers once market fully appreciates the strategic merits of the transaction

28
Analyst Coverage
Firm Analyst
GMP Oliver Turner
Dundee Securities Ron Stewart
CIBC World Markets Cosmos Chiu
Macquarie Capital Markets Michael Siperco
BMO Capital Markets Brian Quast
M Partners Stuart McDougall
Mirabaud Securities Richard Morgan
Scotiabank Craig Johnston
PI Financial Philip Ker
National Bank Financial Raj Ray
Clarus Securities Jamie Spratt
Investec Bank Hunter Hillcoat
Pareto Securities John McClintock
KIRKLAND LAKE GOLD and NEWMARKET GOKD ARE FOLLOWED BY THE ANALYSTS LISTED ABOVE. THIS LIST IS PROVIDED FOR INFORMATION PURPOSES ONLY AND IS SUBJECT TO CHANGE AS
COVERAGE IS ADDED OR DROPPED BY A FIRM.
OPINIONS, ESTIMATES OR FORECASTS REGARDING KIRKLAND LAKE GOLD'S PERFORMANCE THAT ARE MADE BY THESE ANALYSTS ARE THEIRS ALONE AND DO NOT REPRESENT THE OPINIONS,
ESTIMATES OR FORECASTS OF KIRKLAND LAKE GOLD OR ITS MANAGEMENT.
KIRKLAND LAKE GOLD NEWMARKET GOLD
Firm Analyst
Beacon Securities Limited Michael Curran
BMO Brian Quast
Cormark Securities Richard Gray
Laurentian Bank Securities Pierre Vaillancourt
Raymond James Chris Thompson
RBC Capital Markets Stephen D. Walker
Rodman & Renshaw Heiko Ihle
GMP Securities Steven Butler
PI Financial Phil Ker
M Partners Stuart McDougall
National Bank Financial Adam Melnyk

29TSX:NMI
SELECTED HIGHLIGHTS
AB-15-12 11.7 g/ 0.3 metres
0.34 opt/ 1.0 feet
AB-15-233,241.4 g/ 0.7 metres
94.54 opt/ 2.3 feet
11.7 g/ 0.3 metres
0.34 opt/ 1.0 feet
AB-15-5312.3 g/ 0.5 metres
0.36 opt/ 1.7 feet
AB-15-91646.3 g/ 0.9 metres
18.85 opt/ 2.8 feet
including1,783.2 g/ 0.3 metres
52.01 opt/ 1.0 feet
And89.5 g/ 0.3 metres
2.61 opt/ 1.0 feet
See press release dated November 3, 2015, as filed on SEDAR
Regional Drilling – Section Looking East

30
PDFZ Properties
Holt, Holloway, Taylor HOLT MINE COMPLEX (Producing Assets)
Hislop Care & Maintenance
Ludgate, Aquarius Exploration Targets with existing resources
Garrison Creek Exploration Target
120km strike of contiguous land straddling the Porcupine-Destor Fault Zone
Blackfox Mine & Greyfox Deposit
(Primero Mining)
Aquarius
Hislop
Ludgate
Garrison
Creek
120km
N
Fenn-Gibb Deposit
(Tahoe Resources)

31
90,676
107,733
57,818
115,000
2014A 2015A 2016H1
Mid-Point2016FY Guidance
Holt Mine Complex Overview
Gold Production (oz)
Mine Overview Stats
2014A 2015A H1 2016
Gold Production(oz)
90,676 107,733 57,818
Gold Grade (g/t) 4.3 5.3 5.0
Cash Costs (US$/oz)
$851 $698 $750
AISC (US$/oz) $1,072 $942 $938
• Three producing mines (Holt, Holloway and Taylor) contribute ~2,200tpd• Holt contributes ~1,200tpd• Holloway contributes ~450tpd• Taylor contributes ~ 550tpd
• 3,000tpd processing capacity (30% unused)• Conventional CIL milling facility• 3 mill grinding circuit
• P&P reserves of 0.8 Moz at 5.1 g/t, M&I of 1.4 Moz at 4.1 g/t and Inferred Resources of 1.8 Moz at 4.6 g/t
• 2016 exploration is focused on increasing the level of resources and reserves to boost mine life
• In Q4 will commence drill testing targets with potential to add to the production profile in years to come
4.28
5.28 4.97
0 2015A
Mill Head Grade (g/t Au)
Resources are exclusive of Reserves. Refer to Reserve and Resource Statements in Appendix of this
presentation. Refer to Slide 44 “NI 43-101 Disclosure”. Refer to Slide 2 “Use of Non-GAAP Measures”.
32
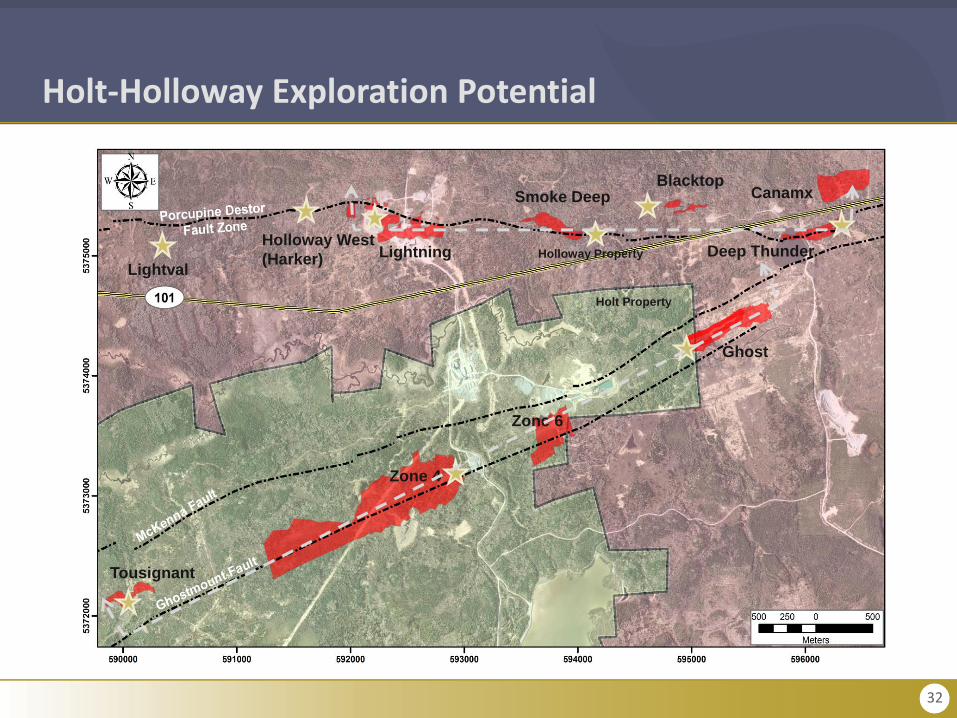
Holt-Holloway Exploration Potential
Lightning
Smoke DeepBlacktop
Canamx
Deep Thunder
Ghost
Zone 4
Zone 6
Tousignant
Holt Property
Holloway PropertyHolloway West
(Harker)Lightval

33
Holt Exploration Targets
Tousignant Deposit
Zone 6
Zone 4
Mattawasaga Pits
Ghost Zone
Surface
1075m Level
925m Level
435m Level
Current drift
development
Long section view looking north
Zone 4 West Extension
500 m1 km 02 km3 km 1 km 1.5 km
TOUSIGNANT TARGETGHOST TARGET
ZONE 4 TARGET
P&P Reserves M&I Resources Inferred Resources
Holt Mine (All Zones)591 koz
3.9Mt @ 4.8 g/t Au
957 koz
7.6Mt @ 3.9 g/t Au
1.2 Moz
7.9Mt @ 4.7 g/t Au
Zone 4
(includes Zone 4 East)
201 koz
1.5Mt @ 4.3 g/t Au
544 koz
4.4Mt @ 4.0 g/t Au
23 koz
0.2Mt @ 4.0 g/t Au
Zone 4 West Extension - -861 koz
5,552,000 @4.82g/t Au
Zone 6147 koz
0.8Mt @ 6.0 g/t Au
48 koz
0.2Mt @ 7.6 g/t Au
28 koz
0.1Mt @ 7.9 g/t Au
Ghost Zone152 koz
1.0Mt @ 4.5 g/t Au
159 koz
1.4Mt @ 3.4 g/t Au
92 koz
0.8Mt @ 3.7 g.t Au

34
Surface
Shaft Bottom
(867m)
Long section view looking north
SMOKE DEEP TARGET
(down plunge)
SMOKE DEEP (up-dip) &
BLACKTOP (west extension)
TARGET
HOLLOWAY NORTH
TARGET
500 m 1 km 3 km
DEEP THUNDER
TARGET
(along strike)
P&P Reserves M&I Resources Inferred Resources
Holloway Mine
(All Zones)
40 koz
0.2Mt @ 5.4 g/t Au
117 koz
0.8Mt @ 4.6 g/t Au
389 koz
0.2Mt @ 4.9 g/t Au
Smoke Deep Zone24 koz
0.1Mt @ 5.3 g/t AuN/A N/A
Blacktop Zone16 koz
89kt @ 5.5 g/t AuN/A N/A
Middle Zone -24 koz
0.2Mt @ 4.2 g/t AuN/A
Deep Thunder/
Canamax- -
350 koz
2.2Mt @ 4.9 g/t Au
Long section view looking north
Holt Exploration Targets

35
77,740
63,255
31,782
60,000
2014A 2015A 2016H1
2016FYGuidance
Cosmo Mine Overview
Gold Production (oz)
Mine Overview Stats
2014A 2015A H1 2016
Gold Production
(oz)77,740 63,255 31,782
Gold Grade (g/t) 3.14 2.99 3.05
Recovery (%) 88.9 90.7 92.4
Cash Costs
(US$/oz)$1,000 $917 $957
AISC (US$/oz) $1,263 $1,154 $1,021
• Located in the Northern Territories which also hosts additional additional assets including Union Reefs, Maud Creek, and Howley
• ~800ktpa underground operation with decline access employing primarily Avoca mining method
• Mill located at Union Reefs, 67km away from Cosmo, has 2.0Mtpa processing capacity (60% unused) and conventional circuit – 3 stage crush, 2 stage ball, gravity and CIL, with regional toll milling opportunities
• P&P reserves of 101koz at 3.38g/t Au, M&I of 480koz at 3.22 g/t and Inferred Resources of 60koz at 2.76 g/t
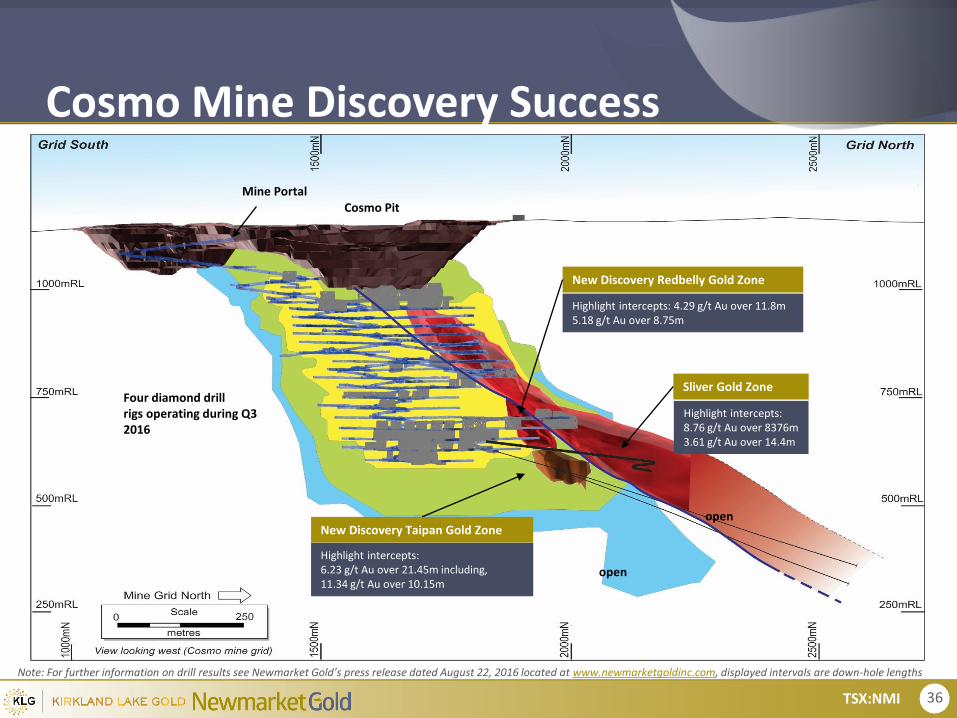
• 2016 drill campaign has 4 drills active on Cosmo Deeps resulting in 2 new discoveries:
• Redbelly intercepts include 4.29 g/t over 11.8m (ETW 10.0m) and 5.18 g/t Au over 8.75m (ETW 8.75m)
• Taipan Lode intercepts include 6.23 g/t over 21.45m (ETW 9.0m) and 11.34 g/t over 10.15m (ETW 4.3m)
• Continued drilling success at Sliver with intercepts of 8.76 g/t Au over 8.76 m (ETW 6.8 m) and 3.61 g/t Au over 14.4 m (ETW 12.4 m)
• Completed Western Drill Drive in Apr 2016 to provide platforms for continued exploration
Resources are inclusive of Reserves. Refer to Reserve and Resource Statements in Appendix of this
presentation. Refer to Slide 44 “NI 43-101 Disclosure”. Refer to Slide 2 “Forward Looking Information”.
Refer to Slide 2 “Use of Non-GAAP Measures”.
36TSX:NMI
Cosmo Mine Discovery Success
New Discovery Redbelly Gold Zone
New Discovery Taipan Gold Zone
Sliver Gold Zone
Highlight intercepts:8.76 g/t Au over 8376m3.61 g/t Au over 14.4m
Highlight intercepts: 4.29 g/t Au over 11.8m5.18 g/t Au over 8.75m
Highlight intercepts:6.23 g/t Au over 21.45m including,11.34 g/t Au over 10.15m
Cosmo PitMine Portal
open
open
Four diamond drill rigs operating during Q3 2016
Note: For further information on drill results see Newmarket Gold’s press release dated August 22, 2016 located at www.newmarketgoldinc.com, displayed intervals are down-hole lengths

37TSX:NMI
Maud Creek Gold Project Opportunity
Cosmo Gold Mine currently processes ~800,000 tpa through the Union Reefs Mill ( 2016 guidance ~ 60k ounces)
Union Reefs mill has 1.2Mt of excess capacity to treat additional ore and is located 67km from Cosmo and 144km from Maud Creek
1. The PEA is preliminary in nature and is based on a number of assumptions that may be changed in the future as additional information becomes available. The PEA includes inferred mineral resources that are considered too speculative geologically to have the economic considerations applied to them that would enable them to be categorized as mineral reserves, and there is no certainty that the PEA will be realized. The Maud Creek Gold Project PEA Technical Report is available on Sedar and www.newmarketgoldinc.com and was compiled by Peter Fairfield, Principal Consultant (Project Evaluation), BEng (Mining), FAusIMM CP (Mining) of SRK Consulting (Australasia) Pty Ltd. By virtue of his education, membership to a recognised professional association and relevant work experience, Peter Fairfield is an independent "Qualified Person" as such term is defined in NI 43-101. Mineral resources that are not mineral reserves do not have demonstrated economic viability. For full details please see press release dated May 16, 2016
Base Case Highlights Utilizing the Union Reef Mill
PEA used base case parameters of US$1,200/ oz (AUD$1,550) gold price and an exchange rate (Us to AUD) of 0.77
Pre-Tax NPV5% US$155 million
Internal Rate of Return 116%
After-Tax NPV5% US$105 million
Internal Rate of Return 80%
Pay Back 1.25 years
Pre-Production Capital Cost US$32 million
Mine Life 9.5 years
Diluted Gold Grade 4.2 g/t gold
Gold Recovery (Oxide/Transitional) 85%
Gold Recovery (sulphide) 95%
LOM Recovered Gold 496,000 ounces
Average Annual Production 52,000 ounces
LOM Cash Operating Cost US$632
100% owned & operating Union Reef Mill

38
39,230 36,321
17,083
35,000
Q2 2015 Q3 2015 Q4 2015
2016FYGuidance
Stawell Mine Overview
Gold Production (oz)
Mine Overview Stats
2014A 2015A H1 2016
Gold Production
(oz)39,230 36,321 17,083
Gold Grade (g/t) 1.67 1.56 1.46
Recovery (%) 78.8 80.8 79.8
Cash Costs
(US$/oz)$1,151 $917 $1,143
AISC (US$/oz) $1,193 $1,063 $1,264
• Underground operation with decline access employing open stoping with either CRF or combinations of CRF and rock fill or all rock fill with pillars
• Current mining fronts comprised of Magdala and surface oxides stockpiles
• 1.0 Mtpa processing capacity (20% unused); conventional crush-grind followed by sulphide flotation and CIL
• Open Pit, Big Hill P&P Reserves of 138 koz at 1.36 g/t Au, M&I of 166 koz at 1.52 g/t and Inferred Resources of 2 koz at 1.15 g/t
• 2016 Drill Campaign has 2 drills active on the East Flank (mining traditionally focused on West Flank with 2.3 Moz of past production):
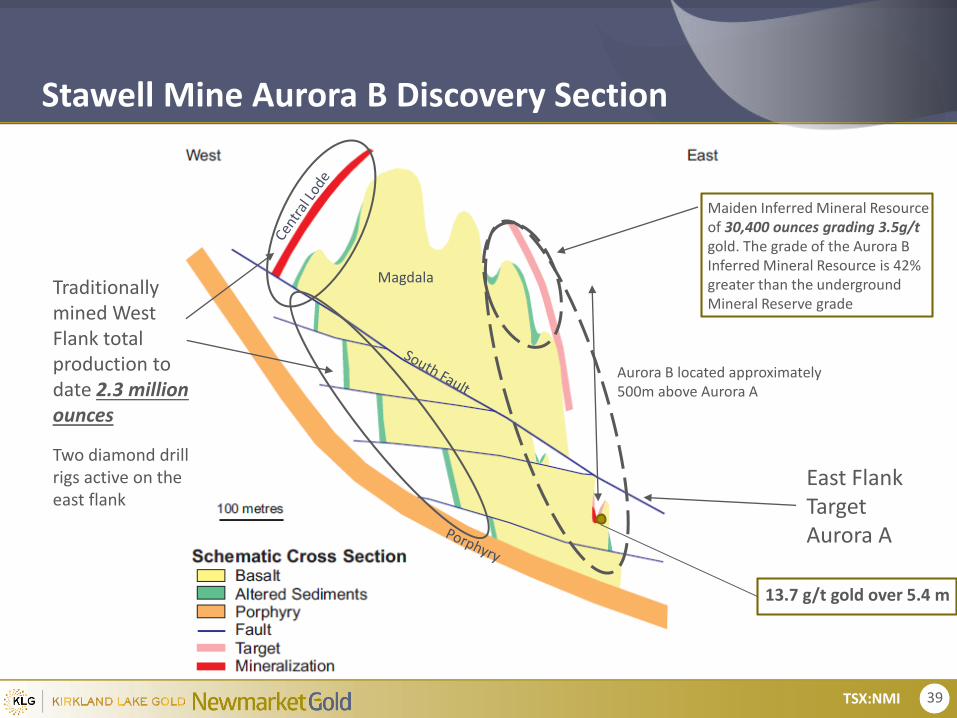
• Aurora B discovery on East Flank with maiden resource of 30,400oz at 3.5 g/t
• Intercepts include 13.7 g/t over 5.4m
• Big Hill Gold Project is a low cost, shallow oxide open pit opportunity adjacent to Stawell
• Currently awaiting permitting process
Resources are inclusive of Reserves. Refer to Reserve and Resource Statements in Appendix of this
presentation. Refer to Slide 44 “NI 43-101 Disclosure”. Refer to Slide 2 “Forward Looking Information”.
Refer to Slide 2 “Use of Non-GAAP Measures”.
2016H1
39TSX:NMI
Maiden Inferred Mineral Resource of 30,400 ounces grading 3.5g/t gold. The grade of the Aurora B Inferred Mineral Resource is 42% greater than the underground Mineral Reserve grade
East Flank TargetAurora A
Traditionally mined West Flank total production to date 2.3 million ounces
Magdala
13.7 g/t gold over 5.4 m
Aurora B located approximately 500m above Aurora A
Two diamond drill rigs active on the east flank
Stawell Mine Aurora B Discovery Section

40TSX:NMI
Australia Organic Growth Opportunities
• Excess mill capacity, 66% unused +1.2M tonnes• New discoveries including Redbelly & Taipan Lode• Continued exploration success on the Sliver Lode • Completed PEA on the Maud Creek development stage Gold Project• Potential toll milling opportunities
• Excess mill capacity, 18% unused +150k tonnes• Extensive ongoing drilling. Currently 9 drill rigs turning from surface and underground• Up & down plunge expansions of high grade Phoenix/ Lower Phoenix • Interception of first visual gold from the Harrier location• Review of brownfield targets • Gravity circuit operational
• Active drilling on the Aurora B discovery• Big Hill Gold Project in permitting - low cost, shallow oxide open pit opportunity
within the mining lease
2016 Growth & Exploration Program Budget of $US10-15 million
Fosterville
Cosmo
Stawell
Significant investment in growth of US$19.4 million over the past 12 months has resulted in 3 new mine site discoveries and increased resources
9
4
2
Drills active
Drills active
Drills active

41
Kirkland Lake – Mineral Reserve Estimates
Resources are exclusive of Reserves
As at December 31, 2014
PROVEN PROBABLE PROVEN & PROBABLE
RESERVE AREA (Project/Mine) Tonnes Grade Ounces Tonnes Grade Ounces Tonnes Grade Ounces
000's g/t 000's 000's g/t 000's 000's g/t 000's
04 & Main Break 494 14.7 236 529 16.5 278 1,023 15.8 514
South Mine Complex (SMC) 314 17.5 177 1,016 23.7 773 1,330 22.3 949
MACASSA MINE COMPLEX 808 15.8 412 1,545 21.3 1,051 2,354 19.2 1,463
Property Wide Targets - - - - - - - - -
Kirkland Lake Properties 808 15.8 412 1,545 21.3 1,051 2,354 19.2 1,463
Holt Mine 1,452 4.3 199 2,414 5.1 392 3,866 4.8 591
Holloway Mine - - - 233 5.4 40 233 5.4 40
Taylor Mine - - - 774 6.3 156 774 6.3 156
HOLT MINE COMPLEX 1,452 4.3 199 3,421 5.4 588 4,873 5.0 787
Hislop Mine - - - 280 5.2 46 280 5.2 46
PDFZ Properties 1,452 4.3 199 3,701 5.4 634 5,153 5.0 833
TOTAL RESOURCES (Company Wide) 2,260 8.4 611 5,246 10.0 1,685 7,507 9.6 2,296
Refer to Slide 44 “NI 43-101 Disclosure”.

42
Kirkland Lake – Mineral Resource Estimates
Resources are exclusive of Reserves
As at December 31, 2014
MEASURED INDICATED MEASURED & INDICATED INFERRED
RESOURCE AREA (Project) Tonnes Grade Ounces Tonnes Grade Ounces Tonnes Grade Ounces Tonnes Grade Ounces
000's g/t 000's 000's g/t 000's 000's g/t 000's 000's g/t 000's
04 & Main Break 964 13.7 430 1,041 14.4 483 2,006 14.1 913 440 14.1 201
South Mine Complex (SMC) 30 12.7 12 1,249 23.0 917 1,279 22.6 929 1,232 22.3 876
MACASSA MINE COMPLEX 994 13.7 442 2,290 18.9 1,400 3,285 17.4 1,842 1,671 20.2 1,077
Property Wide Targets 9 17.1 5 518 12.0 200 527 12.0 203 246 12.7 100
Kirkland Lake Properties 1,003 13.7 447 2,809 17.8 1,599 3,812 16.8 2,047 1,917 19.2 1,177
Holt 3,702 4.0 473 3,861 3.9 485 7,563 3.9 957 7,866 4.7 1,181
Holloway310
4.7 47 482 4.5 70 792 4.6 117 2,479 4.9 389
Taylor - - - 2,323 4.8 356 2,323 4.8 356 1,951 4.1 257
HOLT MINE COMPLEX 4,012 4.1 520 6,666 4.3 911 10,678 4.1 1,430 12,296 4.6 1,827
Hislop --
- 983 4.0 127 983 4.0 127 690 4.2 92
Aquarius - - - 22,300 1.3 926 22,300 1.3 926 9 0.8 N/A
Ludgate - - - 522 4.1 68 522 4.1 68 1,396 3.6 162
Canamax - - - 240 5.1 39 240 5.1 39 170 4.3 23
Clavos (40%) - - - 503 4.8 78 503 4.8 78 318 4.5 48
PDFZ Properties 4,012 4.1 520 31,214 2.1 2,149 35,226 2.4 2,668 14,879 4.6 2,152
TOTAL RESERVES (Company Wide) 5,015 6.0 967 33,803 3.4 3,748 39,038 3.7 4,715 16,796 6.2 3,329
Refer to Slide 44 “NI 43-101 Disclosure”.

43
Newmarket Gold – Mineral Reserve Estimates
Resources are inclusive of Reserves
As at December 31, 2015
Refer to Slide 44 “NI 43-101 Disclosure”.
PROVEN PROBABLE PROVEN & PROBABLE
RESERVE AREA (Project/Mine) Tonnes Grade Ounces Tonnes Grade Ounces Tonnes Grade Ounces
000's g/t 000's 000's g/t 000's 000's g/t 000's
Fosterville UG 232 5.39 40 859 7.36 203 1,091 6.95 244
Fosterville Tailings 571 7.83 144 - - - 571 7.83 144
Stawell UG 51 2.49 4 305 2.47 24 356 2.47 28
Stawell OP - - - 3,123 1.36 138 3,123 1.36 138
Cosmo 487 3.47 54 445 3.28 47 932 3.38 101
Burnside - - - - - - - - -
Union Reefs (OP+UG) - - - 520 3.1 52 520 3.1 52
Pine Creek - - - 1,245 1.55 62 1,245 1.55 62
Maud Creek - - - - - - - - -
TOTAL RESERVES
(Company Wide)1,341 5.61 242 6,497 2.52 526 7,838 3.05 769

44
Newmarket Gold – Mineral Resource Estimates
Resources are inclusive of Reserves
As at December 31, 2015
Refer to Slide 44 “NI 43-101 Disclosure”.
MEASURED INDICATED MEASURED & INDICATED INFERRED
RESOURCE AREA (Project) Tonnes Grade Ounces Tonnes Grade Ounces Tonnes Grade Ounces Tonnes Grade Ounces
000's g/t 000's 000's g/t 000's 000's g/t 000's 000's g/t 000's
Fosterville UG 2,086 3.25 218 12,950 4.57 1,904 15,036 4.39 2,122 5,073 4.08 665
Fosterville Tailings 571 7.83 144 - - - 571 7.83 144 - - -
Stawell UG 56 2.56 5 669 3.49 75 725 3.43 80 1,118 3.24 116
Stawell OP - - - 3,394 1.52 166 3,394 1.52 166 46 1.15 2
Cosmo 1,650 3.63 193 2,987 2.99 288 4,637 3.23 480 678 2.76 60
Burnside - - - 7,358 1.36 322 7,358 1.36 322 6,820 1.46 321
Union Reefs (OP+UG) - - - 3,579 2.38 273 3,579 2.38 273 3,342 2.3 247
Pine Creek - - - 8,393 1.41 379 8,393 1.41 379 2,540 2.34 191
Maud Creek 1,067 5.59 192 5,426 3.04 532 6,493 3.47 724 1,980 2.32 149
TOTAL RESOURCES (Company Wide)
5,430 4.29 752 44,756 2.74 3,939 50,186 2.91 4,691 21,597 2.52 1,751

45
NI 43-101 Disclosure
Kirkland Lake Gold Qualified Person and QA/QC
All production information and other scientific and technical information in this presentation with respect to Kirkland Lake Gold and its assets were prepared in accordance with the standards of the Canadian Institute of Mining, Metallurgy and Petroleum and National Instrument 43-101 – Standards of Disclosure for Mineral Projects (“NI 43-101”) and were prepared, reviewed, verified and compiled by Kirkland Lake Gold’s mining staff under the supervision of Keyvan Salehi, P. Eng., Kirkland Lake Gold’s Vice President of Corporate Development & Technical Services.
The exploration programs across Kirkland Lake Gold’s land holdings in Kirkland Lake were prepared, reviewed, verified and compiled by Kirkland Lake Gold’s geological staff under the supervision of Doug Cater, P.Geo., the Company’s Vice President of Exploration. All reserve and resource estimates for the Kirkland Lake Properties have been audited and verified, and the technical disclosure has been approved, by Kirkland Lake Gold’s independent reserve and resource engineer, Glenn R. Clark, P. Eng., of Glenn R. Clark & Associates Limited. Mr. Clark is a ‘qualified person’ under NI 43-101. The QP’s for the mineral reserves and resources outlined under the PDFZ Properties are Doug Cater, P. Geo, and Keyvan Salehi, P. Eng., the Vice President of Exploration and the Vice President of Corporate Development & Technical Services, respectively, and not considered independent under NI 43-101.
Sample preparation, analytical techniques, laboratories used and quality assurance-quality control protocols used during the exploration drilling programs are done consistent with industry standards and independent certified assay labs.
REFER TO KIRKLAND LAKE GOLD ANNUAL INFORMATION FORM DATED MARCH 10, 2016, AND ST ANDREW GOLDFIELDS LTD. ANNUAL INFORMATION FORM DATED MARCH 27, 2015, AVAILABLE ON SEDAR (www.sedar.com) FOR COMPLETE NI 43-101 NOTES AND DISCLOSURE PERTAINING TO THE RESOURCE AND RESERVE STATEMENTS QUOTED HEREIN.
Newmarket Qualified Person and QA/QC
All production information and other scientific and technical information in this presentation with respect to Newmarket and its assets were prepared in accordance with the standards of the Canadian Institute of Mining, Metallurgy and Petroleum and NI 43-101 and were prepared, reviewed, verified and compiled by Newmarket’s mining staff under the supervision of Mark Edwards, MAusIMM (CP), MAIG and Newmarket’s Geology Manager, Northern Territories, who is the qualified person for the purpose of NI 43-101.
Simon Hitchman, FAusIMM (CP), MAIG, Exploration Manager, Newmarket Gold, is a "qualified person" as such term is defined in National Instrument 43-101 and has reviewed and approved the technical information and data included in this Investor Presentation.
Troy Fuller, MAIG, Geology Manager, Fosterville Gold Mine, Newmarket Gold, is a "qualified person" as such term is defined in National Instrument 43-101 and has reviewed and approved the technical information and data included in this presentation.
Sample preparation, analytical techniques, laboratories used and quality assurance-quality control protocols used during the exploration drilling programs are done consistent with industry standards and independent certified assay labs.
REFER TO NEWMARKET’S ANNUAL INFORMATION FORM DATED MARCH 21, 2016, AVAILABLE ON SEDAR (www.sedar.com) FOR COMPLETE NI 43-101 NOTES AND DISCLOSURE PERTAINING TO THE RESOURCE AND RESERVE STATEMENTS QUOTED HEREIN.
46TSX:NMI
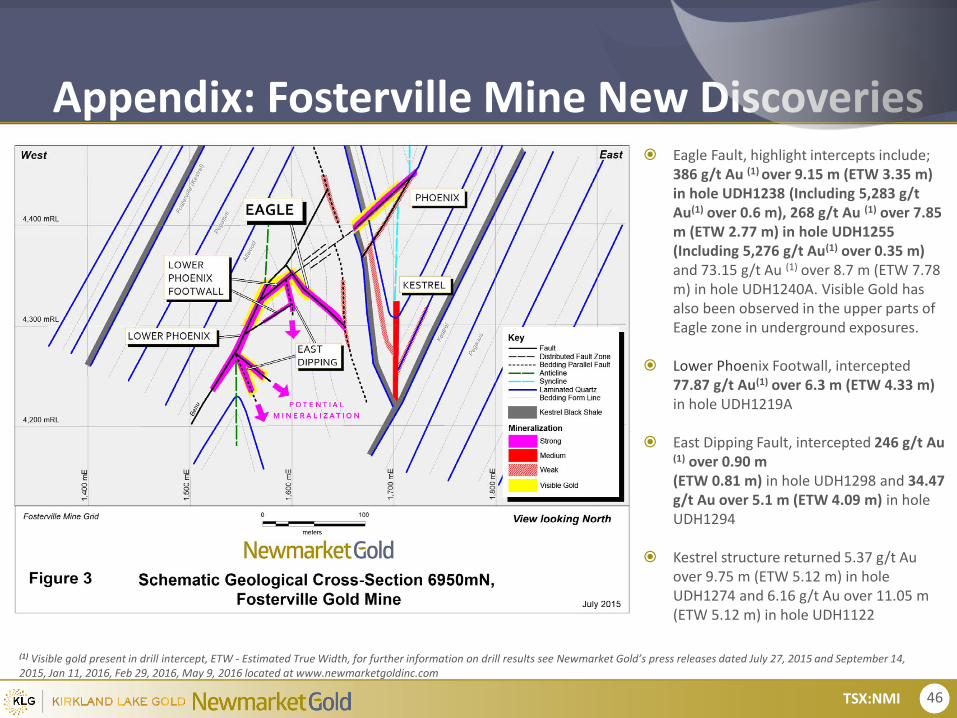
Appendix: Fosterville Mine New Discoveries Eagle Fault, highlight intercepts include;
386 g/t Au (1) over 9.15 m (ETW 3.35 m) in hole UDH1238 (Including 5,283 g/t Au(1) over 0.6 m), 268 g/t Au (1) over 7.85 m (ETW 2.77 m) in hole UDH1255 (Including 5,276 g/t Au(1) over 0.35 m)and 73.15 g/t Au (1) over 8.7 m (ETW 7.78 m) in hole UDH1240A. Visible Gold has also been observed in the upper parts of Eagle zone in underground exposures.
Lower Phoenix Footwall, intercepted 77.87 g/t Au(1) over 6.3 m (ETW 4.33 m)in hole UDH1219A
East Dipping Fault, intercepted 246 g/t Au (1) over 0.90 m (ETW 0.81 m) in hole UDH1298 and 34.47 g/t Au over 5.1 m (ETW 4.09 m) in hole UDH1294
Kestrel structure returned 5.37 g/t Au over 9.75 m (ETW 5.12 m) in hole UDH1274 and 6.16 g/t Au over 11.05 m (ETW 5.12 m) in hole UDH1122
(1) Visible gold present in drill intercept, ETW - Estimated True Width, for further information on drill results see Newmarket Gold’s press releases dated July 27, 2015 and September 14, 2015, Jan 11, 2016, Feb 29, 2016, May 9, 2016 located at www.newmarketgoldinc.com
47TSX:NMI
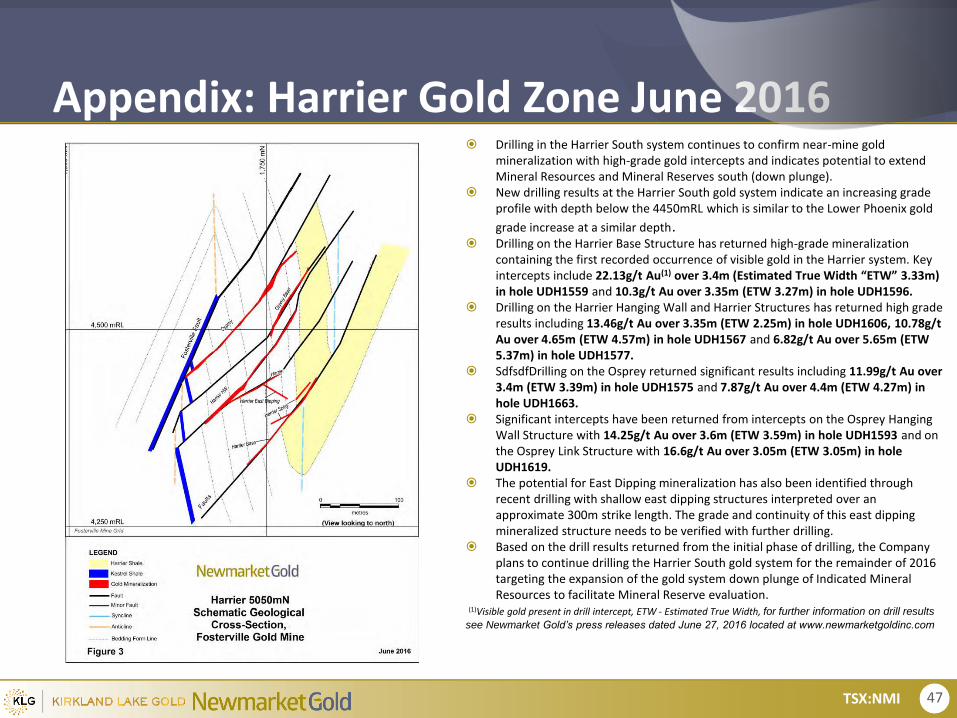
Appendix: Harrier Gold Zone June 2016 Drilling in the Harrier South system continues to confirm near-mine gold
mineralization with high-grade gold intercepts and indicates potential to extend Mineral Resources and Mineral Reserves south (down plunge).
New drilling results at the Harrier South gold system indicate an increasing grade profile with depth below the 4450mRL which is similar to the Lower Phoenix gold
grade increase at a similar depth. Drilling on the Harrier Base Structure has returned high-grade mineralization
containing the first recorded occurrence of visible gold in the Harrier system. Key intercepts include 22.13g/t Au(1) over 3.4m (Estimated True Width “ETW” 3.33m) in hole UDH1559 and 10.3g/t Au over 3.35m (ETW 3.27m) in hole UDH1596.
Drilling on the Harrier Hanging Wall and Harrier Structures has returned high grade results including 13.46g/t Au over 3.35m (ETW 2.25m) in hole UDH1606, 10.78g/t Au over 4.65m (ETW 4.57m) in hole UDH1567 and 6.82g/t Au over 5.65m (ETW 5.37m) in hole UDH1577.
SdfsdfDrilling on the Osprey returned significant results including 11.99g/t Au over 3.4m (ETW 3.39m) in hole UDH1575 and 7.87g/t Au over 4.4m (ETW 4.27m) in hole UDH1663.
Significant intercepts have been returned from intercepts on the Osprey Hanging Wall Structure with 14.25g/t Au over 3.6m (ETW 3.59m) in hole UDH1593 and on the Osprey Link Structure with 16.6g/t Au over 3.05m (ETW 3.05m) in hole UDH1619.
The potential for East Dipping mineralization has also been identified through recent drilling with shallow east dipping structures interpreted over an approximate 300m strike length. The grade and continuity of this east dipping mineralized structure needs to be verified with further drilling.
Based on the drill results returned from the initial phase of drilling, the Company plans to continue drilling the Harrier South gold system for the remainder of 2016 targeting the expansion of the gold system down plunge of Indicated Mineral Resources to facilitate Mineral Reserve evaluation.
(1)Visible gold present in drill intercept, ETW - Estimated True Width, for further information on drill results
see Newmarket Gold’s press releases dated June 27, 2016 located at www.newmarketgoldinc.com

48TSX:NMI
Appendix: New Discoveries at Cosmo
Continued drilling of the Sliver Lode has returned high-grade intercepts of 8.76 g/t Au over 7.55m (Estimated True Width “ETW” 6.8m) in hole CE64062 and 3.61 g/t Au over 14.4m (ETW 12.4m) in hole CE64073. These and other results strongly support the potential to extend Sliver Mineral Resources down-plunge.
Discovery of the Redbelly Lode has returned significant drill intercepts including 4.29 g/t Au over 11.8m (ETW 10.0m) in hole CE64064 and 5.18 g/t Au over 8.75m (ETW 6.8m) in hole CE64070. The new Redbelly gold discovery is located only 25m from existing undergroundinfrastructure below the F1 Fault.
Discovery of the Taipan Lode has returned high-grade gold intercepts including 6.23 g/t Au(1) over 21.45m (ETW 9.0m) in hole CE64083 (including 11.34 g/t Au(1) over 10.15 m (ETW 4.3m), 12.07 g/t Au over 5.2 m (ETW 2.9m) in hole CE64087 (including 101 g/t Au over 0.4 m (ETW 0.2m)), 5.86 g/t Au over 13.15m (ETW 5.9m) in hole CE64078, 10.31 g/t Au over 6.0m (ETW 2.9m) in hole CE64079 and 8.92 g/t Au over 5.8m (ETW 3.3m) in hole CE64086. The Taipan discovery is in close proximity to underground development below the F1 Fault.
Completion of 200m of underground development (640 Western Drill Drive) in April 2016 to provide platforms for continued underground exploration drilling.
Note: For further information on drill results see Newmarket Gold’s press release dated August 22, 2016 located at www.newmarketgoldinc.com

49TSX:NMI
Appendix: Stawell Aurora B East Flank
New discovery of Aurora B East Flank mineralization is a significant event in the long history of the Stawell mine.
West Flank at Stawell has produced 2.3 million oz gold whereas the East Flank, where the Aurora B discovery has been made has no recorded production.
Drilling on the Aurora B discovery returned high-grade intercepts containing visible gold including: 7.06 g/t gold over 17.80 m (estimate true width 8.3 m).
Additional drilling on this new discovery is on-going.
Note: For further information on drill results see Newmarket Gold’s press release dated July 22, 2015 located at www.newmarketgoldinc.com

50TSX:NMI
Appendix: Fosterville Gravity Circuit Addition
The company has now committed to installing a 10 tonnes per hour gravity circuit (Knelson Concentrator) within the secondary (‘Regrind’) grinding circuit (Figure 5) at a cost of US$0.4 million with the installation expected to commence in early 2016 and be operational by the end of Q2 2016.

Click to edit Master title style
• Click to edit Master
text styles
– Second level
• Third level
– Fourth level
» Fifth level
• Click to edit Master
text styles
– Second level
• Third level
– Fourth level
» Fifth level
TSX:KLG 51 klgold.com
Suzette N Ramcharan, CPIR
Director of Investor Relations
+1-647-361-0200
Ryan King
VP, Investor Relations
+1-778-372-5611