Embed Size (px)
Citation preview

Level 3 Communications Bank of America 2015 Leveraged Finance Conference
Cautionary Statement & Pro Forma Adjustment
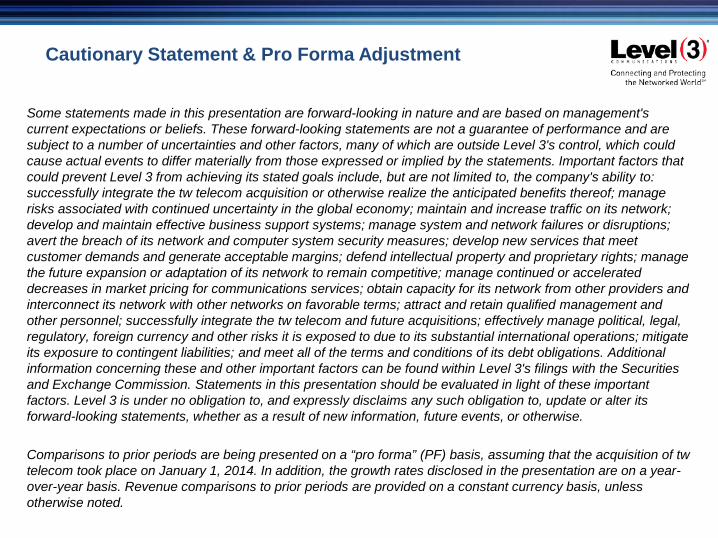
Some statements made in this presentation are forward-looking in nature and are based on management's current expectations or beliefs. These forward-looking statements are not a guarantee of performance and are subject to a number of uncertainties and other factors, many of which are outside Level 3's control, which could cause actual events to differ materially from those expressed or implied by the statements. Important factors that could prevent Level 3 from achieving its stated goals include, but are not limited to, the company's ability to: successfully integrate the tw telecom acquisition or otherwise realize the anticipated benefits thereof; manage risks associated with continued uncertainty in the global economy; maintain and increase traffic on its network; develop and maintain effective business support systems; manage system and network failures or disruptions; avert the breach of its network and computer system security measures; develop new services that meet customer demands and generate acceptable margins; defend intellectual property and proprietary rights; manage the future expansion or adaptation of its network to remain competitive; manage continued or accelerated decreases in market pricing for communications services; obtain capacity for its network from other providers and interconnect its network with other networks on favorable terms; attract and retain qualified management and other personnel; successfully integrate the tw telecom and future acquisitions; effectively manage political, legal, regulatory, foreign currency and other risks it is exposed to due to its substantial international operations; mitigate its exposure to contingent liabilities; and meet all of the terms and conditions of its debt obligations. Additional information concerning these and other important factors can be found within Level 3's filings with the Securities and Exchange Commission. Statements in this presentation should be evaluated in light of these important factors. Level 3 is under no obligation to, and expressly disclaims any such obligation to, update or alter its forward-looking statements, whether as a result of new information, future events, or otherwise.
Comparisons to prior periods are being presented on a “pro forma” (PF) basis, assuming that the acquisition of twtelecom took place on January 1, 2014. In addition, the growth rates disclosed in the presentation are on a year-over-year basis. Revenue comparisons to prior periods are provided on a constant currency basis, unless otherwise noted.
Level 3 Investor Presentation
Overview
Q&A
Financial Update
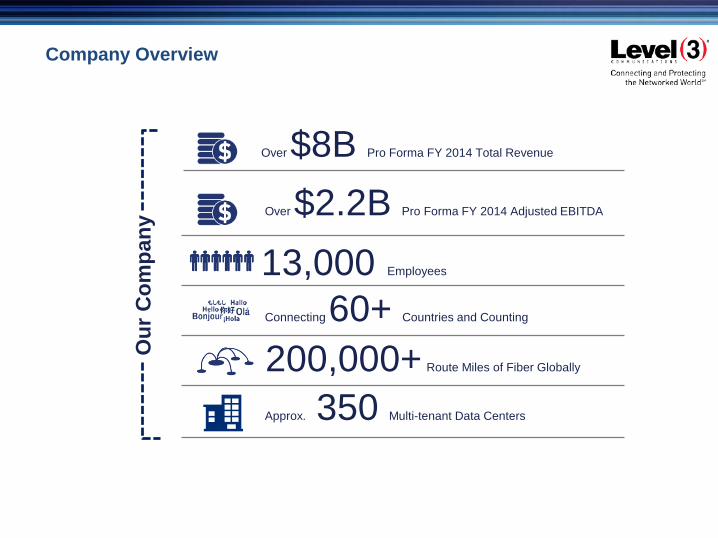
Company Overview
Over $8B Pro Forma FY 2014 Total Revenue
13,000 Employees
Connecting 60+ Countries and Counting
Approx. 350 Multi-tenant Data Centers
200,000+ Route Miles of Fiber Globally
Our
Com
pany
Over $2.2B Pro Forma FY 2014 Adjusted EBITDA
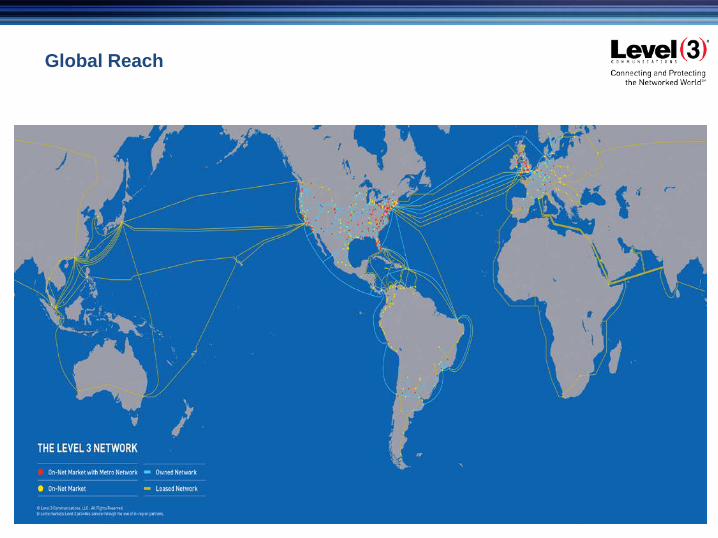
Global Reach
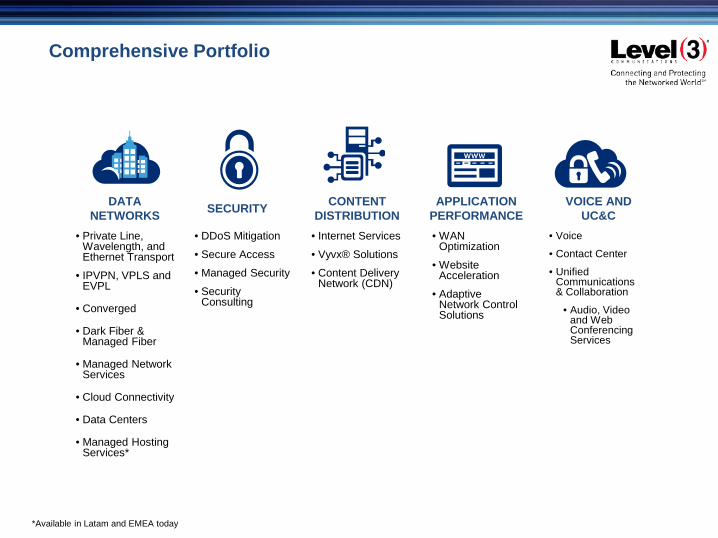
Comprehensive Portfolio
*Available in Latam and EMEA today
• Private Line, Wavelength, and Ethernet Transport
• IPVPN, VPLS and EVPL
• Converged
• Dark Fiber & Managed Fiber
• Managed Network Services
• Cloud Connectivity
• Data Centers
• Managed Hosting Services*
DATA NETWORKS
• Internet Services
• Vyvx® Solutions
• Content Delivery Network (CDN)
CONTENT DISTRIBUTION
• Voice
• Contact Center
• Unified Communications & Collaboration
• Audio, Video and Web Conferencing Services
VOICE AND UC&C
• DDoS Mitigation
• Secure Access
• Managed Security
• Security Consulting
SECURITY
• WAN Optimization
• Website Acceleration
• Adaptive Network Control Solutions
APPLICATION PERFORMANCE
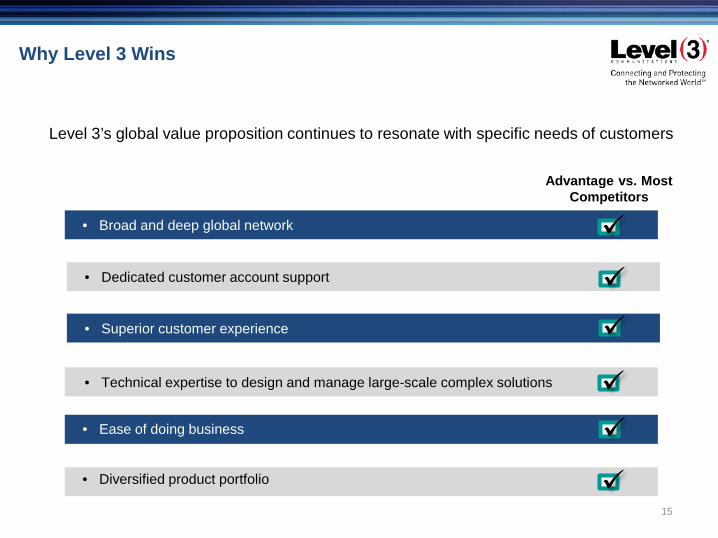
Why Level 3 Wins
• Broad and deep global network
Advantage vs. MostCompetitors
• Dedicated customer account support
• Superior customer experience
• Technical expertise to design and manage large-scale complex solutions
Level 3’s global value proposition continues to resonate with specific needs of customers
• Ease of doing business
• Diversified product portfolio 15
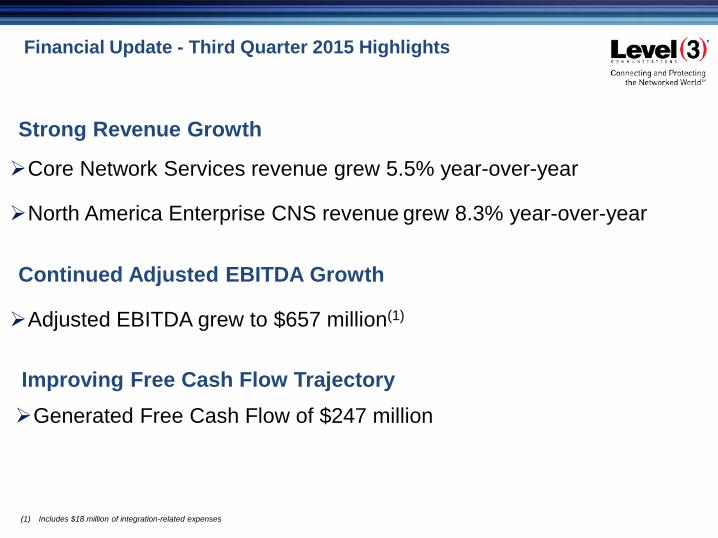
Financial Update - Third Quarter 2015 Highlights
Strong Revenue Growth
Core Network Services revenue grew 5.5% year-over-year
North America Enterprise CNS revenue grew 8.3% year-over-year
Continued Adjusted EBITDA Growth
Adjusted EBITDA grew to $657 million(1)
Improving Free Cash Flow TrajectoryGenerated Free Cash Flow of $247 million
(1) Includes $18 million of integration-related expenses
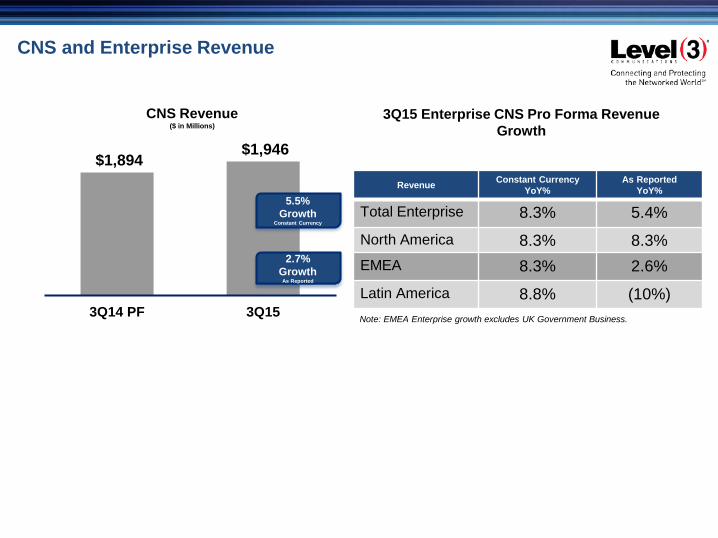
$1,894 $1,946
3Q14 PF 3Q15
CNS and Enterprise Revenue
CNS Revenue($ in Millions)
3Q15 Enterprise CNS Pro Forma Revenue Growth
Note: EMEA Enterprise growth excludes UK Government Business.
5.5% Growth
Constant Currency
2.7% Growth
As Reported
Revenue Constant CurrencyYoY%
As ReportedYoY%
Total Enterprise 8.3% 5.4%
North America 8.3% 8.3%EMEA 8.3% 2.6%
Latin America 8.8% (10%)
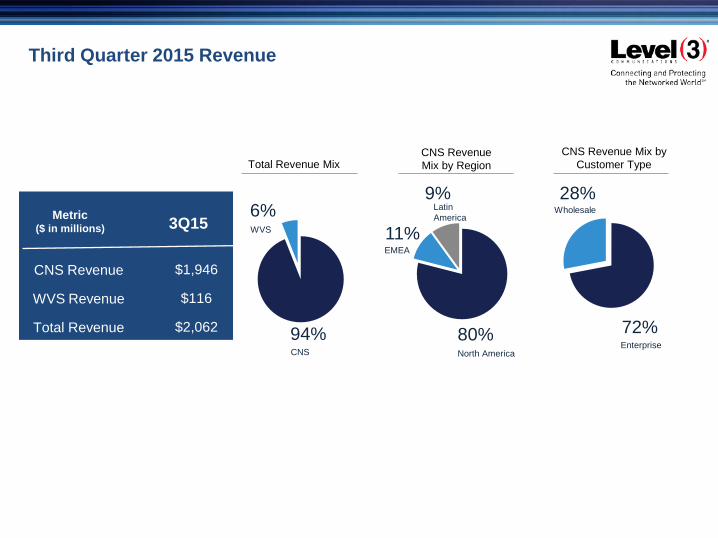
Third Quarter 2015 Revenue
94%CNS
6%WVS 11%
EMEA
28%Wholesale
9%Latin America
80%North America
72%Enterprise
Total Revenue MixCNS Revenue Mix by Region
CNS Revenue Mix by Customer Type
Metric($ in millions)
CNS Revenue
WVS Revenue
Total Revenue
3Q15
$1,946
$116
$2,062
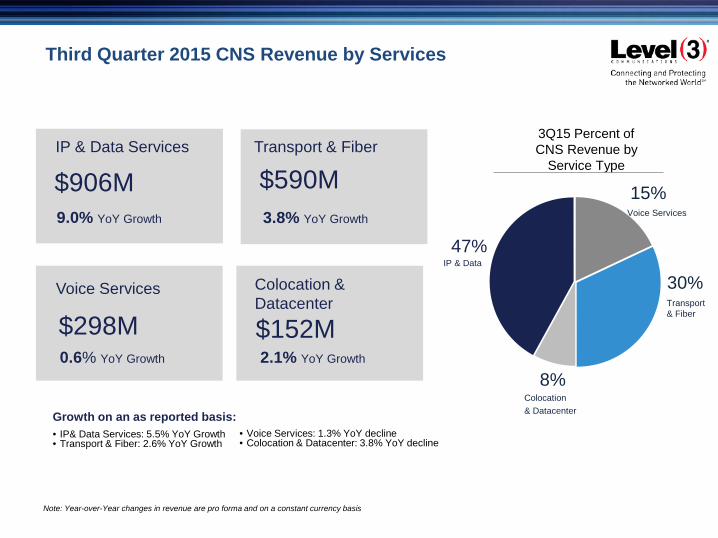
Third Quarter 2015 CNS Revenue by Services
$906M9.0% YoY Growth
IP & Data Services
$590MTransport & Fiber
$298M0.6% YoY Growth
Voice Services
$152M
Colocation & Datacenter
3.8% YoY Growth
2.1% YoY Growth
Note: Year-over-Year changes in revenue are pro forma and on a constant currency basis
30%Transport & Fiber
15%Voice Services
8%Colocation& Datacenter
3Q15 Percent of CNS Revenue by
Service Type
47%IP & Data
Growth on an as reported basis: • IP& Data Services: 5.5% YoY Growth• Transport & Fiber: 2.6% YoY Growth
• Voice Services: 1.3% YoY decline• Colocation & Datacenter: 3.8% YoY decline
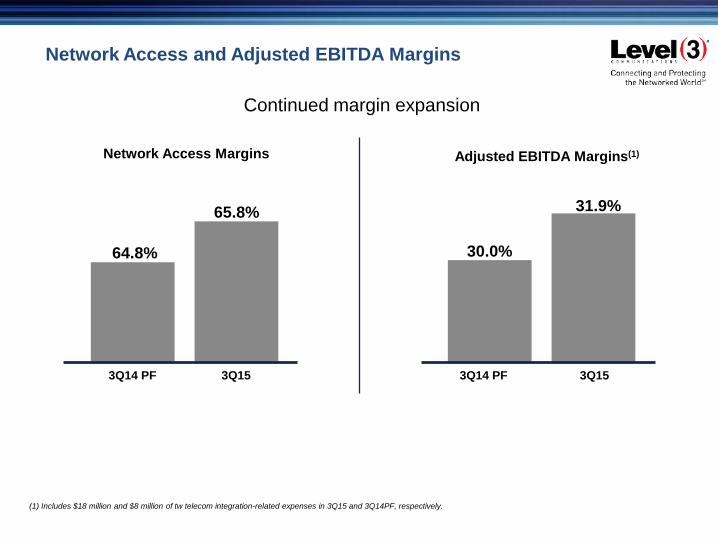
Network Access and Adjusted EBITDA Margins
Continued margin expansion
Network Access Margins Adjusted EBITDA Margins(1)
64.8%
65.8%
3Q14 PF 3Q15
30.0%
31.9%
3Q14 PF 3Q15
(1) Includes $18 million and $8 million of tw telecom integration-related expenses in 3Q15 and 3Q14PF, respectively.
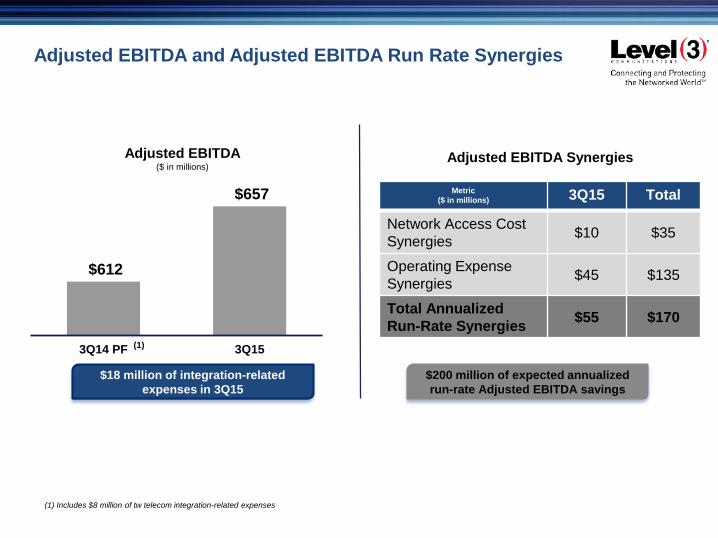
$612
$657
3Q14 PF 3Q15
Adjusted EBITDA and Adjusted EBITDA Run Rate Synergies
Adjusted EBITDA($ in millions)
Adjusted EBITDA Synergies
Metric($ in millions) 3Q15 Total
Network Access Cost Synergies $10 $35
Operating Expense Synergies $45 $135
Total Annualized Run-Rate Synergies $55 $170
$18 million of integration-related expenses in 3Q15
$200 million of expected annualized run-rate Adjusted EBITDA savings
(1) Includes $8 million of tw telecom integration-related expenses
(1)

3Q14 PF 3Q15
Capital Expenditures and Free Cash Flow
Capital Expenditures($ in millions)
Free Cash Flow($ in millions)
$139
$247
Year to date, capital expenditures of 15% of total revenue
$302 $328
3Q14 PF 3Q15
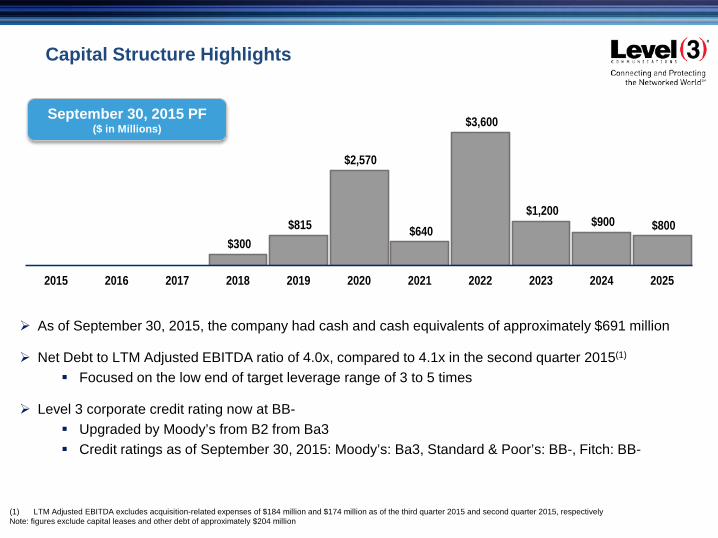
Capital Structure Highlights
$300 $815
$2,570
$640
$3,600
$1,200 $900 $800
2015 2016 2017 2018 2019 2020 2021 2022 2023 2024 2025
As of September 30, 2015, the company had cash and cash equivalents of approximately $691 million
Net Debt to LTM Adjusted EBITDA ratio of 4.0x, compared to 4.1x in the second quarter 2015(1)
Focused on the low end of target leverage range of 3 to 5 times
Level 3 corporate credit rating now at BB- Upgraded by Moody’s from B2 from Ba3 Credit ratings as of September 30, 2015: Moody’s: Ba3, Standard & Poor’s: BB-, Fitch: BB-
September 30, 2015 PF($ in Millions)
(1) LTM Adjusted EBITDA excludes acquisition-related expenses of $184 million and $174 million as of the third quarter 2015 and second quarter 2015, respectivelyNote: figures exclude capital leases and other debt of approximately $204 million
Summary
Enterprise-driven Revenue Growth
Focus on Profitable Growth
Continued Adjusted EBITDA Growth
Improving Free Cash Flow growth profile
Continue to target low end of target leverage range of 3 to 5 times

Q&A