Embed Size (px)
Citation preview

NAVIGATING TURBULENT WATERS – AN ASSESSMENT & OUTLOOK FOR THE O&G INDUSTRY
Joseph Triepke Managing Director, Oilpro
KEYNOTE
STRATEGIES & OPPORTUNITIES: MANAGING IN A TURBULENT OIL & GAS WORLD

An Assessment & Outlook For The O&G Industry
Presented by Oilpro.com for WorkforceNEXT - April 2015
Navigating Turbulent Waters
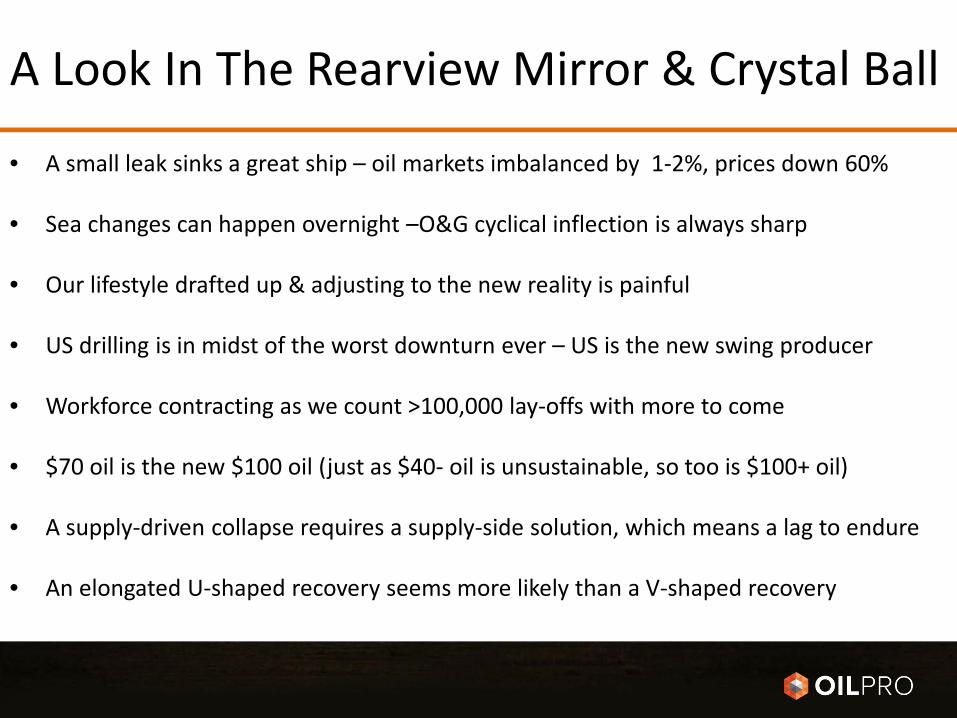
A Look In The Rearview Mirror & Crystal Ball
• A small leak sinks a great ship – oil markets imbalanced by 1-2%, prices down 60%
• Sea changes can happen overnight –O&G cyclical inflection is always sharp
• Our lifestyle drafted up & adjusting to the new reality is painful
• US drilling is in midst of the worst downturn ever – US is the new swing producer
• Workforce contracting as we count >100,000 lay-offs with more to come
• $70 oil is the new $100 oil (just as $40- oil is unsustainable, so too is $100+ oil)
• A supply-driven collapse requires a supply-side solution, which means a lag to endure
• An elongated U-shaped recovery seems more likely than a V-shaped recovery

At The Center Of The Storm, Commodity Prices
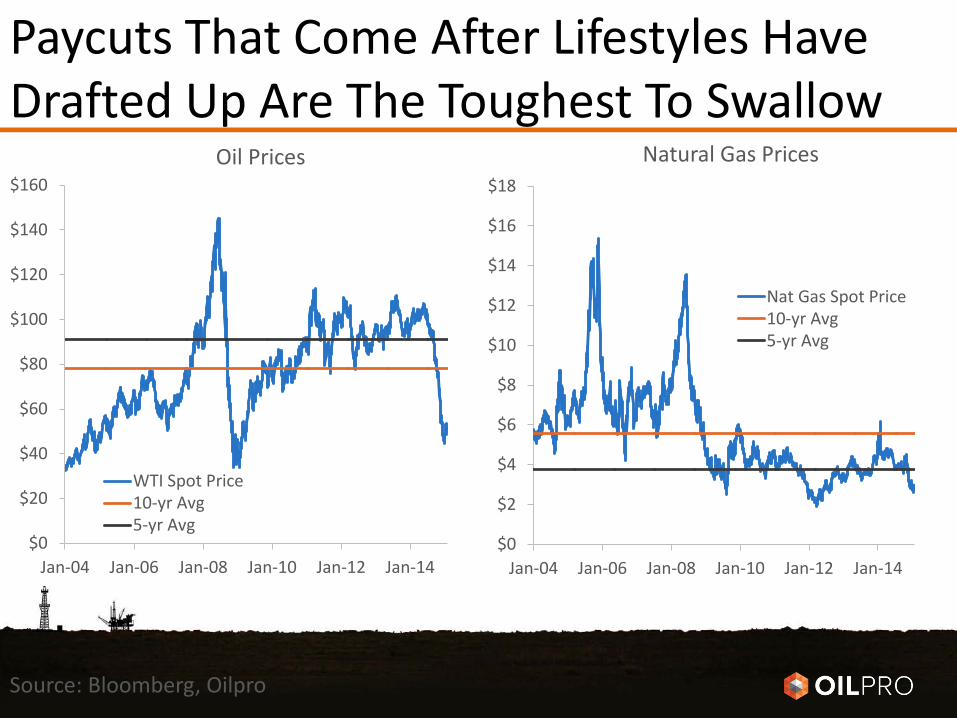
Paycuts That Come After Lifestyles Have Drafted Up Are The Toughest To Swallow
Source: Bloomberg, Oilpro
$0
$20
$40
$60
$80
$100
$120
$140
$160
Jan-04 Jan-06 Jan-08 Jan-10 Jan-12 Jan-14
Oil Prices
WTI Spot Price10-yr Avg5-yr Avg
$0
$2
$4
$6
$8
$10
$12
$14
$16
$18
Jan-04 Jan-06 Jan-08 Jan-10 Jan-12 Jan-14
Natural Gas Prices
Nat Gas Spot Price10-yr Avg5-yr Avg
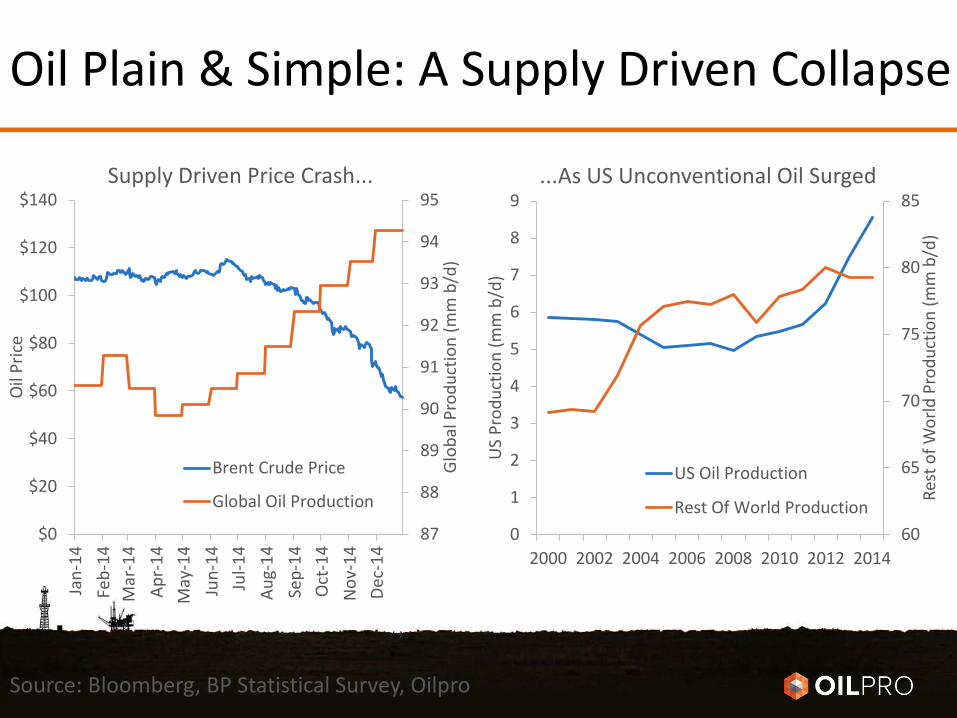
Oil Plain & Simple: A Supply Driven Collapse
87
88
89
90
91
92
93
94
95
$0
$20
$40
$60
$80
$100
$120
$140
Jan-
14Fe
b-14
Mar
-14
Apr-
14M
ay-1
4Ju
n-14
Jul-1
4Au
g-14
Sep-
14O
ct-1
4N
ov-1
4De
c-14
Glo
bal P
rodu
ctio
n (m
m b
/d)
Oil
Pric
e
Supply Driven Price Crash...
Brent Crude Price
Global Oil Production
60
65
70
75
80
85
0
1
2
3
4
5
6
7
8
9
2000 2002 2004 2006 2008 2010 2012 2014
Rest
of W
orld
Pro
duct
ion
(mm
b/d
)
US
Prod
uctio
n (m
m b
/d)
...As US Unconventional Oil Surged
US Oil Production
Rest Of World Production
Source: Bloomberg, BP Statistical Survey, Oilpro
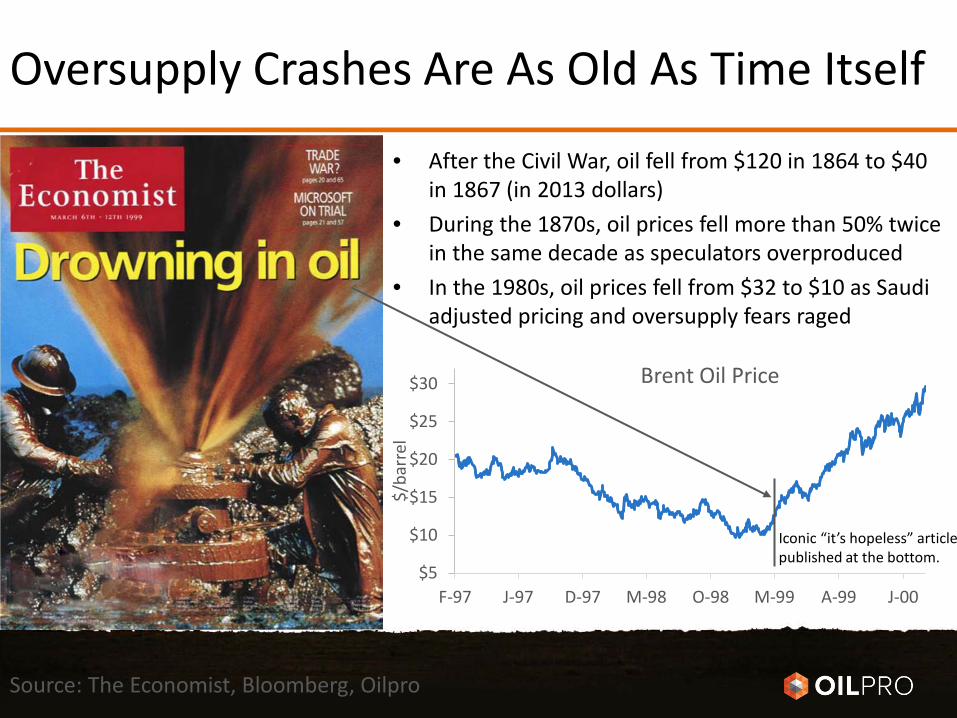
Oversupply Crashes Are As Old As Time Itself
• After the Civil War, oil fell from $120 in 1864 to $40 in 1867 (in 2013 dollars)
• During the 1870s, oil prices fell more than 50% twice in the same decade as speculators overproduced
• In the 1980s, oil prices fell from $32 to $10 as Saudi adjusted pricing and oversupply fears raged
$5
$10
$15
$20
$25
$30
F-97 J-97 D-97 M-98 O-98 M-99 A-99 J-00
$/ba
rrel
Brent Oil Price
Iconic “it’s hopeless” article published at the bottom.
Source: The Economist, Bloomberg, Oilpro
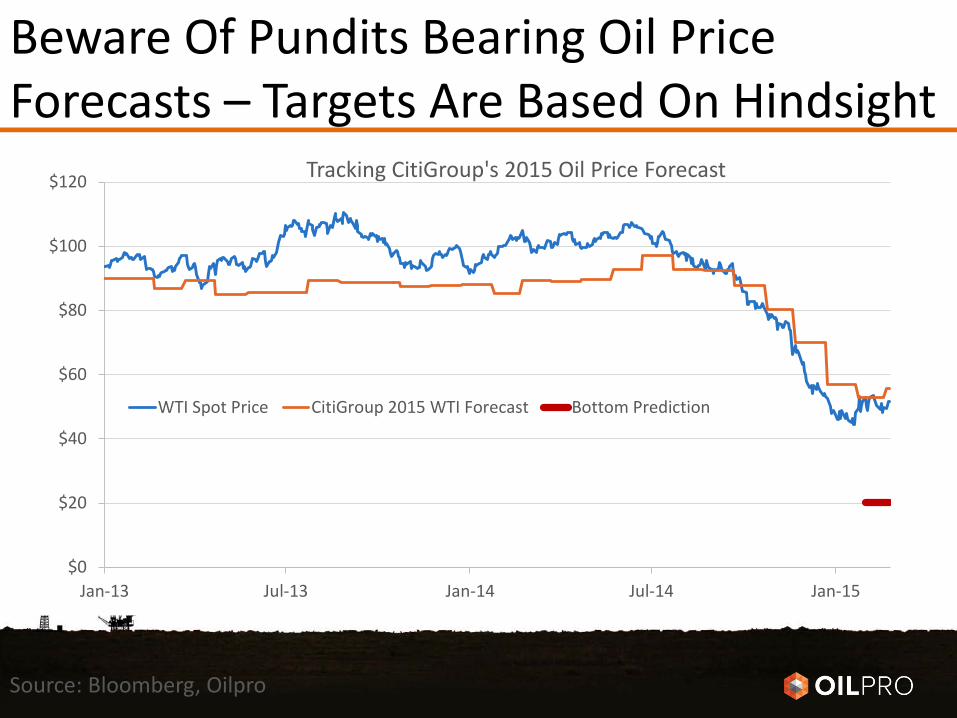
Beware Of Pundits Bearing Oil Price Forecasts – Targets Are Based On Hindsight
$0
$20
$40
$60
$80
$100
$120
Jan-13 Jul-13 Jan-14 Jul-14 Jan-15
Tracking CitiGroup's 2015 Oil Price Forecast
WTI Spot Price CitiGroup 2015 WTI Forecast Bottom Prediction
Source: Bloomberg, Oilpro
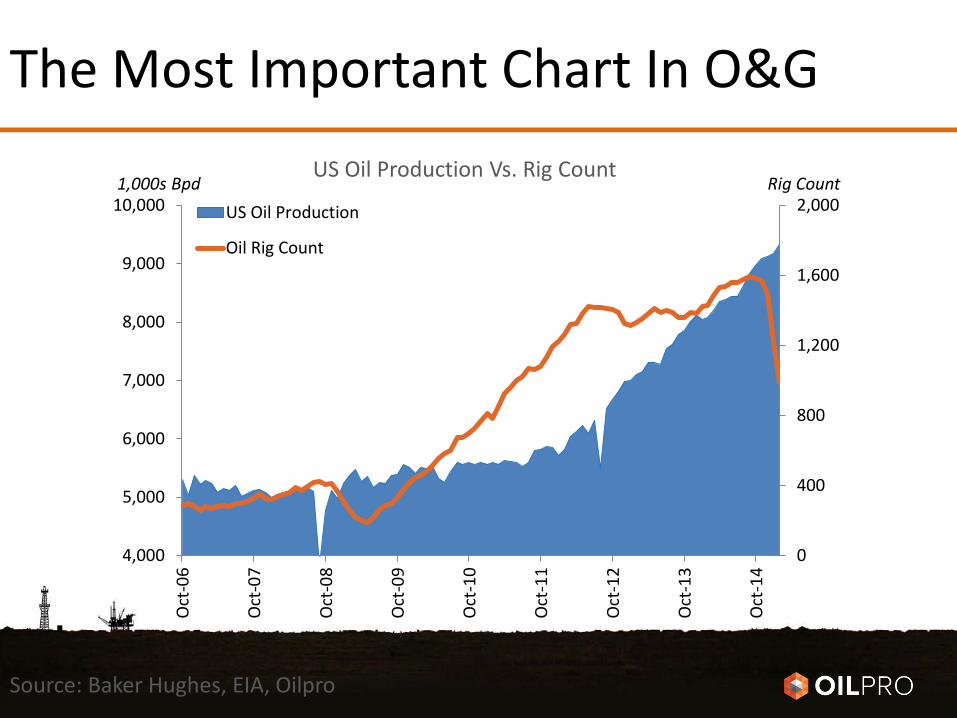
The Most Important Chart In O&G
0
400
800
1,200
1,600
2,000
4,000
5,000
6,000
7,000
8,000
9,000
10,000O
ct-0
6
Oct
-07
Oct
-08
Oct
-09
Oct
-10
Oct
-11
Oct
-12
Oct
-13
Oct
-14
US Oil Production
Oil Rig Count
1,000s Bpd Rig Count US Oil Production Vs. Rig Count
Source: Baker Hughes, EIA, Oilpro
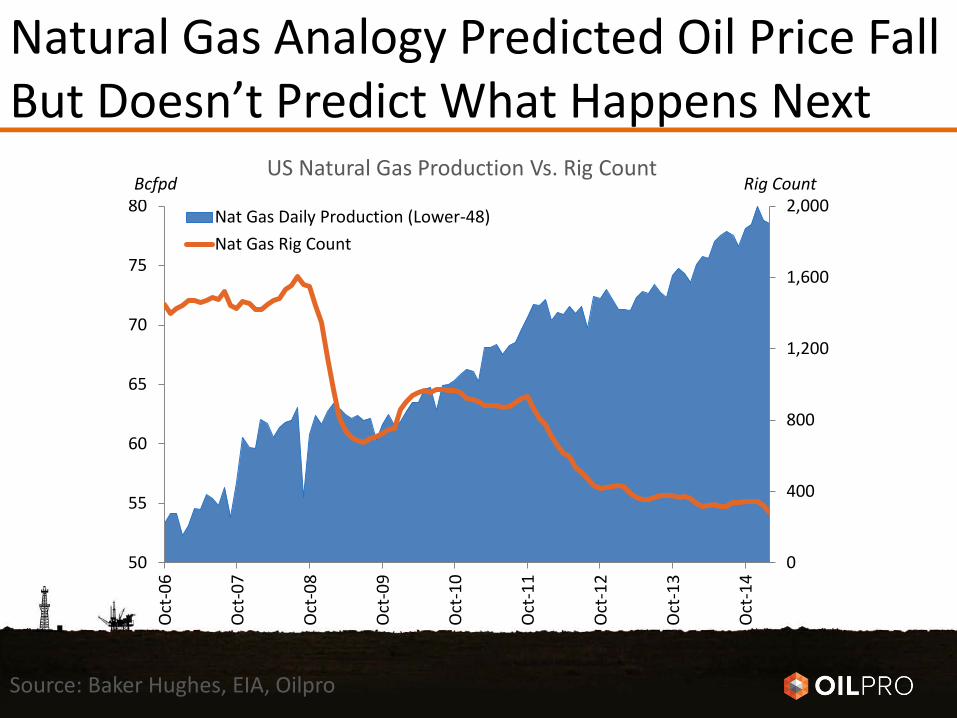
Natural Gas Analogy Predicted Oil Price Fall But Doesn’t Predict What Happens Next
0
400
800
1,200
1,600
2,000
50
55
60
65
70
75
80
Oct
-06
Oct
-07
Oct
-08
Oct
-09
Oct
-10
Oct
-11
Oct
-12
Oct
-13
Oct
-14
Nat Gas Daily Production (Lower-48)Nat Gas Rig Count
Bcfpd Rig Count US Natural Gas Production Vs. Rig Count
Source: Baker Hughes, EIA, Oilpro
260
310
360
410
460
Sep-
87
Sep-
89
Sep-
91
Sep-
93
Sep-
95
Sep-
97
Sep-
99
Sep-
01
Sep-
03
Sep-
05
Sep-
07
Sep-
09
Sep-
11
Sep-
13
Mill
ion
Barr
els o
f Oil
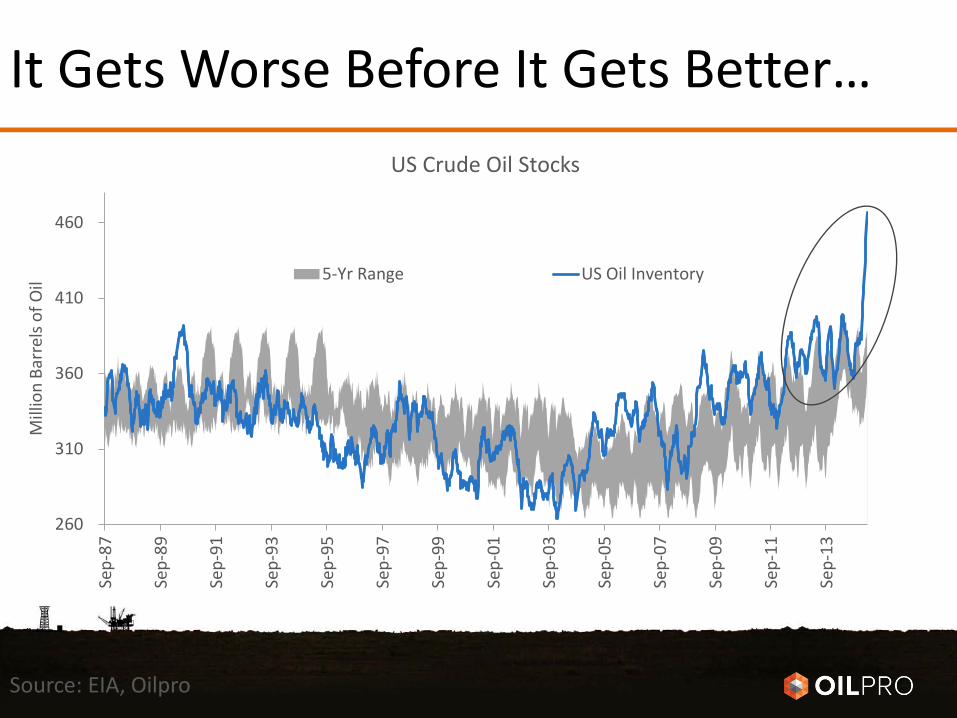
US Crude Oil Stocks
5-Yr Range 5-Yr Range US Oil Inventory
It Gets Worse Before It Gets Better…
Source: EIA, Oilpro
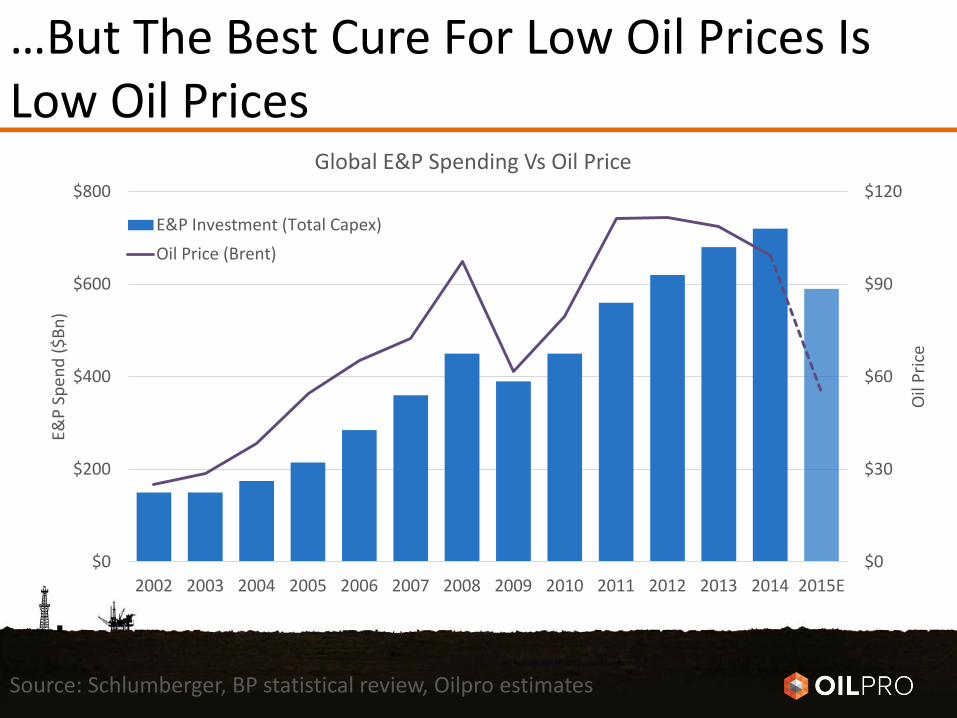
…But The Best Cure For Low Oil Prices Is Low Oil Prices
Source: Schlumberger, BP statistical review, Oilpro estimates
$0
$30
$60
$90
$120
$0
$200
$400
$600
$800
2002 2003 2004 2005 2006 2007 2008 2009 2010 2011 2012 2013 2014 2015E
Oil
Pric
e
E&P
Spen
d ($
Bn)
Global E&P Spending Vs Oil Price
E&P Investment (Total Capex)Oil Price (Brent)
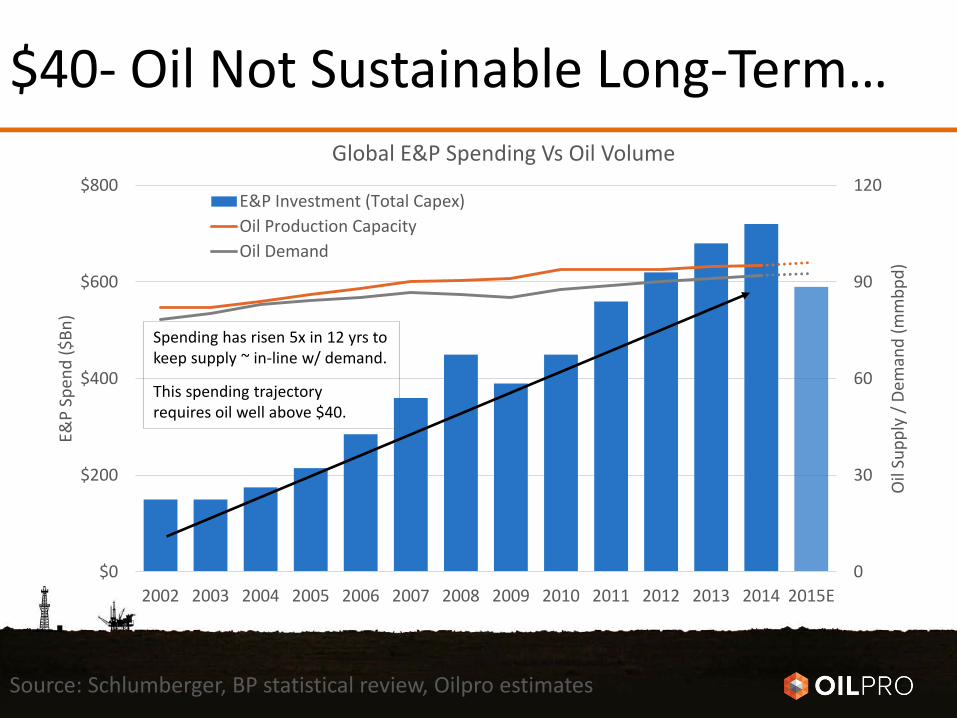
$40- Oil Not Sustainable Long-Term…
Source: Schlumberger, BP statistical review, Oilpro estimates
0
30
60
90
120
$0
$200
$400
$600
$800
2002 2003 2004 2005 2006 2007 2008 2009 2010 2011 2012 2013 2014 2015E
Oil
Supp
ly /
Dem
and
(mm
bpd)
E&P
Spen
d ($
Bn)
Global E&P Spending Vs Oil Volume
E&P Investment (Total Capex)Oil Production CapacityOil Demand
Spending has risen 5x in 12 yrs to keep supply ~ in-line w/ demand.
This spending trajectory requires oil well above $40.
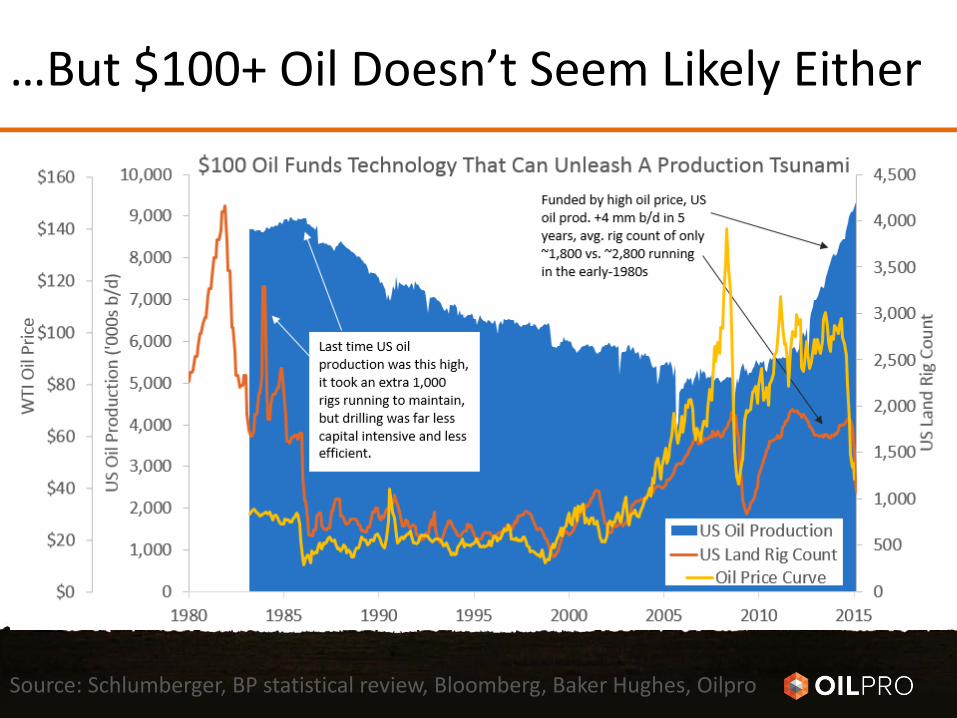
…But $100+ Oil Doesn’t Seem Likely Either
Source: Schlumberger, BP statistical review, Bloomberg, Baker Hughes, Oilpro
OPEC Rocked The Boat
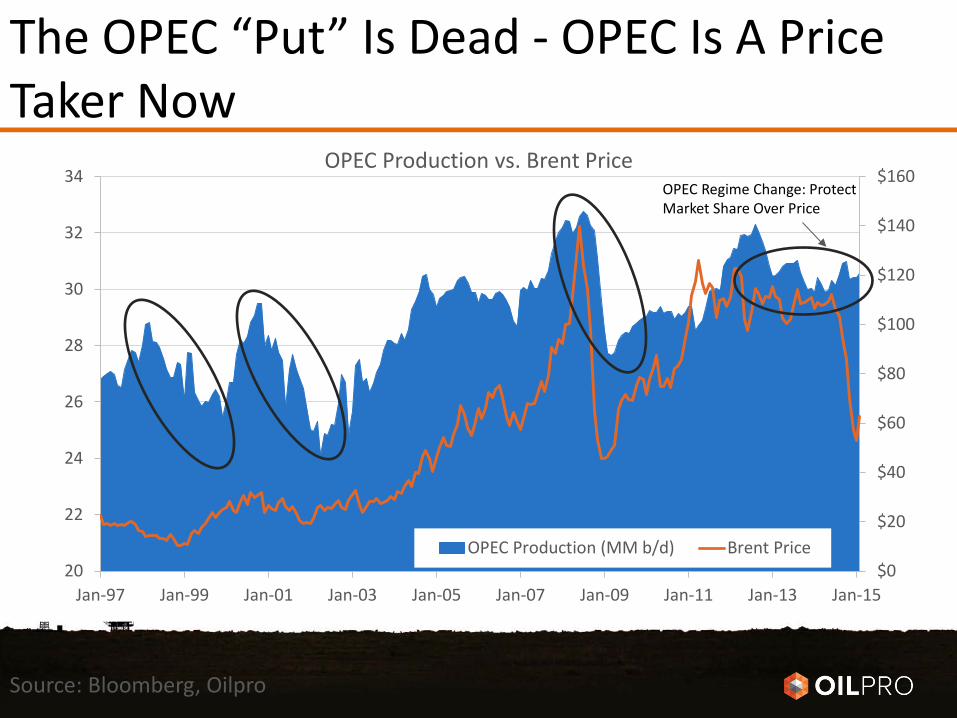
The OPEC “Put” Is Dead - OPEC Is A Price Taker Now
Source: Bloomberg, Oilpro
$0
$20
$40
$60
$80
$100
$120
$140
$160
20
22
24
26
28
30
32
34
Jan-97 Jan-99 Jan-01 Jan-03 Jan-05 Jan-07 Jan-09 Jan-11 Jan-13 Jan-15
OPEC Production vs. Brent Price
OPEC Production (MM b/d) Brent Price
OPEC Regime Change: Protect Market Share Over Price
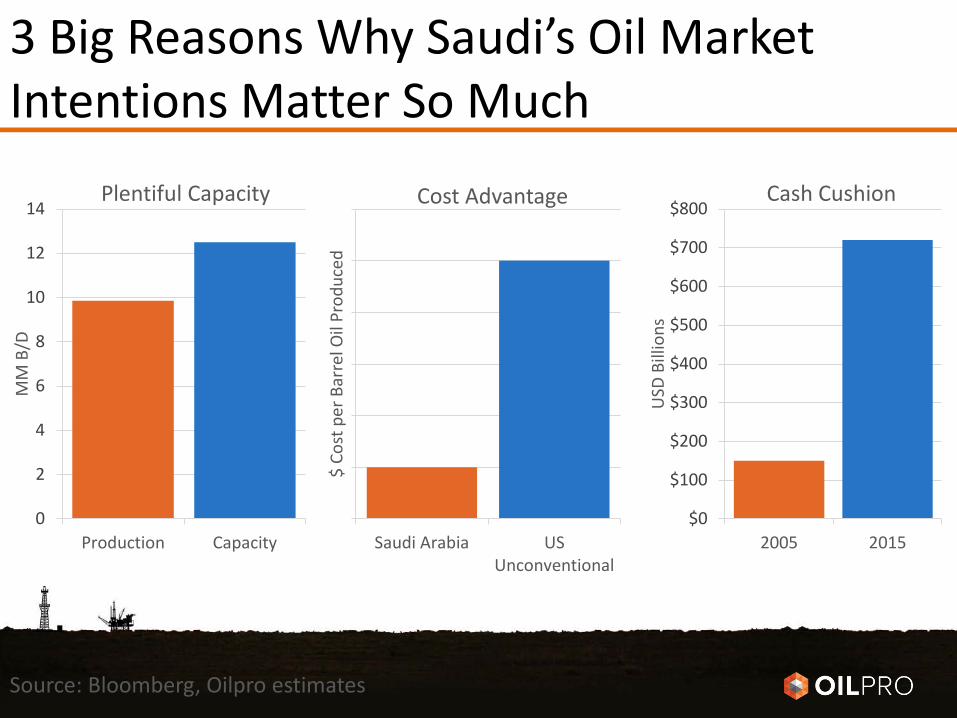
3 Big Reasons Why Saudi’s Oil Market Intentions Matter So Much
0
10
20
30
40
50
60
Saudi Arabia USUnconventional
$ Co
st p
er B
arre
l Oil
Prod
uced
Cost Advantage
0
2
4
6
8
10
12
14
Production Capacity
MM
B/D
Plentiful Capacity
$0
$100
$200
$300
$400
$500
$600
$700
$800
2005 2015
USD
Bill
ions
Cash Cushion
Source: Bloomberg, Oilpro estimates
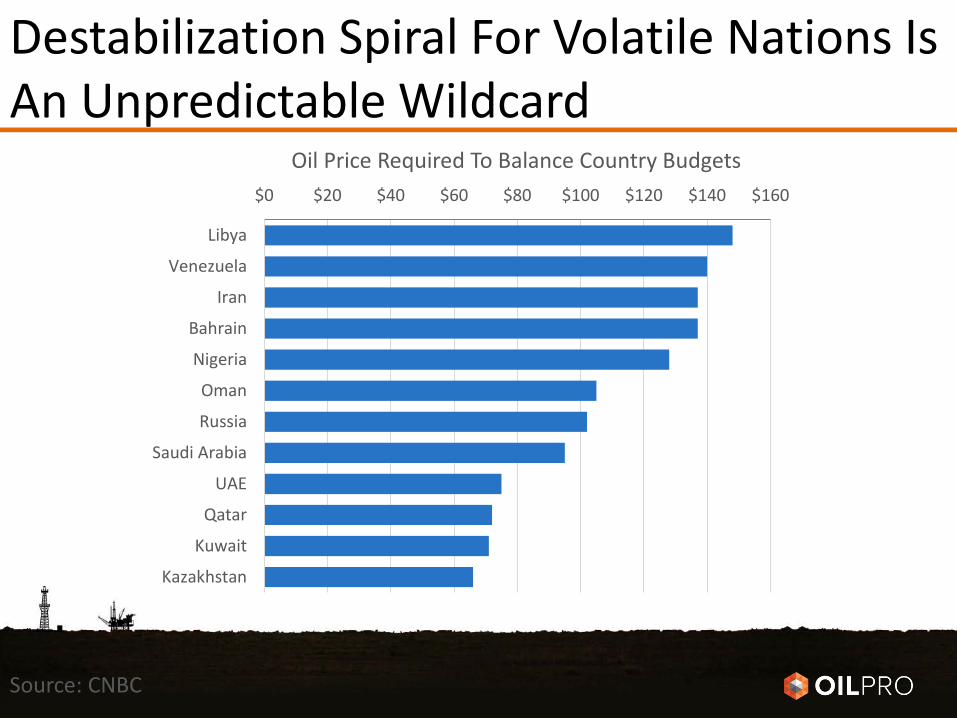
Destabilization Spiral For Volatile Nations Is An Unpredictable Wildcard
Source: CNBC
$0 $20 $40 $60 $80 $100 $120 $140 $160
Libya
Venezuela
Iran
Bahrain
Nigeria
Oman
Russia
Saudi Arabia
UAE
Qatar
Kuwait
Kazakhstan
Oil Price Required To Balance Country Budgets
An Oil Tsunami Has Blitzed The Industry Marketplace
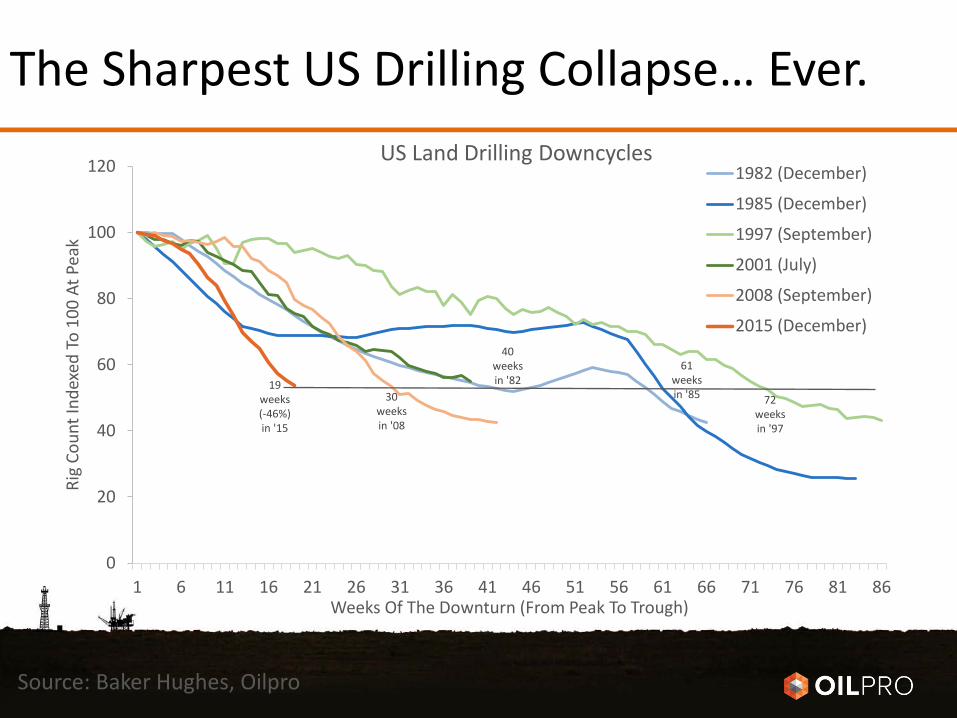
The Sharpest US Drilling Collapse… Ever.
Source: Baker Hughes, Oilpro
0
20
40
60
80
100
120
1 6 11 16 21 26 31 36 41 46 51 56 61 66 71 76 81 86
Rig
Coun
t Ind
exed
To
100
At P
eak
Weeks Of The Downturn (From Peak To Trough)
US Land Drilling Downcycles 1982 (December)
1985 (December)
1997 (September)
2001 (July)
2008 (September)
2015 (December)
19 weeks (-46%) in '15
30 weeks in '08
40 weeks in '82
72 weeks in '97
61 weeks in '85
Drilling, 13,400
Equipment, 24,400
Oil Service, 39,100
E&P, 24,100
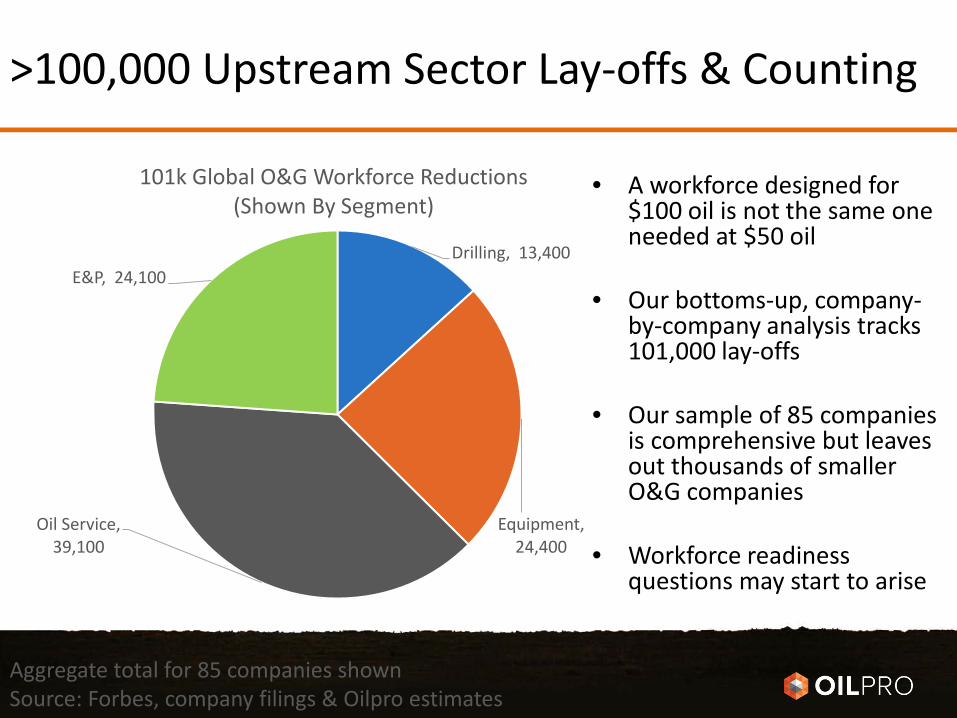
101k Global O&G Workforce Reductions (Shown By Segment)
>100,000 Upstream Sector Lay-offs & Counting
Aggregate total for 85 companies shown Source: Forbes, company filings & Oilpro estimates
• A workforce designed for $100 oil is not the same one needed at $50 oil
• Our bottoms-up, company-by-company analysis tracks 101,000 lay-offs
• Our sample of 85 companies is comprehensive but leaves out thousands of smaller O&G companies
• Workforce readiness questions may start to arise
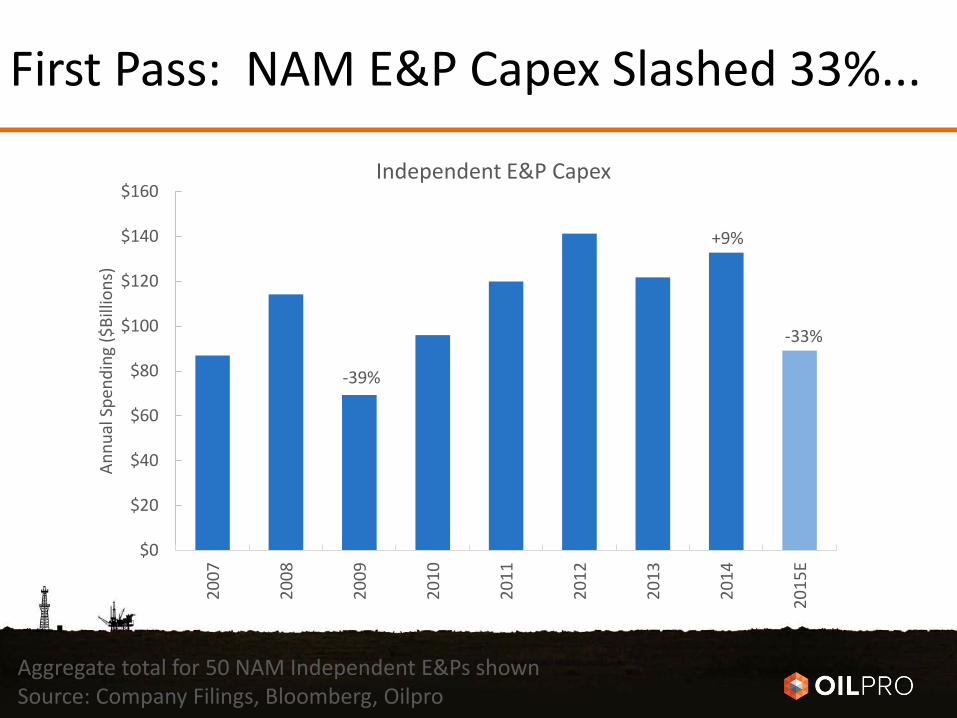
First Pass: NAM E&P Capex Slashed 33%...
Aggregate total for 50 NAM Independent E&Ps shown Source: Company Filings, Bloomberg, Oilpro
$0
$20
$40
$60
$80
$100
$120
$140
$16020
07
2008
2009
2010
2011
2012
2013
2014
2015
E
Annu
al S
pend
ing
($Bi
llion
s)
Independent E&P Capex
-39%
+9%
-33%
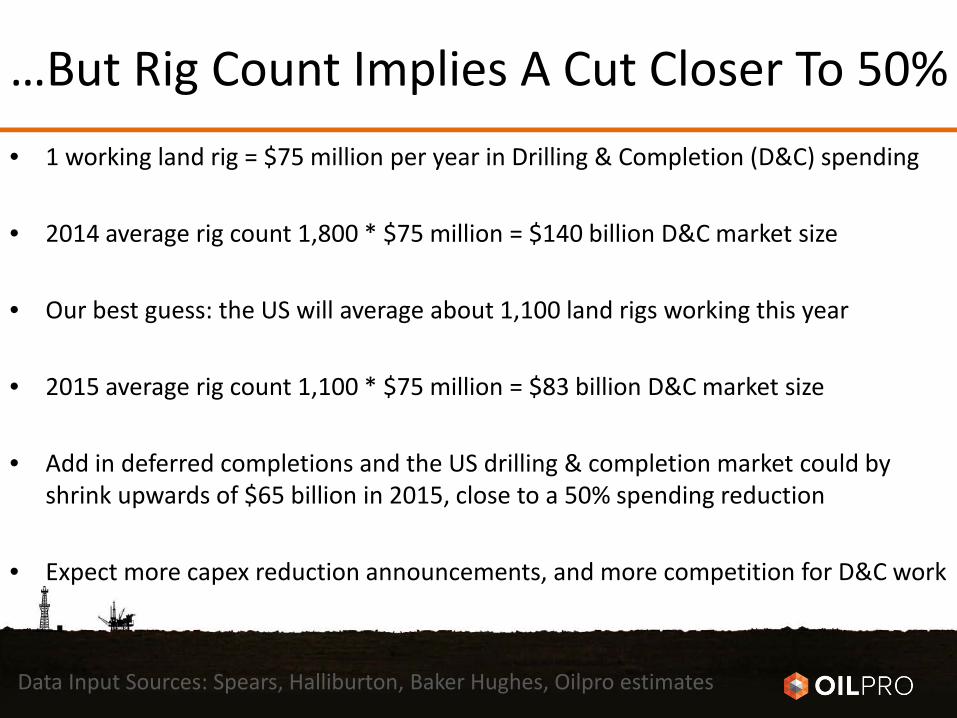
…But Rig Count Implies A Cut Closer To 50%
Data Input Sources: Spears, Halliburton, Baker Hughes, Oilpro estimates
• 1 working land rig = $75 million per year in Drilling & Completion (D&C) spending
• 2014 average rig count 1,800 * $75 million = $140 billion D&C market size
• Our best guess: the US will average about 1,100 land rigs working this year
• 2015 average rig count 1,100 * $75 million = $83 billion D&C market size
• Add in deferred completions and the US drilling & completion market could by shrink upwards of $65 billion in 2015, close to a 50% spending reduction
• Expect more capex reduction announcements, and more competition for D&C work
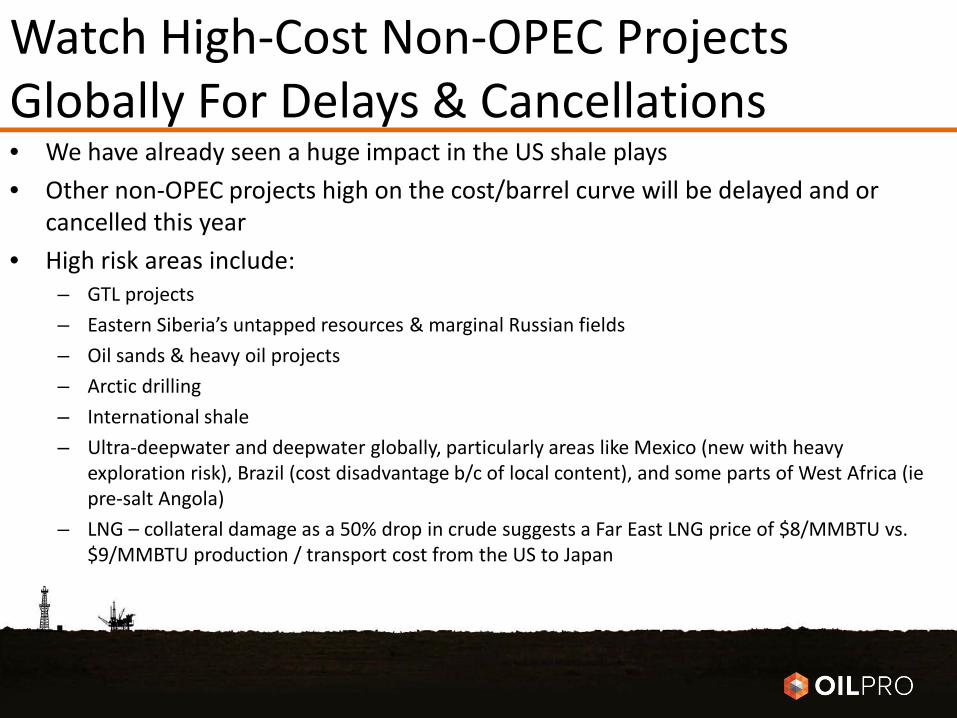
Watch High-Cost Non-OPEC Projects Globally For Delays & Cancellations • We have already seen a huge impact in the US shale plays • Other non-OPEC projects high on the cost/barrel curve will be delayed and or
cancelled this year • High risk areas include:
– GTL projects – Eastern Siberia’s untapped resources & marginal Russian fields – Oil sands & heavy oil projects – Arctic drilling – International shale – Ultra-deepwater and deepwater globally, particularly areas like Mexico (new with heavy
exploration risk), Brazil (cost disadvantage b/c of local content), and some parts of West Africa (ie pre-salt Angola)
– LNG – collateral damage as a 50% drop in crude suggests a Far East LNG price of $8/MMBTU vs. $9/MMBTU production / transport cost from the US to Japan

The Storm Is Reshaping The O&G Workforce – 7 Key Trends
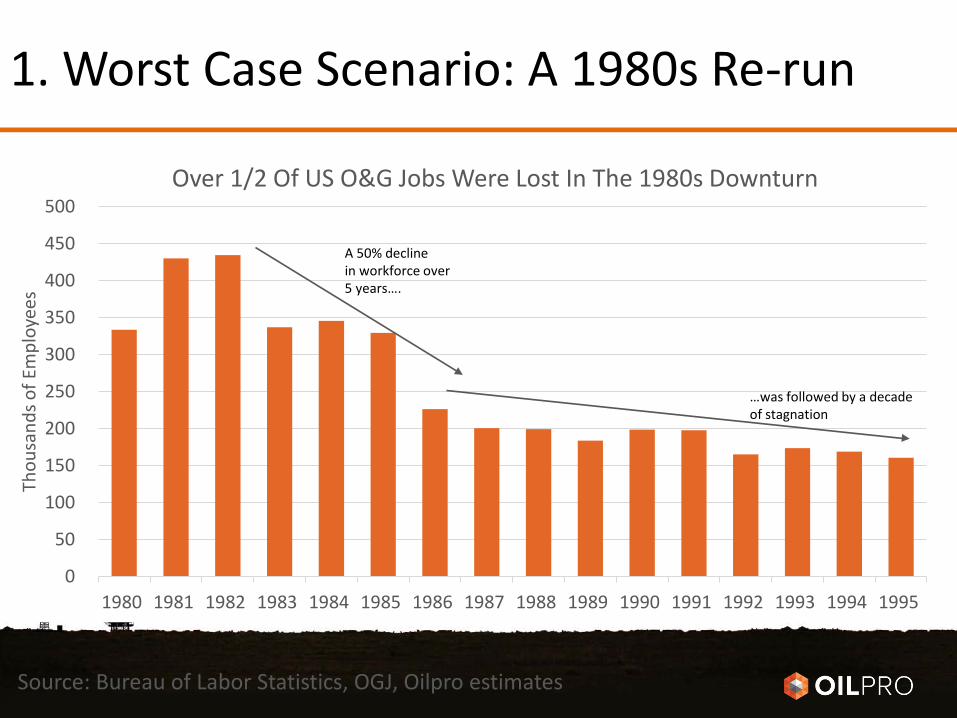
1. Worst Case Scenario: A 1980s Re-run
0
50
100
150
200
250
300
350
400
450
500
1980 1981 1982 1983 1984 1985 1986 1987 1988 1989 1990 1991 1992 1993 1994 1995
Thou
sand
s of E
mpl
oyee
s
Over 1/2 Of US O&G Jobs Were Lost In The 1980s Downturn
A 50% decline in workforce over 5 years….
…was followed by a decade of stagnation
Source: Bureau of Labor Statistics, OGJ, Oilpro estimates
2. Workforce Reductions Will Be Ongoing; Future Workforce Readiness A Concern • Companies are managing quarter-to-quarter due to lack of visibility • Companies have cut spending for a $65-$75 oil price world • 2-year strip suggests a $60-$65 reality and may be optimistic • Absent a V-shaped rebound, operational scale will continue to ratchet
down – field cuts first, SG&A (mgmt. and execs.) cuts coming next • FMC Tech told investors a week ago that their layoffs were deepening • Basic Energy Services is an example of ongoing workforce reductions:
– January: 7% laid off – February: 10% laid off – March: 14% laid off – April, May, June: ????
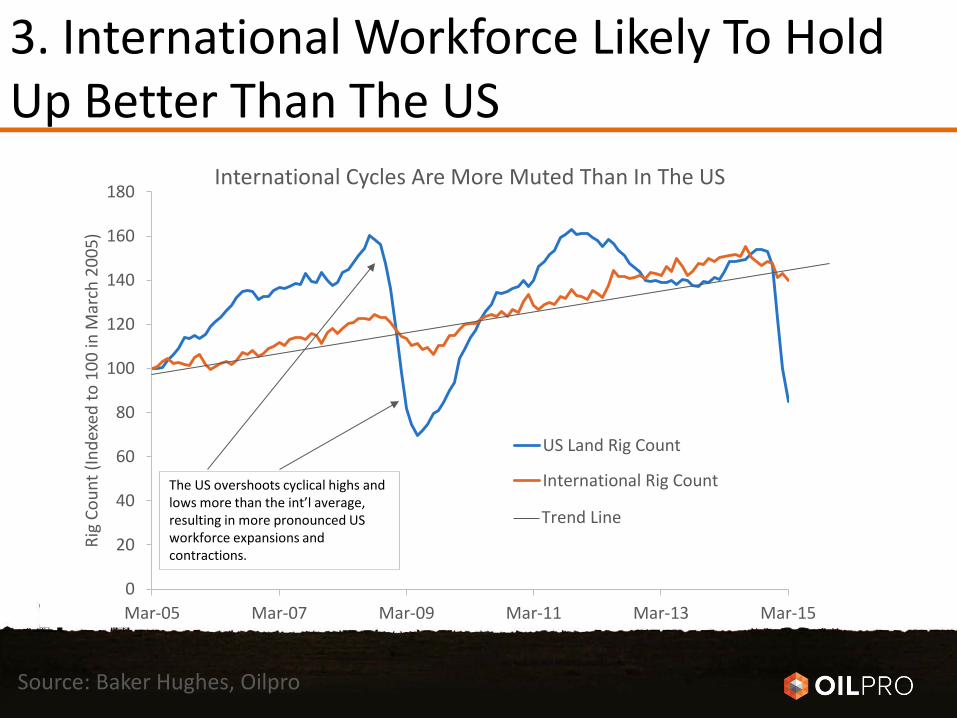
3. International Workforce Likely To Hold Up Better Than The US
0
20
40
60
80
100
120
140
160
180
Mar-05 Mar-07 Mar-09 Mar-11 Mar-13 Mar-15
Rig
Coun
t (In
dexe
d to
100
in M
arch
200
5)
International Cycles Are More Muted Than In The US
US Land Rig Count
International Rig Count
Trend Line
Source: Baker Hughes, Oilpro
The US overshoots cyclical highs and lows more than the int’l average, resulting in more pronounced US workforce expansions and contractions.
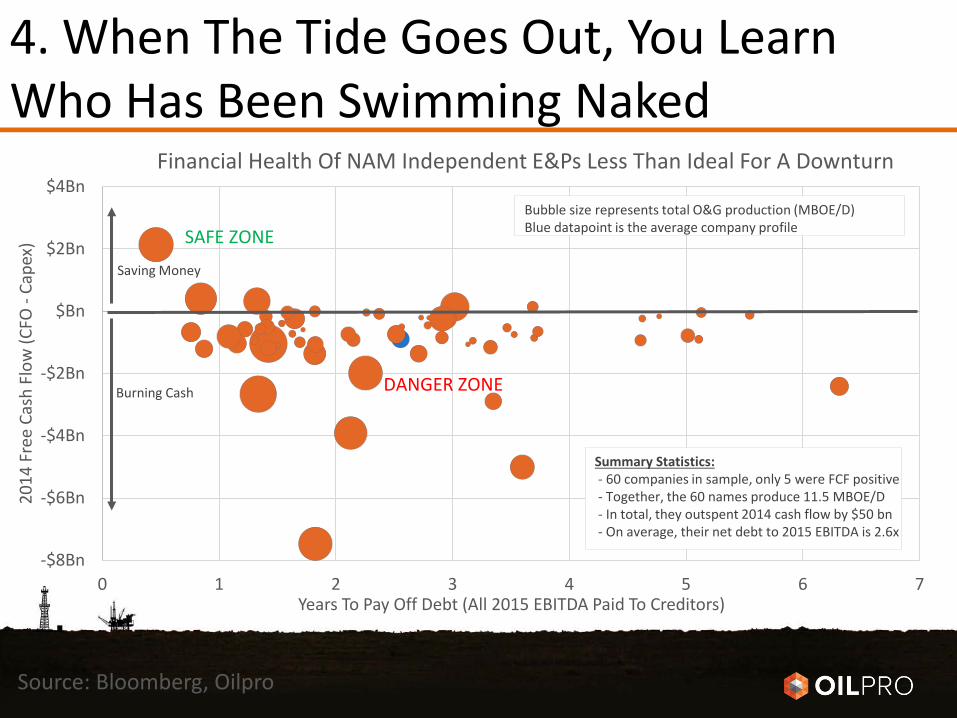
4. When The Tide Goes Out, You Learn Who Has Been Swimming Naked
-$8Bn
-$6Bn
-$4Bn
-$2Bn
$Bn
$2Bn
$4Bn
0 1 2 3 4 5 6 7
2014
Fre
e Ca
sh F
low
(CFO
- Ca
pex)
Years To Pay Off Debt (All 2015 EBITDA Paid To Creditors)
Financial Health Of NAM Independent E&Ps Less Than Ideal For A Downturn
Bubble size represents total O&G production (MBOE/D) Blue datapoint is the average company profile
Saving Money
Burning Cash
Summary Statistics: - 60 companies in sample, only 5 were FCF positive - Together, the 60 names produce 11.5 MBOE/D - In total, they outspent 2014 cash flow by $50 bn - On average, their net debt to 2015 EBITDA is 2.6x
SAFE ZONE
DANGER ZONE
Source: Bloomberg, Oilpro
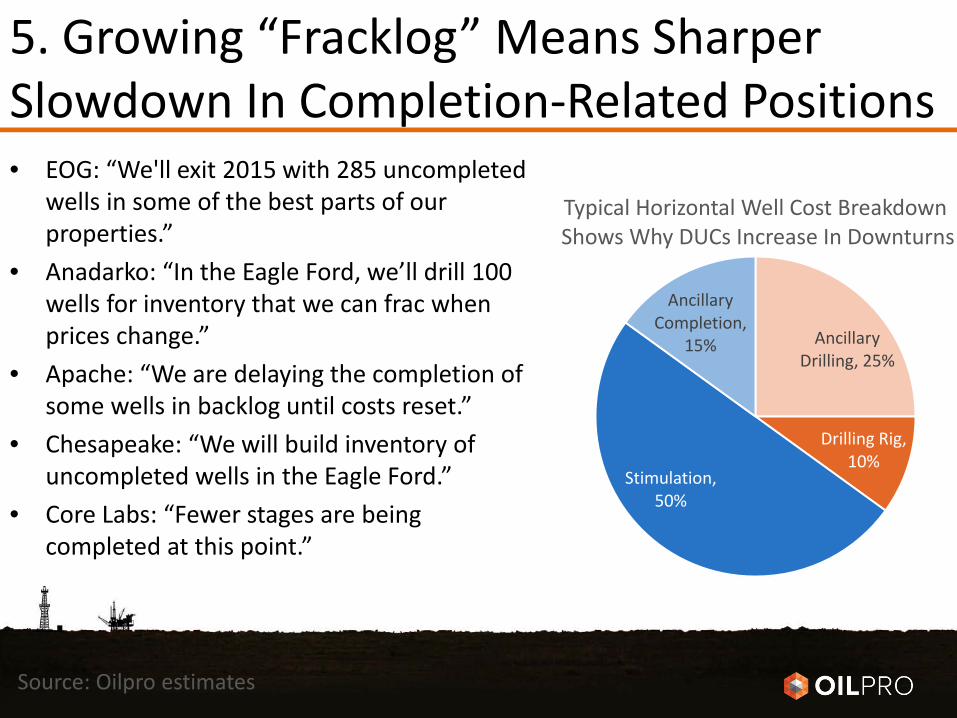
5. Growing “Fracklog” Means Sharper Slowdown In Completion-Related Positions • EOG: “We'll exit 2015 with 285 uncompleted
wells in some of the best parts of our properties.”
• Anadarko: “In the Eagle Ford, we’ll drill 100 wells for inventory that we can frac when prices change.”
• Apache: “We are delaying the completion of some wells in backlog until costs reset.”
• Chesapeake: “We will build inventory of uncompleted wells in the Eagle Ford.”
• Core Labs: “Fewer stages are being completed at this point.”
Ancillary Drilling, 25%
Drilling Rig, 10%
Stimulation, 50%
Ancillary Completion,
15%
Typical Horizontal Well Cost Breakdown Shows Why DUCs Increase In Downturns
Source: Oilpro estimates
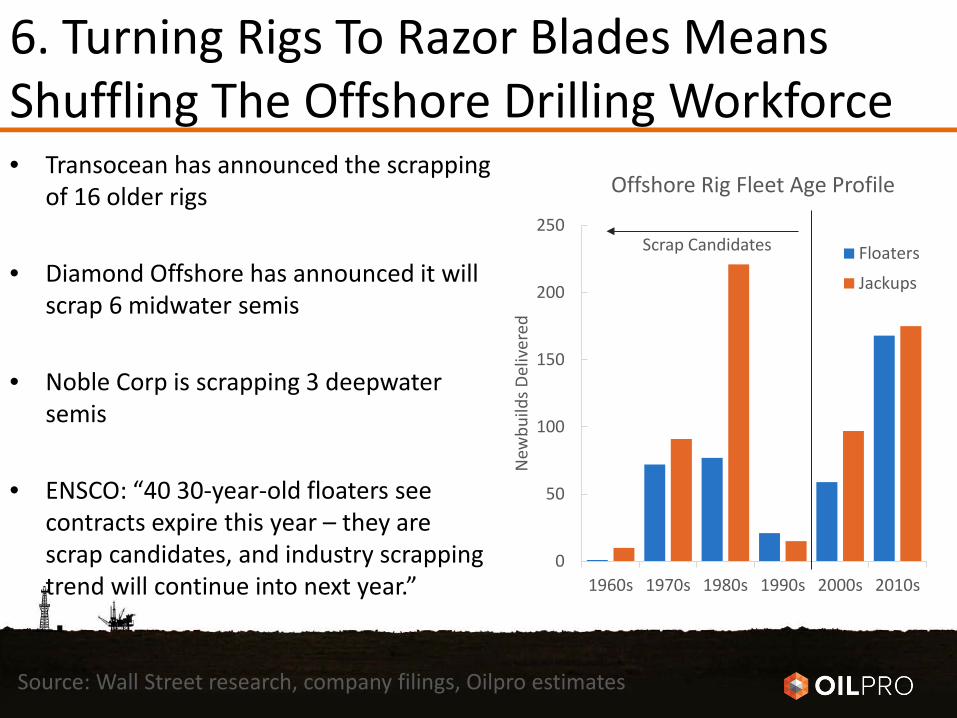
6. Turning Rigs To Razor Blades Means Shuffling The Offshore Drilling Workforce • Transocean has announced the scrapping
of 16 older rigs
• Diamond Offshore has announced it will scrap 6 midwater semis
• Noble Corp is scrapping 3 deepwater semis
• ENSCO: “40 30-year-old floaters see contracts expire this year – they are scrap candidates, and industry scrapping trend will continue into next year.”
0
50
100
150
200
250
1960s 1970s 1980s 1990s 2000s 2010s
New
build
s Del
iver
ed
Offshore Rig Fleet Age Profile
Floaters
Jackups
Scrap Candidates
Source: Wall Street research, company filings, Oilpro estimates
7. M&A Activity Will Pick Up • Plenty of good opportunities in the scorched earth of US shale
• Look for frequent smaller deals and a few large ones
• Bottom tier E&Ps will struggle in new environment, to become take-out candidates
• Majors, NOCs, Private Equity will all be looking at the US independent E&Ps
• HAL / BHI encourages more consolidation in oilfield services

Steady As She Goes – The Storm Before The Calm
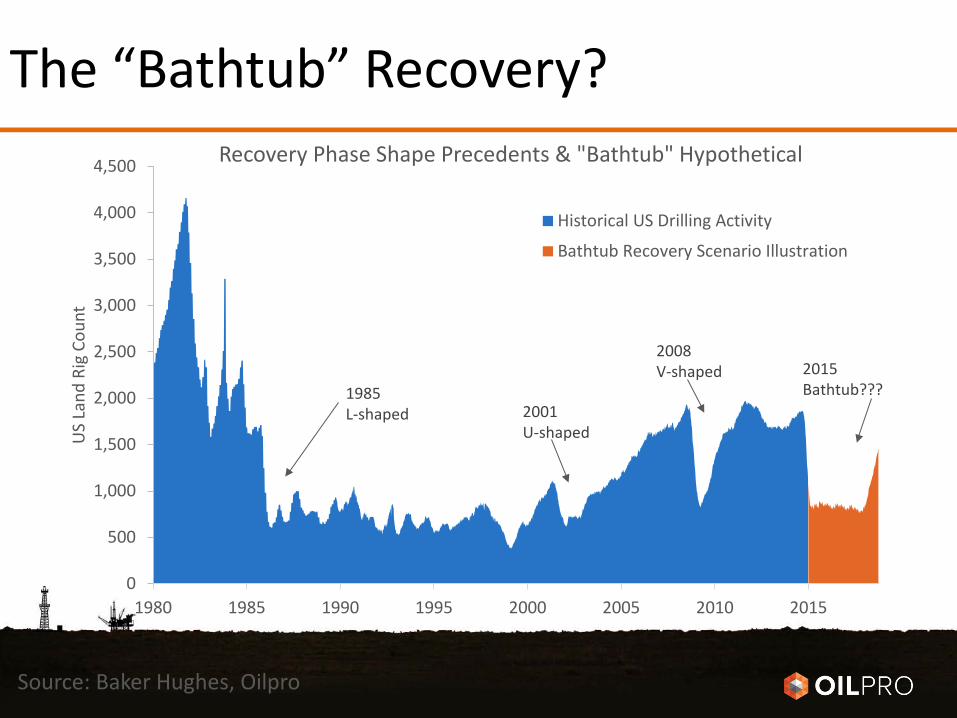
The “Bathtub” Recovery?
Source: Baker Hughes, Oilpro
0
500
1,000
1,500
2,000
2,500
3,000
3,500
4,000
4,500
1980 1985 1990 1995 2000 2005 2010 2015
US
Land
Rig
Cou
nt
Recovery Phase Shape Precedents & "Bathtub" Hypothetical
Historical US Drilling Activity
Bathtub Recovery Scenario Illustration
1985 L-shaped
2008 V-shaped
2001 U-shaped
2015 Bathtub???
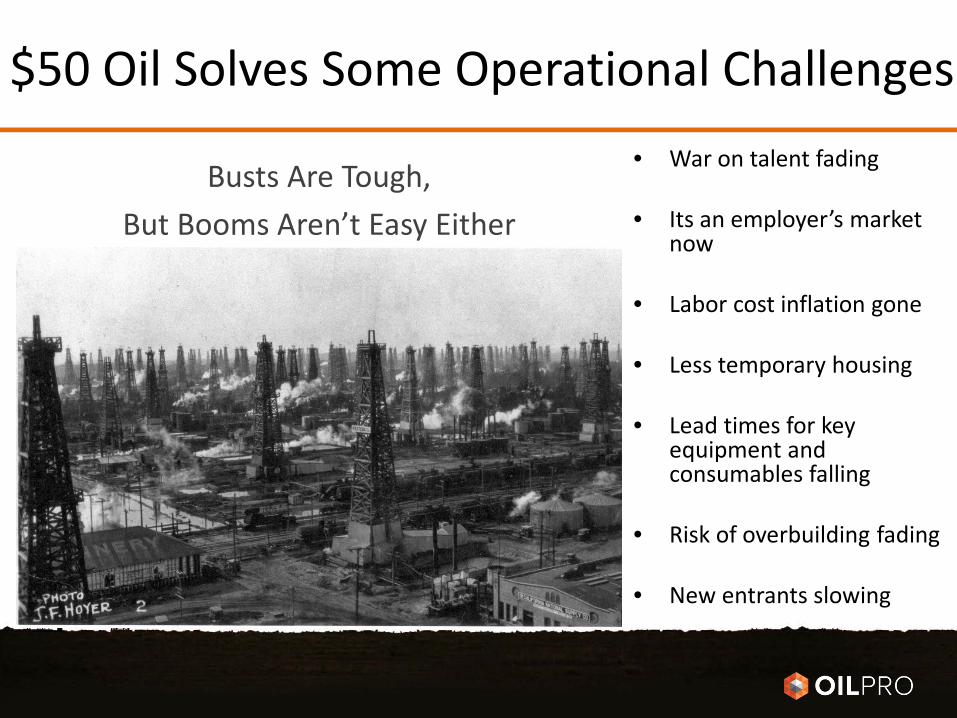
$50 Oil Solves Some Operational Challenges • War on talent fading
• Its an employer’s market
now
• Labor cost inflation gone
• Less temporary housing
• Lead times for key equipment and consumables falling
• Risk of overbuilding fading
• New entrants slowing
Busts Are Tough, But Booms Aren’t Easy Either
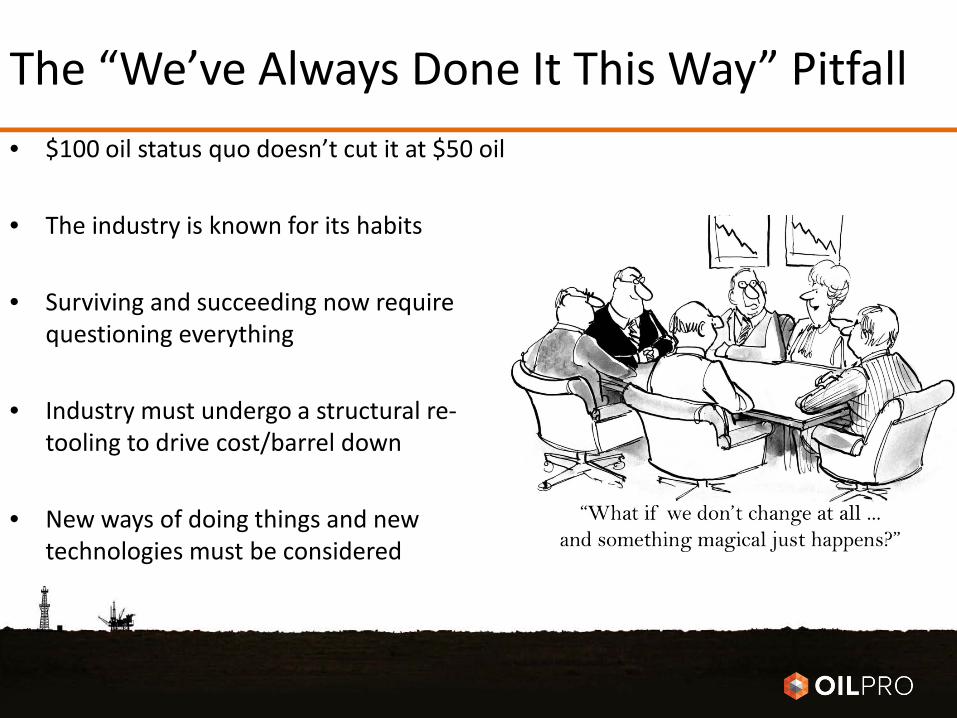
The “We’ve Always Done It This Way” Pitfall • $100 oil status quo doesn’t cut it at $50 oil
• The industry is known for its habits
• Surviving and succeeding now require
questioning everything
• Industry must undergo a structural re-tooling to drive cost/barrel down
• New ways of doing things and new technologies must be considered
Niches That Can Thrive In A $50 Oil World • Technology, integration & collaborative workflows that
reduce the cost of a barrel will gain traction
• New teams forming across non-traditional groupings
• Mature fields have a low-cost-barrel advantage
• Midstream & US oil storage capacity build out growing
• Production-related services to stay busy (EOR, well maintenance / servicing, re-fracturing old wells)
Final Thoughts • Operating costs are the problem today, but workforce readiness will be the problem
tomorrow
• $70 oil is the new $100 oil – just as $40- oil is unsustainable, so too is $100+ oil given the “flip the switch” factor on US oil production at $100 oil
• Elongated U-shaped recovery more likely than a V-shaped rebound
• Industry is recalibrating & will continue to re-tool for several years
• Layoffs & capex cuts come first, but new workflows, technologies, & teams are needed
• Opportunities exist for creative companies – lowering the cost per barrel is critical, it is an employer’s market now, revisiting mature fields is a big opportunity
• Recovery roadmap: Watch O&G equities, US oil production & storage data, 1Q EPS conference calls in April, and the June OPEC meeting results

Questions / Contact Info
• Questions about these trends and other O&G issues can be posed to an engaged community of industry professionals at Oilpro.com/questions
• You can connect with and contact Joseph Triepke at Oilpro.com or by email at [email protected]

About Author: Joseph Triepke Managing Director, Oilpro.com Joseph Triepke is a finance professional with a decade of upstream experience. As an energy investor and analyst for institutions like Citadel, Guggenheim, and Jefferies, he focused on O&G industry research and analysis. Today, he is Managing Director at Oilpro.com where he oversees content created by the community and publishes his own research on oil services, equipment and drilling. Joseph earned a Bachelor’s of Business Administration in Finance from UT Austin with Honors in 2004, has successfully completed 2/3 CFA examinations, and currently resides with his wife in Dallas, TX.

Appendix
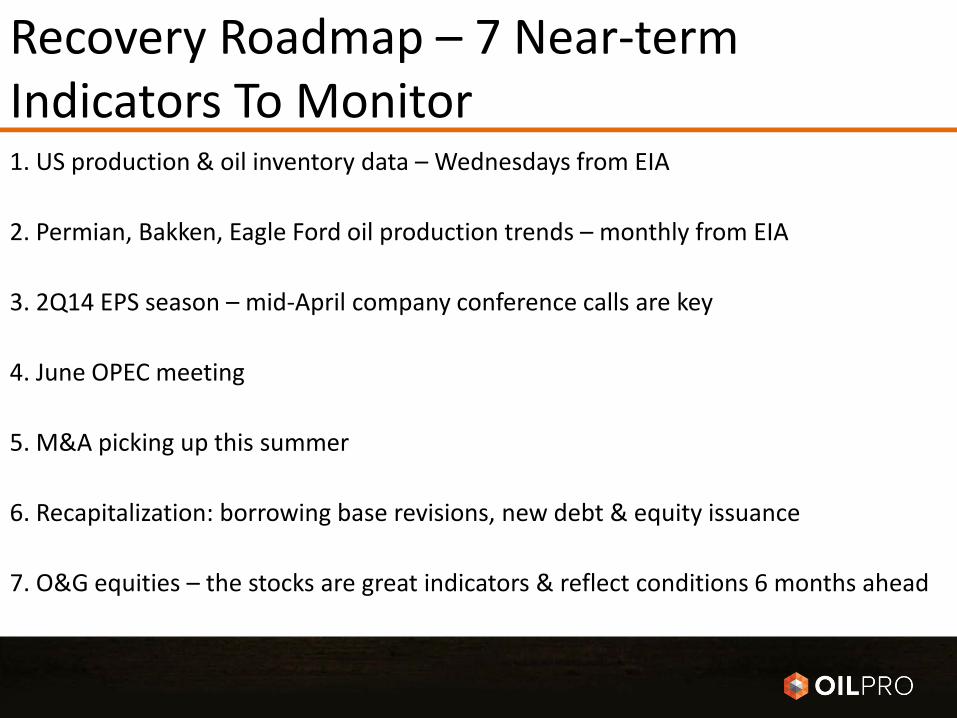
Recovery Roadmap – 7 Near-term Indicators To Monitor 1. US production & oil inventory data – Wednesdays from EIA
2. Permian, Bakken, Eagle Ford oil production trends – monthly from EIA
3. 2Q14 EPS season – mid-April company conference calls are key
4. June OPEC meeting
5. M&A picking up this summer
6. Recapitalization: borrowing base revisions, new debt & equity issuance
7. O&G equities – the stocks are great indicators & reflect conditions 6 months ahead
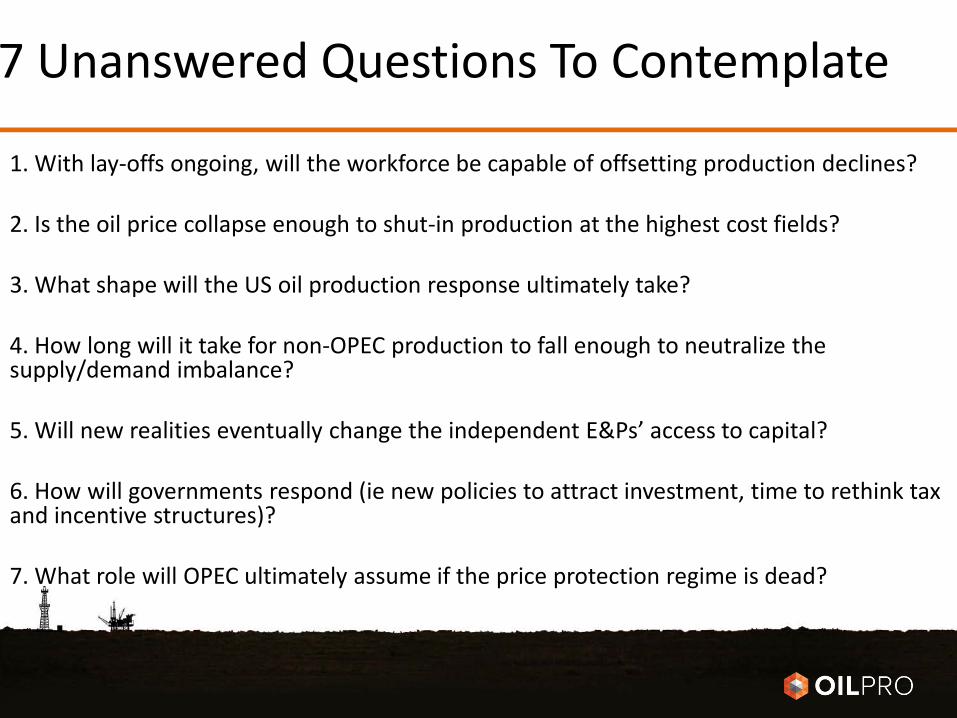
7 Unanswered Questions To Contemplate
1. With lay-offs ongoing, will the workforce be capable of offsetting production declines? 2. Is the oil price collapse enough to shut-in production at the highest cost fields?
3. What shape will the US oil production response ultimately take?
4. How long will it take for non-OPEC production to fall enough to neutralize the supply/demand imbalance?
5. Will new realities eventually change the independent E&Ps’ access to capital?
6. How will governments respond (ie new policies to attract investment, time to rethink tax and incentive structures)?
7. What role will OPEC ultimately assume if the price protection regime is dead?
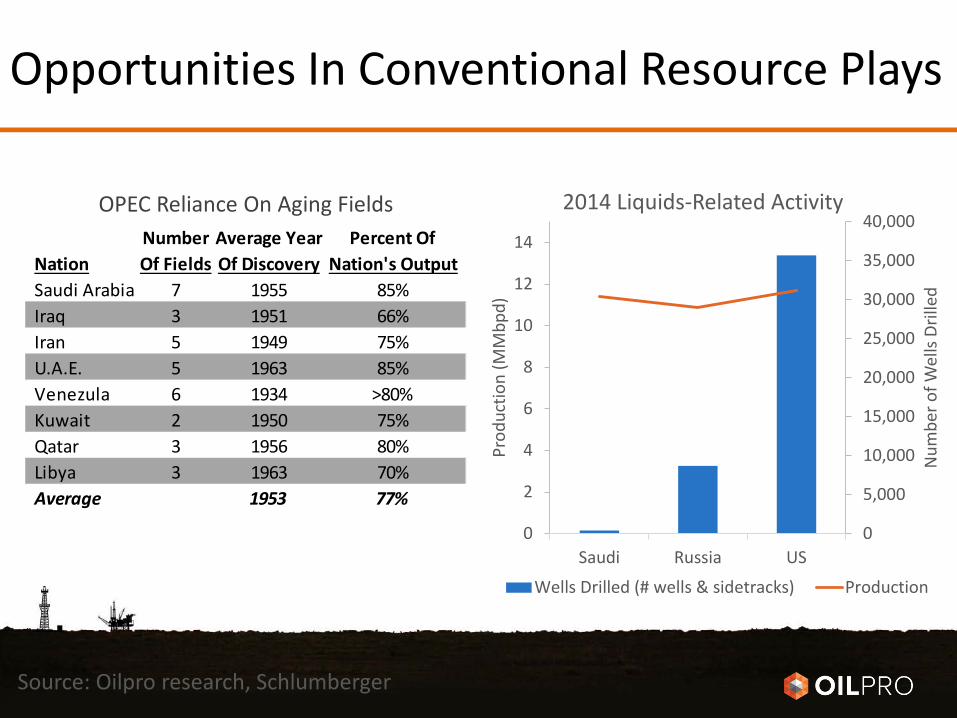
Opportunities In Conventional Resource Plays
Source: Oilpro research, Schlumberger
Number Average Year Percent OfNation Of Fields Of Discovery Nation's OutputSaudi Arabia 7 1955 85%Iraq 3 1951 66%Iran 5 1949 75%U.A.E. 5 1963 85%Venezula 6 1934 >80%Kuwait 2 1950 75%Qatar 3 1956 80%Libya 3 1963 70%Average 1953 77%
OPEC Reliance On Aging Fields
0
5,000
10,000
15,000
20,000
25,000
30,000
35,000
40,000
0
2
4
6
8
10
12
14
Saudi Russia US
Num
ber o
f Wel
ls Dr
illed
Prod
uctio
n (M
Mbp
d)
2014 Liquids-Related Activity
Wells Drilled (# wells & sidetracks) Production
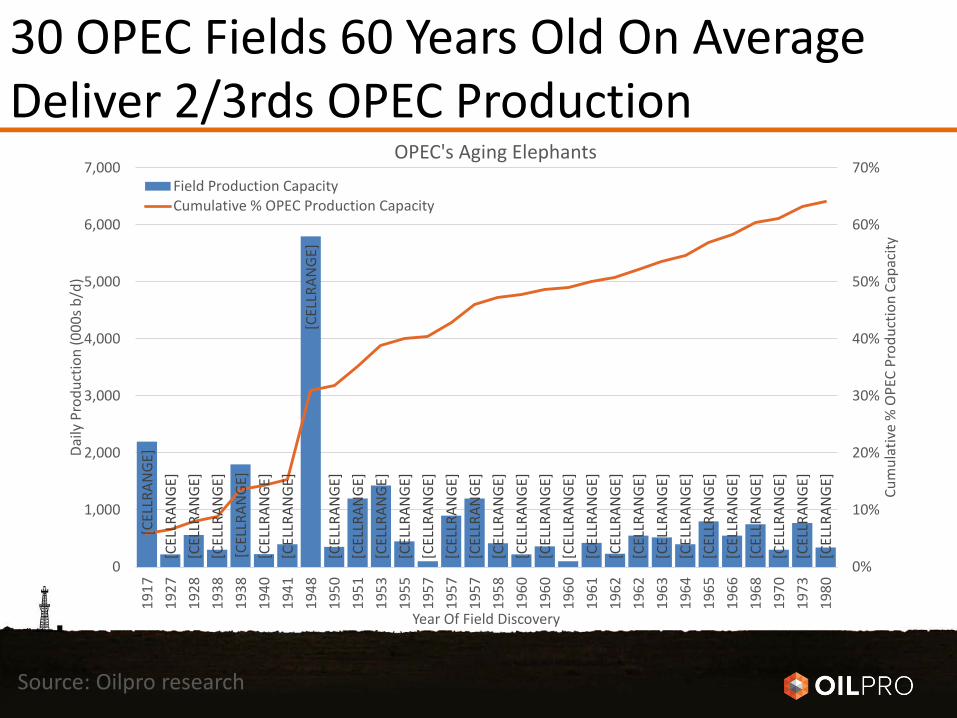
30 OPEC Fields 60 Years Old On Average Deliver 2/3rds OPEC Production
Source: Oilpro research
[CEL
LRAN
GE]
[CEL
LRAN
GE]
[CEL
LRAN
GE]
[CEL
LRAN
GE]
[CEL
LRAN
GE]
[CEL
LRAN
GE]
[CEL
LRAN
GE]
[CEL
LRAN
GE]
[CEL
LRAN
GE]
[CEL
LRAN
GE]
[CEL
LRAN
GE]
[CEL
LRAN
GE]
[CEL
LRAN
GE]
[CEL
LRAN
GE]
[CEL
LRAN
GE]
[CEL
LRAN
GE]
[CEL
LRAN
GE]
[CEL
LRAN
GE]
[CEL
LRAN
GE]
[CEL
LRAN
GE]
[CEL
LRAN
GE]
[CEL
LRAN
GE]
[CEL
LRAN
GE]
[CEL
LRAN
GE]
[CEL
LRAN
GE]
[CEL
LRAN
GE]
[CEL
LRAN
GE]
[CEL
LRAN
GE]
[CEL
LRAN
GE]
[CEL
LRAN
GE]
0%
10%
20%
30%
40%
50%
60%
70%
0
1,000
2,000
3,000
4,000
5,000
6,000
7,00019
1719
2719
2819
3819
3819
4019
4119
4819
5019
5119
5319
5519
5719
5719
5719
5819
6019
6019
6019
6119
6219
6219
6319
6419
6519
6619
6819
7019
7319
80
Cum
ulat
ive
% O
PEC
Prod
uctio
n Ca
paci
ty
Daily
Pro
duct
ion
(000
s b/d
)
Year Of Field Discovery
OPEC's Aging Elephants Field Production CapacityCumulative % OPEC Production Capacity
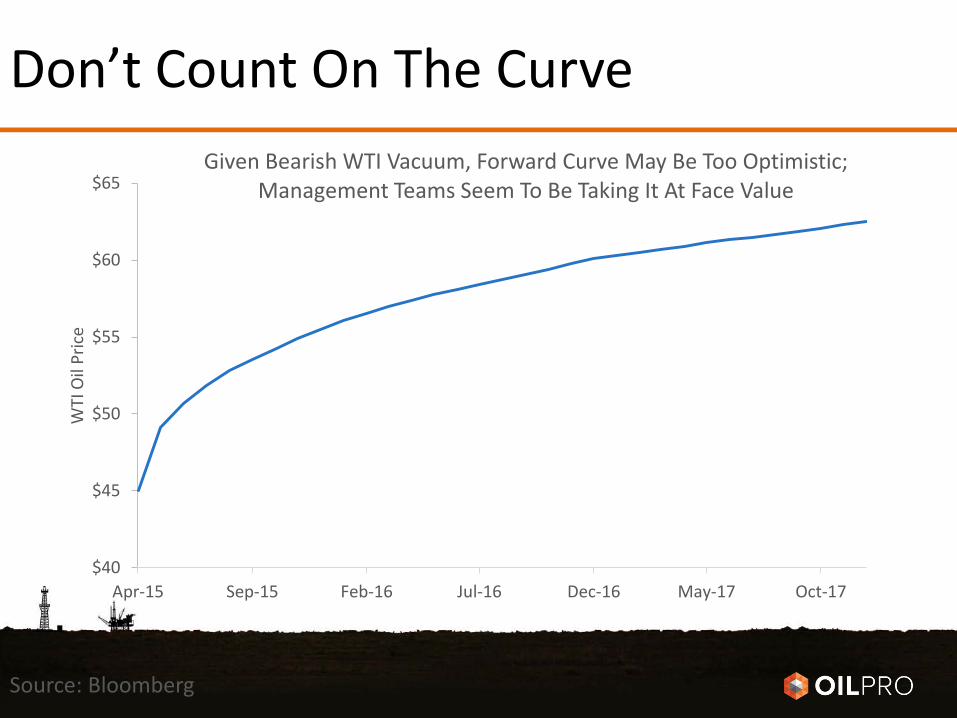
Don’t Count On The Curve
Source: Bloomberg
$40
$45
$50
$55
$60
$65
Apr-15 Sep-15 Feb-16 Jul-16 Dec-16 May-17 Oct-17
WTI
Oil
Pric
e
Given Bearish WTI Vacuum, Forward Curve May Be Too Optimistic; Management Teams Seem To Be Taking It At Face Value