Embed Size (px)
Citation preview

Initial Public OfferingsAustralian Mid-market Activity Q2, 2017Financial Year

The focus of the analysis is on the current quarter and the immediately preceding 12 months with the aim of
providing you with an overview of the current mid-market IPO activity.
In our analysis we have looked at IPOs that had an enterprise value of less than $200m at the time of listing.
We have also provided some further detail on the cost of IPOs broken down by market capitalisation and the
performance of IPOs occurring in the last twelve months by significant sectors.
Key highlights are:
■ There were 29 IPOs for mid-market companies in the quarter, the most in the last five years
■ Information technology, continues to be the most active sector with 7 IPOs in the quarter and mining
related was the second most active sector with 6 IPOs in the quarter
■ The financials sector showed a significant increase in activity recording 5 IPOs in the quarter. Prior to this
period the sector had only recorded 2 IPOs in the previous 12 months.
■ Mid-market companies raised $439m on the ASX in the quarter; the highest since Q2 2015
■ The average IPO fundraising was $15.1m which is a 37% decrease on the previous quarter and 17%
decrease compared to the average of $18.2m over the last 12 months
■ On average transaction costs (excluding brokerage fees) decreased by 23% to $234,411
We are happy to present our quarterly review of the mid-market IPOs on the ASX
Introduction
Initial Public Offerings Review - Q2, 2017 Financial Year2
Number of IPOs and funds raised by quarter
The number of IPOs increased by 15% for the 12 month
period. Historically the second quarter of the financial year
has been the most active quarter and this quarter has been
the most active quarter over the last 4 and a half years
The total funds raised of $439m is higher than the prior
quarter and the each quarter in the last year. The average
fundraising at $15.1m was 37% lower than the prior
quarter and 17% lower than last 12 months average.
The average enterprise value at IPO in the quarter was
$52.5m which is down from $57.6m in the previous quarter
and down from last year’s average in the same period of
$62.7m.
There were 29 IPOs in the mid-market this quarter, which is a 61% increase from last quarter and 45% increase compared to the same quarter last year.
Overview
60
50
40
30
20
10
0
$700.0m
$600.0m
$500.0m
$400.0m
$300.0m
$200.0m
$100.0m
-Q1 Q2 Q3
2015
Q4 Q1 Q2 Q3
2016
Q4
Source: S&P Capital IQ and Nexia analysis
Number of IPOs (LHS) Funds raised (RHS)
Q1
2017
Q2
Initial Public Offerings Review - Q2, 2017 Financial Year 3

Quarterly Activity
Of the 29 IPOs in the quarter, the information technology, mining related and financials were the most active sectors with 7,6 and 5 IPOs respectively occurring in each sector. Of the $439m raised in the quarter, $137.1m was raised in the financials sector the majority of which was from the Watermark Global Leaders Fund Limited IPO.
The following funds were raised by sector in the quarter:
Industrials
Information Technology
Consumer Discretionary
Mining Related
Financials
Information Technology
$57.5m
Other $47.0m
Financials$137.1m
Consumer Discretionary
$60.9m
Mining Related$77.6m
Industrials $35.2m
Initial Public Offerings Review - Q2, 2017 Financial Year4

Source: S&P Capital IQ and Nexia analysis
Company Name Industry Sector Industry Industry Primary Gross Proceeds
EV IPO
Midway Limited Materials Paper and Forest Products
Paper and allied products $37,000,000 $196,000,000
Broo Limited Consumer Staples Beverages Malt beverages $170,000,000
Murray River Organics Group Limited
Consumer Staples Food Products Canned, frozen, and preserved fruits, vegetables, and food specialties
$35,000,000 $135,000,000
Boyuan Holdings Limited Real Estate Real Estate Management and Development
Subdividers and developers $19,000,000 $99,000,000
VEEM Ltd. Industrials Machinery Construction, mining, and materials handling machinery and equipment
$25,000,000 $93,000,000
Freedom Insurance Group Ltd.
Financials Insurance Life insurance $15,000,000 $93,000,000
Watermark Global Leaders Fund Limited
Financials Capital Markets Investors $91,000,000 $91,000,000
Dreamscape Networks Limited
Information Technology Internet Software and Services
Computer programming, data processing, and other computer related services
$25,000,000 $74,000,000
Axsesstoday Limited Financials Consumer Finance Miscellaneous business credit institutions
$10,000,000 $58,000,000
CFOAM Limited Materials Chemicals $9,000,000 $57,000,000
Automotive Solutions Group Ltd
Consumer Discretionary Auto Components Motor vehicle parts and accessories
$31,000,000 $47,000,000
Horizon Gold Limited Materials Metals and Mining Gold and silver ores $15,000,000 $42,000,000
Mayfield Childcare Limited
Consumer Discretionary Diversified Consumer Services
Child day care services $24,000,000 $40,000,000
Litigation Capital Management Limited
Financials Diversified Financial Services
Miscellaneous business credit institutions
$15,000,000 $40,000,000
DomaCom Limited Financials Capital Markets Security and commodity brokers, dealers, exchanges, and services
$6,000,000 $40,000,000
Sensera Limited Information Technology Semiconductors and Semiconductor Equipment
0 $10,000,000 $39,000,000
Getswift Limited Information Technology Software Prepackaged software $5,000,000 $37,000,000
Faster Enterprises Ltd Real Estate Real Estate Management and Development
0 $5,000,000 $34,000,000
Powerhouse Ventures Limited
Industrials Professional Services Engineering, accounting, research, management, and related services
$10,000,000 $26,000,000
Kalium Lakes Limited Materials Chemicals Mining and quarrying of nonmetallic minerals, except fuels
$6,000,000 $26,000,000
Neurotech International Limited
Healthcare Healthcare Equipment and Supplies
Electromedical equipment $7,000,000 $25,000,000
OpenDNA Limited Information Technology Internet Software and Services
Information retrieval services $10,000,000 $17,000,000
Creso Pharma Limited Healthcare Pharmaceuticals $5,000,000 $17,000,000
Gooroo Ventures Limited
Information Technology Internet Software and Services
$5,000,000 $17,000,000
Bod Australia Limited Consumer Discretionary Distributors $6,000,000 $14,000,000
HearMeOut Ltd. Information Technology Software $7,000,000 $13,000,000
Great Boulder Resources Limited
Materials Metals and Mining $6,000,000 $11,000,000
Dragontail Systems, LTD. Information Technology Software Prepackaged software $6,000,000 $7,000,000
Technology Metals Australia Limited
Materials Metals and Mining $4,000,000 $5,000,000
Initial Public Offerings Review - Q2, 2017 Financial Year 5
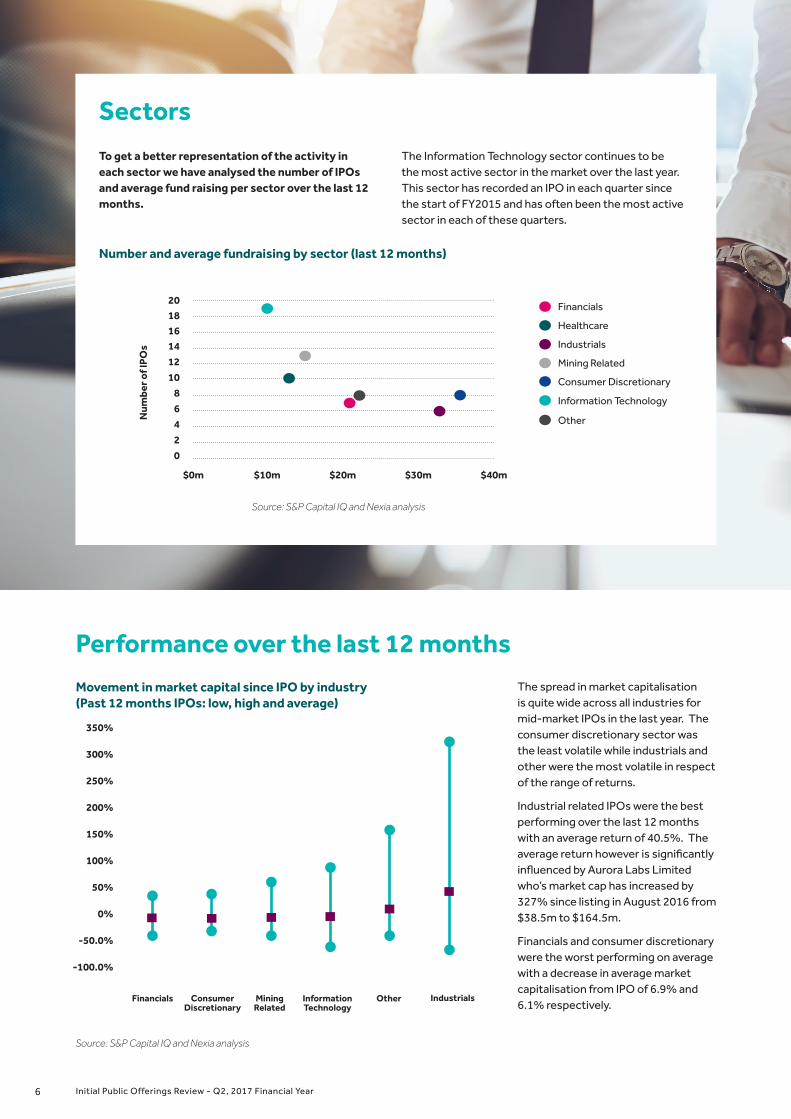
Movement in market capital since IPO by industry (Past 12 months IPOs: low, high and average)
350%
300%
250%
200%
150%
100%
50%
0%
-50.0%
-100.0%
Financials Consumer Discretionary
Mining Related
Information Technology
Other Industrials
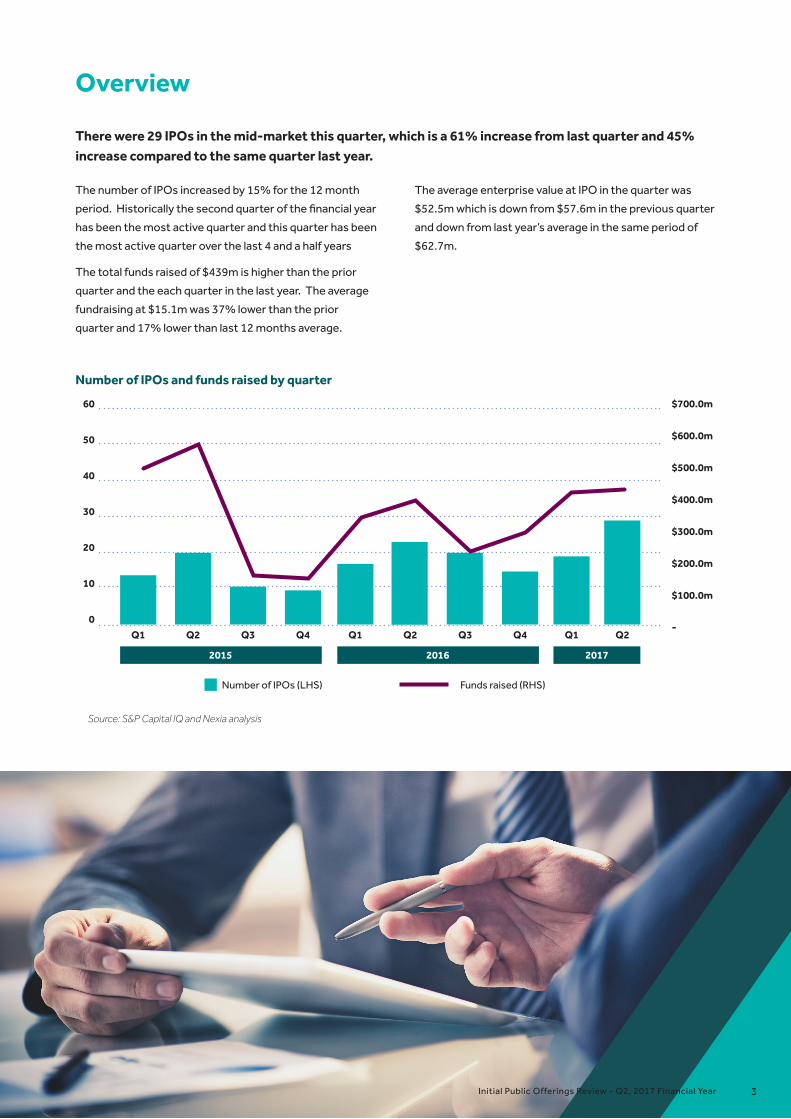
To get a better representation of the activity in each sector we have analysed the number of IPOs and average fund raising per sector over the last 12 months.
The Information Technology sector continues to be the most active sector in the market over the last year. This sector has recorded an IPO in each quarter since the start of FY2015 and has often been the most active sector in each of these quarters.
Source: S&P Capital IQ and Nexia analysis
Source: S&P Capital IQ and Nexia analysis
Sectors
The spread in market capitalisation is quite wide across all industries for mid-market IPOs in the last year. The consumer discretionary sector was the least volatile while industrials and other were the most volatile in respect of the range of returns.
Industrial related IPOs were the best performing over the last 12 months with an average return of 40.5%. The average return however is significantly influenced by Aurora Labs Limited who’s market cap has increased by 327% since listing in August 2016 from $38.5m to $164.5m.
Financials and consumer discretionary were the worst performing on average with a decrease in average market capitalisation from IPO of 6.9% and 6.1% respectively.
Performance over the last 12 months
Number and average fundraising by sector (last 12 months)
Num
ber o
f IPO
s
201816141210
86420
$0m $10m $20m $30m $40m
Financials
Healthcare
Industrials
Mining Related
Consumer Discretionary
Information Technology
Other
Initial Public Offerings Review - Q2, 2017 Financial Year6

Methodology
The analysis was prepared based on data sourced from S&P Capital IQ. Data analysed is for completed IPOs on the ASX, from 1 July 2014 to 30 September 2016, with an implied enterprise value of less than $200m. If no implied enterprise value was disclosed at the IPO filling date, transactions were adjusted to be the first enterprise value disclosed within the preceding 90 days. In the 17 occurrences where no enterprise value was disclosed during this period, it was calculated by adding total debt at the filing date to the number of shares offered multiplied by the offer price. Of the 17 occurrences that were manually adjusted there were 10 instances where the value was not within 25% of the market capitalisation at the IPO date.
Movement in market capital since IPO by industry (Past 12 months IPOs: low, high and average)
Certain costs in undertaking an IPO, being accounting and legal costs, are typically fixed regardless of the outcome.
Fundraising costs, on the other hand, are generally paid on successful completion of the IPO and represent a percentage of proceeds raised. Accordingly, fundraising costs have been excluded from our analysis.
A number of factors will impact the costs incurred, including how prepared the company is for the IPO, the complexity of its business and whether there are any related transactions. Over the last year, the fixed costs for an IPO have averaged $268,545 compared to $332,055 for the corresponding period in the prior year.
The peak in transaction costs for companies with a market cap at listing of $75-$150m is the result of Frontier Digital Ventures Limited’s IPO in the September 2015. This IPO recorded legal costs of $1.0m which is significantly above the average legal fees for this size entity in the last 12 months of $405,000.
Costs
Transaction costs by market capital size
$1.6m
$1.4m
$1.2m
$1.0m
$0.8m
$0.6m
$0.4m
$0.2m
-$0 - $10m $10 - $75m $75 - $150m $150m - $200m
Market capital at listing
Source: S&P Capital IQ and Nexia analysis
$63k$190k
$394k$511k
Of the 131 transactions analysed there was sufficient data for 42% of the transactions to calculate the average accounting fees per transaction and there was sufficient data for 86% of the transactions to calculate the average legal fees per transaction.
About Nexia
Nexia Australia represents a network of solutions focused accountancy and consultancy firms in Australia which is supported by global links to Nexia International. We offer a full service accounting solution with experienced partners and an enthusiastic team.
Nexia Australia services clients from small to medium enterprises, large private company groups, not-for-profit entities, subsidiaries of international companies, publicly listed companies and high net worth individuals and includes market leaders in many sectors of Australian business.
With over 75 partners and more than 600 staff, Nexia Australia has grown into one of Australia’s leading chartered accountancy firms with offices in Adelaide, Brisbane, Canberra, Darwin, Melbourne, Perth, Sydney and New Zealand (Christchurch).
We offer a comprehensive range of services in the areas of Audit & Assurance, Business Advisory, Corporate Advisory, Family Office, Finance & Lending Services, Financial Services, Forensic Accounting, Management Consulting, Superannuation Solutions, Taxation Consulting .
We pride ourselves on having the skills and experience to deliver effective solutions to all our clients. We make our advice easy to understand and back it up with one-to-one contact, with partners always accessible.
Nexia Australia is continually evolving to find the next solution, building on over 40 years of experience to focus on fresh ideas and perspectives that make the difference.
Our objective is to grow your business through strategic and proactive thinking and utilising the strength of our global Network.
The key to our success is simple: the strength of our member firms in major global financial and economic centres, providing expertise in each of our local jurisdictions. With members in all major world economies, Nexia International delivers:
■ A global resource of professional expertise offering
a comprehensive portfolio of assurance, tax and
advisory services and solutions
■ Access to detailed knowledge of local regulations,
cultures and customs
■ Consistently high levels of client service and
solution based insights, built on strong, long lasting
professional relationships.
Our Nexia name is a promise. When you are dealing with a Nexia firm anywhere in the world, you can always count on us being:
agile | accessible | advancing
Initial Public Offerings Review - Q2, 2017 Financial Year 7

Adelaide OfficeHugh McPharlin Level 3, 153 Flinders Street Adelaide SA 5000GPO Box 2163, Adelaide SA 5001p +61 8 8139 1111, f +61 8 8139 [email protected] www.nexiaem.com.au
Brisbane OfficeKen RobertsonLevel 28, 10 Eagle Street Brisbane QLD 4000 GPO Box 1189 Brisbane QLD 4001 p +61 7 3229 2022, f +61 7 3229 3277 [email protected], www.nexia.com.au
Brisbane South OfficeMalcolm Mathews 1187 Logan Road, Holland Park QLD 4121 PO Box 63, Mt Gravatt, QLD 4122 p +61 7 3343 6333, f +61 7 3849 8598 [email protected] www.nexia.com.au
Canberra OfficeKelly Brown Level 7, St George Centre, 60 Marcus Clarke StreetGPO Box 500, Canberra ACT 2601p +61 2 6279 5400, f +61 2 6279 [email protected] www.nexia.com.au
Darwin OfficeNoel CliffordLevel 2, 62 Cavenagh Street Darwin NT 0800GPO Box 3770, Darwn NT 0801p +61 8 8981 5585, f +61 8 8981 5586 [email protected] www.nexiaemnt.com.au
Contact usFor further information or to discuss how Nexia Australia can assist your organisation, please contact a local Nexia Advisor below.
Melbourne Office Vito InterlandiLevel 12, 31 Queen Street Melbourne VIC 3000p +61 3 8613 8888, f +61 3 8613 8800 [email protected]
Perth OfficeMal Di Giulio Level 3, 88 William Street, Perth WA 6000GPO Box 2570, Perth WA 6001p +61 8 9463 2463, f +61 8 9463 [email protected]
Sydney OfficeBrent GoldmanLevel 16, 1 Market Street, Sydney NSW 2000PO Box H195, Australia Square, NSW 1215p +61 2 9251 4600, f +61 2 9251 [email protected]
New Zealand OfficeGreg Cowles Level 4, 123 Victoria Street, Christchurch PO Box 4160, Christchurchp +64 3 379 0829, f +64 3 366 [email protected] www.nexiachch.co.nz
The material contained in this publication is for general information purposes only and does not constitute professional advice or recommendation from Nexia Australia. Regarding any situation or circumstance, specific professional advice should be sought on any particular matter by contacting your Nexia Representative.