Embed Size (px)
Citation preview
MythMyth
The Generation Gap Market Research
Authors & Project Team:
Victoria Carbone
Silvia Azmitia
Jason Dunstone
Data collected:
March 2009
Square Holes in partnership with
Australian Institute of Management SA
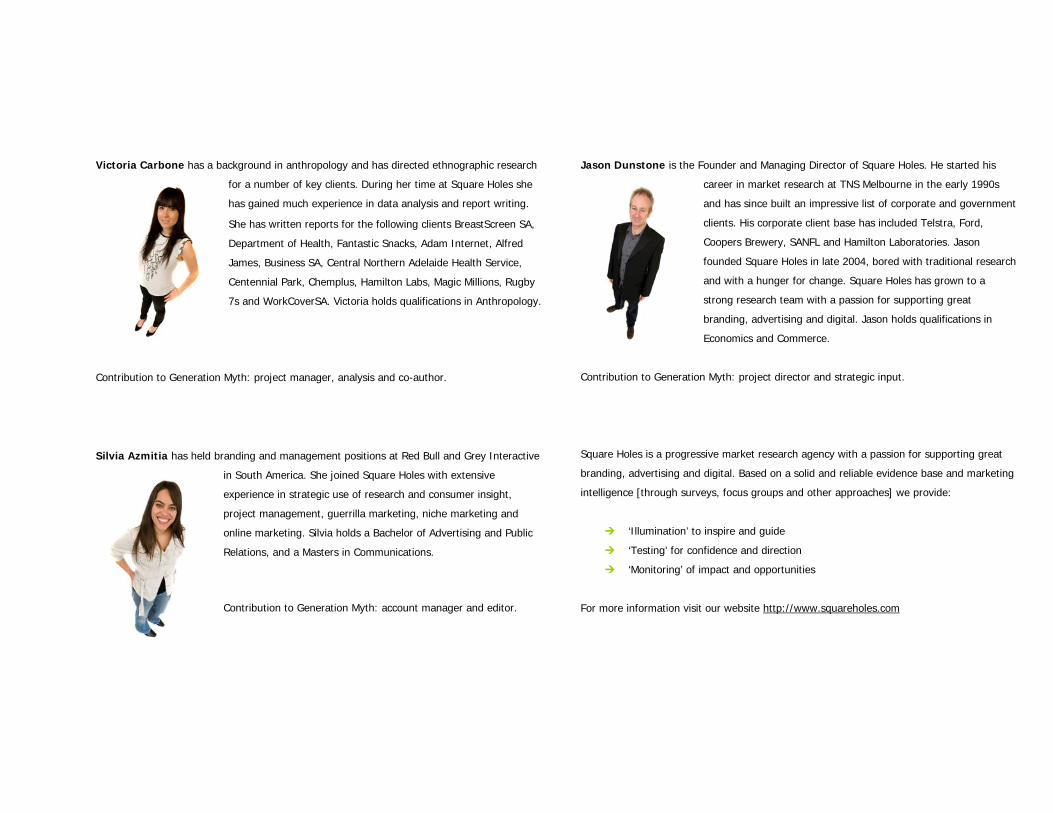
Victoria Carbone has a background in anthropology and has directed ethnographic research
for a number of key clients. During her time at Square Holes she
has gained much experience in data analysis and report writing.
She has written reports for the following clients BreastScreen SA,
Department of Health, Fantastic Snacks, Adam Internet, Alfred
James, Business SA, Central Northern Adelaide Health Service,
Centennial Park, Chemplus, Hamilton Labs, Magic Millions, Rugby
7s and WorkCoverSA. Victoria holds qualifications in Anthropology.
Contribution to Generation Myth: project manager, analysis and co-author.
Silvia Azmitia has held branding and management positions at Red Bull and Grey Interactive
in South America. She joined Square Holes with extensive
experience in strategic use of research and consumer insight,
project management, guerrilla marketing, niche marketing and
online marketing. Silvia holds a Bachelor of Advertising and Public
Relations, and a Masters in Communications.
Contribution to Generation Myth: account manager and editor.
Jason Dunstone is the Founder and Managing Director of Square Holes. He started his
career in market research at TNS Melbourne in the early 1990s
and has since built an impressive list of corporate and government
clients. His corporate client base has included Telstra, Ford,
Coopers Brewery, SANFL and Hamilton Laboratories. Jason
founded Square Holes in late 2004, bored with traditional research
and with a hunger for change. Square Holes has grown to a
strong research team with a passion for supporting great
branding, advertising and digital. Jason holds qualifications in
Economics and Commerce.
Contribution to Generation Myth: project director and strategic input.
Square Holes is a progressive market research agency with a passion for supporting great
branding, advertising and digital. Based on a solid and reliable evidence base and marketing
intelligence [through surveys, focus groups and other approaches] we provide:
‘Illumination’ to inspire and guide
‘Testing’ for confidence and direction
‘Monitoring’ of impact and opportunities
For more information visit our website http://www.squareholes.com
This report is provided for information purposes only. Except to the extent permitted by law, no part of this report may be reproduced, published, adapted, distributed, stored in a retrieval system, transmitted or communicated for any commercial purpose [including education or training] without the prior written approval of Square Holes Pty Ltd. Any reference to the research findings contained in this report should state 'Source: report on Generation Myth Study [2009] by Squares Holes Pty Ltd and Australian Institute of Management SA' [Report].
Overview ............................................................................................. 1
Conclusions ......................................................................................... 3
Focus Group Findings .......................................................................... 9
Perceived ideal team ......................................................................... 11
Strengths of workplace ...................................................................... 12
Weaknesses of workplace .................................................................. 13
Workplace challenges ........................................................................ 14
Working together .............................................................................. 15
Survey Findings ................................................................................ 16
Workplace Segmentations ..................................................................... 17
Segment 1: Dynamo [18%] ............................................................... 18
Segment 2: Gimme [21%] ................................................................ 19
Segment 3: Plodders [21%] .............................................................. 20
Segment 4: Made it [40%] ................................................................ 21
Job Satisfaction .................................................................................... 22
Overall Job Satisfaction ..................................................................... 22
Likelihood of working for same employer ............................................ 23
Job security ...................................................................................... 24
Likelihood of finding another similar job ............................................. 25
Immediate Team .................................................................................. 26
Profile of direct manager ................................................................... 26
Work well with direct manager .......................................................... 27
Profile of team .................................................................................. 28
Work well with team ......................................................................... 29
Person you work ‘best with’ ............................................................... 30
Profile of person you work ‘best with’ ................................................. 31
Person you do not work so well with .................................................. 32
Profile of person you do not work so well with .................................... 33
Age of team ..................................................................................... 34
Important Workplace Aspects ................................................................ 35
Employer offerings ................................................................................ 36
Training and Development .................................................................... 38
Responsibility and Challenge ................................................................. 40
Employer Image ................................................................................... 42
Work-Life Balance ................................................................................. 44
Management ........................................................................................ 46
Work Environment ................................................................................ 48
Uniqueness .......................................................................................... 50
Working in South Australia .................................................................... 51
Working outside South Australia ........................................................ 52
Employee Profile ............................................................................... 53
Business Profile ................................................................................ 57
Appendices ....................................................................................... 59
Methodology ........................................................................................ 71
Questionnaire ....................................................................................... 74
1
Copyright 2009 Australia. Square Holes Pty Ltd and Australian Institute of Management SA
Overview
In the second half of 2007, Square Holes worked with the Australian
Institute of Management of South Australia and SA Great to conduct
research into the attitudes and needs of younger workers [aged under
40]. The workplace retention research project commenced with a series
of targeted focus groups, to allow some initial brainstorming of the topic
amongst young people employed in professional services, science and
technology and trades. The second stage of the project was an internet
survey of 800 South Australian employees aged under 40. This included
181 expatriate South Australians currently working interstate or overseas.
The survey was open to all levels of an organisation, ranging from
administration to upper management. It attracted open and honest
feedback from a wide selection of young people.
AIM SA, SA Great and Square Holes were thrilled with the response the
survey generated, and are appreciative of the enthusiastic support. Those
involved in the research were invited to attend a cocktail function on the
15th of October 2007 to hear the preliminary findings first hand and to
offer additional feedback. The results of the survey were presented at a
business luncheon on the 31st of October 2007 at the Hyatt Regency
Ballroom in Adelaide.
Building on the success of the 2007 study, AIM SA and Square Holes
explored broader issues in relation to the needs of differing groups of
workers. The particular relevance of this study is the ageing workforce.
This report presents the findings of this second project.
Other issues include …
1. Issues surrounding older workers and their impact on the workforce
2. Considering the issues from the perspectives of both the employer
[organisation] and employee [individuals]
3. Investigating some of the impediments [both perceived and real] to the
employment of older workers
4. Investigating the attitudes of individuals with regard to older workers in the
workforce
2
Copyright 2009 Australia. Square Holes Pty Ltd and Australian Institute of Management SA
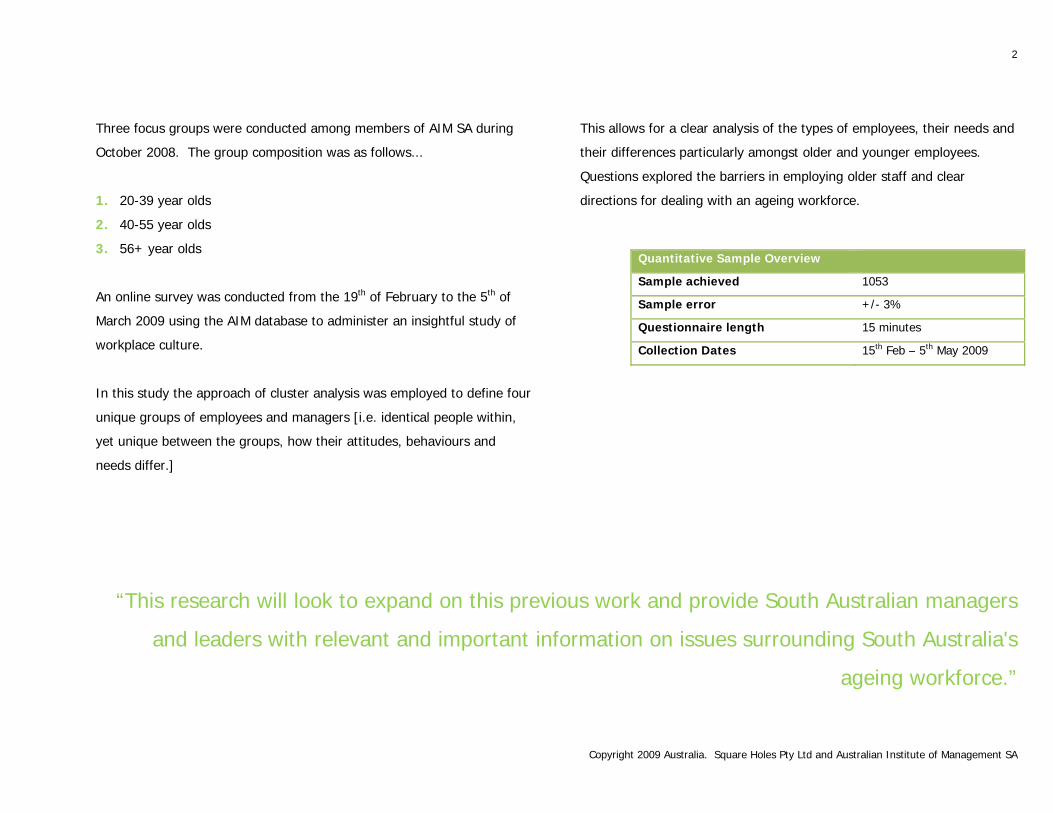
Three focus groups were conducted among members of AIM SA during
October 2008. The group composition was as follows...
1. 20-39 year olds
2. 40-55 year olds
3. 56+ year olds
An online survey was conducted from the 19th of February to the 5th of
March 2009 using the AIM database to administer an insightful study of
workplace culture.
In this study the approach of cluster analysis was employed to define four
unique groups of employees and managers [i.e. identical people within,
yet unique between the groups, how their attitudes, behaviours and
needs differ.]
This allows for a clear analysis of the types of employees, their needs and
their differences particularly amongst older and younger employees.
Questions explored the barriers in employing older staff and clear
directions for dealing with an ageing workforce.
“This research will look to expand on this previous work and provide South Australian managers
and leaders with relevant and important information on issues surrounding South Australia's
ageing workforce.”
Quantitative Sample Overview
Sample achieved 1053
Sample error +/- 3%
Questionnaire length 15 minutes
Collection Dates 15th Feb – 5th May 2009
3
Copyright 2009 Australia. Square Holes Pty Ltd and Australian Institute of Management SA
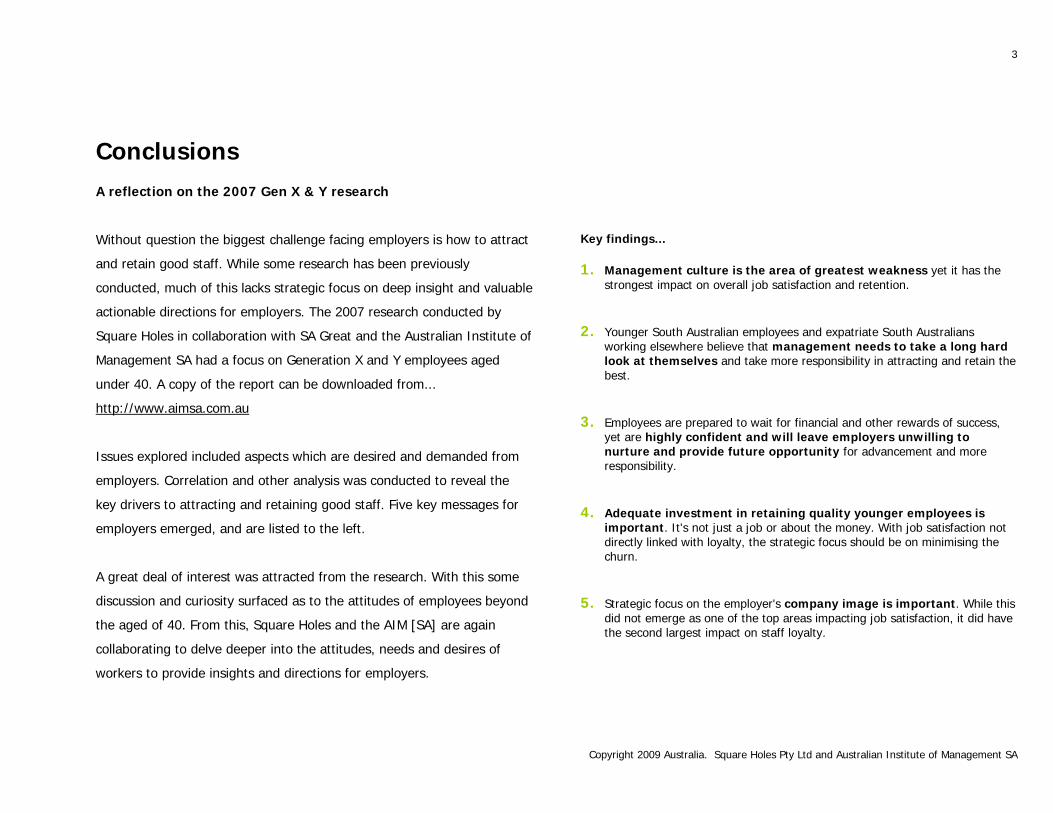
Conclusions A reflection on the 2007 Gen X & Y research
Without question the biggest challenge facing employers is how to attract
and retain good staff. While some research has been previously
conducted, much of this lacks strategic focus on deep insight and valuable
actionable directions for employers. The 2007 research conducted by
Square Holes in collaboration with SA Great and the Australian Institute of
Management SA had a focus on Generation X and Y employees aged
under 40. A copy of the report can be downloaded from...
http://www.aimsa.com.au
Issues explored included aspects which are desired and demanded from
employers. Correlation and other analysis was conducted to reveal the
key drivers to attracting and retaining good staff. Five key messages for
employers emerged, and are listed to the left.
A great deal of interest was attracted from the research. With this some
discussion and curiosity surfaced as to the attitudes of employees beyond
the aged of 40. From this, Square Holes and the AIM [SA] are again
collaborating to delve deeper into the attitudes, needs and desires of
workers to provide insights and directions for employers.
Key findings... 1. Management culture is the area of greatest weakness yet it has the
strongest impact on overall job satisfaction and retention.
2. Younger South Australian employees and expatriate South Australians working elsewhere believe that management needs to take a long hard look at themselves and take more responsibility in attracting and retain the best.
3. Employees are prepared to wait for financial and other rewards of success, yet are highly confident and will leave employers unwilling to nurture and provide future opportunity for advancement and more responsibility.
4. Adequate investment in retaining quality younger employees is important. It's not just a job or about the money. With job satisfaction not directly linked with loyalty, the strategic focus should be on minimising the churn.
5. Strategic focus on the employer's company image is important. While this did not emerge as one of the top areas impacting job satisfaction, it did have the second largest impact on staff loyalty.
4
Copyright 2009 Australia. Square Holes Pty Ltd and Australian Institute of Management SA
So, now for the 2009 research
The approach adopted in 2009 was identical to that of the 2007 study. A
series of focus groups [3] were conducted in October 2008 followed with,
the core of the study, an online survey of 1,053 South Australian workers
in February 2009.
Three focus groups were moderated by Jason Dunstone comprising of 20-
39 year olds; 40-55 year olds; and 56+ year olds.
It was interesting to note some clear differences between the groups. Of
particular note was the view that a successful workplace was more about
psychographics than demographics. The older two groups strongly
emphasised this point. They typically disputed the idea that differing age
groups may have issues working together.
From this key insight, emerged the challenge of how employers can build
a positive culture and attract and retain people with complimentary
psychographics.
As outlined in the body of the full report, Square Holes has explored
details of the attitudes of workers and how employers can develop an
attractive workplace. An analysis of how differing age groups compare,
including the needs of older 60+ year old employees is featured within
the report.
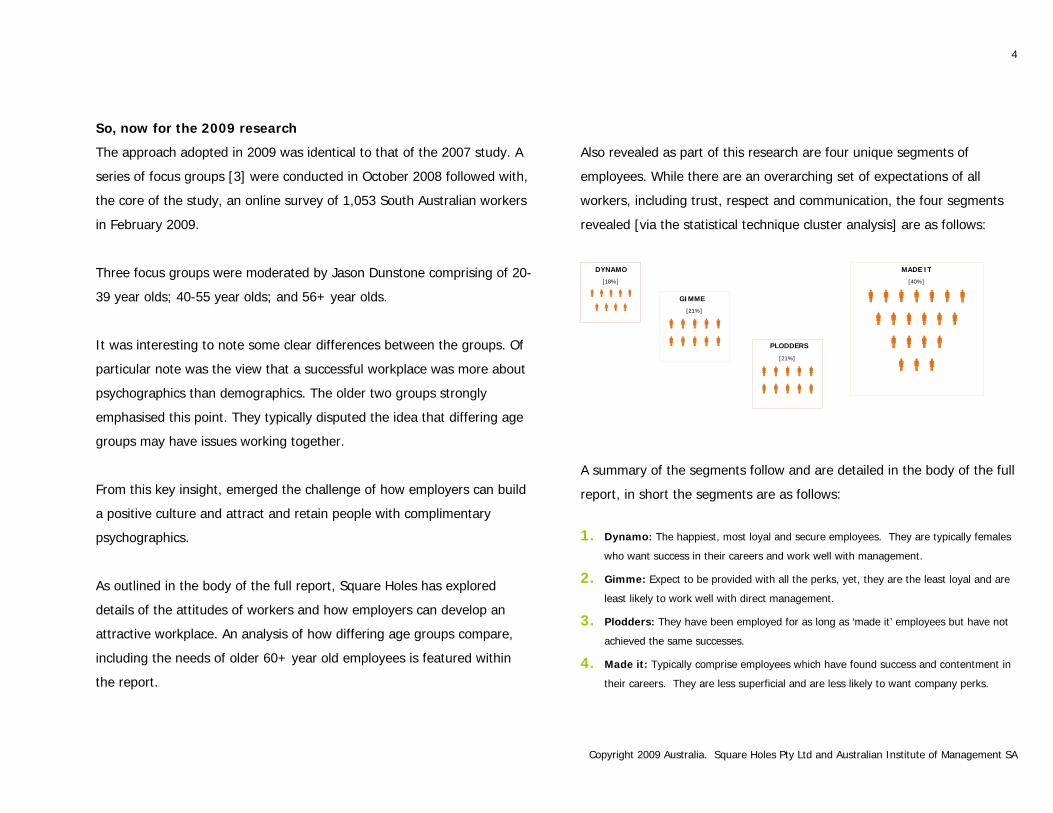
Also revealed as part of this research are four unique segments of
employees. While there are an overarching set of expectations of all
workers, including trust, respect and communication, the four segments
revealed [via the statistical technique cluster analysis] are as follows:
DYNAMO
[18%]
GIMME
[21%]
MADE IT
[40%]
PLODDERS
[21%]
A summary of the segments follow and are detailed in the body of the full
report, in short the segments are as follows:
1. Dynamo: The happiest, most loyal and secure employees. They are typically females
who want success in their careers and work well with management.
2. Gimme: Expect to be provided with all the perks, yet, they are the least loyal and are
least likely to work well with direct management.
3. Plodders: They have been employed for as long as ‘made it’ employees but have not
achieved the same successes.
4. Made it: Typically comprise employees which have found success and contentment in
their careers. They are less superficial and are less likely to want company perks.
5
Copyright 2009 Australia. Square Holes Pty Ltd and Australian Institute of Management SA
What makes a good work place?
It is interesting to reflect on the key factors of importance for workers.
Strong management was a unanimous demand of all employees
irrespective of age. This is consistent with the 2007 research.
Of the 95 factors tested, the top 5 across age and segments which are
important in attracting and retaining employees include:
1. Trust and respect in your abilities
2. Respectful management
3. Trustworthy management
4. Strong communications skills
5. Management has reasonable standards for output and workload
On the opposite end of the scale, the least important across age and
segments were as follows:
91. No fixed office / mobile office
92. Gift vouchers
93. Gym membership
94. Working outside
95. Equity or shares in the business [now, not in the future]
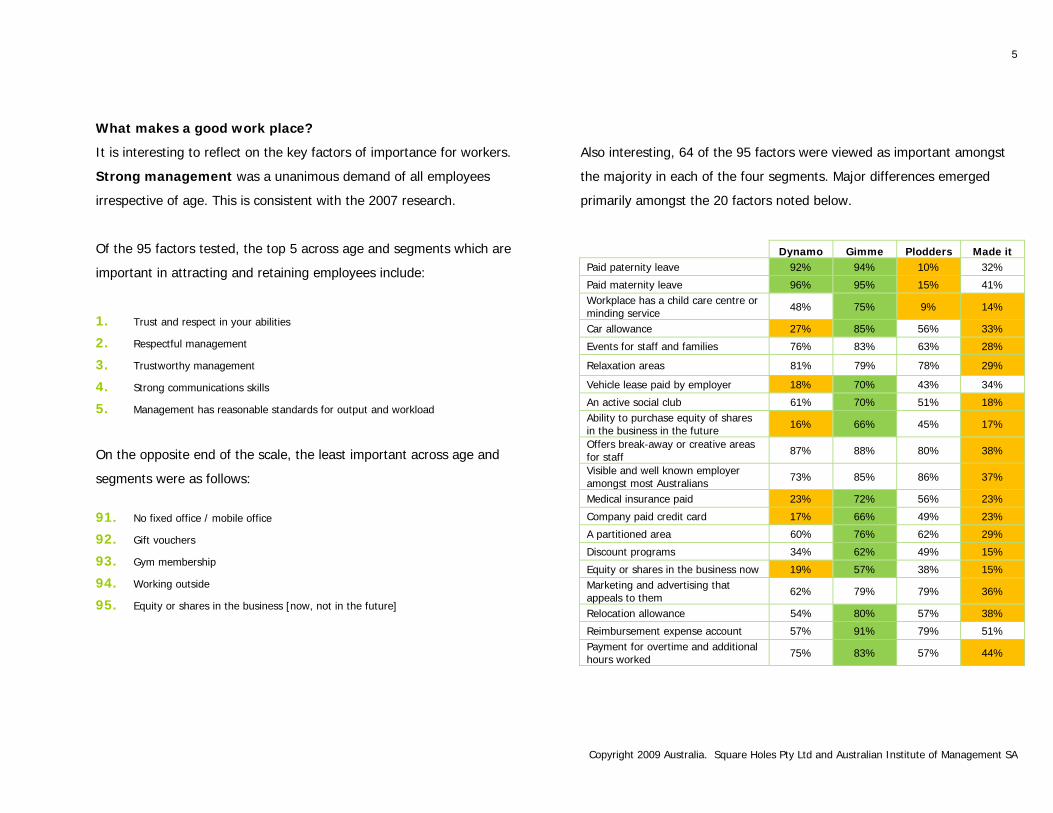
Also interesting, 64 of the 95 factors were viewed as important amongst
the majority in each of the four segments. Major differences emerged
primarily amongst the 20 factors noted below.
Dynamo Gimme Plodders Made it Paid paternity leave 92% 94% 10% 32%
Paid maternity leave 96% 95% 15% 41% Workplace has a child care centre or minding service 48% 75% 9% 14%
Car allowance 27% 85% 56% 33%
Events for staff and families 76% 83% 63% 28%
Relaxation areas 81% 79% 78% 29%
Vehicle lease paid by employer 18% 70% 43% 34%
An active social club 61% 70% 51% 18% Ability to purchase equity of shares in the business in the future 16% 66% 45% 17%
Offers break-away or creative areas for staff 87% 88% 80% 38%
Visible and well known employer amongst most Australians 73% 85% 86% 37%
Medical insurance paid 23% 72% 56% 23%
Company paid credit card 17% 66% 49% 23%
A partitioned area 60% 76% 62% 29%
Discount programs 34% 62% 49% 15%
Equity or shares in the business now 19% 57% 38% 15% Marketing and advertising that appeals to them 62% 79% 79% 36%
Relocation allowance 54% 80% 57% 38%
Reimbursement expense account 57% 91% 79% 51% Payment for overtime and additional hours worked 75% 83% 57% 44%
6
Copyright 2009 Australia. Square Holes Pty Ltd and Australian Institute of Management SA
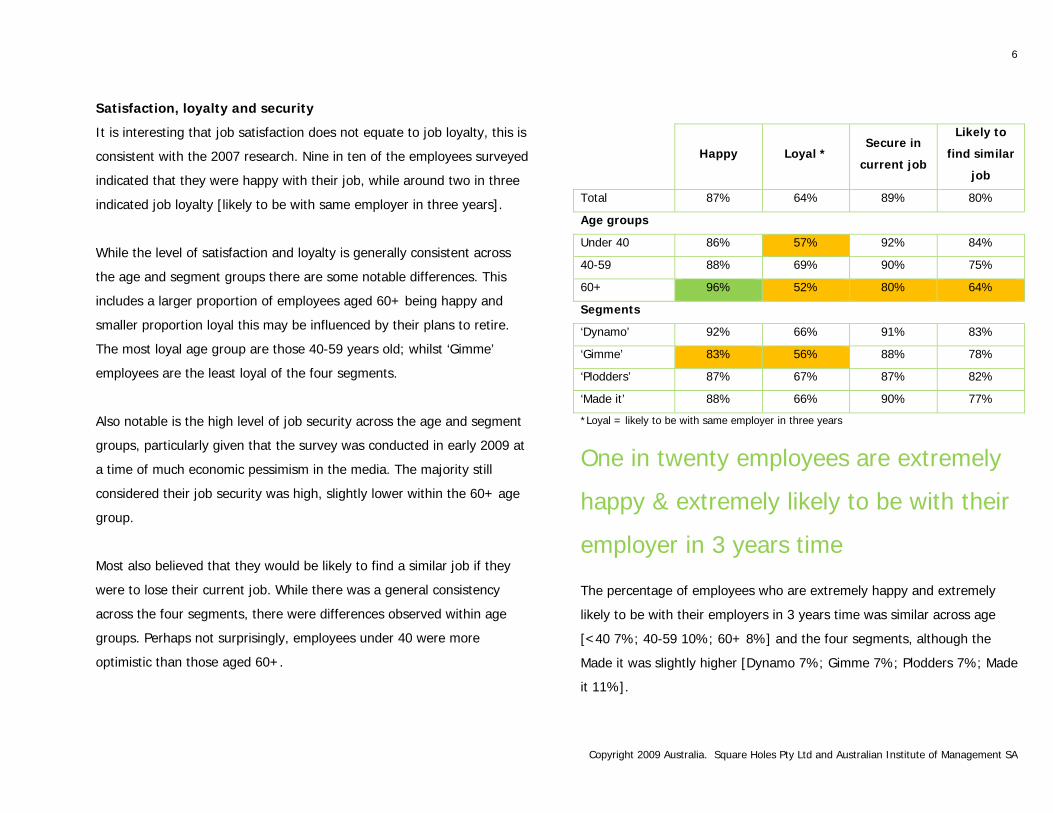
Satisfaction, loyalty and security
It is interesting that job satisfaction does not equate to job loyalty, this is
consistent with the 2007 research. Nine in ten of the employees surveyed
indicated that they were happy with their job, while around two in three
indicated job loyalty [likely to be with same employer in three years].
While the level of satisfaction and loyalty is generally consistent across
the age and segment groups there are some notable differences. This
includes a larger proportion of employees aged 60+ being happy and
smaller proportion loyal this may be influenced by their plans to retire.
The most loyal age group are those 40-59 years old; whilst ‘Gimme’
employees are the least loyal of the four segments.
Also notable is the high level of job security across the age and segment
groups, particularly given that the survey was conducted in early 2009 at
a time of much economic pessimism in the media. The majority still
considered their job security was high, slightly lower within the 60+ age
group.
Most also believed that they would be likely to find a similar job if they
were to lose their current job. While there was a general consistency
across the four segments, there were differences observed within age
groups. Perhaps not surprisingly, employees under 40 were more
optimistic than those aged 60+.
Happy Loyal * Secure in
current job
Likely to
find similar
job
Total 87% 64% 89% 80%
Age groups
Under 40 86% 57% 92% 84%
40-59 88% 69% 90% 75%
60+ 96% 52% 80% 64%
Segments
‘Dynamo’ 92% 66% 91% 83%
‘Gimme’ 83% 56% 88% 78%
‘Plodders’ 87% 67% 87% 82%
‘Made it’ 88% 66% 90% 77%
*Loyal = likely to be with same employer in three years
One in twenty employees are extremely
happy & extremely likely to be with their
employer in 3 years time
The percentage of employees who are extremely happy and extremely
likely to be with their employers in 3 years time was similar across age
[<40 7%; 40-59 10%; 60+ 8%] and the four segments, although the
Made it was slightly higher [Dynamo 7%; Gimme 7%; Plodders 7%; Made
it 11%].
7
Copyright 2009 Australia. Square Holes Pty Ltd and Australian Institute of Management SA
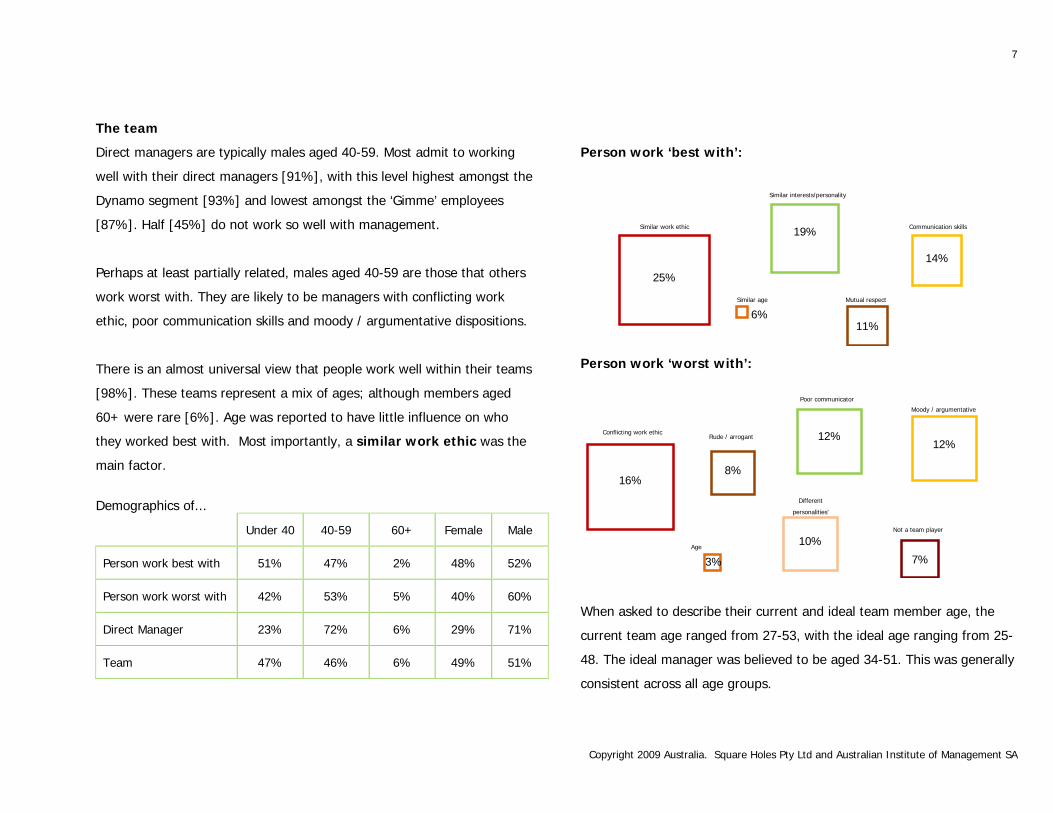
The team
Direct managers are typically males aged 40-59. Most admit to working
well with their direct managers [91%], with this level highest amongst the
Dynamo segment [93%] and lowest amongst the ‘Gimme’ employees
[87%]. Half [45%] do not work so well with management.
Perhaps at least partially related, males aged 40-59 are those that others
work worst with. They are likely to be managers with conflicting work
ethic, poor communication skills and moody / argumentative dispositions.
There is an almost universal view that people work well within their teams
[98%]. These teams represent a mix of ages; although members aged
60+ were rare [6%]. Age was reported to have little influence on who
they worked best with. Most importantly, a similar work ethic was the
main factor.
Demographics of...
Under 40 40-59 60+ Female Male
Person work best with 51% 47% 2% 48% 52%
Person work worst with 42% 53% 5% 40% 60%
Direct Manager 23% 72% 6% 29% 71%
Team 47% 46% 6% 49% 51%
Person work ‘best with’:
25%
19%
14%
11%
Similar work ethic
Similar age
6% Mutual respect
Similar interests/personality
Communication skills
Person work ‘worst with’:
16%
12%
12%
10%
Conflicting work ethic
Age
3%
Different
personalities’
Poor communicator
Moody / argumentative
8%
7%
Not a team player
Rude / arrogant
When asked to describe their current and ideal team member age, the
current team age ranged from 27-53, with the ideal age ranging from 25-
48. The ideal manager was believed to be aged 34-51. This was generally
consistent across all age groups.
8
Copyright 2009 Australia. Square Holes Pty Ltd and Australian Institute of Management SA
What are the key messages for SA employers?
1. Not all employees are the same, yet it’s not about age
The generation gap does not exist in the workplace as far as this research is concerned. Many respondents were even angry at an insinuation of an age difference. There are four unique
segments of employees, yet age and other demographics are of little, if any, relevance. While the four segments revealed are very interesting in terms of unique psychographics and
attitudes, they are compiled of people with diverse demographics. Similar work ethics are at the core of a strong workplace.
2. Management should stop shifting the blame
The 2007 research concluded that “management needs to take a long hard look at themselves” and that “attempting to shift the blame is viewed as unacceptable”. A consistent
response emerged in 2009. While other factors may come in to play, the single biggest reason for staff departures from an employer was poor management. Universally across all
segments, a respectful and trustworthy management were demanded in addition to a reasonable standard of output and workload.
3. Communication with staff is a weakness
Only second to strong management was the need for good staff communication. This was viewed as essential across all employees, yet typically a weakness across the research. Even
the happy and loyal staff often viewed communication with staff as a weakness. At times they were not kept informed of what was occurring and other times considered the lack of
communication linked to disrespect.
4. Job satisfaction does not equal loyalty
Even the happiest staff are not necessarily loyal. There is little difference between age groups and segments of employees with regard to loyalty. While 87% of employees are happy,
64% are likely to be with the same employer in three years. Consistent with the 2007 research amongst Gen X and Y staff, the 2009 research of all employees revealed only around 5-
10% of employees as extremely happy and extremely likely to be with the same employer in three years. In saying this, it does appear that staff aged 40-59 are slightly more loyal. Staff
aged 60+ appear to be the least loyal, although this could at least partly be attributed to a lower level of perceived job security and retirement plans.
5. Older staff are not that different Staff aged 60+ appear to be the least loyal, although this could at least partly be attributed to a lower level of perceived job security. Most have an enthusiastic attitude to work and are
not dissimilar to younger employees. They are often seeking professional development and challenges as are other employees. For many, they now have an invigorated relationship to
work and may be seeking a second, third or subsequent career change. There is generally an eagerness to work within a team of differing ages. They prefer managers aged 38-60.
9
Copyright 2009 Australia. Square Holes Pty Ltd and Australian Institute of Management SA
Focus Group Findings
10
Copyright 2009 Australia. Square Holes Pty Ltd and Australian Institute of Management SA
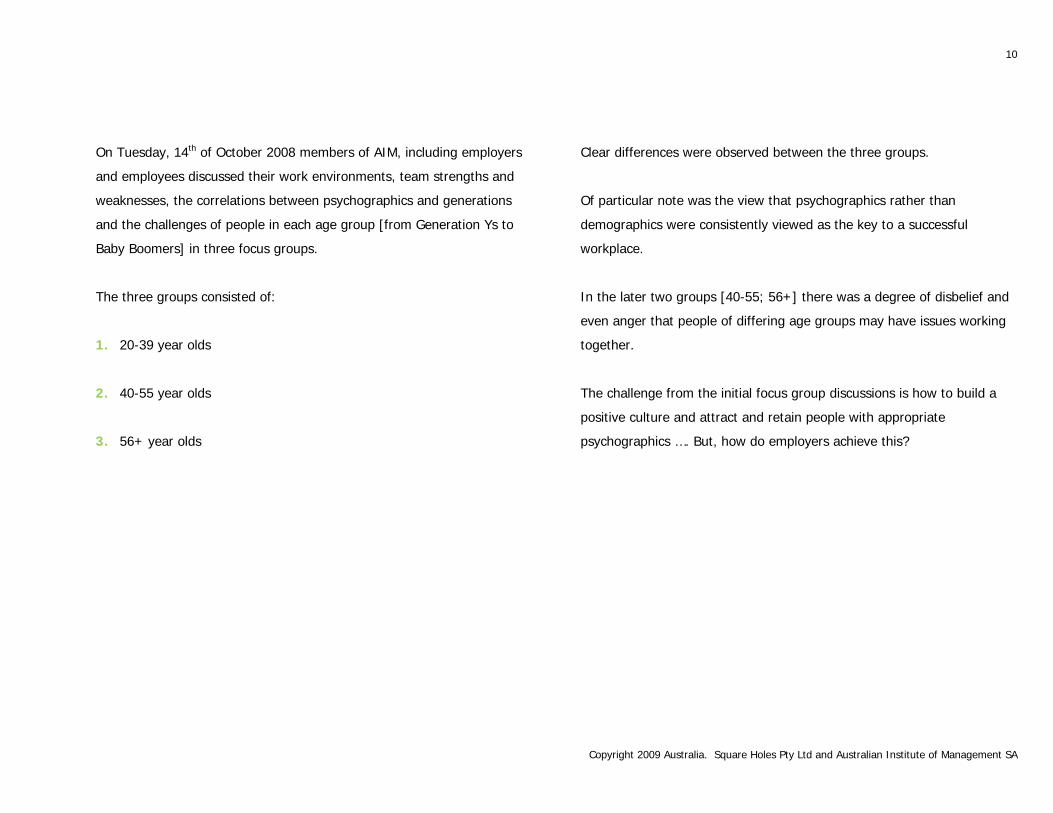
On Tuesday, 14th of October 2008 members of AIM, including employers
and employees discussed their work environments, team strengths and
weaknesses, the correlations between psychographics and generations
and the challenges of people in each age group [from Generation Ys to
Baby Boomers] in three focus groups.
The three groups consisted of:
1. 20-39 year olds
2. 40-55 year olds
3. 56+ year olds
Clear differences were observed between the three groups.
Of particular note was the view that psychographics rather than
demographics were consistently viewed as the key to a successful
workplace.
In the later two groups [40-55; 56+] there was a degree of disbelief and
even anger that people of differing age groups may have issues working
together.
The challenge from the initial focus group discussions is how to build a
positive culture and attract and retain people with appropriate
psychographics …. But, how do employers achieve this?
11
Copyright 2009 Australia. Square Holes Pty Ltd and Australian Institute of Management SA
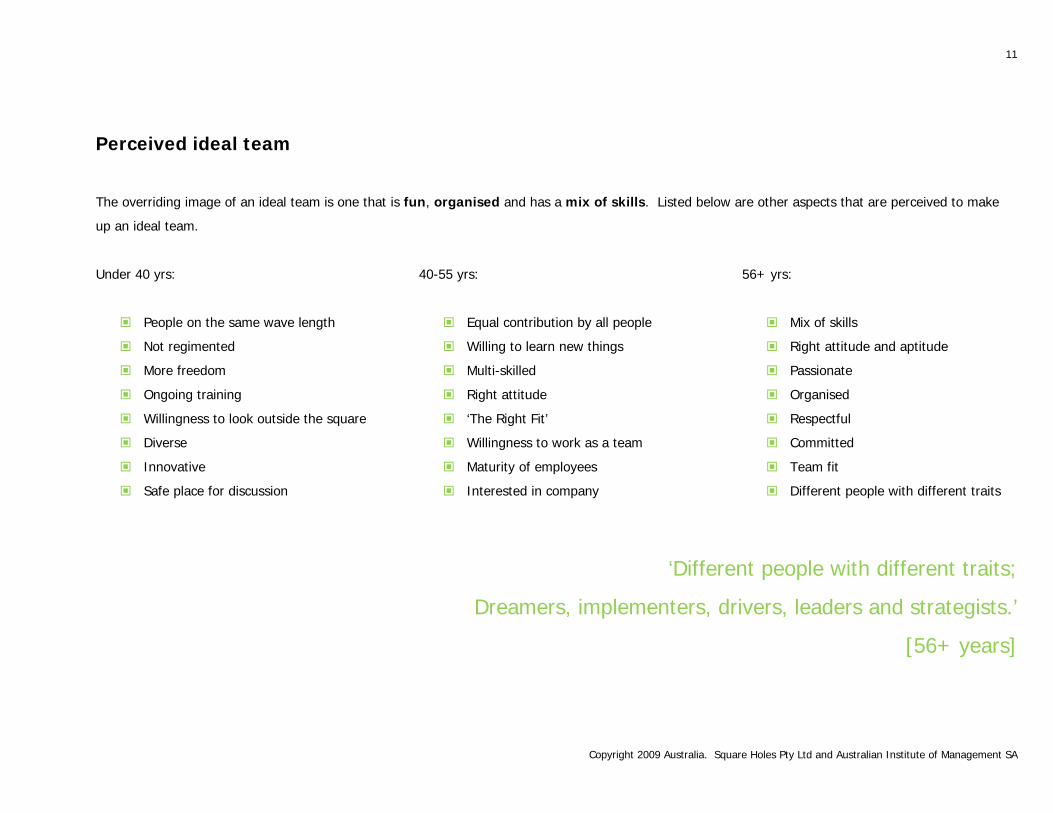
Perceived ideal team
The overriding image of an ideal team is one that is fun, organised and has a mix of skills. Listed below are other aspects that are perceived to make
up an ideal team.
Under 40 yrs:
People on the same wave length
Not regimented
More freedom
Ongoing training
Willingness to look outside the square
Diverse
Innovative
Safe place for discussion
40-55 yrs:
Equal contribution by all people
Willing to learn new things
Multi-skilled
Right attitude
‘The Right Fit’
Willingness to work as a team
Maturity of employees
Interested in company
56+ yrs:
Mix of skills
Right attitude and aptitude
Passionate
Organised
Respectful
Committed
Team fit
Different people with different traits
‘Different people with different traits;
Dreamers, implementers, drivers, leaders and strategists.’
[56+ years]
12
Copyright 2009 Australia. Square Holes Pty Ltd and Australian Institute of Management SA
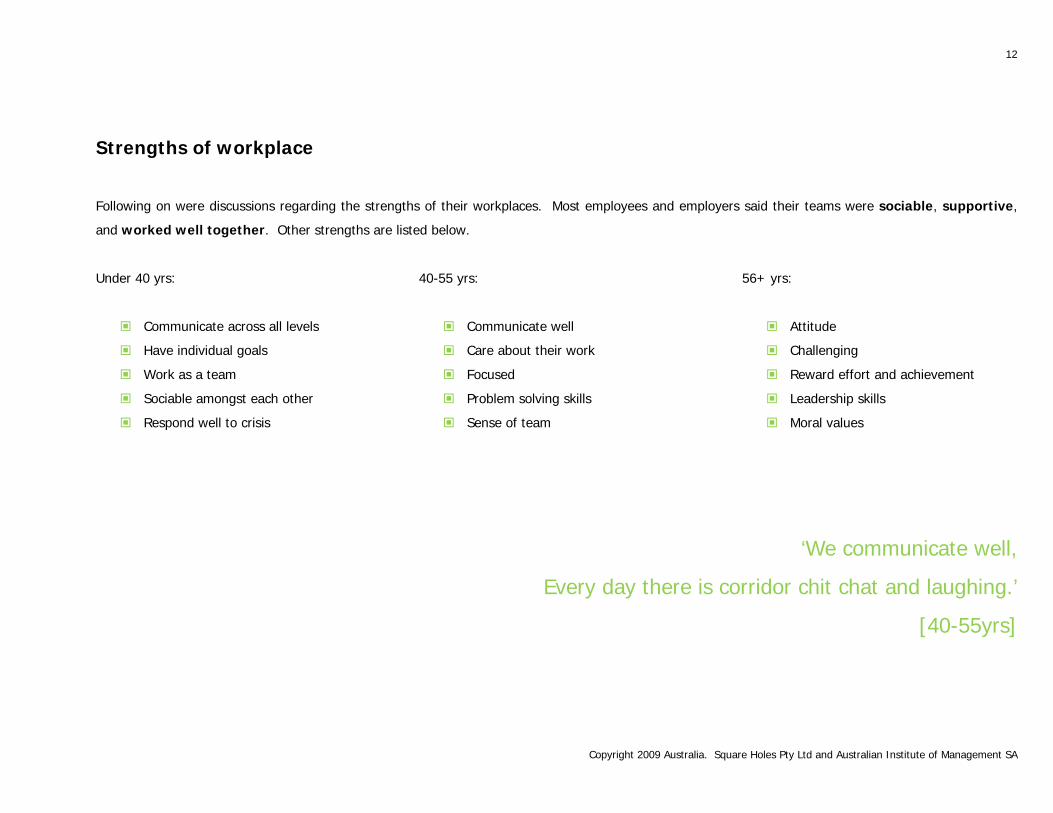
Strengths of workplace
Following on were discussions regarding the strengths of their workplaces. Most employees and employers said their teams were sociable, supportive,
and worked well together. Other strengths are listed below.
Under 40 yrs:
Communicate across all levels
Have individual goals
Work as a team
Sociable amongst each other
Respond well to crisis
40-55 yrs:
Communicate well
Care about their work
Focused
Problem solving skills
Sense of team
56+ yrs:
Attitude
Challenging
Reward effort and achievement
Leadership skills
Moral values
‘We communicate well,
Every day there is corridor chit chat and laughing.’
[40-55yrs]
13
Copyright 2009 Australia. Square Holes Pty Ltd and Australian Institute of Management SA
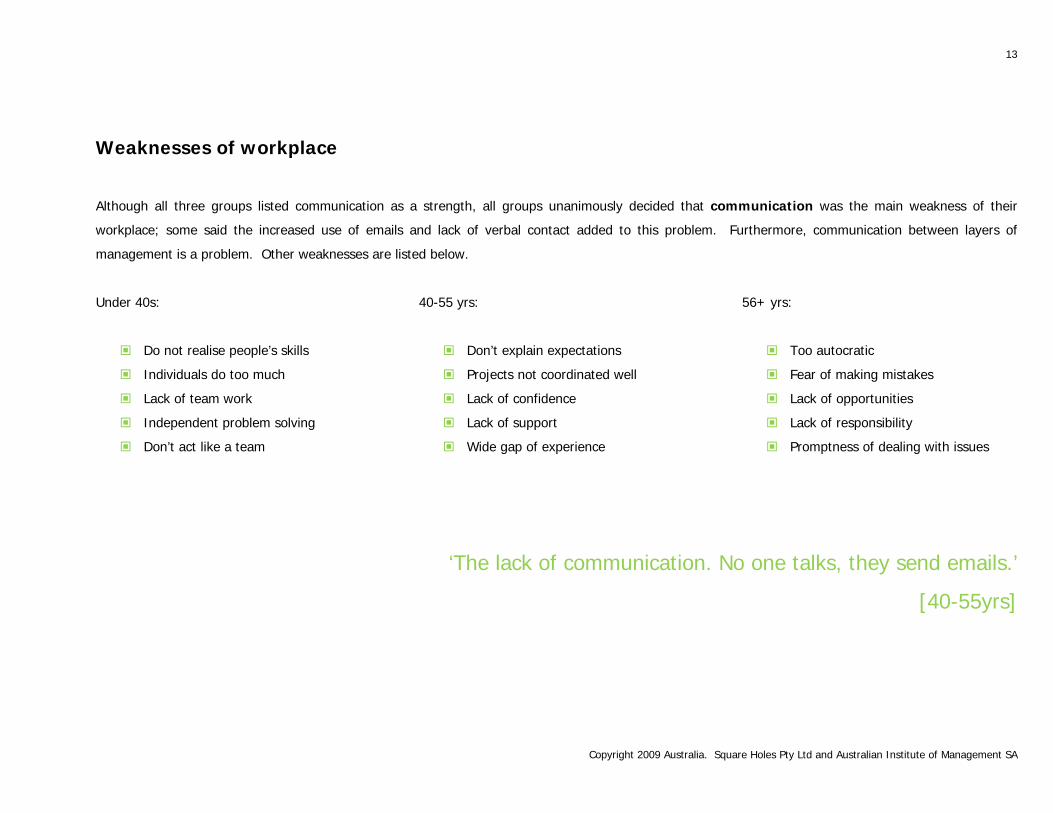
Weaknesses of workplace
Although all three groups listed communication as a strength, all groups unanimously decided that communication was the main weakness of their
workplace; some said the increased use of emails and lack of verbal contact added to this problem. Furthermore, communication between layers of
management is a problem. Other weaknesses are listed below.
Under 40s:
Do not realise people’s skills
Individuals do too much
Lack of team work
Independent problem solving
Don’t act like a team
40-55 yrs:
Don’t explain expectations
Projects not coordinated well
Lack of confidence
Lack of support
Wide gap of experience
56+ yrs:
Too autocratic
Fear of making mistakes
Lack of opportunities
Lack of responsibility
Promptness of dealing with issues
‘The lack of communication. No one talks, they send emails.’
[40-55yrs]
14
Copyright 2009 Australia. Square Holes Pty Ltd and Australian Institute of Management SA
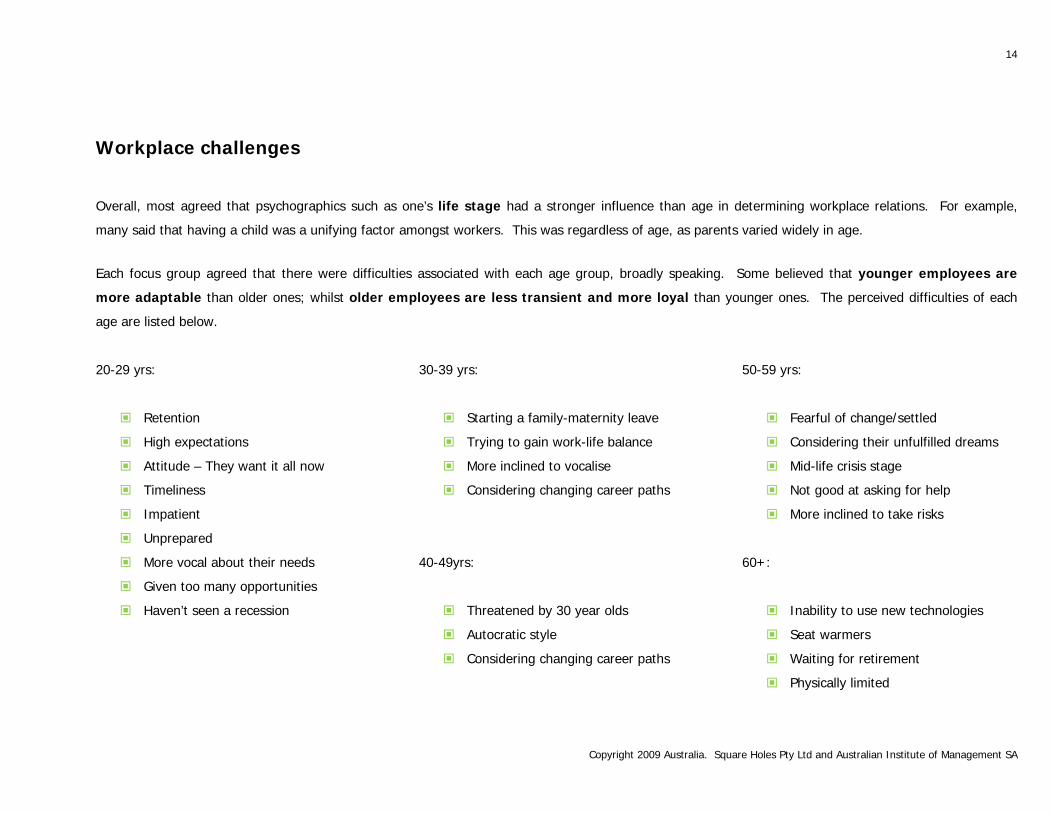
Workplace challenges
Overall, most agreed that psychographics such as one’s life stage had a stronger influence than age in determining workplace relations. For example,
many said that having a child was a unifying factor amongst workers. This was regardless of age, as parents varied widely in age.
Each focus group agreed that there were difficulties associated with each age group, broadly speaking. Some believed that younger employees are
more adaptable than older ones; whilst older employees are less transient and more loyal than younger ones. The perceived difficulties of each
age are listed below.
20-29 yrs:
Retention
High expectations
Attitude – They want it all now
Timeliness
Impatient
Unprepared
More vocal about their needs
Given too many opportunities
Haven’t seen a recession
30-39 yrs:
Starting a family-maternity leave
Trying to gain work-life balance
More inclined to vocalise
Considering changing career paths
40-49yrs:
Threatened by 30 year olds
Autocratic style
Considering changing career paths
50-59 yrs:
Fearful of change/settled
Considering their unfulfilled dreams
Mid-life crisis stage
Not good at asking for help
More inclined to take risks
60+:
Inability to use new technologies
Seat warmers
Waiting for retirement
Physically limited
15
Copyright 2009 Australia. Square Holes Pty Ltd and Australian Institute of Management SA
Working together
Employees and employers were asked whether they believe people of all ages can work together and whether they can manage each other. The overriding
message that came through was that maturity, skills and one’s life stage were better determining factors than age in regards to whether this can be
achieved.
However, going by age, the younger focus group [under 40yrs] believed some teams would struggle to work together when there is an age gap exceeding
20 years. Similarly, a 20 year old would struggle to manage someone in their 50s or 60s.
The middle aged focus group [40-55 yrs] believed that people across all ages can work together. Their only hesitation was 20 year olds working with 60
years old. Furthermore, they believed that people across all age groups can manage each other.
The third focus group [56yr +] agreed with previous groups that people of all ages can work together, manage and be managed by others. However, they
also agreed with the younger focus group [under 40yrs], that a 20 year old would struggle to manage someone in their 50s or 60s, and vice versa.
16
Copyright 2009 Australia. Square Holes Pty Ltd and Australian Institute of Management SA
Survey Findings
17
Copyright 2009 Australia. Square Holes Pty Ltd and Australian Institute of Management SA
Workplace Segmentations
Overview
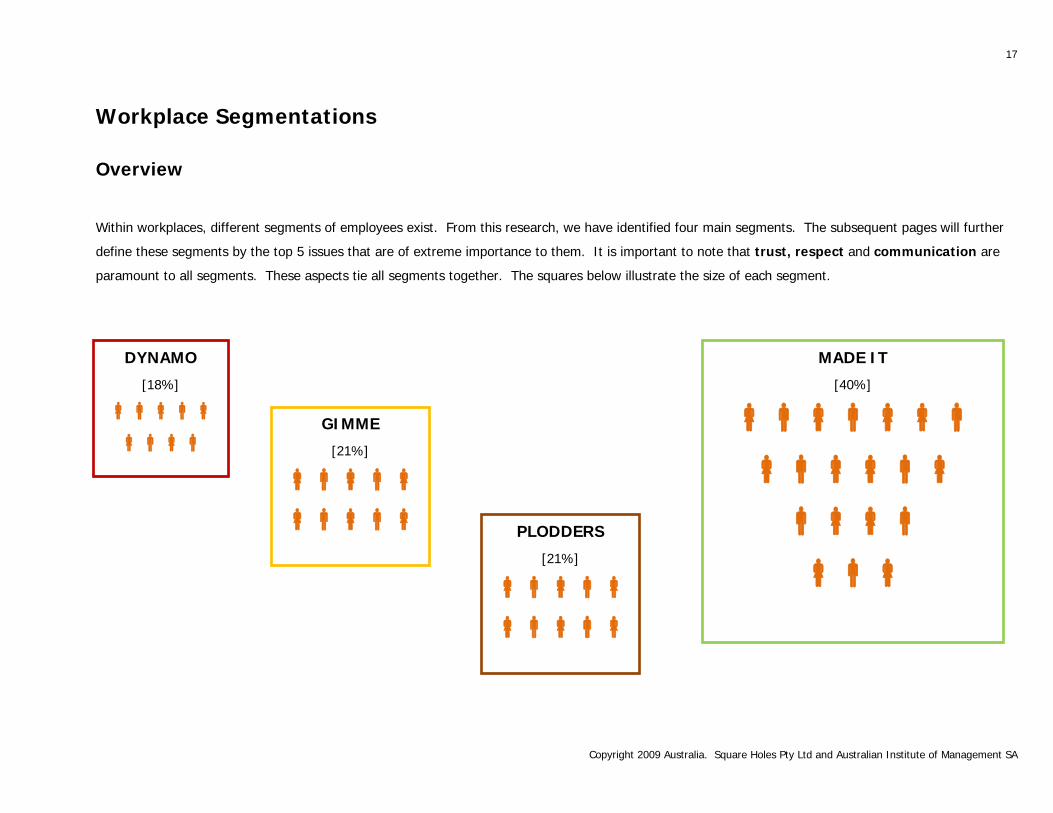
Within workplaces, different segments of employees exist. From this research, we have identified four main segments. The subsequent pages will further
define these segments by the top 5 issues that are of extreme importance to them. It is important to note that trust, respect and communication are
paramount to all segments. These aspects tie all segments together. The squares below illustrate the size of each segment.
DYNAMO
[18%]
GIMME
[21%]
MADE IT
[40%]
PLODDERS
[21%]
18
Copyright 2009 Australia. Square Holes Pty Ltd and Australian Institute of Management SA
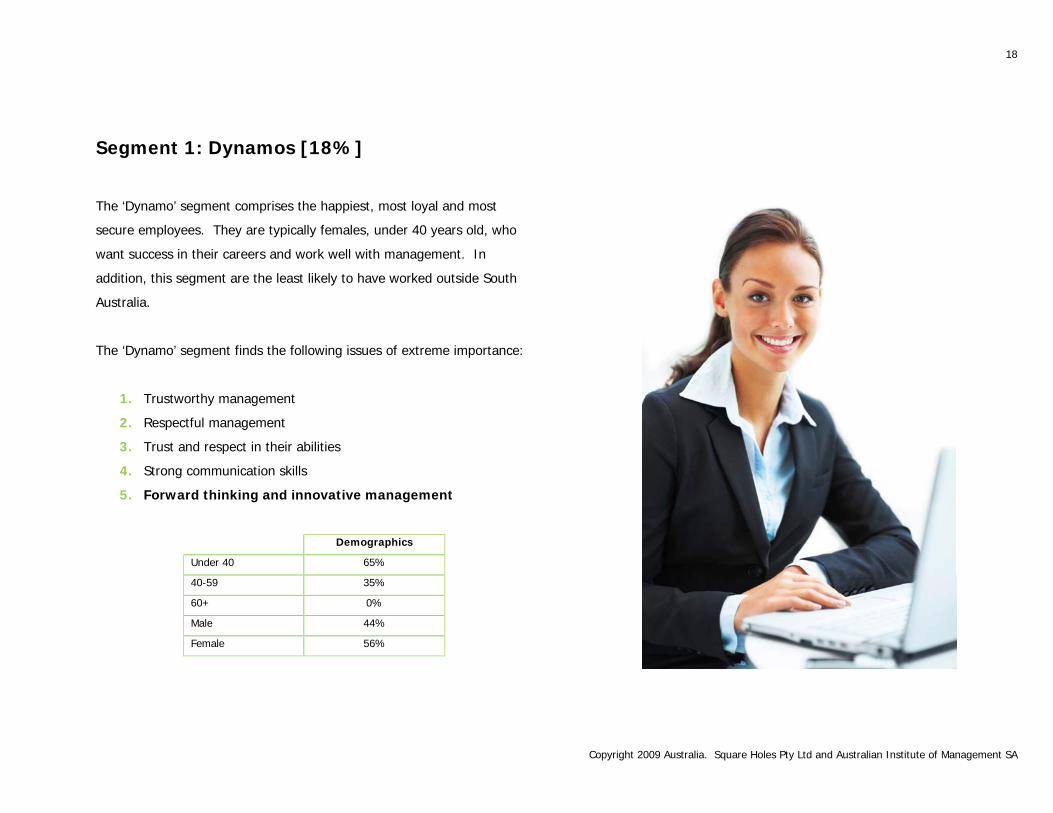
Segment 1: Dynamos [18%]
The ‘Dynamo’ segment comprises the happiest, most loyal and most
secure employees. They are typically females, under 40 years old, who
want success in their careers and work well with management. In
addition, this segment are the least likely to have worked outside South
Australia.
The ‘Dynamo’ segment finds the following issues of extreme importance:
1. Trustworthy management
2. Respectful management
3. Trust and respect in their abilities
4. Strong communication skills
5. Forward thinking and innovative management
Demographics
Under 40 65%
40-59 35%
60+ 0%
Male 44%
Female 56%
19
Copyright 2009 Australia. Square Holes Pty Ltd and Australian Institute of Management SA
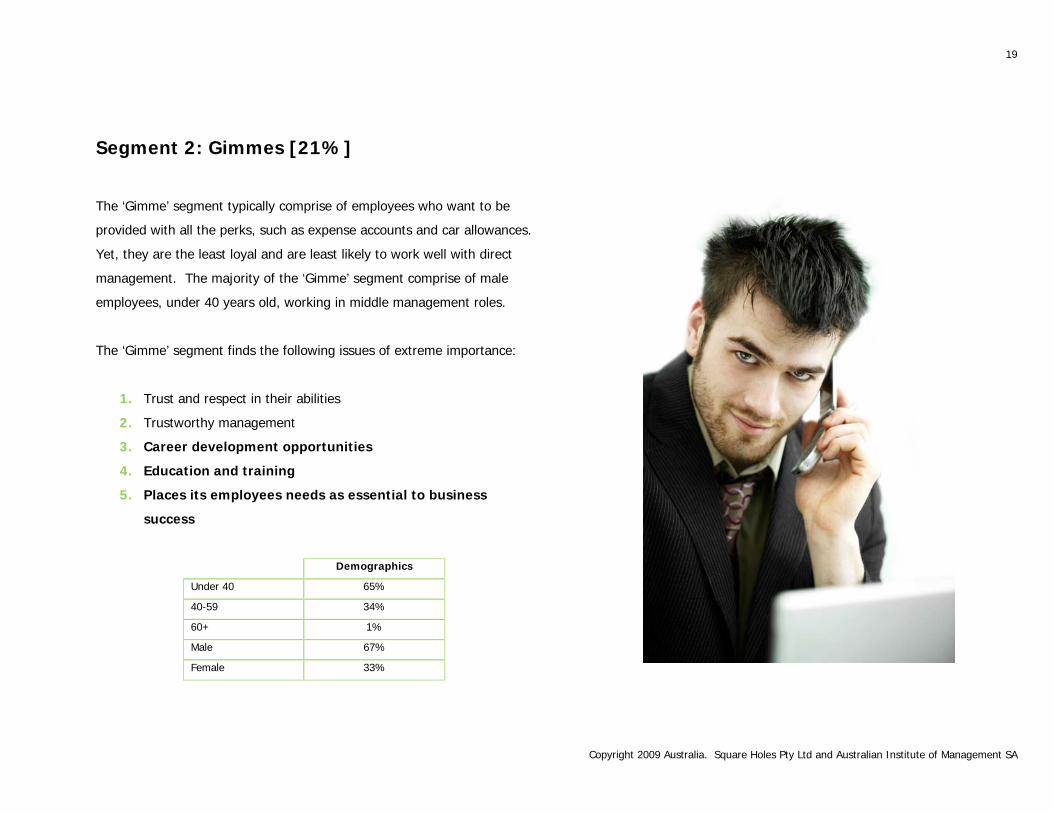
Segment 2: Gimmes [21%]
The ‘Gimme’ segment typically comprise of employees who want to be
provided with all the perks, such as expense accounts and car allowances.
Yet, they are the least loyal and are least likely to work well with direct
management. The majority of the ‘Gimme’ segment comprise of male
employees, under 40 years old, working in middle management roles.
The ‘Gimme’ segment finds the following issues of extreme importance:
1. Trust and respect in their abilities
2. Trustworthy management
3. Career development opportunities
4. Education and training
5. Places its employees needs as essential to business
success
Demographics
Under 40 65%
40-59 34%
60+ 1%
Male 67%
Female 33%
20
Copyright 2009 Australia. Square Holes Pty Ltd and Australian Institute of Management SA
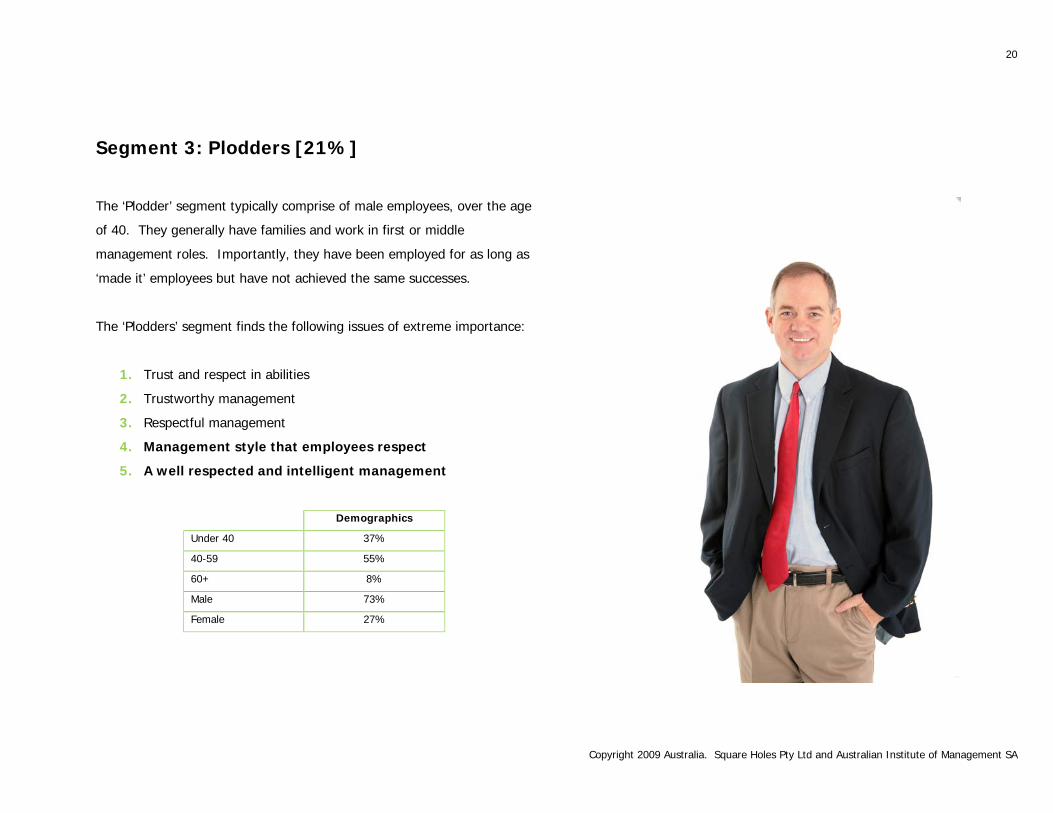
Segment 3: Plodders [21%]
The ‘Plodder’ segment typically comprise of male employees, over the age
of 40. They generally have families and work in first or middle
management roles. Importantly, they have been employed for as long as
‘made it’ employees but have not achieved the same successes.
The ‘Plodders’ segment finds the following issues of extreme importance:
1. Trust and respect in abilities
2. Trustworthy management
3. Respectful management
4. Management style that employees respect
5. A well respected and intelligent management
Demographics
Under 40 37%
40-59 55%
60+ 8%
Male 73%
Female 27%
21
Copyright 2009 Australia. Square Holes Pty Ltd and Australian Institute of Management SA
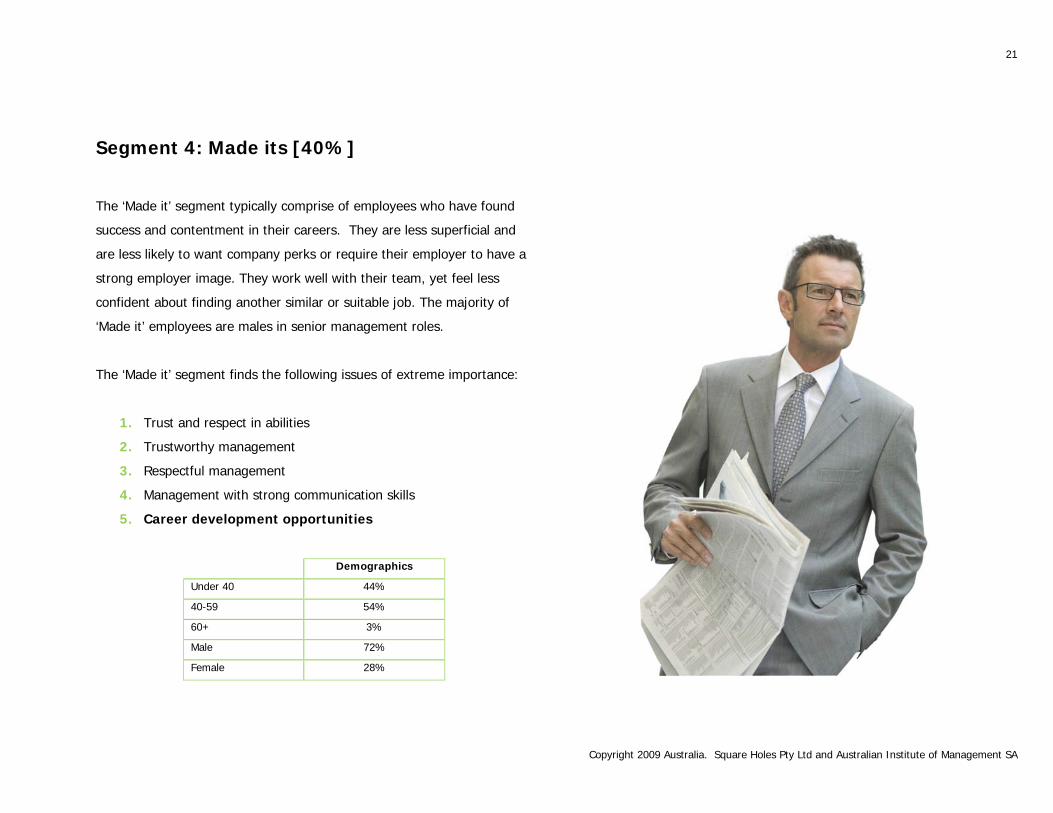
Segment 4: Made its [40%]
The ‘Made it’ segment typically comprise of employees who have found
success and contentment in their careers. They are less superficial and
are less likely to want company perks or require their employer to have a
strong employer image. They work well with their team, yet feel less
confident about finding another similar or suitable job. The majority of
‘Made it’ employees are males in senior management roles.
The ‘Made it’ segment finds the following issues of extreme importance:
1. Trust and respect in abilities
2. Trustworthy management
3. Respectful management
4. Management with strong communication skills
5. Career development opportunities
Demographics
Under 40 44%
40-59 54%
60+ 3%
Male 72%
Female 28%
22
Copyright 2009 Australia. Square Holes Pty Ltd and Australian Institute of Management SA
Job Satisfaction
Overall Job Satisfaction
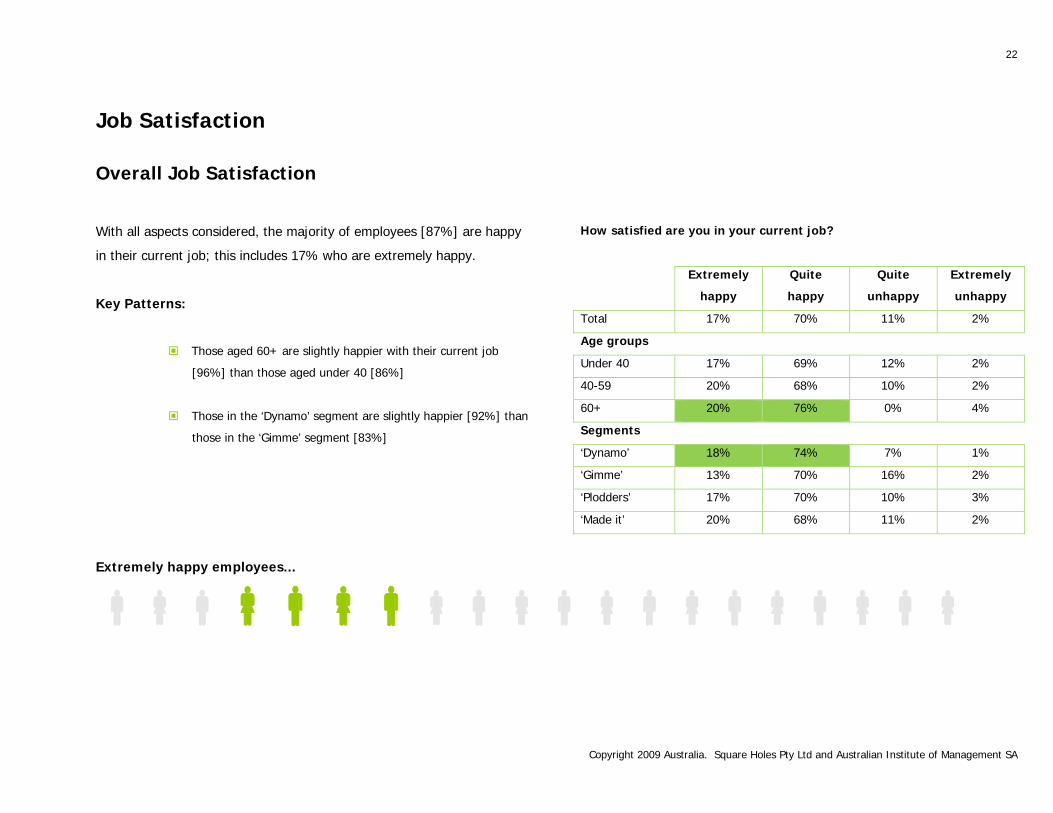
With all aspects considered, the majority of employees [87%] are happy
in their current job; this includes 17% who are extremely happy.
Key Patterns:
Those aged 60+ are slightly happier with their current job
[96%] than those aged under 40 [86%]
Those in the ‘Dynamo’ segment are slightly happier [92%] than
those in the ‘Gimme’ segment [83%]
How satisfied are you in your current job?
Extremely
happy
Quite
happy
Quite
unhappy
Extremely
unhappy
Total 17% 70% 11% 2%
Age groups
Under 40 17% 69% 12% 2%
40-59 20% 68% 10% 2%
60+ 20% 76% 0% 4%
Segments
‘Dynamo’ 18% 74% 7% 1%
‘Gimme’ 13% 70% 16% 2%
‘Plodders’ 17% 70% 10% 3%
‘Made it’ 20% 68% 11% 2%
Extremely happy employees...
23
Copyright 2009 Australia. Square Holes Pty Ltd and Australian Institute of Management SA
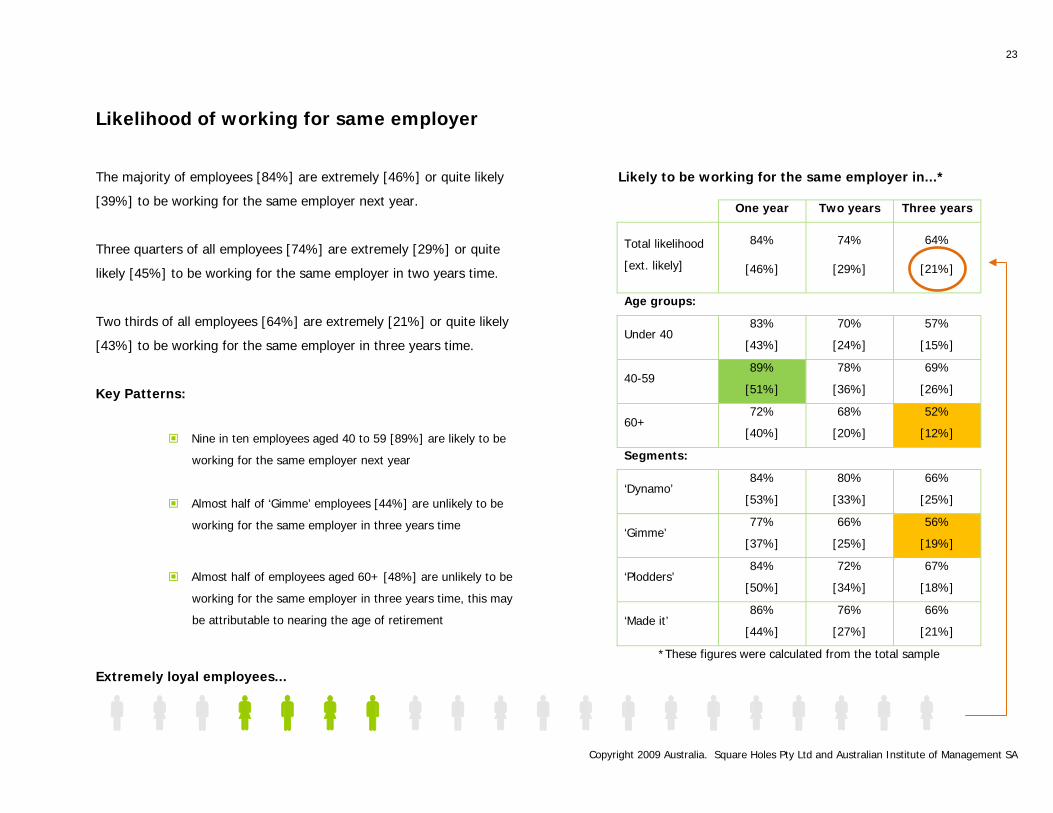
Likelihood of working for same employer
The majority of employees [84%] are extremely [46%] or quite likely
[39%] to be working for the same employer next year.
Three quarters of all employees [74%] are extremely [29%] or quite
likely [45%] to be working for the same employer in two years time.
Two thirds of all employees [64%] are extremely [21%] or quite likely
[43%] to be working for the same employer in three years time.
Key Patterns:
Nine in ten employees aged 40 to 59 [89%] are likely to be
working for the same employer next year
Almost half of ‘Gimme’ employees [44%] are unlikely to be
working for the same employer in three years time
Almost half of employees aged 60+ [48%] are unlikely to be
working for the same employer in three years time, this may
be attributable to nearing the age of retirement
Likely to be working for the same employer in...*
One year Two years Three years
Total likelihood
[ext. likely]
84%
[46%]
74%
[29%]
64%
[21%]
Age groups:
Under 40 83%
[43%]
70%
[24%]
57%
[15%]
40-59 89%
[51%]
78%
[36%]
69%
[26%]
60+ 72%
[40%]
68%
[20%]
52%
[12%]
Segments:
‘Dynamo’ 84%
[53%]
80%
[33%]
66%
[25%]
‘Gimme’ 77%
[37%]
66%
[25%]
56%
[19%]
‘Plodders’ 84%
[50%]
72%
[34%]
67%
[18%]
‘Made it’ 86%
[44%]
76%
[27%]
66%
[21%]
*These figures were calculated from the total sample
Extremely loyal employees...
24
Copyright 2009 Australia. Square Holes Pty Ltd and Australian Institute of Management SA
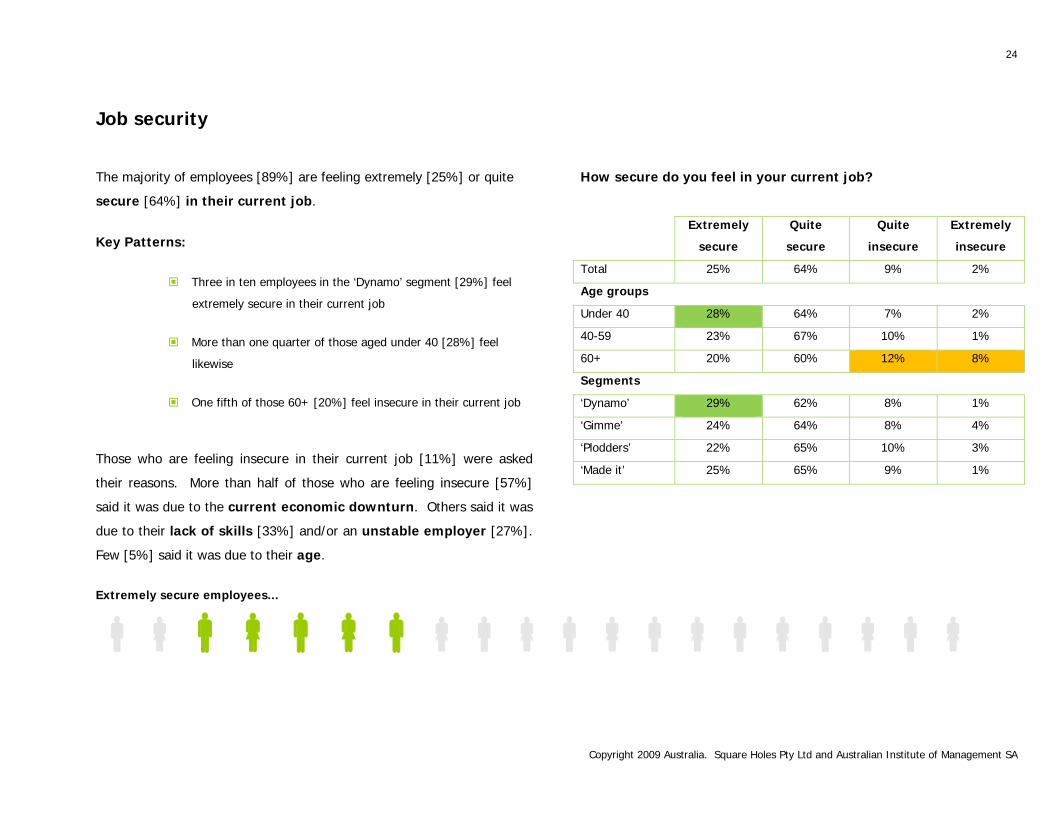
Job security
The majority of employees [89%] are feeling extremely [25%] or quite
secure [64%] in their current job.
Key Patterns:
Three in ten employees in the ‘Dynamo’ segment [29%] feel
extremely secure in their current job
More than one quarter of those aged under 40 [28%] feel
likewise
One fifth of those 60+ [20%] feel insecure in their current job
Those who are feeling insecure in their current job [11%] were asked
their reasons. More than half of those who are feeling insecure [57%]
said it was due to the current economic downturn. Others said it was
due to their lack of skills [33%] and/or an unstable employer [27%].
Few [5%] said it was due to their age.
Extremely secure employees...
How secure do you feel in your current job?
Extremely
secure
Quite
secure
Quite
insecure
Extremely
insecure
Total 25% 64% 9% 2%
Age groups
Under 40 28% 64% 7% 2%
40-59 23% 67% 10% 1%
60+ 20% 60% 12% 8%
Segments
‘Dynamo’ 29% 62% 8% 1%
‘Gimme’ 24% 64% 8% 4%
‘Plodders’ 22% 65% 10% 3%
‘Made it’ 25% 65% 9% 1%
25
Copyright 2009 Australia. Square Holes Pty Ltd and Australian Institute of Management SA
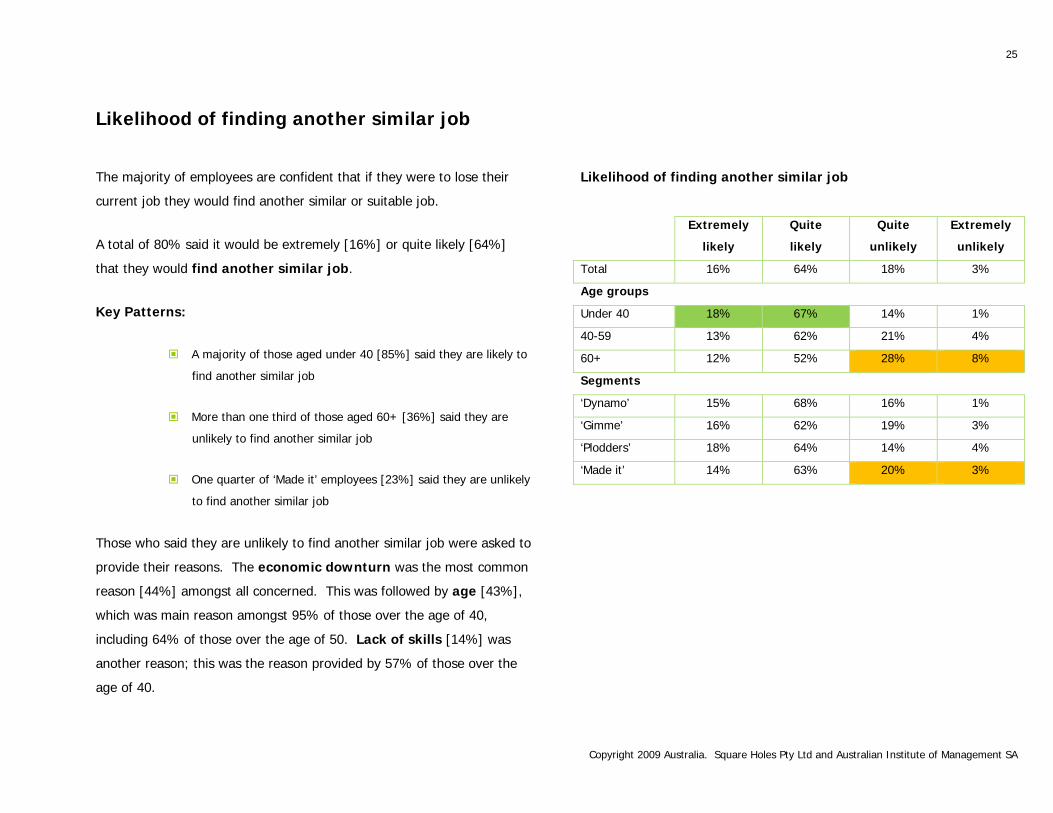
Likelihood of finding another similar job
The majority of employees are confident that if they were to lose their
current job they would find another similar or suitable job.
A total of 80% said it would be extremely [16%] or quite likely [64%]
that they would find another similar job.
Key Patterns:
A majority of those aged under 40 [85%] said they are likely to
find another similar job
More than one third of those aged 60+ [36%] said they are
unlikely to find another similar job
One quarter of ‘Made it’ employees [23%] said they are unlikely
to find another similar job
Those who said they are unlikely to find another similar job were asked to
provide their reasons. The economic downturn was the most common
reason [44%] amongst all concerned. This was followed by age [43%],
which was main reason amongst 95% of those over the age of 40,
including 64% of those over the age of 50. Lack of skills [14%] was
another reason; this was the reason provided by 57% of those over the
age of 40.
Likelihood of finding another similar job
Extremely
likely
Quite
likely
Quite
unlikely
Extremely
unlikely
Total 16% 64% 18% 3%
Age groups
Under 40 18% 67% 14% 1%
40-59 13% 62% 21% 4%
60+ 12% 52% 28% 8%
Segments
‘Dynamo’ 15% 68% 16% 1%
‘Gimme’ 16% 62% 19% 3%
‘Plodders’ 18% 64% 14% 4%
‘Made it’ 14% 63% 20% 3%
26
Copyright 2009 Australia. Square Holes Pty Ltd and Australian Institute of Management SA
Immediate Team
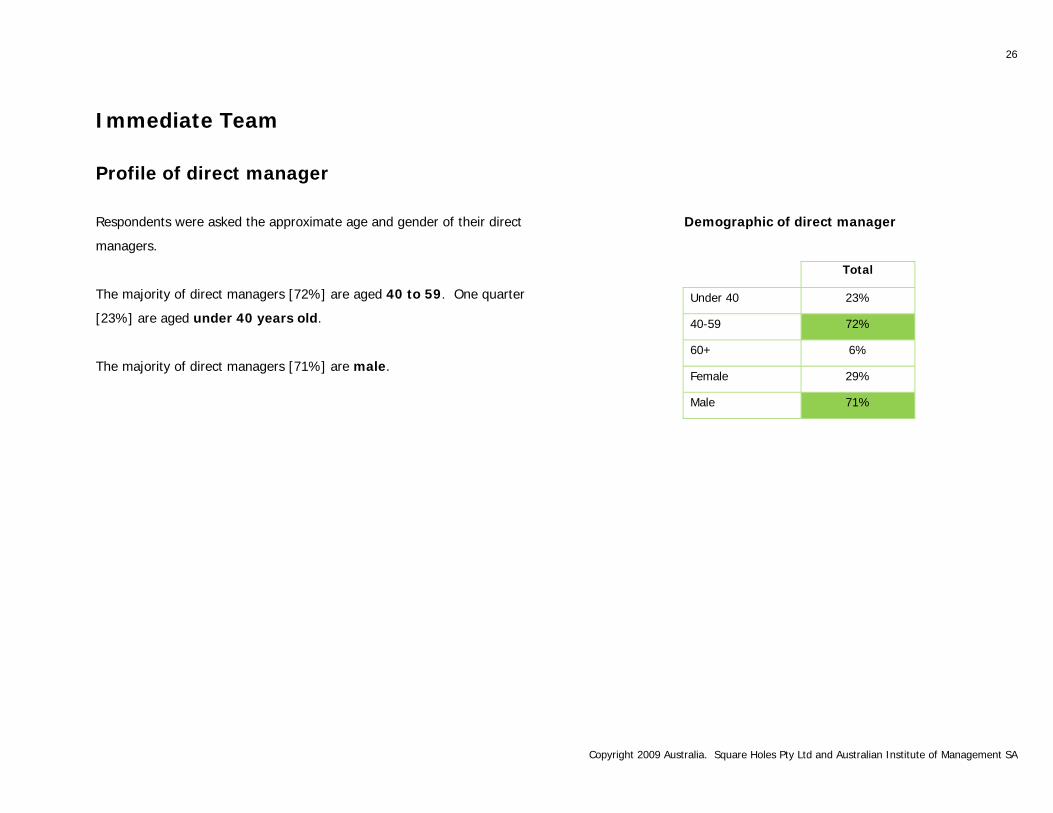
Profile of direct manager
Respondents were asked the approximate age and gender of their direct
managers.
The majority of direct managers [72%] are aged 40 to 59. One quarter
[23%] are aged under 40 years old.
The majority of direct managers [71%] are male.
Demographic of direct manager
Total
Under 40 23%
40-59 72%
60+ 6%
Female 29%
Male 71%
27
Copyright 2009 Australia. Square Holes Pty Ltd and Australian Institute of Management SA
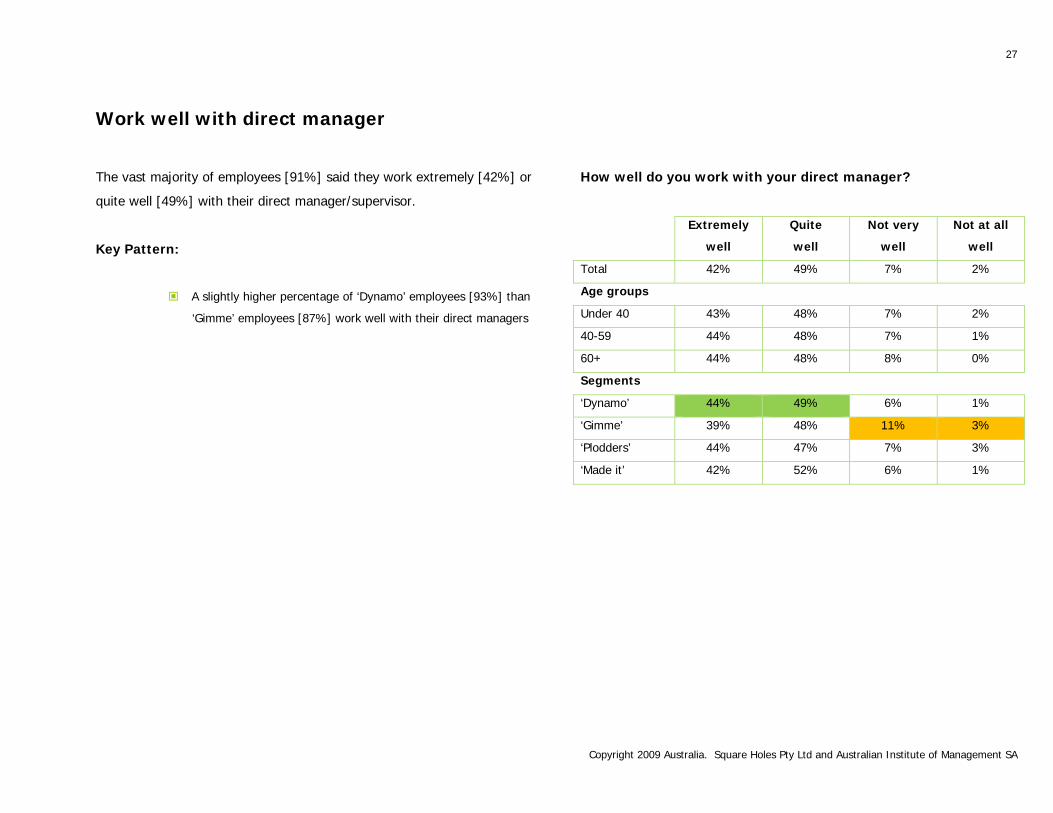
Work well with direct manager
The vast majority of employees [91%] said they work extremely [42%] or
quite well [49%] with their direct manager/supervisor.
Key Pattern:
A slightly higher percentage of ‘Dynamo’ employees [93%] than
‘Gimme’ employees [87%] work well with their direct managers
How well do you work with your direct manager?
Extremely
well
Quite
well
Not very
well
Not at all
well
Total 42% 49% 7% 2%
Age groups
Under 40 43% 48% 7% 2%
40-59 44% 48% 7% 1%
60+ 44% 48% 8% 0%
Segments
‘Dynamo’ 44% 49% 6% 1%
‘Gimme’ 39% 48% 11% 3%
‘Plodders’ 44% 47% 7% 3%
‘Made it’ 42% 52% 6% 1%
28
Copyright 2009 Australia. Square Holes Pty Ltd and Australian Institute of Management SA
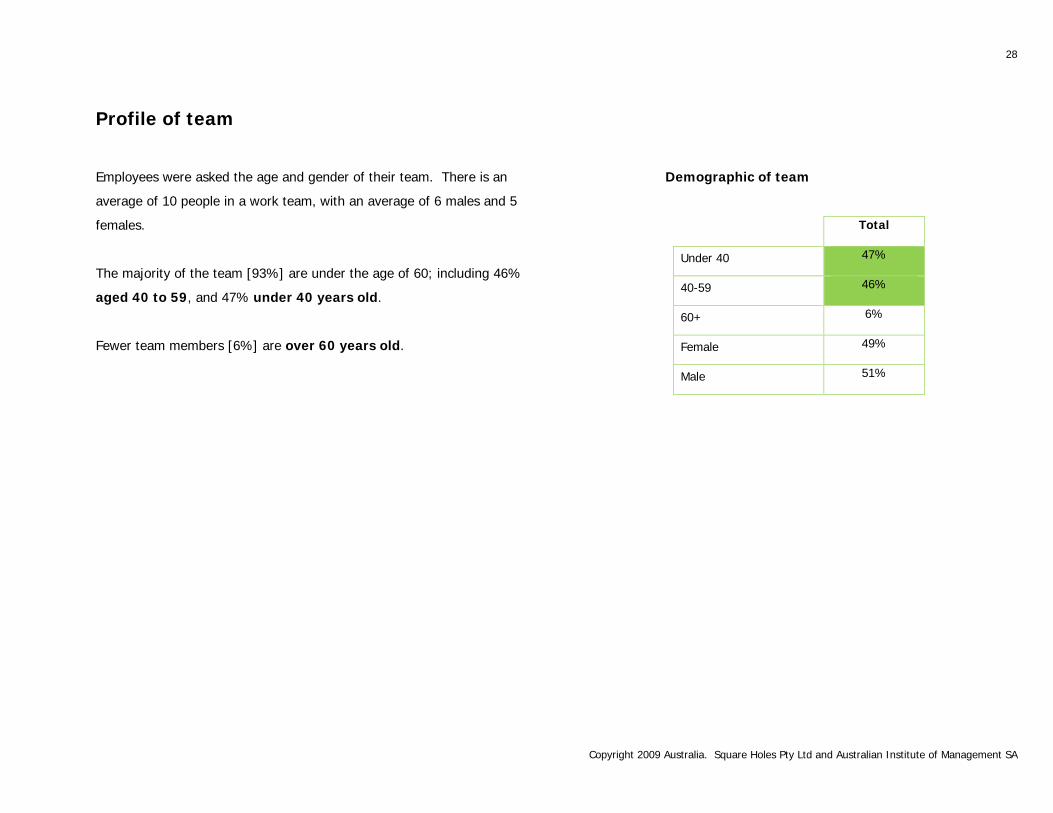
Profile of team
Employees were asked the age and gender of their team. There is an
average of 10 people in a work team, with an average of 6 males and 5
females.
The majority of the team [93%] are under the age of 60; including 46%
aged 40 to 59, and 47% under 40 years old.
Fewer team members [6%] are over 60 years old.
Demographic of team
Total
Under 40 47%
40-59 46%
60+ 6%
Female 49%
Male 51%
29
Copyright 2009 Australia. Square Holes Pty Ltd and Australian Institute of Management SA
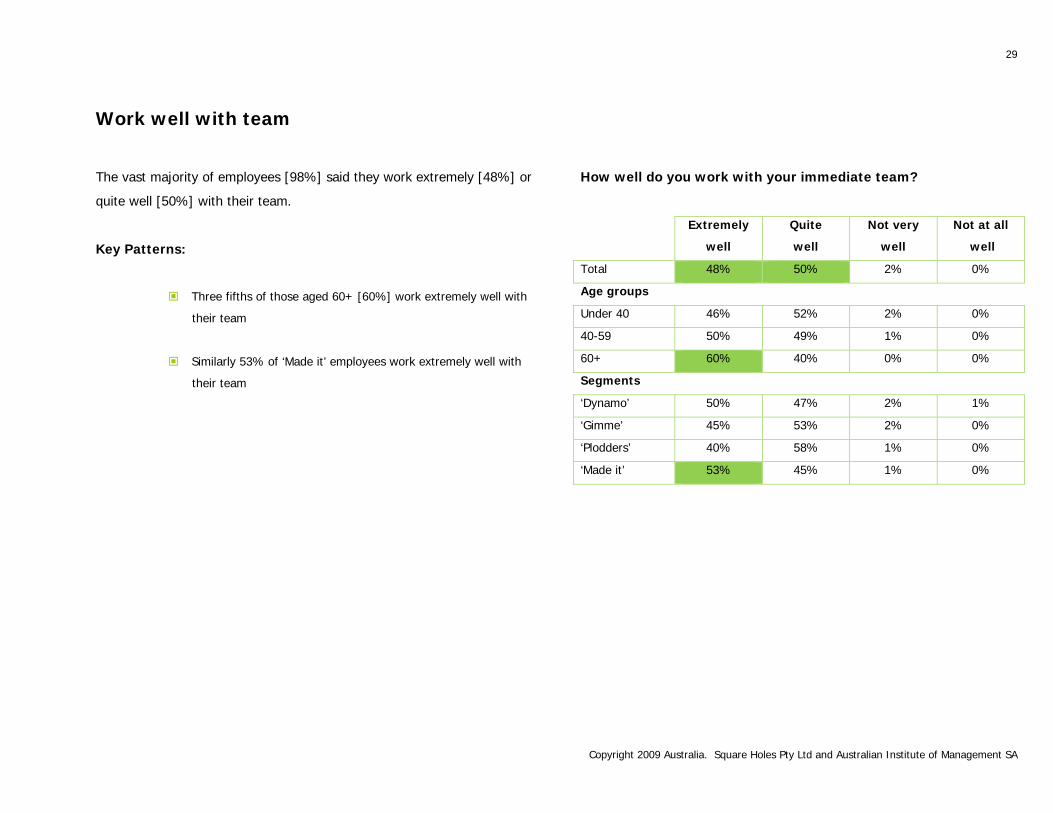
Work well with team
The vast majority of employees [98%] said they work extremely [48%] or
quite well [50%] with their team.
Key Patterns:
Three fifths of those aged 60+ [60%] work extremely well with
their team
Similarly 53% of ‘Made it’ employees work extremely well with
their team
How well do you work with your immediate team?
Extremely
well
Quite
well
Not very
well
Not at all
well
Total 48% 50% 2% 0%
Age groups
Under 40 46% 52% 2% 0%
40-59 50% 49% 1% 0%
60+ 60% 40% 0% 0%
Segments
‘Dynamo’ 50% 47% 2% 1%
‘Gimme’ 45% 53% 2% 0%
‘Plodders’ 40% 58% 1% 0%
‘Made it’ 53% 45% 1% 0%
30
Copyright 2009 Australia. Square Holes Pty Ltd and Australian Institute of Management SA
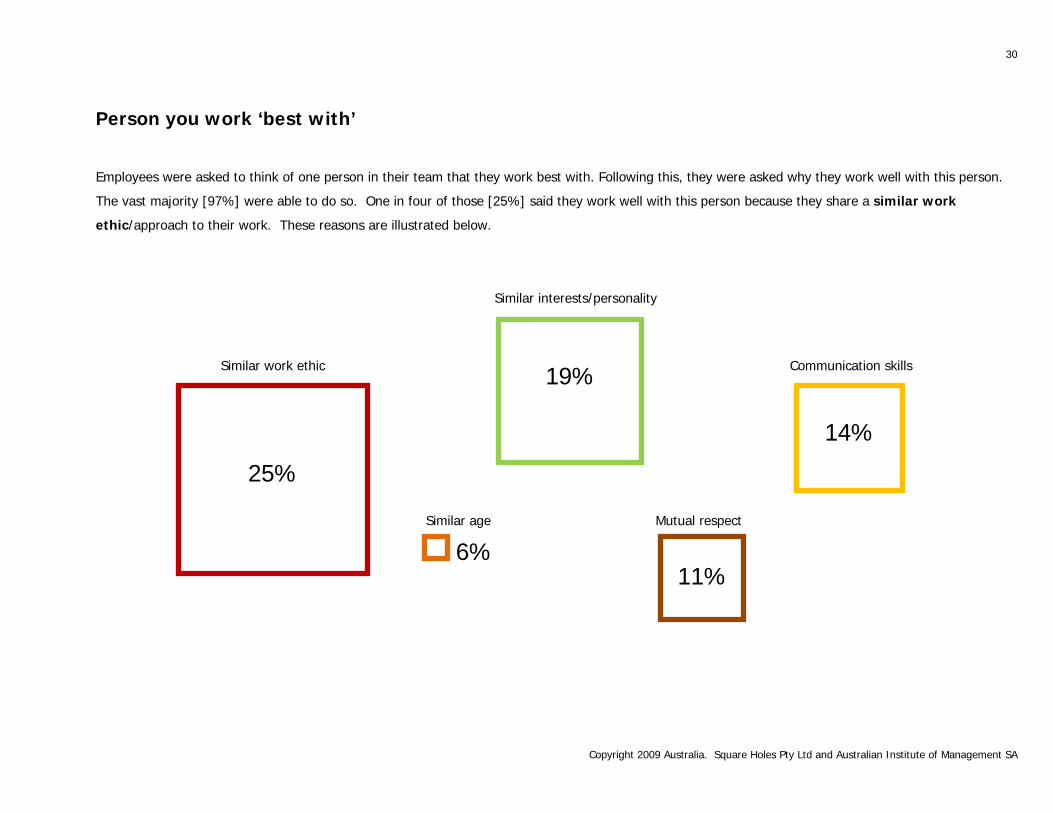
Person you work ‘best with’
Employees were asked to think of one person in their team that they work best with. Following this, they were asked why they work well with this person.
The vast majority [97%] were able to do so. One in four of those [25%] said they work well with this person because they share a similar work
ethic/approach to their work. These reasons are illustrated below.
25%
19%
14%
11%
Similar work ethic
Similar age
6% Mutual respect
Similar interests/personality
Communication skills
31
Copyright 2009 Australia. Square Holes Pty Ltd and Australian Institute of Management SA
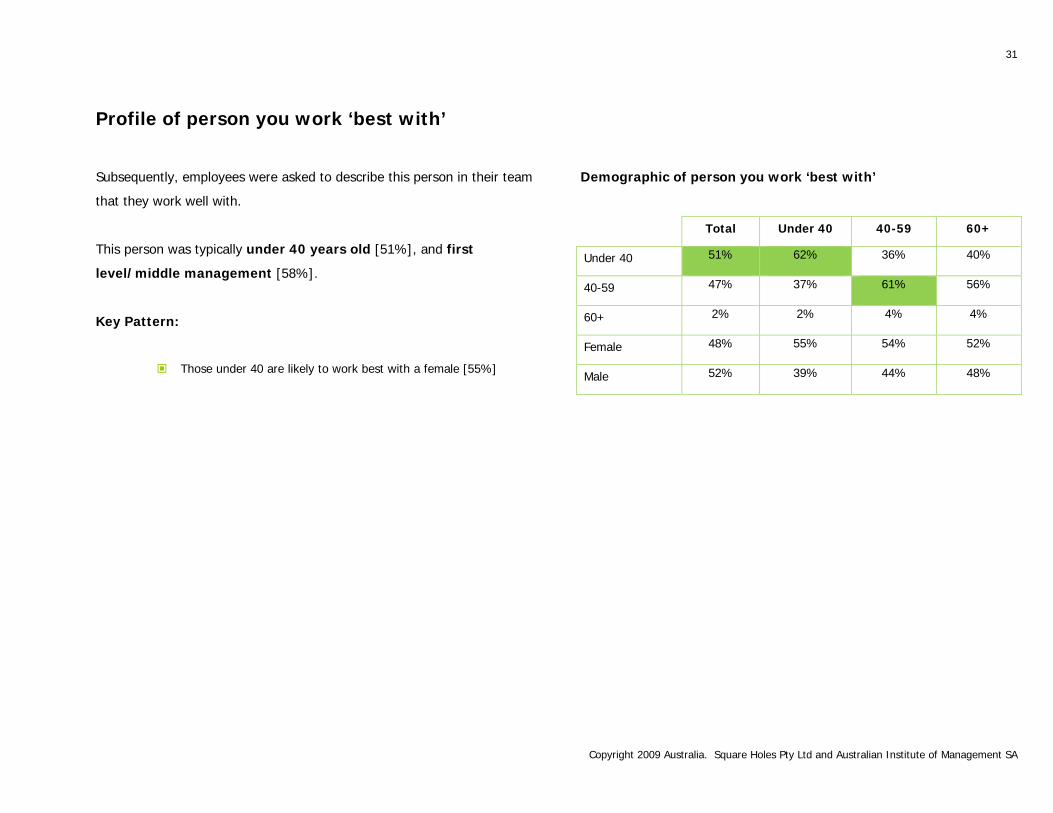
Profile of person you work ‘best with’
Subsequently, employees were asked to describe this person in their team
that they work well with.
This person was typically under 40 years old [51%], and first
level/middle management [58%].
Key Pattern:
Those under 40 are likely to work best with a female [55%]
Demographic of person you work ‘best with’
Total Under 40 40-59 60+
Under 40 51% 62% 36% 40%
40-59 47% 37% 61% 56%
60+ 2% 2% 4% 4%
Female 48% 55% 54% 52%
Male 52% 39% 44% 48%
32
Copyright 2009 Australia. Square Holes Pty Ltd and Australian Institute of Management SA
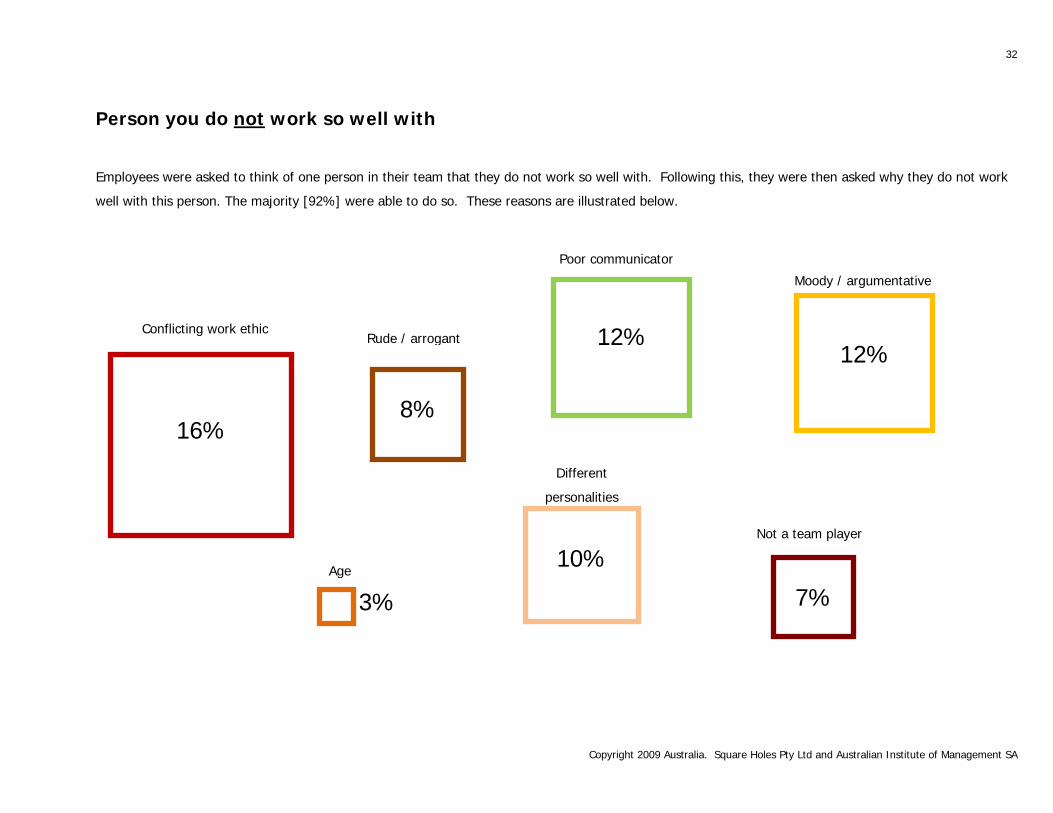
Person you do not work so well with
Employees were asked to think of one person in their team that they do not work so well with. Following this, they were then asked why they do not work
well with this person. The majority [92%] were able to do so. These reasons are illustrated below.
16%
12%
12%
10%
Conflicting work ethic
Age
3%
Different
personalities
Poor communicator
Moody / argumentative
8%
7%
Not a team player
Rude / arrogant
33
Copyright 2009 Australia. Square Holes Pty Ltd and Australian Institute of Management SA
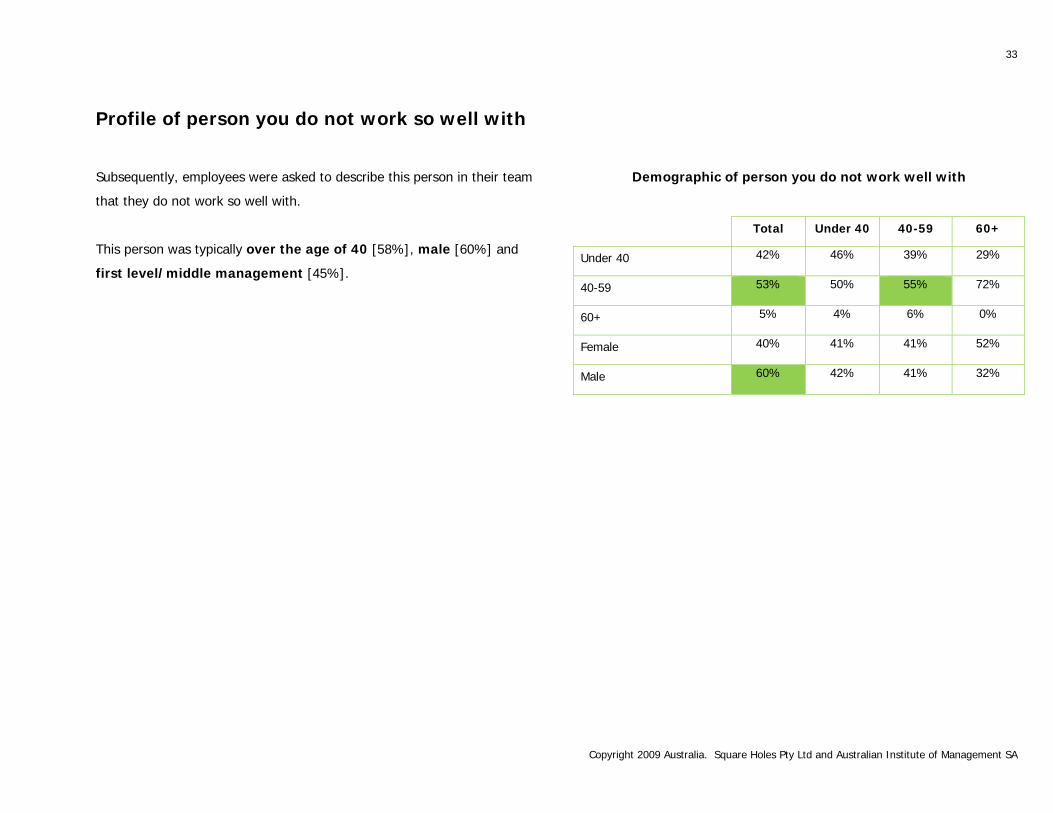
Profile of person you do not work so well with
Subsequently, employees were asked to describe this person in their team
that they do not work so well with.
This person was typically over the age of 40 [58%], male [60%] and
first level/middle management [45%].
Demographic of person you do not work well with
Total Under 40 40-59 60+
Under 40 42% 46% 39% 29%
40-59 53% 50% 55% 72%
60+ 5% 4% 6% 0%
Female 40% 41% 41% 52%
Male 60% 42% 41% 32%
34
Copyright 2009 Australia. Square Holes Pty Ltd and Australian Institute of Management SA
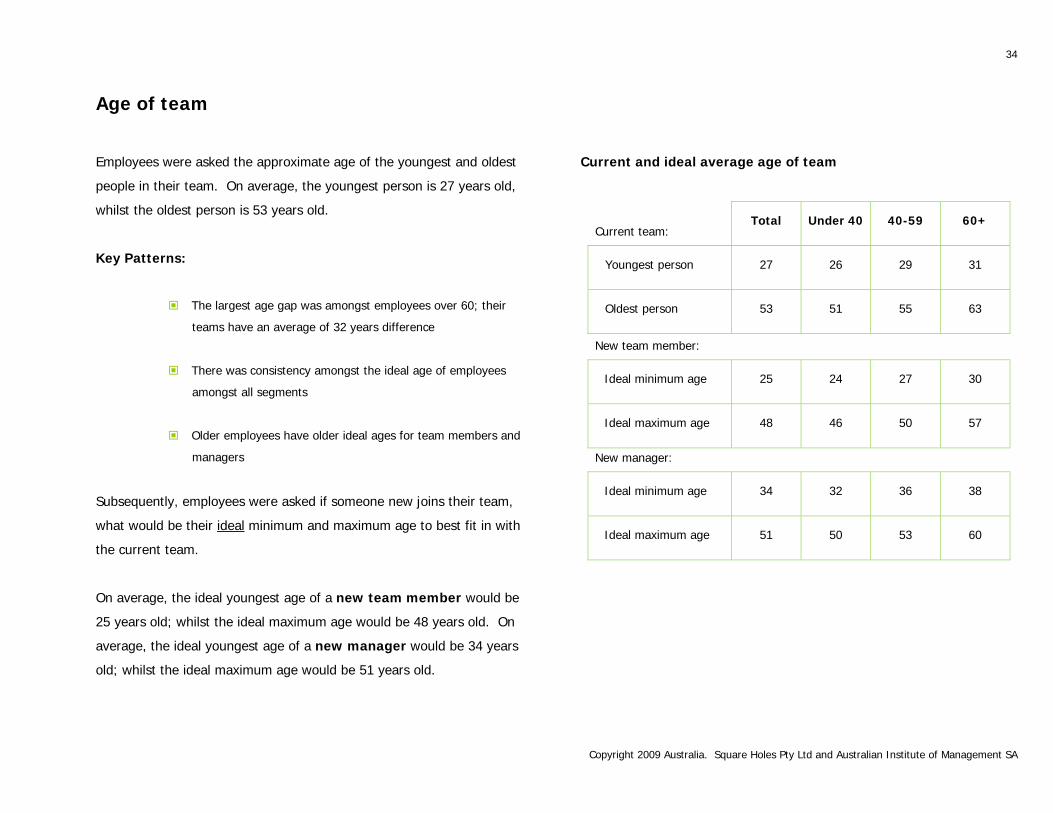
Age of team
Employees were asked the approximate age of the youngest and oldest
people in their team. On average, the youngest person is 27 years old,
whilst the oldest person is 53 years old.
Key Patterns:
The largest age gap was amongst employees over 60; their
teams have an average of 32 years difference
There was consistency amongst the ideal age of employees
amongst all segments
Older employees have older ideal ages for team members and
managers
Subsequently, employees were asked if someone new joins their team,
what would be their ideal minimum and maximum age to best fit in with
the current team.
On average, the ideal youngest age of a new team member would be
25 years old; whilst the ideal maximum age would be 48 years old. On
average, the ideal youngest age of a new manager would be 34 years
old; whilst the ideal maximum age would be 51 years old.
Current and ideal average age of team
Current team: Total Under 40 40-59 60+
Youngest person 27 26 29 31
Oldest person 53 51 55 63
New team member:
Ideal minimum age 25 24 27 30
Ideal maximum age 48 46 50 57
New manager:
Ideal minimum age 34 32 36 38
Ideal maximum age 51 50 53 60
35
Copyright 2009 Australia. Square Holes Pty Ltd and Australian Institute of Management SA
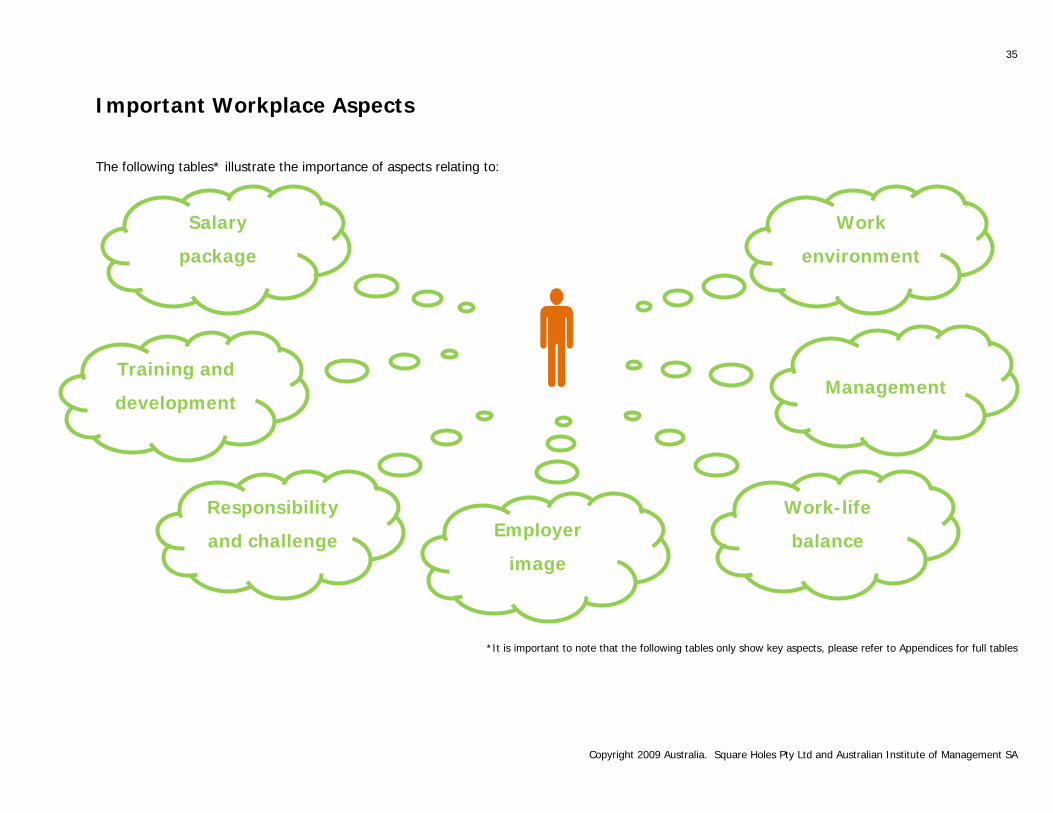
Important Workplace Aspects
The following tables* illustrate the importance of aspects relating to:
*It is important to note that the following tables only show key aspects, please refer to Appendices for full tables
Work
environment
Work-life
balance
Management
Salary
package
Employer
image
Responsibility
and challenge
Training and
development
36
Copyright 2009 Australia. Square Holes Pty Ltd and Australian Institute of Management SA
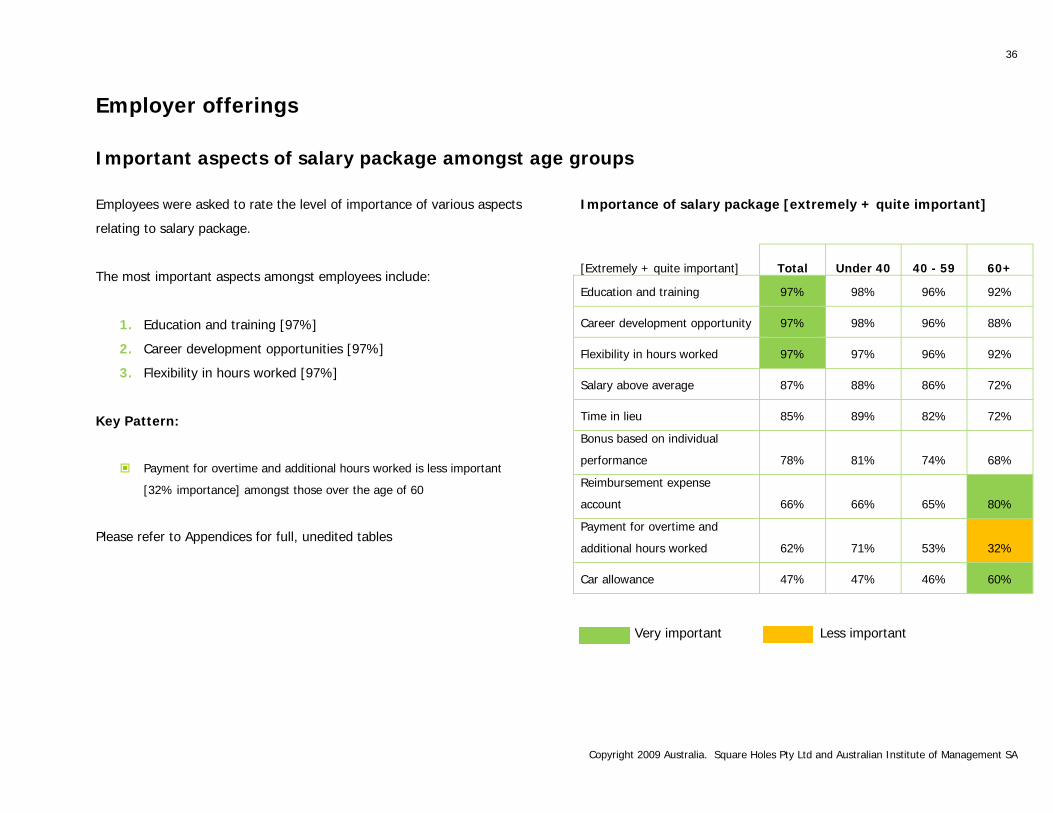
Employer offerings
Important aspects of salary package amongst age groups
Employees were asked to rate the level of importance of various aspects
relating to salary package.
The most important aspects amongst employees include:
1. Education and training [97%]
2. Career development opportunities [97%]
3. Flexibility in hours worked [97%]
Key Pattern:
Payment for overtime and additional hours worked is less important
[32% importance] amongst those over the age of 60
Please refer to Appendices for full, unedited tables
Importance of salary package [extremely + quite important]
[Extremely + quite important] Total Under 40 40 - 59 60+
Education and training 97% 98% 96% 92%
Career development opportunity 97% 98% 96% 88%
Flexibility in hours worked 97% 97% 96% 92%
Salary above average 87% 88% 86% 72%
Time in lieu 85% 89% 82% 72%
Bonus based on individual
performance 78% 81% 74% 68%
Reimbursement expense
account 66% 66% 65% 80%
Payment for overtime and
additional hours worked 62% 71% 53% 32%
Car allowance 47% 47% 46% 60%
Very important Less important
37
Copyright 2009 Australia. Square Holes Pty Ltd and Australian Institute of Management SA
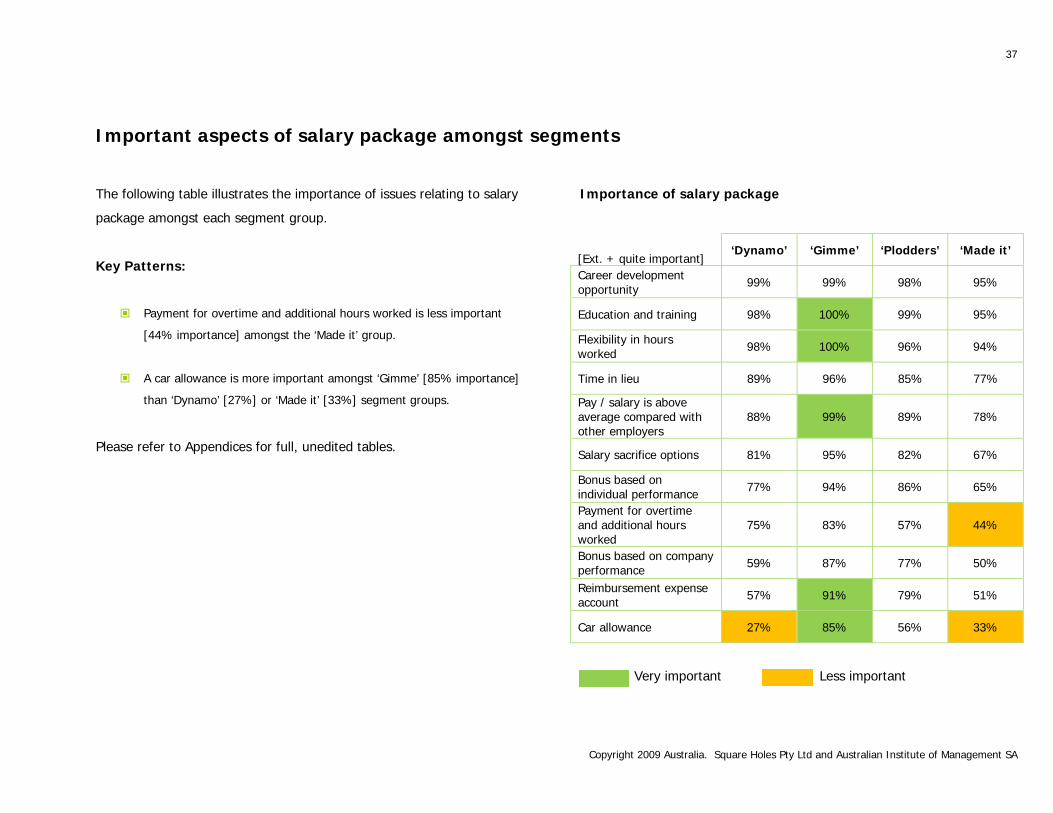
Important aspects of salary package amongst segments
The following table illustrates the importance of issues relating to salary
package amongst each segment group.
Key Patterns:
Payment for overtime and additional hours worked is less important
[44% importance] amongst the ‘Made it’ group.
A car allowance is more important amongst ‘Gimme’ [85% importance]
than ‘Dynamo’ [27%] or ‘Made it’ [33%] segment groups.
Please refer to Appendices for full, unedited tables.
Importance of salary package
[Ext. + quite important] ‘Dynamo’ ‘Gimme’ ‘Plodders’ ‘Made it’
Career development opportunity 99% 99% 98% 95%
Education and training 98% 100% 99% 95%
Flexibility in hours worked 98% 100% 96% 94%
Time in lieu 89% 96% 85% 77%
Pay / salary is above average compared with other employers
88% 99% 89% 78%
Salary sacrifice options 81% 95% 82% 67%
Bonus based on individual performance 77% 94% 86% 65%
Payment for overtime and additional hours worked
75% 83% 57% 44%
Bonus based on company performance 59% 87% 77% 50%
Reimbursement expense account 57% 91% 79% 51%
Car allowance 27% 85% 56% 33%
Very important Less important
38
Copyright 2009 Australia. Square Holes Pty Ltd and Australian Institute of Management SA
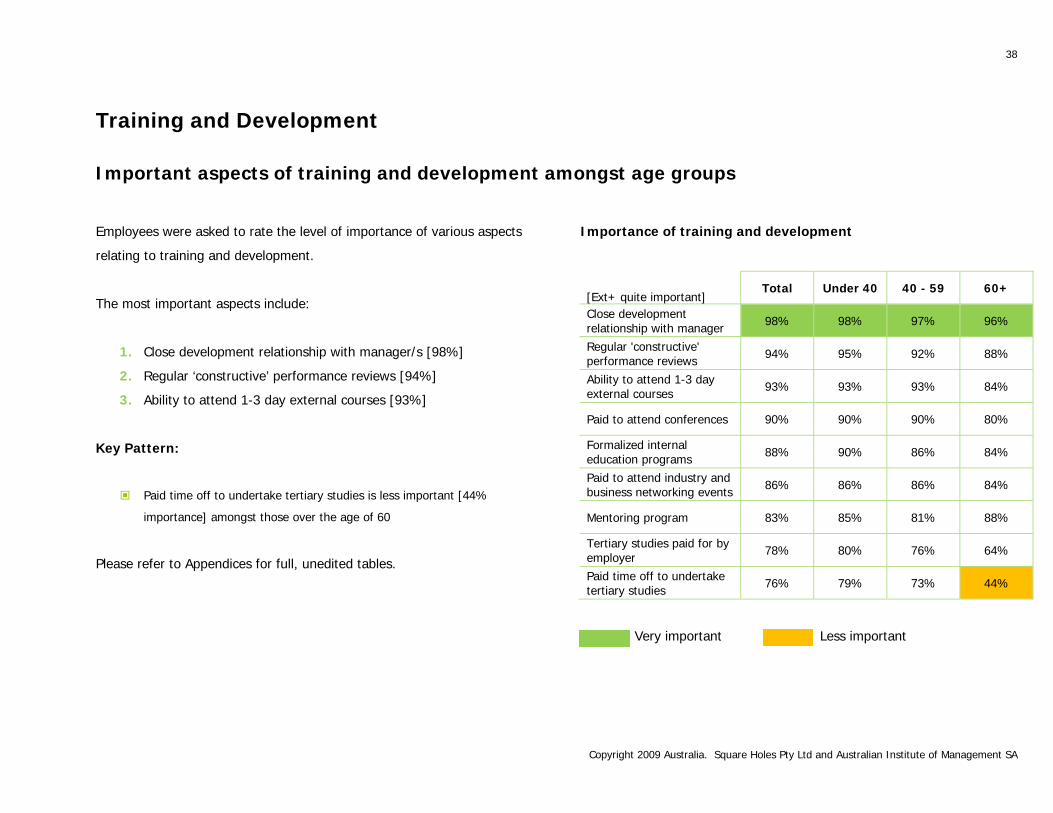
Training and Development
Important aspects of training and development amongst age groups
Employees were asked to rate the level of importance of various aspects
relating to training and development.
The most important aspects include:
1. Close development relationship with manager/s [98%]
2. Regular ‘constructive’ performance reviews [94%]
3. Ability to attend 1-3 day external courses [93%]
Key Pattern:
Paid time off to undertake tertiary studies is less important [44%
importance] amongst those over the age of 60
Please refer to Appendices for full, unedited tables.
Importance of training and development
[Ext+ quite important] Total Under 40 40 - 59 60+
Close development relationship with manager 98% 98% 97% 96%
Regular 'constructive' performance reviews 94% 95% 92% 88%
Ability to attend 1-3 day external courses 93% 93% 93% 84%
Paid to attend conferences 90% 90% 90% 80%
Formalized internal education programs 88% 90% 86% 84%
Paid to attend industry and business networking events 86% 86% 86% 84%
Mentoring program 83% 85% 81% 88%
Tertiary studies paid for by employer 78% 80% 76% 64%
Paid time off to undertake tertiary studies 76% 79% 73% 44%
Very important Less important
39
Copyright 2009 Australia. Square Holes Pty Ltd and Australian Institute of Management SA
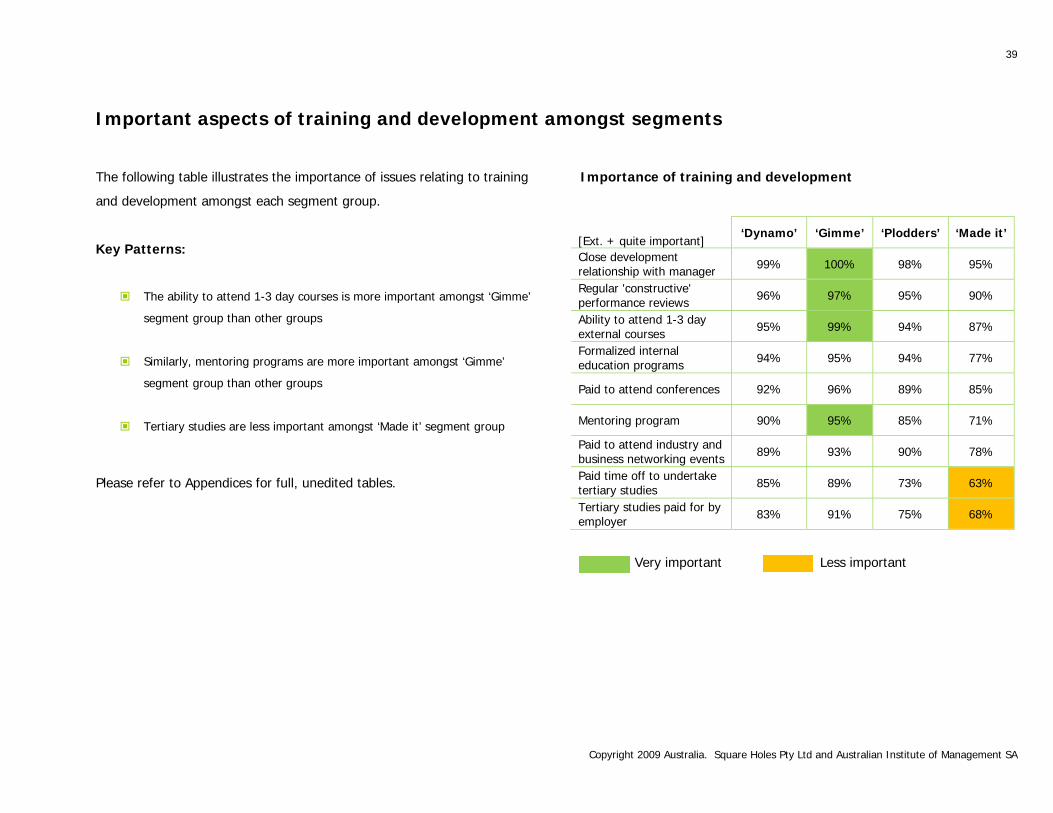
Important aspects of training and development amongst segments
The following table illustrates the importance of issues relating to training
and development amongst each segment group.
Key Patterns:
The ability to attend 1-3 day courses is more important amongst ‘Gimme’
segment group than other groups
Similarly, mentoring programs are more important amongst ‘Gimme’
segment group than other groups
Tertiary studies are less important amongst ‘Made it’ segment group
Please refer to Appendices for full, unedited tables.
Importance of training and development
[Ext. + quite important] ‘Dynamo’ ‘Gimme’ ‘Plodders’ ‘Made it’
Close development relationship with manager 99% 100% 98% 95%
Regular 'constructive' performance reviews 96% 97% 95% 90%
Ability to attend 1-3 day external courses 95% 99% 94% 87%
Formalized internal education programs 94% 95% 94% 77%
Paid to attend conferences 92% 96% 89% 85%
Mentoring program 90% 95% 85% 71%
Paid to attend industry and business networking events 89% 93% 90% 78%
Paid time off to undertake tertiary studies 85% 89% 73% 63%
Tertiary studies paid for by employer 83% 91% 75% 68%
Very important Less important
40
Copyright 2009 Australia. Square Holes Pty Ltd and Australian Institute of Management SA
Responsibility and Challenge
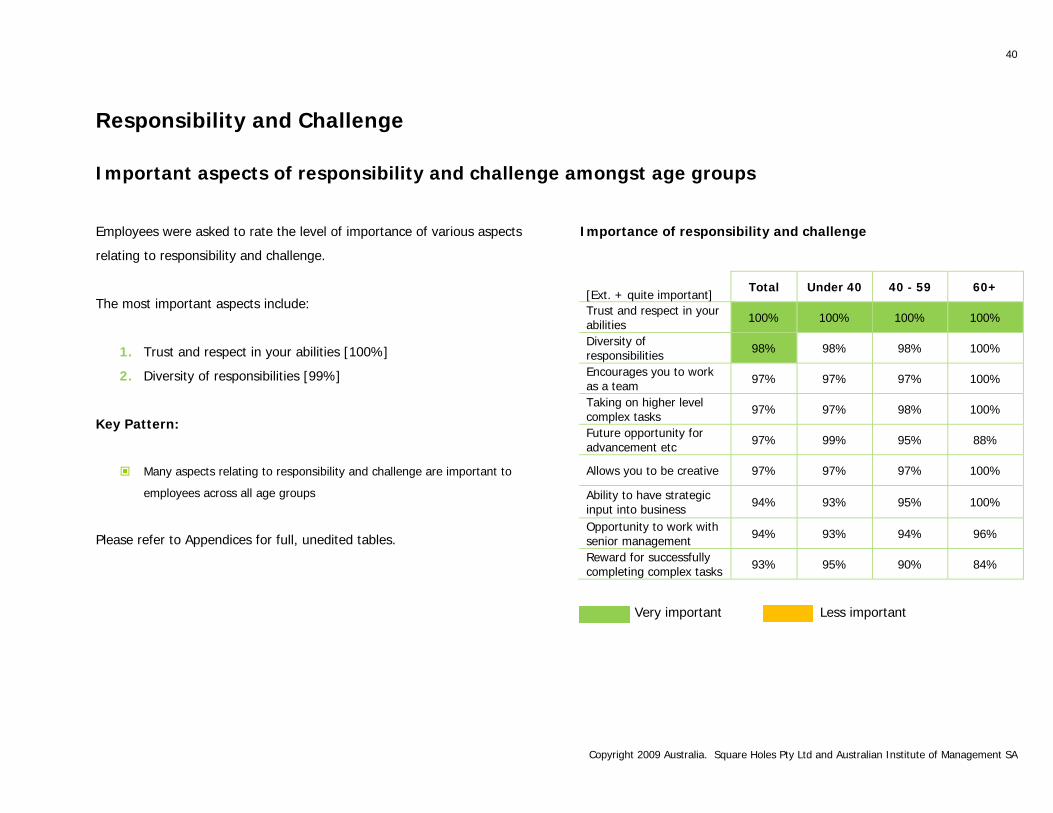
Important aspects of responsibility and challenge amongst age groups
Employees were asked to rate the level of importance of various aspects
relating to responsibility and challenge.
The most important aspects include:
1. Trust and respect in your abilities [100%]
2. Diversity of responsibilities [99%]
Key Pattern:
Many aspects relating to responsibility and challenge are important to
employees across all age groups
Please refer to Appendices for full, unedited tables.
Importance of responsibility and challenge
[Ext. + quite important] Total Under 40 40 - 59 60+
Trust and respect in your abilities 100% 100% 100% 100%
Diversity of responsibilities 98% 98% 98% 100%
Encourages you to work as a team 97% 97% 97% 100%
Taking on higher level complex tasks 97% 97% 98% 100%
Future opportunity for advancement etc 97% 99% 95% 88%
Allows you to be creative 97% 97% 97% 100%
Ability to have strategic input into business 94% 93% 95% 100%
Opportunity to work with senior management 94% 93% 94% 96%
Reward for successfully completing complex tasks 93% 95% 90% 84%
Very important Less important
41
Copyright 2009 Australia. Square Holes Pty Ltd and Australian Institute of Management SA
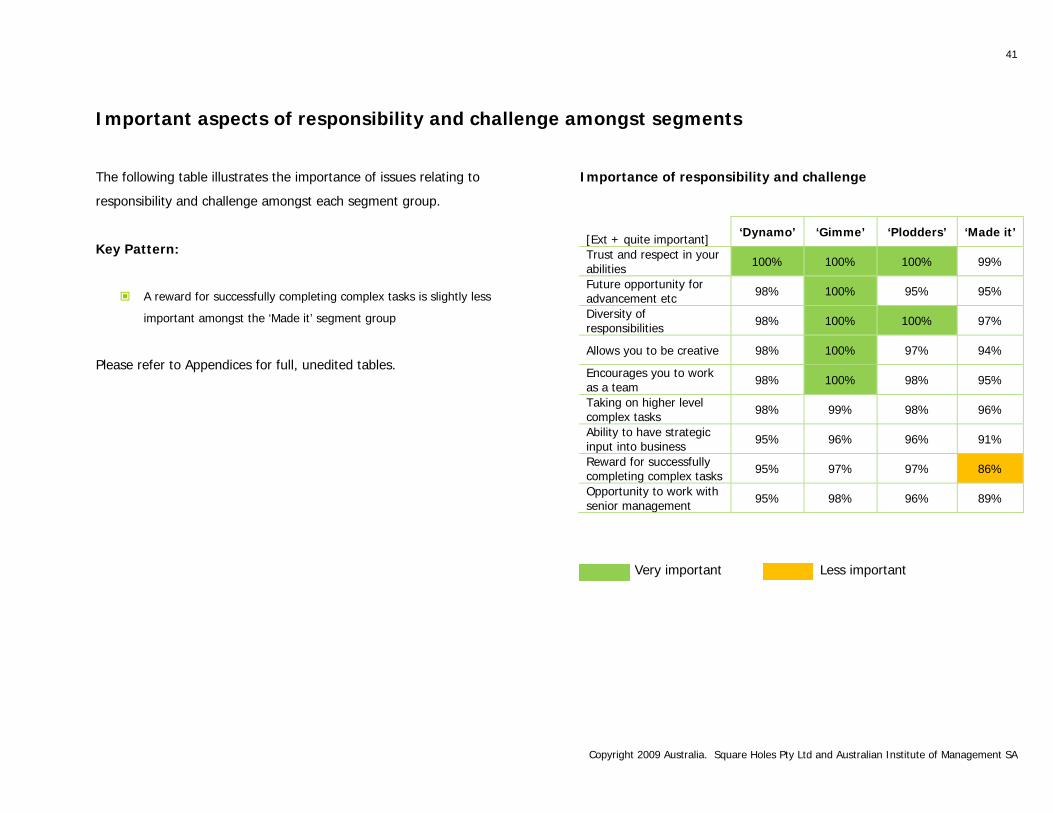
Important aspects of responsibility and challenge amongst segments
The following table illustrates the importance of issues relating to
responsibility and challenge amongst each segment group.
Key Pattern:
A reward for successfully completing complex tasks is slightly less
important amongst the ‘Made it’ segment group
Please refer to Appendices for full, unedited tables.
Importance of responsibility and challenge
[Ext + quite important] ‘Dynamo’ ‘Gimme’ ‘Plodders’ ‘Made it’
Trust and respect in your abilities 100% 100% 100% 99%
Future opportunity for advancement etc 98% 100% 95% 95%
Diversity of responsibilities 98% 100% 100% 97%
Allows you to be creative 98% 100% 97% 94%
Encourages you to work as a team 98% 100% 98% 95%
Taking on higher level complex tasks 98% 99% 98% 96%
Ability to have strategic input into business 95% 96% 96% 91%
Reward for successfully completing complex tasks 95% 97% 97% 86%
Opportunity to work with senior management 95% 98% 96% 89%
Very important Less important
42
Copyright 2009 Australia. Square Holes Pty Ltd and Australian Institute of Management SA
Employer Image
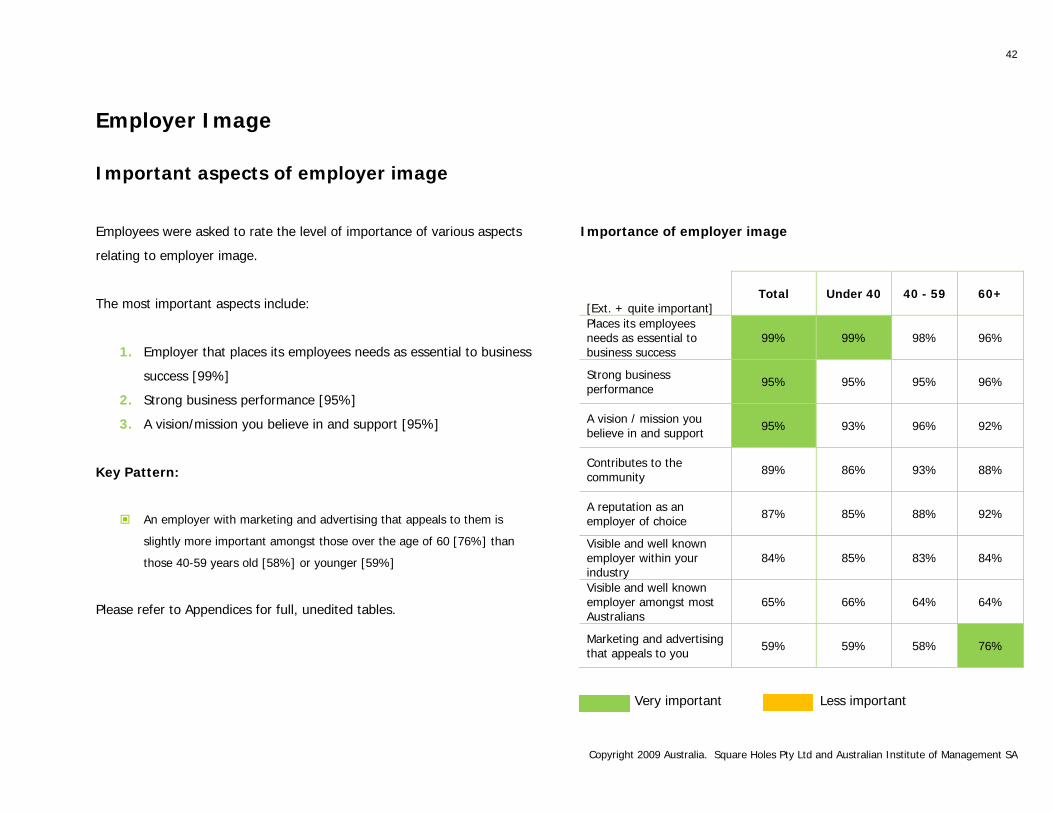
Important aspects of employer image
Employees were asked to rate the level of importance of various aspects
relating to employer image.
The most important aspects include:
1. Employer that places its employees needs as essential to business
success [99%]
2. Strong business performance [95%]
3. A vision/mission you believe in and support [95%]
Key Pattern:
An employer with marketing and advertising that appeals to them is
slightly more important amongst those over the age of 60 [76%] than
those 40-59 years old [58%] or younger [59%]
Please refer to Appendices for full, unedited tables.
Importance of employer image
[Ext. + quite important] Total Under 40 40 - 59 60+
Places its employees needs as essential to business success
99% 99% 98% 96%
Strong business performance 95% 95% 95% 96%
A vision / mission you believe in and support 95% 93% 96% 92%
Contributes to the community 89% 86% 93% 88%
A reputation as an employer of choice 87% 85% 88% 92%
Visible and well known employer within your industry
84% 85% 83% 84%
Visible and well known employer amongst most Australians
65% 66% 64% 64%
Marketing and advertising that appeals to you 59% 59% 58% 76%
Very important Less important
43
Copyright 2009 Australia. Square Holes Pty Ltd and Australian Institute of Management SA
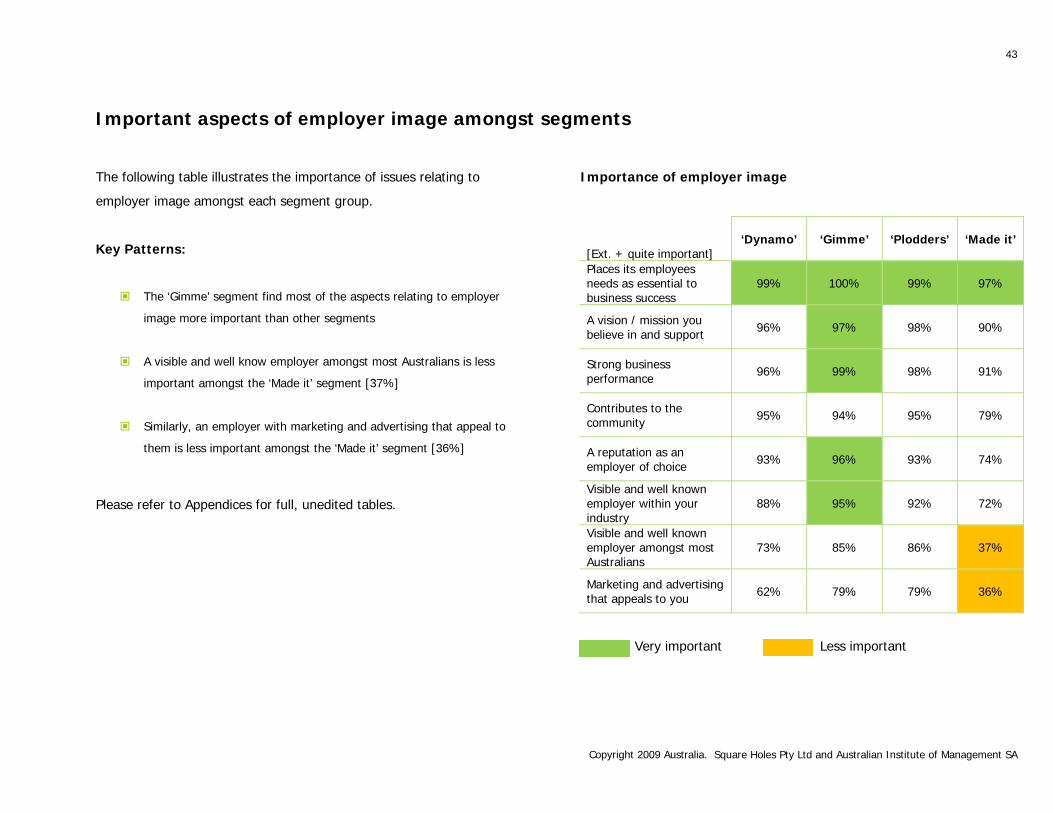
Important aspects of employer image amongst segments
The following table illustrates the importance of issues relating to
employer image amongst each segment group.
Key Patterns:
The ‘Gimme’ segment find most of the aspects relating to employer
image more important than other segments
A visible and well know employer amongst most Australians is less
important amongst the ‘Made it’ segment [37%]
Similarly, an employer with marketing and advertising that appeal to
them is less important amongst the ‘Made it’ segment [36%]
Please refer to Appendices for full, unedited tables.
Importance of employer image
[Ext. + quite important] ‘Dynamo’ ‘Gimme’ ‘Plodders’ ‘Made it’
Places its employees needs as essential to business success
99% 100% 99% 97%
A vision / mission you believe in and support 96% 97% 98% 90%
Strong business performance 96% 99% 98% 91%
Contributes to the community 95% 94% 95% 79%
A reputation as an employer of choice 93% 96% 93% 74%
Visible and well known employer within your industry
88% 95% 92% 72%
Visible and well known employer amongst most Australians
73% 85% 86% 37%
Marketing and advertising that appeals to you 62% 79% 79% 36%
Very important Less important
44
Copyright 2009 Australia. Square Holes Pty Ltd and Australian Institute of Management SA
Work-Life Balance
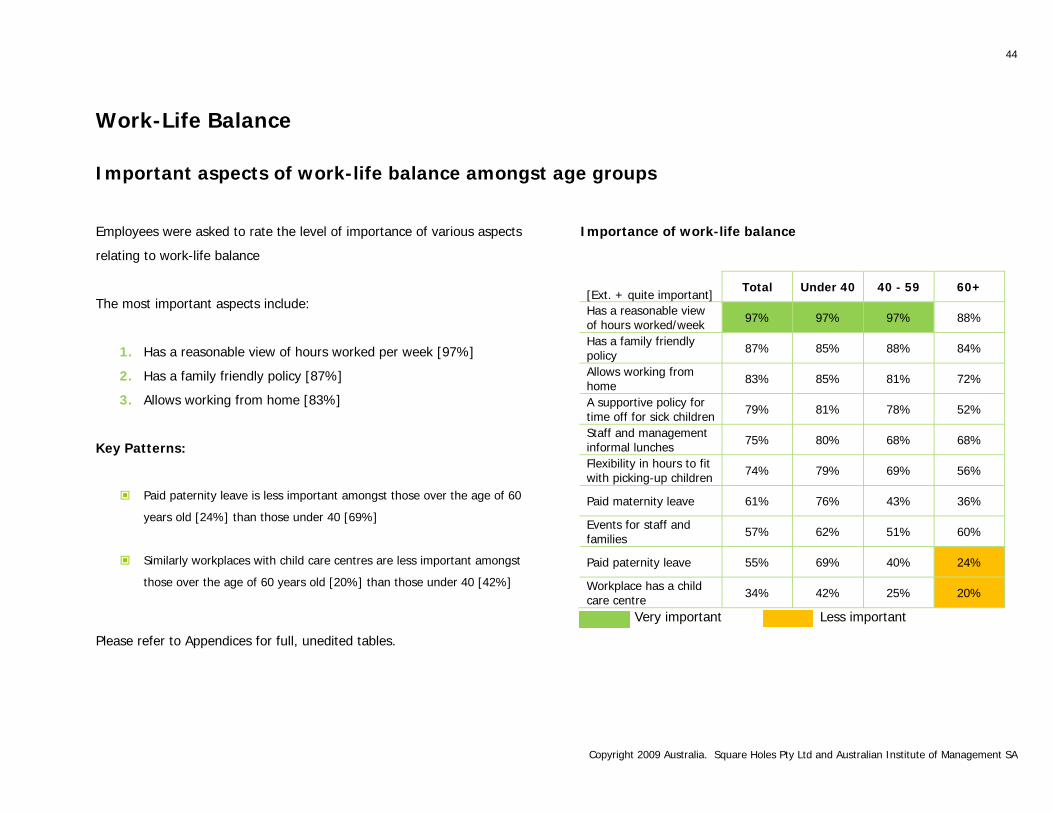
Important aspects of work-life balance amongst age groups
Employees were asked to rate the level of importance of various aspects
relating to work-life balance
The most important aspects include:
1. Has a reasonable view of hours worked per week [97%]
2. Has a family friendly policy [87%]
3. Allows working from home [83%]
Key Patterns:
Paid paternity leave is less important amongst those over the age of 60
years old [24%] than those under 40 [69%]
Similarly workplaces with child care centres are less important amongst
those over the age of 60 years old [20%] than those under 40 [42%]
Importance of work-life balance
[Ext. + quite important] Total Under 40 40 - 59 60+
Has a reasonable view of hours worked/week 97% 97% 97% 88%
Has a family friendly policy 87% 85% 88% 84%
Allows working from home 83% 85% 81% 72%
A supportive policy for time off for sick children 79% 81% 78% 52%
Staff and management informal lunches 75% 80% 68% 68%
Flexibility in hours to fit with picking-up children 74% 79% 69% 56%
Paid maternity leave 61% 76% 43% 36%
Events for staff and families 57% 62% 51% 60%
Paid paternity leave 55% 69% 40% 24%
Workplace has a child care centre 34% 42% 25% 20%
Please refer to Appendices for full, unedited tables.
Very important Less important
45
Copyright 2009 Australia. Square Holes Pty Ltd and Australian Institute of Management SA
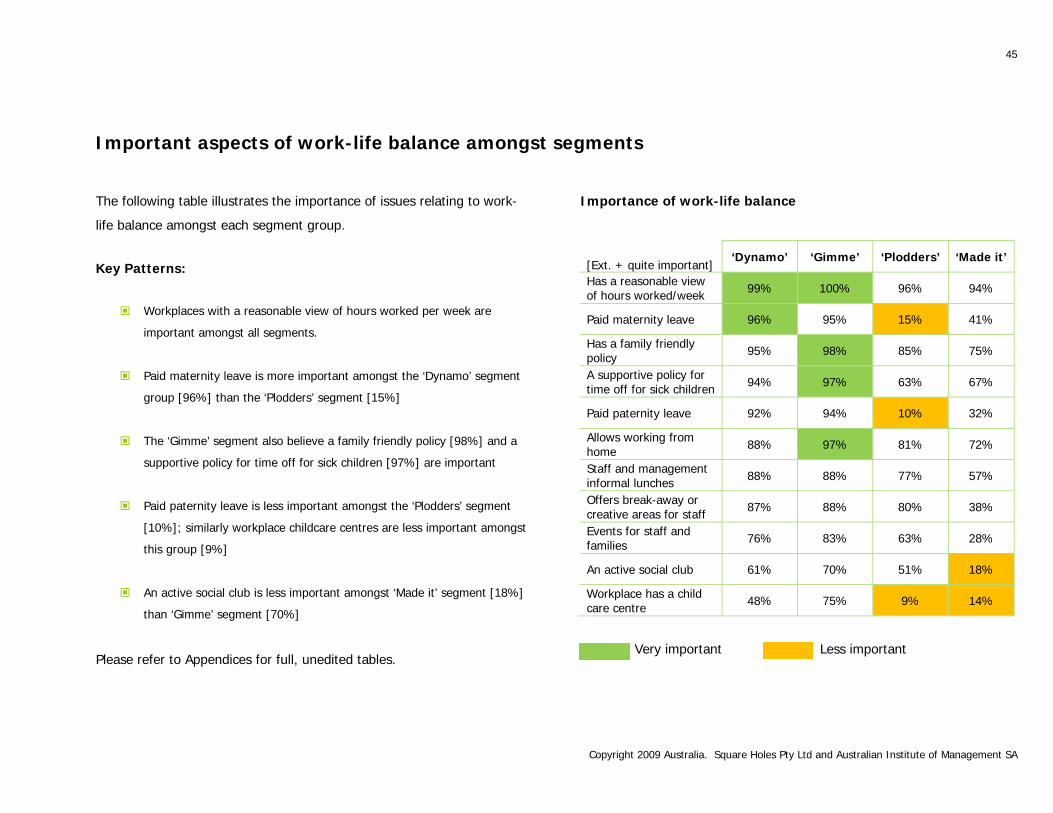
Important aspects of work-life balance amongst segments
The following table illustrates the importance of issues relating to work-
life balance amongst each segment group.
Key Patterns:
Workplaces with a reasonable view of hours worked per week are
important amongst all segments.
Paid maternity leave is more important amongst the ‘Dynamo’ segment
group [96%] than the ‘Plodders’ segment [15%]
The ‘Gimme’ segment also believe a family friendly policy [98%] and a
supportive policy for time off for sick children [97%] are important
Paid paternity leave is less important amongst the ‘Plodders’ segment
[10%]; similarly workplace childcare centres are less important amongst
this group [9%]
An active social club is less important amongst ‘Made it’ segment [18%]
than ‘Gimme’ segment [70%]
Please refer to Appendices for full, unedited tables.
Importance of work-life balance
[Ext. + quite important] ‘Dynamo’ ‘Gimme’ ‘Plodders’ ‘Made it’
Has a reasonable view of hours worked/week 99% 100% 96% 94%
Paid maternity leave 96% 95% 15% 41%
Has a family friendly policy 95% 98% 85% 75%
A supportive policy for time off for sick children 94% 97% 63% 67%
Paid paternity leave 92% 94% 10% 32%
Allows working from home 88% 97% 81% 72%
Staff and management informal lunches 88% 88% 77% 57%
Offers break-away or creative areas for staff 87% 88% 80% 38%
Events for staff and families 76% 83% 63% 28%
An active social club 61% 70% 51% 18%
Workplace has a child care centre 48% 75% 9% 14%
Very important Less important
46
Copyright 2009 Australia. Square Holes Pty Ltd and Australian Institute of Management SA
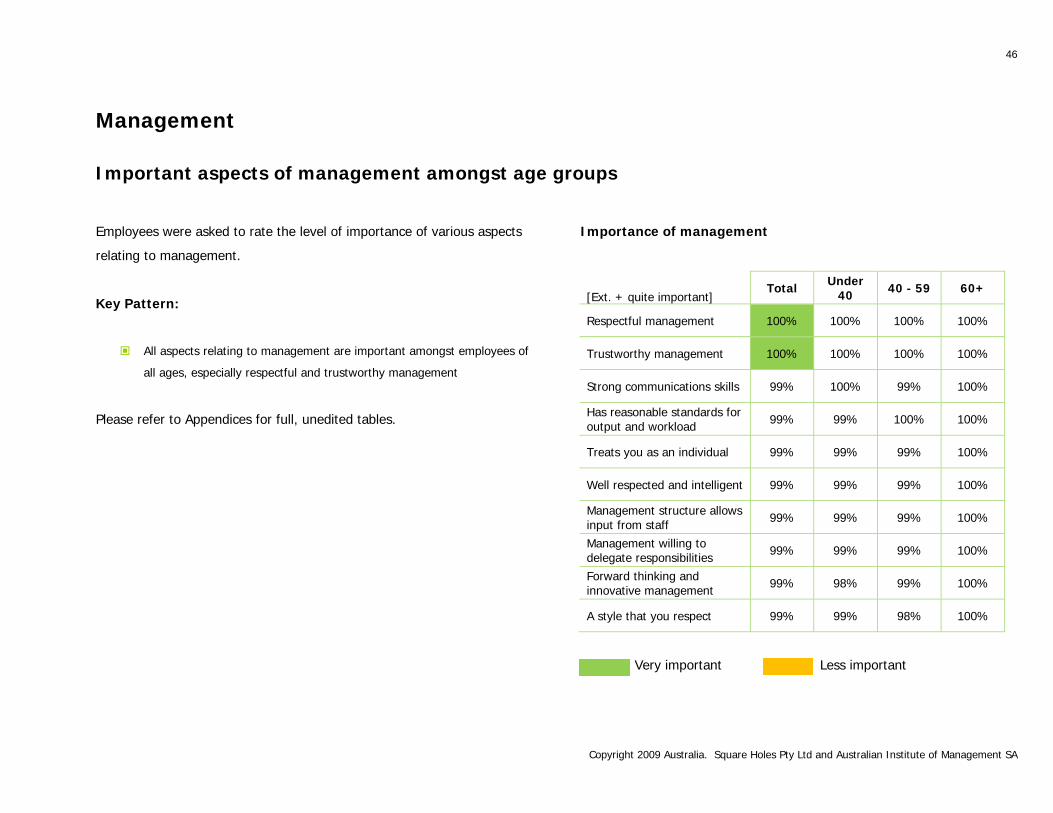
Management
Important aspects of management amongst age groups
Employees were asked to rate the level of importance of various aspects
relating to management.
Key Pattern:
All aspects relating to management are important amongst employees of
all ages, especially respectful and trustworthy management
Please refer to Appendices for full, unedited tables.
Importance of management
[Ext. + quite important] Total Under
40 40 - 59 60+
Respectful management 100% 100% 100% 100%
Trustworthy management 100% 100% 100% 100%
Strong communications skills 99% 100% 99% 100%
Has reasonable standards for output and workload 99% 99% 100% 100%
Treats you as an individual 99% 99% 99% 100%
Well respected and intelligent 99% 99% 99% 100%
Management structure allows input from staff 99% 99% 99% 100%
Management willing to delegate responsibilities 99% 99% 99% 100%
Forward thinking and innovative management 99% 98% 99% 100%
A style that you respect 99% 99% 98% 100%
Very important Less important
47
Copyright 2009 Australia. Square Holes Pty Ltd and Australian Institute of Management SA
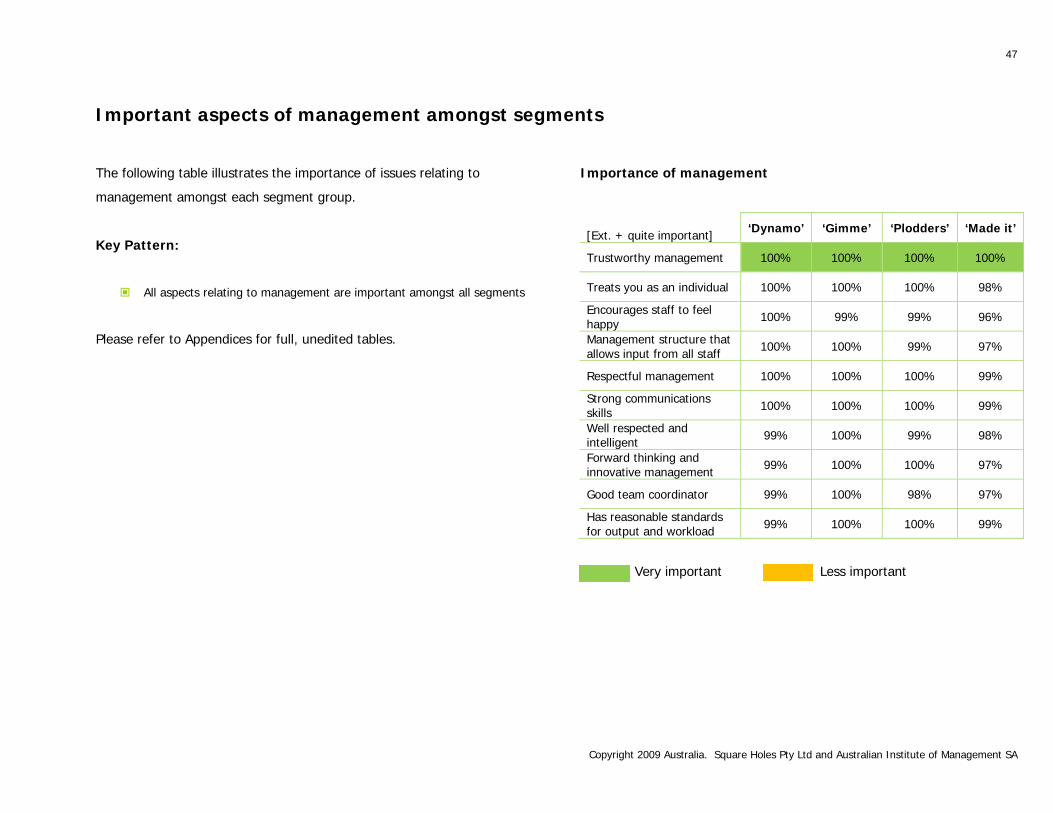
Important aspects of management amongst segments
The following table illustrates the importance of issues relating to
management amongst each segment group.
Key Pattern:
All aspects relating to management are important amongst all segments
Please refer to Appendices for full, unedited tables.
Importance of management
[Ext. + quite important] ‘Dynamo’ ‘Gimme’ ‘Plodders’ ‘Made it’
Trustworthy management 100% 100% 100% 100%
Treats you as an individual 100% 100% 100% 98%
Encourages staff to feel happy 100% 99% 99% 96%
Management structure that allows input from all staff 100% 100% 99% 97%
Respectful management 100% 100% 100% 99%
Strong communications skills 100% 100% 100% 99%
Well respected and intelligent 99% 100% 99% 98%
Forward thinking and innovative management 99% 100% 100% 97%
Good team coordinator 99% 100% 98% 97%
Has reasonable standards for output and workload 99% 100% 100% 99%
Very important Less important
48
Copyright 2009 Australia. Square Holes Pty Ltd and Australian Institute of Management SA
Work Environment
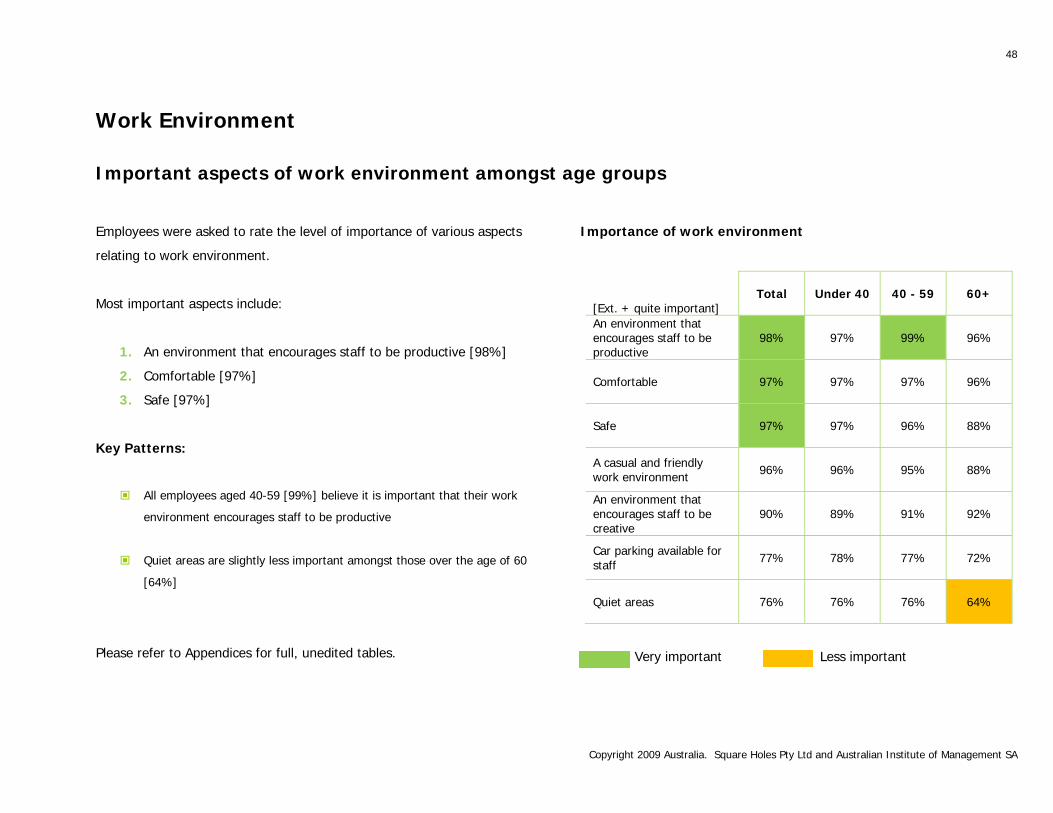
Important aspects of work environment amongst age groups
Employees were asked to rate the level of importance of various aspects
relating to work environment.
Most important aspects include:
1. An environment that encourages staff to be productive [98%]
2. Comfortable [97%]
3. Safe [97%]
Key Patterns:
All employees aged 40-59 [99%] believe it is important that their work
environment encourages staff to be productive
Quiet areas are slightly less important amongst those over the age of 60
[64%]
Please refer to Appendices for full, unedited tables.
Importance of work environment
[Ext. + quite important] Total Under 40 40 - 59 60+
An environment that encourages staff to be productive
98% 97% 99% 96%
Comfortable 97% 97% 97% 96%
Safe 97% 97% 96% 88%
A casual and friendly work environment 96% 96% 95% 88%
An environment that encourages staff to be creative
90% 89% 91% 92%
Car parking available for staff 77% 78% 77% 72%
Quiet areas 76% 76% 76% 64%
Very important Less important
49
Copyright 2009 Australia. Square Holes Pty Ltd and Australian Institute of Management SA
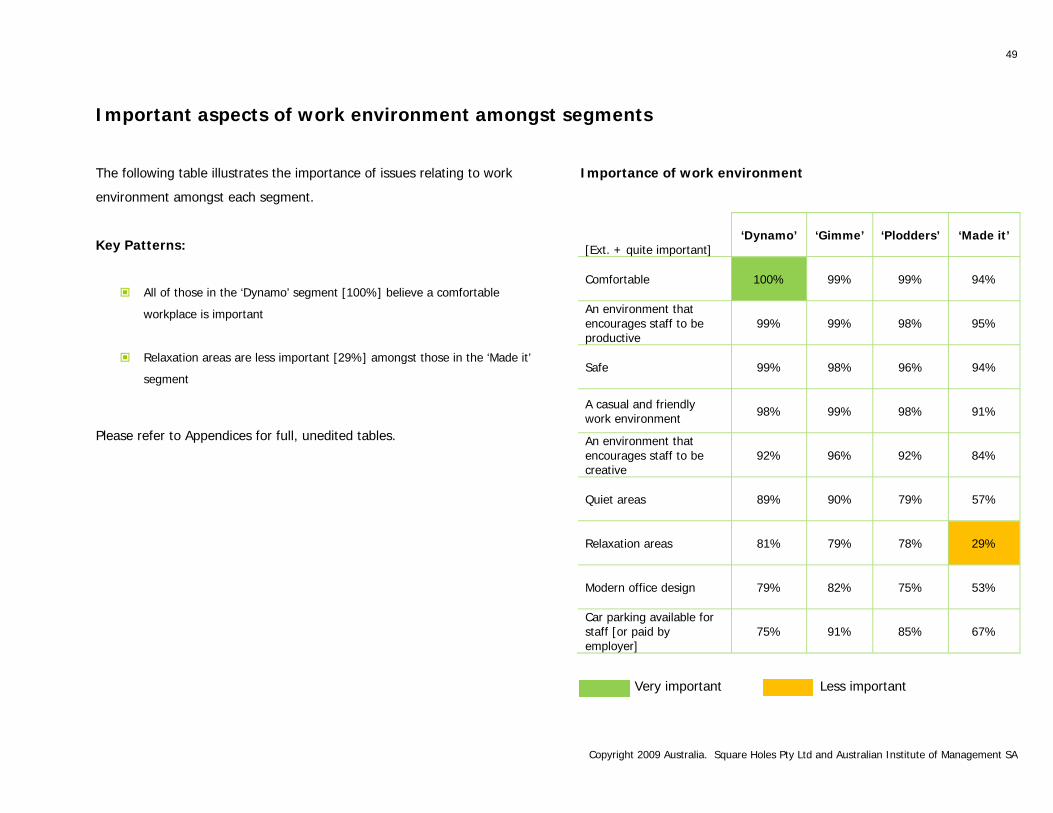
Important aspects of work environment amongst segments
The following table illustrates the importance of issues relating to work
environment amongst each segment.
Key Patterns:
All of those in the ‘Dynamo’ segment [100%] believe a comfortable
workplace is important
Relaxation areas are less important [29%] amongst those in the ‘Made it’
segment
Please refer to Appendices for full, unedited tables.
Importance of work environment
[Ext. + quite important] ‘Dynamo’ ‘Gimme’ ‘Plodders’ ‘Made it’
Comfortable 100% 99% 99% 94%
An environment that encourages staff to be productive
99% 99% 98% 95%
Safe 99% 98% 96% 94%
A casual and friendly work environment 98% 99% 98% 91%
An environment that encourages staff to be creative
92% 96% 92% 84%
Quiet areas 89% 90% 79% 57%
Relaxation areas 81% 79% 78% 29%
Modern office design 79% 82% 75% 53%
Car parking available for staff [or paid by employer]
75% 91% 85% 67%
Very important Less important
50
Copyright 2009 Australia. Square Holes Pty Ltd and Australian Institute of Management SA
Uniqueness
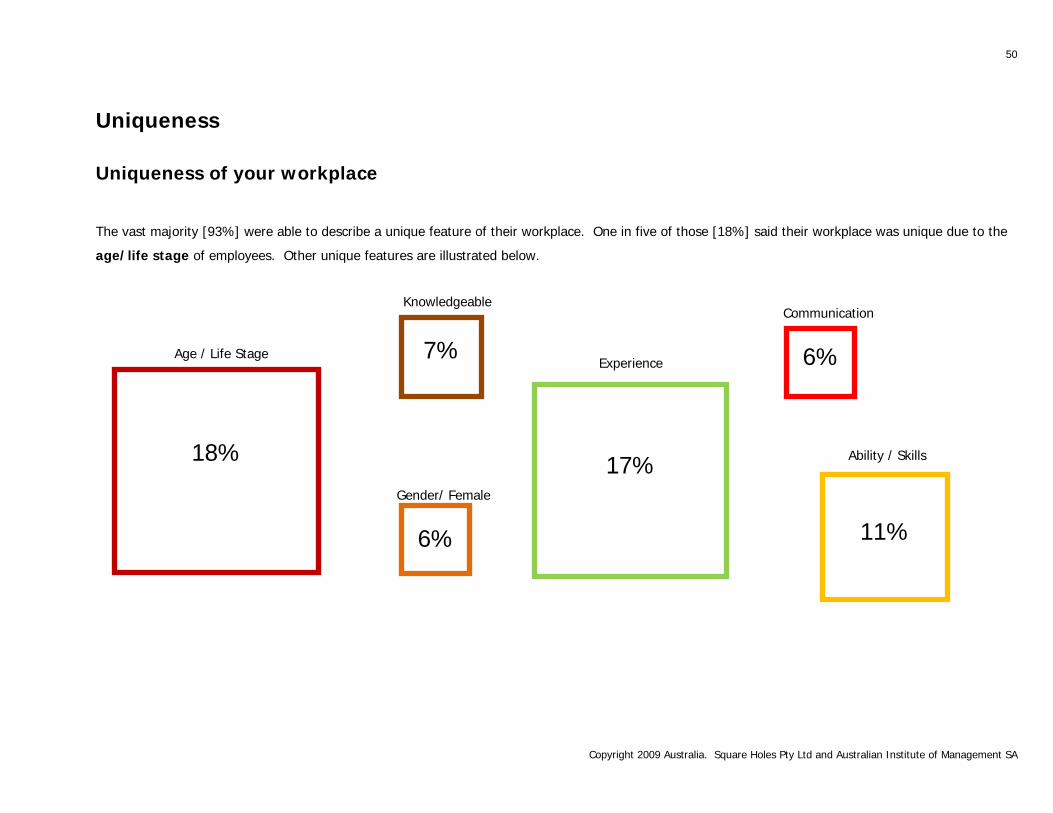
Uniqueness of your workplace
The vast majority [93%] were able to describe a unique feature of their workplace. One in five of those [18%] said their workplace was unique due to the
age/life stage of employees. Other unique features are illustrated below.
6%
18%
17%
11%
7%
6%
Age / Life Stage
Gender/ Female
Knowledgeable
Experience
Ability / Skills
Communication
51
Copyright 2009 Australia. Square Holes Pty Ltd and Australian Institute of Management SA
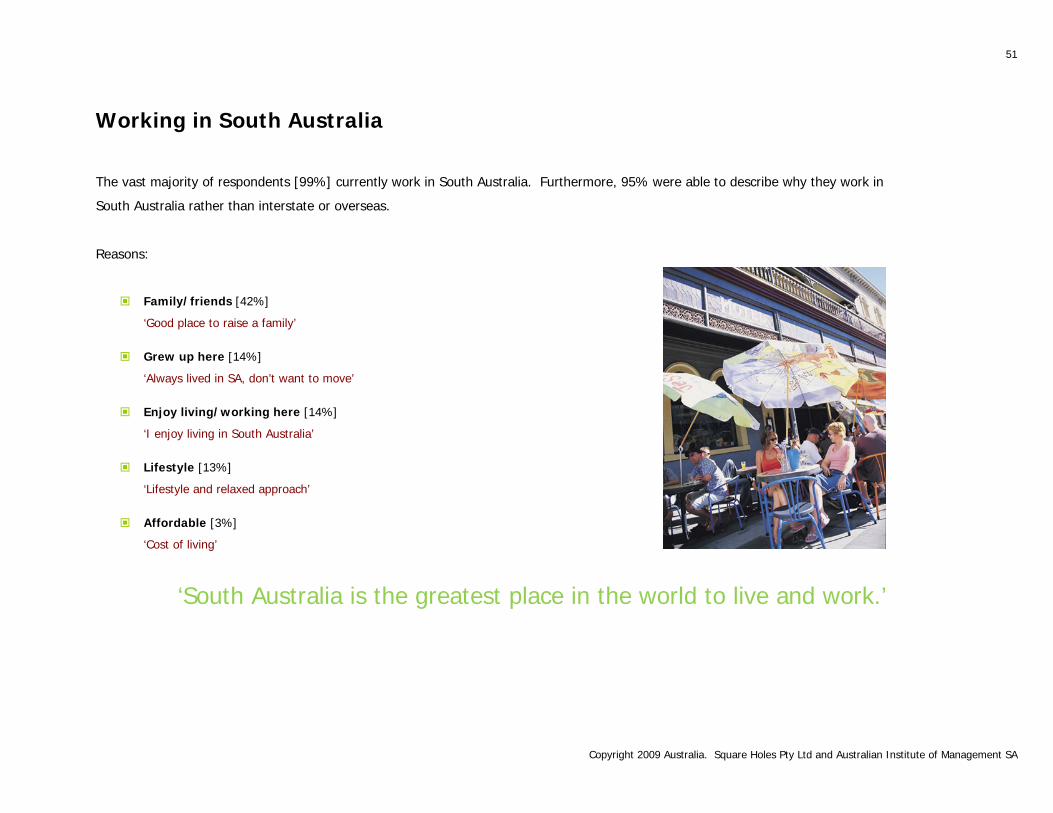
Working in South Australia
The vast majority of respondents [99%] currently work in South Australia. Furthermore, 95% were able to describe why they work in
South Australia rather than interstate or overseas.
Reasons:
Family/friends [42%]
‘Good place to raise a family’
Grew up here [14%]
‘Always lived in SA, don’t want to move’
Enjoy living/working here [14%]
‘I enjoy living in South Australia’
Lifestyle [13%]
‘Lifestyle and relaxed approach’
Affordable [3%]
‘Cost of living’
‘South Australia is the greatest place in the world to live and work.’
52
Copyright 2009 Australia. Square Holes Pty Ltd and Australian Institute of Management SA
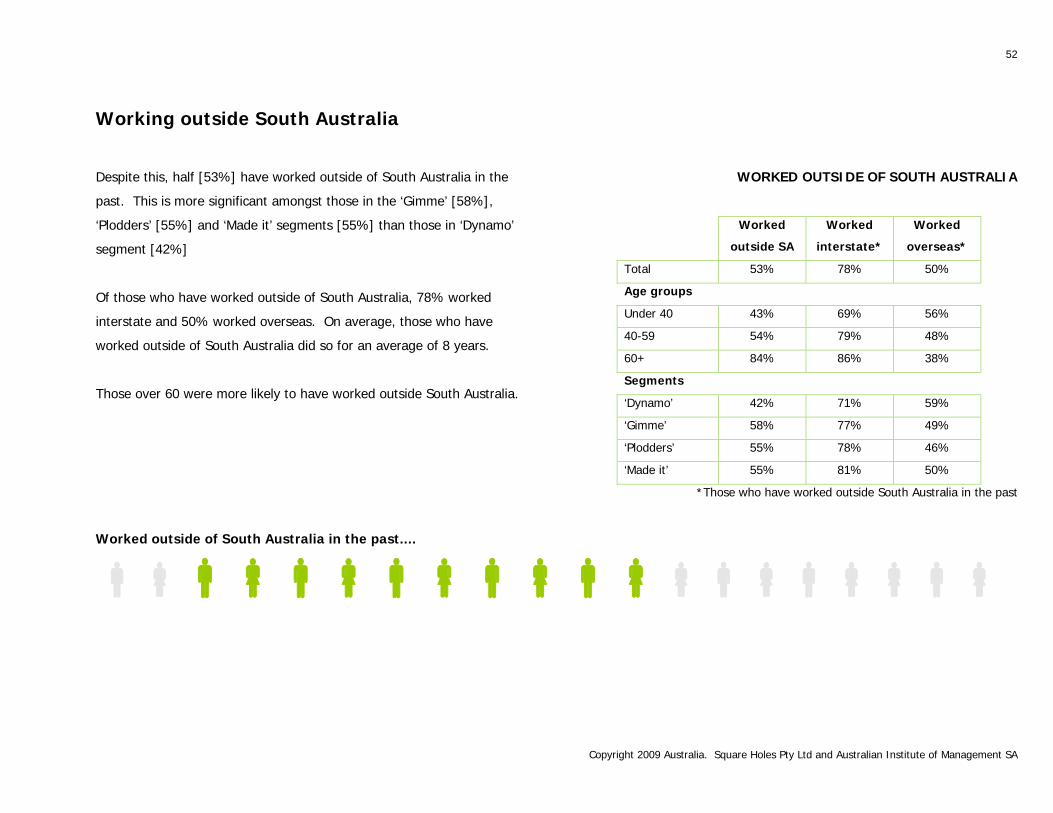
Working outside South Australia
Despite this, half [53%] have worked outside of South Australia in the
past. This is more significant amongst those in the ‘Gimme’ [58%],
‘Plodders’ [55%] and ‘Made it’ segments [55%] than those in ‘Dynamo’
segment [42%]
Of those who have worked outside of South Australia, 78% worked
interstate and 50% worked overseas. On average, those who have
worked outside of South Australia did so for an average of 8 years.
Those over 60 were more likely to have worked outside South Australia.
WORKED OUTSIDE OF SOUTH AUSTRALIA
Worked
outside SA
Worked
interstate*
Worked
overseas*
Total 53% 78% 50%
Age groups
Under 40 43% 69% 56%
40-59 54% 79% 48%
60+ 84% 86% 38%
Segments
‘Dynamo’ 42% 71% 59%
‘Gimme’ 58% 77% 49%
‘Plodders’ 55% 78% 46%
‘Made it’ 55% 81% 50%
*Those who have worked outside South Australia in the past
Worked outside of South Australia in the past....
Employee Profile
54
Copyright 2009 Australia. Square Holes Pty Ltd and Australian Institute of Management SA
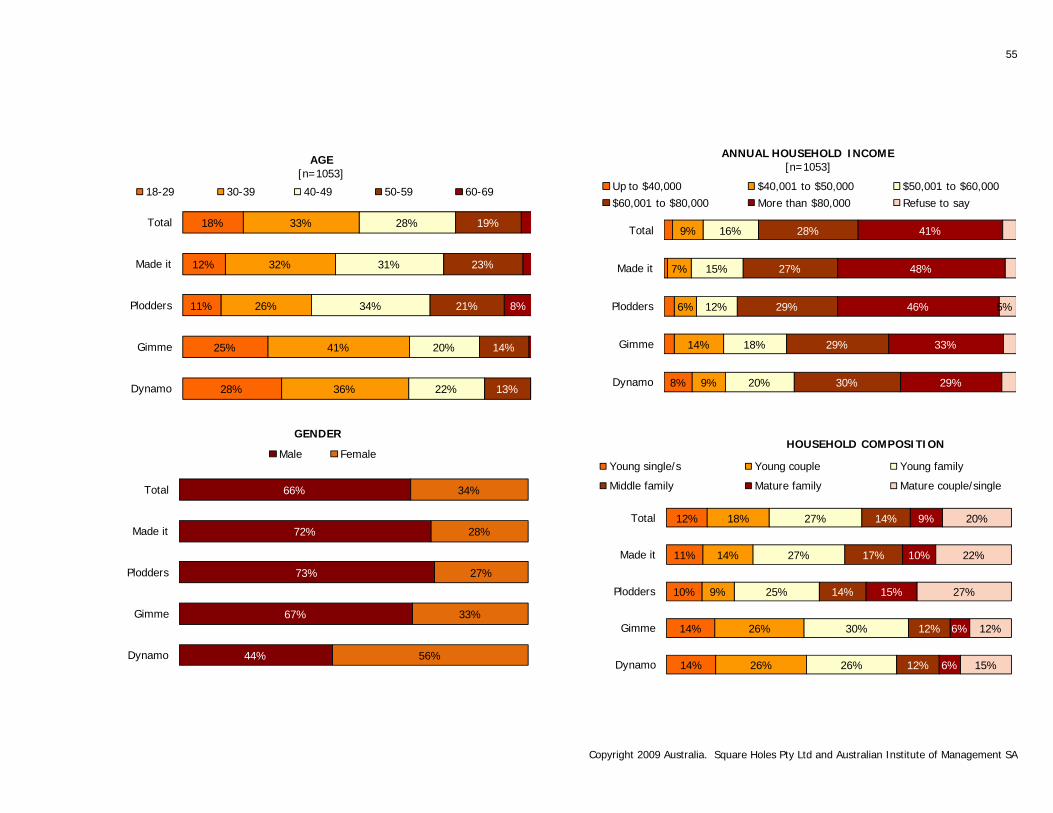
The following charts provide a detailed illustration of the employee and segment profile for this Generation Gap study.
There was a fairly even distribution of age groups amongst employee respondents; with an equal number of employees under the age
of 40 [50%] and over the age of 40 [50%]. Following this, respondents were asked how old they felt. Interestingly, the majority
[77%] feel under the age of 40 years. This is mainly attributable to their health/fitness [48%] and having children [21%].
Similarly, there is a fairly even distribution of household compositions, young families [27%] to mature couples/singles [20%].
There was a skew in gender; with two thirds male [66%] and one third female respondents [34%].
Employees surveyed have been working for an average of 20 years and in this time have had an average of 5 jobs. The majority of
employees [69%] earn over $60,000; this includes two fifths [41%] who earn $60,001 to $80,000.
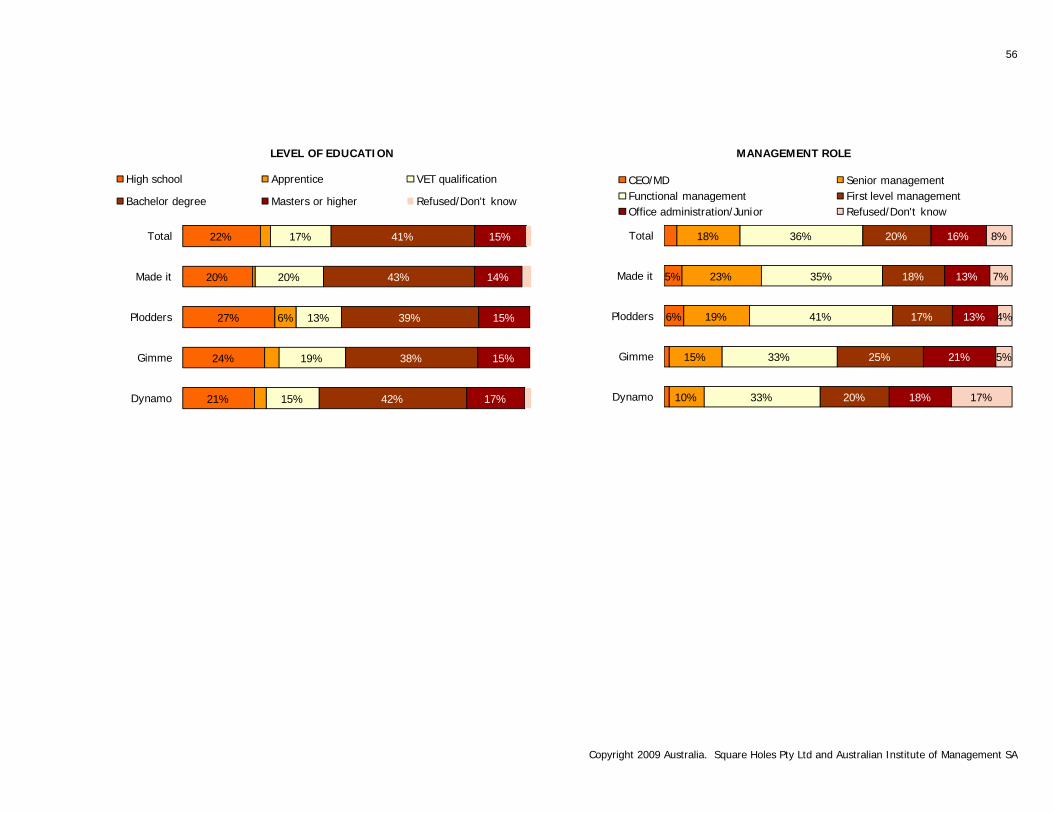
The majority of employees are employed in a management position [77%] including 22% in senior management/CEO positions. The
employees are HR consultants [7%], administrative assistants [4%] and accountants [3%].
More than half of employees [56%] hold a bachelors degree or higher. High school is the highest level of education amongst one
fifth of employees [22%].
55
Copyright 2009 Australia. Square Holes Pty Ltd and Australian Institute of Management SA
28%
25%
11%
12%
18%
36%
41%
26%
32%
33%
22%
20%
34%
31%
28%
13%
14%
21%
23%
19%
8%
Dynamo
Gimme
Plodders
Made it
Total
AGE[n=1053]
18-29 30-39 40-49 50-59 60-69
44%
67%
73%
72%
66%
56%
33%
27%
28%
34%
Dynamo
Gimme
Plodders
Made it
Total
GENDER
Male Female
8% 9%
14%
6%
7%
9%
20%
18%
12%
15%
16%
30%
29%
29%
27%
28%
29%
33%
46%
48%
41%
5%
Dynamo
Gimme
Plodders
Made it
Total
ANNUAL HOUSEHOLD INCOME[n=1053]
Up to $40,000 $40,001 to $50,000 $50,001 to $60,000$60,001 to $80,000 More than $80,000 Refuse to say
14%
14%
10%
11%
12%
26%
26%
9%
14%
18%
26%
30%
25%
27%
27%
12%
12%
14%
17%
14%
6%
6%
15%
10%
9%
15%
12%
27%
22%
20%
Dynamo
Gimme
Plodders
Made it
Total
HOUSEHOLD COMPOSITION
Young single/s Young couple Young family
Middle family Mature family Mature couple/single
56
Copyright 2009 Australia. Square Holes Pty Ltd and Australian Institute of Management SA
21%
24%
27%
20%
22%
6%
15%
19%
13%
20%
17%
42%
38%
39%
43%
41%
17%
15%
15%
14%
15%
Dynamo
Gimme
Plodders
Made it
Total
LEVEL OF EDUCATION
High school Apprentice VET qualification
Bachelor degree Masters or higher Refused/Don't know
6%
5%
10%
15%
19%
23%
18%
33%
33%
41%
35%
36%
20%
25%
17%
18%
20%
18%
21%
13%
13%
16%
17%
5%
4%
7%
8%
Dynamo
Gimme
Plodders
Made it
Total
MANAGEMENT ROLE
CEO/MD Senior managementFunctional management First level managementOffice administration/Junior Refused/Don't know
Business Profile
58
Copyright 2009 Australia. Square Holes Pty Ltd and Australian Institute of Management SA
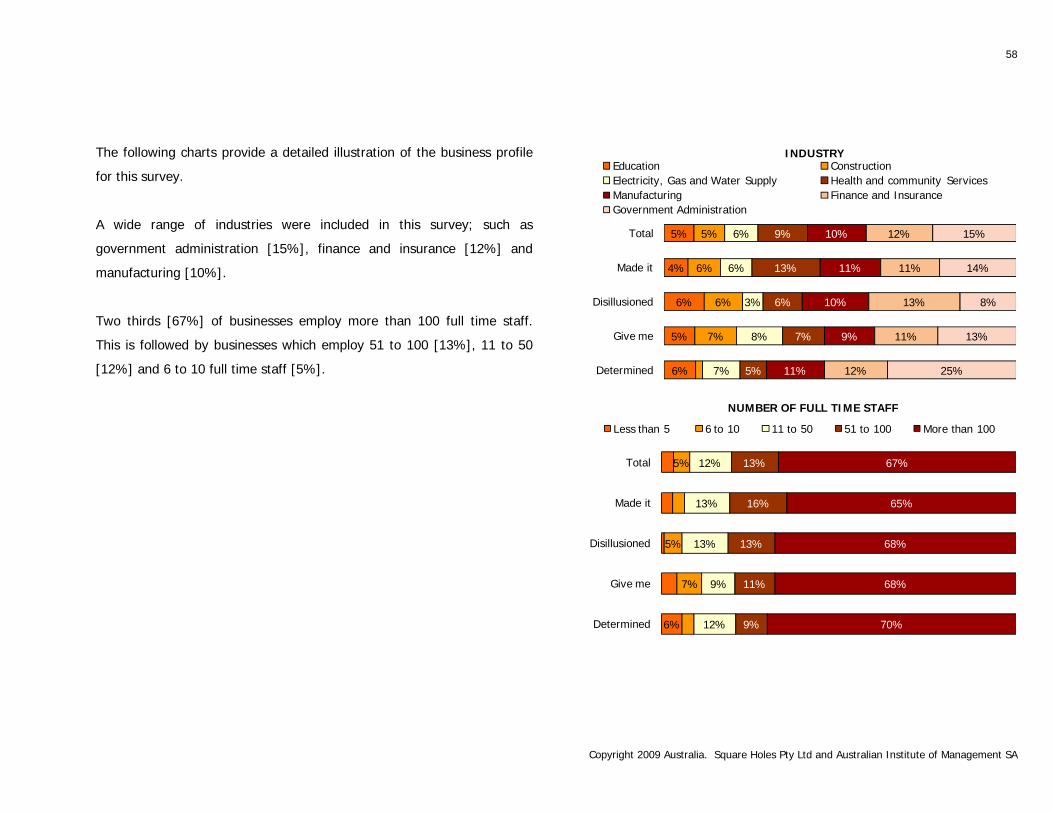
The following charts provide a detailed illustration of the business profile
for this survey.
A wide range of industries were included in this survey; such as
government administration [15%], finance and insurance [12%] and
manufacturing [10%].
Two thirds [67%] of businesses employ more than 100 full time staff.
This is followed by businesses which employ 51 to 100 [13%], 11 to 50
[12%] and 6 to 10 full time staff [5%]. 6%
5%
6%
4%
5%
7%
6%
6%
5%
7%
8%
3%
6%
6%
5%
7%
6%
13%
9%
11%
9%
10%
11%
10%
12%
11%
13%
11%
12%
25%
13%
8%
14%
15%
Determined
Give me
Disillusioned
Made it
Total
INDUSTRYEducation ConstructionElectricity, Gas and Water Supply Health and community Services Manufacturing Finance and Insurance Government Administration
6%
7%
5%
5%
12%
9%
13%
13%
12%
9%
11%
13%
16%
13%
70%
68%
68%
65%
67%
Determined
Give me
Disillusioned
Made it
Total
NUMBER OF FULL TIME STAFF
Less than 5 6 to 10 11 to 50 51 to 100 More than 100
Appendices
Copyright 2009 Australia. Square Holes Pty Ltd and Australian Institute of Management SA
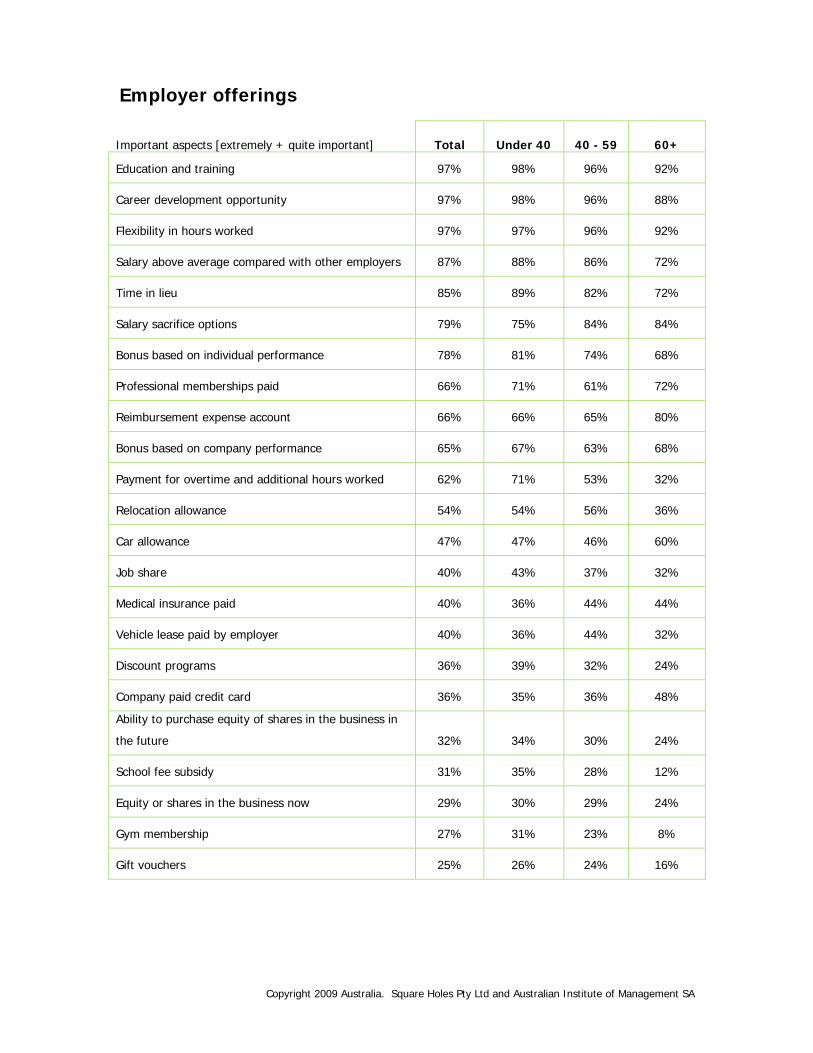
Employer offerings
Important aspects [extremely + quite important] Total Under 40 40 - 59 60+
Education and training 97% 98% 96% 92%
Career development opportunity 97% 98% 96% 88%
Flexibility in hours worked 97% 97% 96% 92%
Salary above average compared with other employers 87% 88% 86% 72%
Time in lieu 85% 89% 82% 72%
Salary sacrifice options 79% 75% 84% 84%
Bonus based on individual performance 78% 81% 74% 68%
Professional memberships paid 66% 71% 61% 72%
Reimbursement expense account 66% 66% 65% 80%
Bonus based on company performance 65% 67% 63% 68%
Payment for overtime and additional hours worked 62% 71% 53% 32%
Relocation allowance 54% 54% 56% 36%
Car allowance 47% 47% 46% 60%
Job share 40% 43% 37% 32%
Medical insurance paid 40% 36% 44% 44%
Vehicle lease paid by employer 40% 36% 44% 32%
Discount programs 36% 39% 32% 24%
Company paid credit card 36% 35% 36% 48%
Ability to purchase equity of shares in the business in
the future 32% 34% 30% 24%
School fee subsidy 31% 35% 28% 12%
Equity or shares in the business now 29% 30% 29% 24%
Gym membership 27% 31% 23% 8%
Gift vouchers 25% 26% 24% 16%
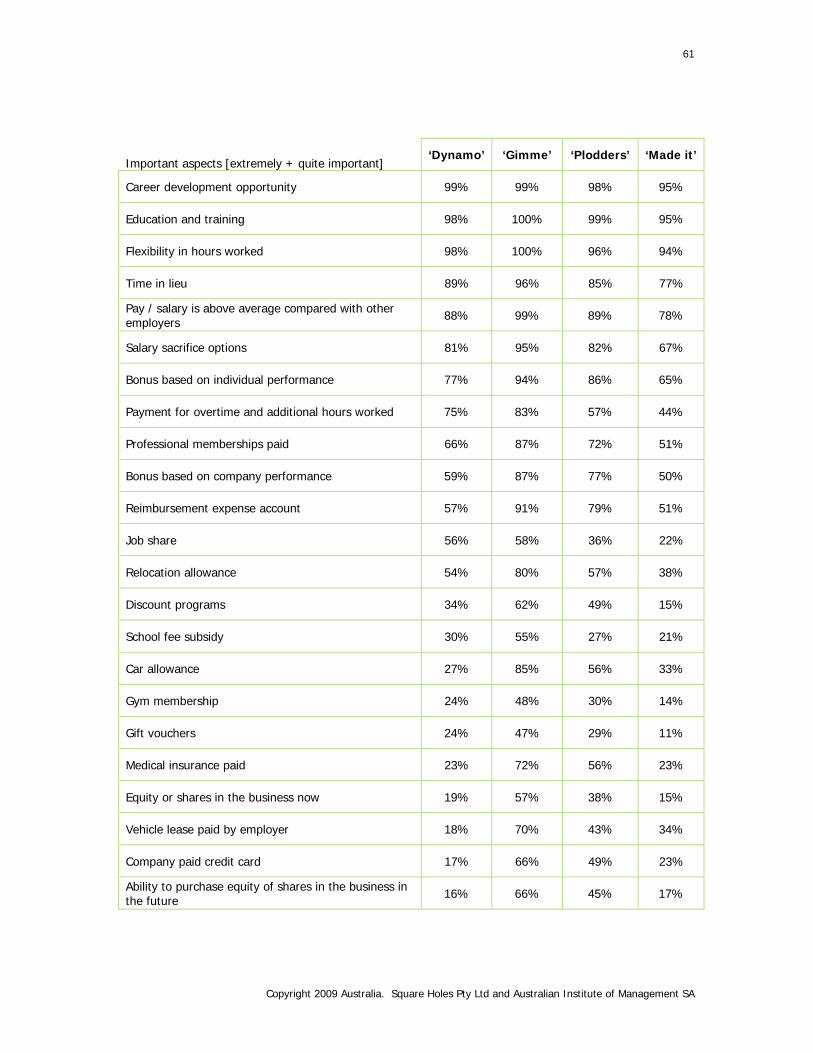
61
Copyright 2009 Australia. Square Holes Pty Ltd and Australian Institute of Management SA
Important aspects [extremely + quite important] ‘Dynamo’ ‘Gimme’ ‘Plodders’ ‘Made it’
Career development opportunity 99% 99% 98% 95%
Education and training 98% 100% 99% 95%
Flexibility in hours worked 98% 100% 96% 94%
Time in lieu 89% 96% 85% 77%
Pay / salary is above average compared with other employers 88% 99% 89% 78%
Salary sacrifice options 81% 95% 82% 67%
Bonus based on individual performance 77% 94% 86% 65%
Payment for overtime and additional hours worked 75% 83% 57% 44%
Professional memberships paid 66% 87% 72% 51%
Bonus based on company performance 59% 87% 77% 50%
Reimbursement expense account 57% 91% 79% 51%
Job share 56% 58% 36% 22%
Relocation allowance 54% 80% 57% 38%
Discount programs 34% 62% 49% 15%
School fee subsidy 30% 55% 27% 21%
Car allowance 27% 85% 56% 33%
Gym membership 24% 48% 30% 14%
Gift vouchers 24% 47% 29% 11%
Medical insurance paid 23% 72% 56% 23%
Equity or shares in the business now 19% 57% 38% 15%
Vehicle lease paid by employer 18% 70% 43% 34%
Company paid credit card 17% 66% 49% 23%
Ability to purchase equity of shares in the business in the future 16% 66% 45% 17%
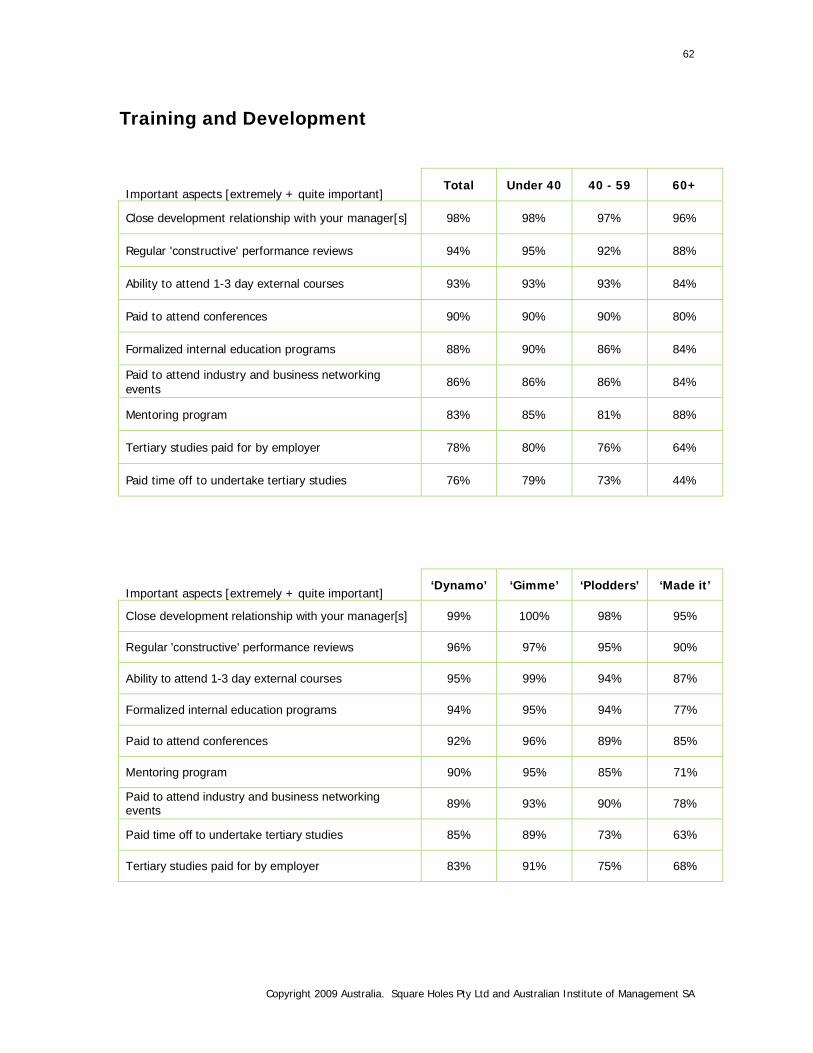
62
Copyright 2009 Australia. Square Holes Pty Ltd and Australian Institute of Management SA
Training and Development
Important aspects [extremely + quite important] Total Under 40 40 - 59 60+
Close development relationship with your manager[s] 98% 98% 97% 96%
Regular 'constructive' performance reviews 94% 95% 92% 88%
Ability to attend 1-3 day external courses 93% 93% 93% 84%
Paid to attend conferences 90% 90% 90% 80%
Formalized internal education programs 88% 90% 86% 84%
Paid to attend industry and business networking events 86% 86% 86% 84%
Mentoring program 83% 85% 81% 88%
Tertiary studies paid for by employer 78% 80% 76% 64%
Paid time off to undertake tertiary studies 76% 79% 73% 44%
Important aspects [extremely + quite important] ‘Dynamo’ ‘Gimme’ ‘Plodders’ ‘Made it’
Close development relationship with your manager[s] 99% 100% 98% 95%
Regular 'constructive' performance reviews 96% 97% 95% 90%
Ability to attend 1-3 day external courses 95% 99% 94% 87%
Formalized internal education programs 94% 95% 94% 77%
Paid to attend conferences 92% 96% 89% 85%
Mentoring program 90% 95% 85% 71%
Paid to attend industry and business networking events 89% 93% 90% 78%
Paid time off to undertake tertiary studies 85% 89% 73% 63%
Tertiary studies paid for by employer 83% 91% 75% 68%
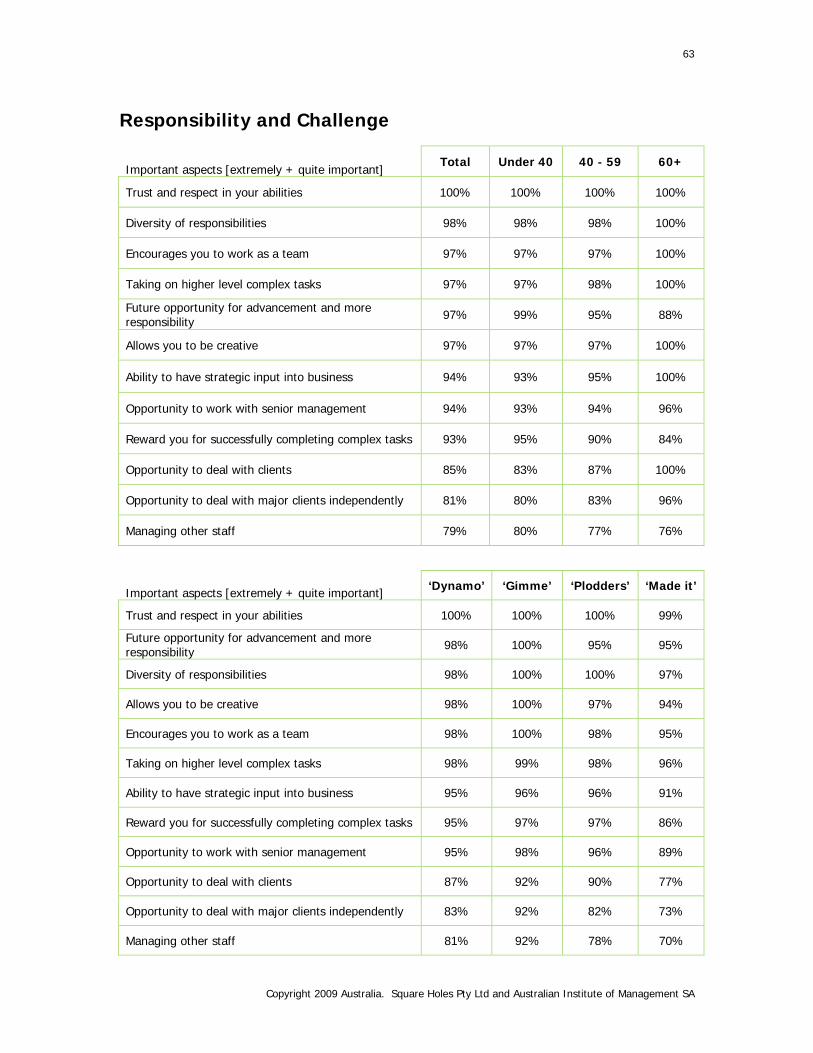
63
Copyright 2009 Australia. Square Holes Pty Ltd and Australian Institute of Management SA
Responsibility and Challenge
Important aspects [extremely + quite important] Total Under 40 40 - 59 60+
Trust and respect in your abilities 100% 100% 100% 100%
Diversity of responsibilities 98% 98% 98% 100%
Encourages you to work as a team 97% 97% 97% 100%
Taking on higher level complex tasks 97% 97% 98% 100%
Future opportunity for advancement and more responsibility 97% 99% 95% 88%
Allows you to be creative 97% 97% 97% 100%
Ability to have strategic input into business 94% 93% 95% 100%
Opportunity to work with senior management 94% 93% 94% 96%
Reward you for successfully completing complex tasks 93% 95% 90% 84%
Opportunity to deal with clients 85% 83% 87% 100%
Opportunity to deal with major clients independently 81% 80% 83% 96%
Managing other staff 79% 80% 77% 76%
Important aspects [extremely + quite important] ‘Dynamo’ ‘Gimme’ ‘Plodders’ ‘Made it’
Trust and respect in your abilities 100% 100% 100% 99%
Future opportunity for advancement and more responsibility 98% 100% 95% 95%
Diversity of responsibilities 98% 100% 100% 97%
Allows you to be creative 98% 100% 97% 94%
Encourages you to work as a team 98% 100% 98% 95%
Taking on higher level complex tasks 98% 99% 98% 96%
Ability to have strategic input into business 95% 96% 96% 91%
Reward you for successfully completing complex tasks 95% 97% 97% 86%
Opportunity to work with senior management 95% 98% 96% 89%
Opportunity to deal with clients 87% 92% 90% 77%
Opportunity to deal with major clients independently 83% 92% 82% 73%
Managing other staff 81% 92% 78% 70%
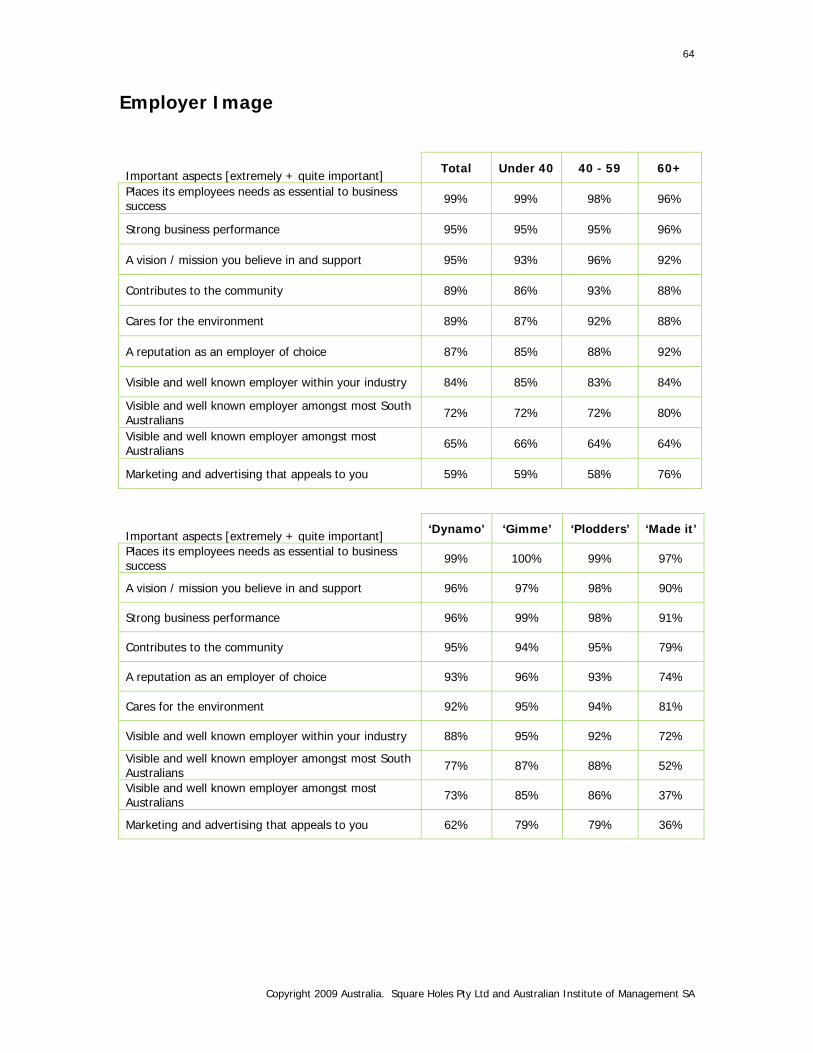
64
Copyright 2009 Australia. Square Holes Pty Ltd and Australian Institute of Management SA
Employer Image
Important aspects [extremely + quite important] Total Under 40 40 - 59 60+
Places its employees needs as essential to business success 99% 99% 98% 96%
Strong business performance 95% 95% 95% 96%
A vision / mission you believe in and support 95% 93% 96% 92%
Contributes to the community 89% 86% 93% 88%
Cares for the environment 89% 87% 92% 88%
A reputation as an employer of choice 87% 85% 88% 92%
Visible and well known employer within your industry 84% 85% 83% 84%
Visible and well known employer amongst most South Australians 72% 72% 72% 80%
Visible and well known employer amongst most Australians 65% 66% 64% 64%
Marketing and advertising that appeals to you 59% 59% 58% 76%
Important aspects [extremely + quite important] ‘Dynamo’ ‘Gimme’ ‘Plodders’ ‘Made it’
Places its employees needs as essential to business success 99% 100% 99% 97%
A vision / mission you believe in and support 96% 97% 98% 90%
Strong business performance 96% 99% 98% 91%
Contributes to the community 95% 94% 95% 79%
A reputation as an employer of choice 93% 96% 93% 74%
Cares for the environment 92% 95% 94% 81%
Visible and well known employer within your industry 88% 95% 92% 72%
Visible and well known employer amongst most South Australians 77% 87% 88% 52%
Visible and well known employer amongst most Australians 73% 85% 86% 37%
Marketing and advertising that appeals to you 62% 79% 79% 36%
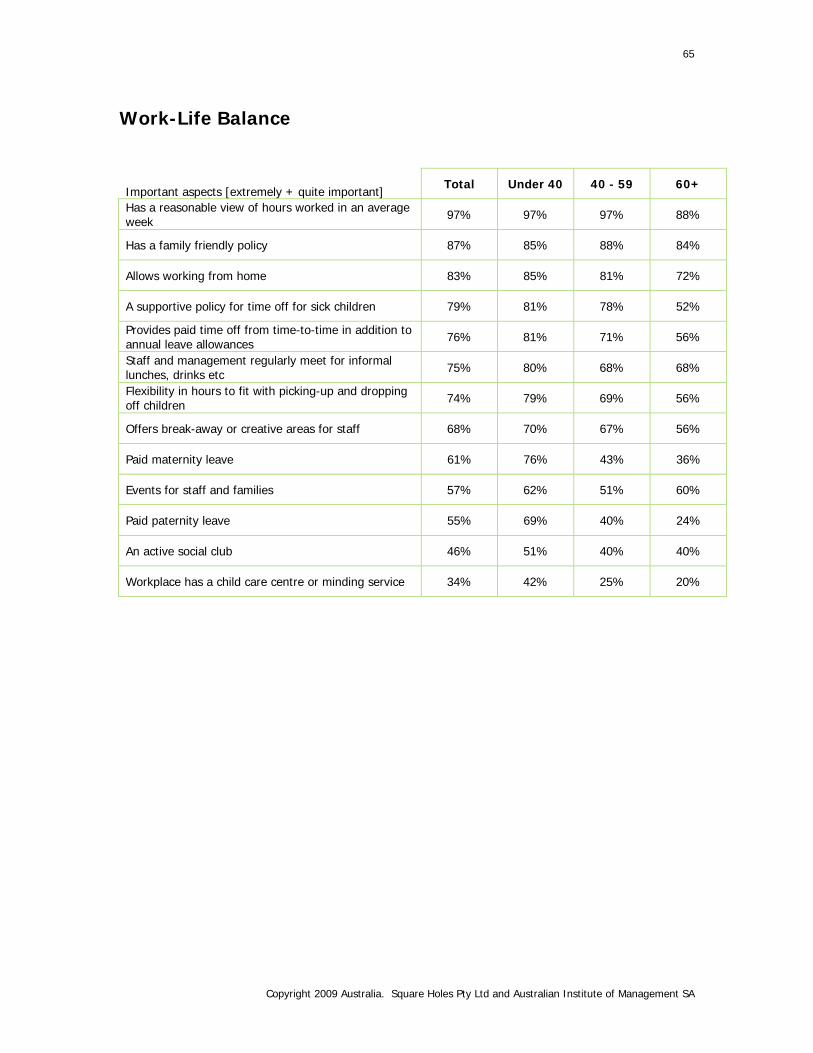
65
Copyright 2009 Australia. Square Holes Pty Ltd and Australian Institute of Management SA
Work-Life Balance
Important aspects [extremely + quite important] Total Under 40 40 - 59 60+
Has a reasonable view of hours worked in an average week 97% 97% 97% 88%
Has a family friendly policy 87% 85% 88% 84%
Allows working from home 83% 85% 81% 72%
A supportive policy for time off for sick children 79% 81% 78% 52%
Provides paid time off from time-to-time in addition to annual leave allowances 76% 81% 71% 56%
Staff and management regularly meet for informal lunches, drinks etc 75% 80% 68% 68%
Flexibility in hours to fit with picking-up and dropping off children 74% 79% 69% 56%
Offers break-away or creative areas for staff 68% 70% 67% 56%
Paid maternity leave 61% 76% 43% 36%
Events for staff and families 57% 62% 51% 60%
Paid paternity leave 55% 69% 40% 24%
An active social club 46% 51% 40% 40%
Workplace has a child care centre or minding service 34% 42% 25% 20%
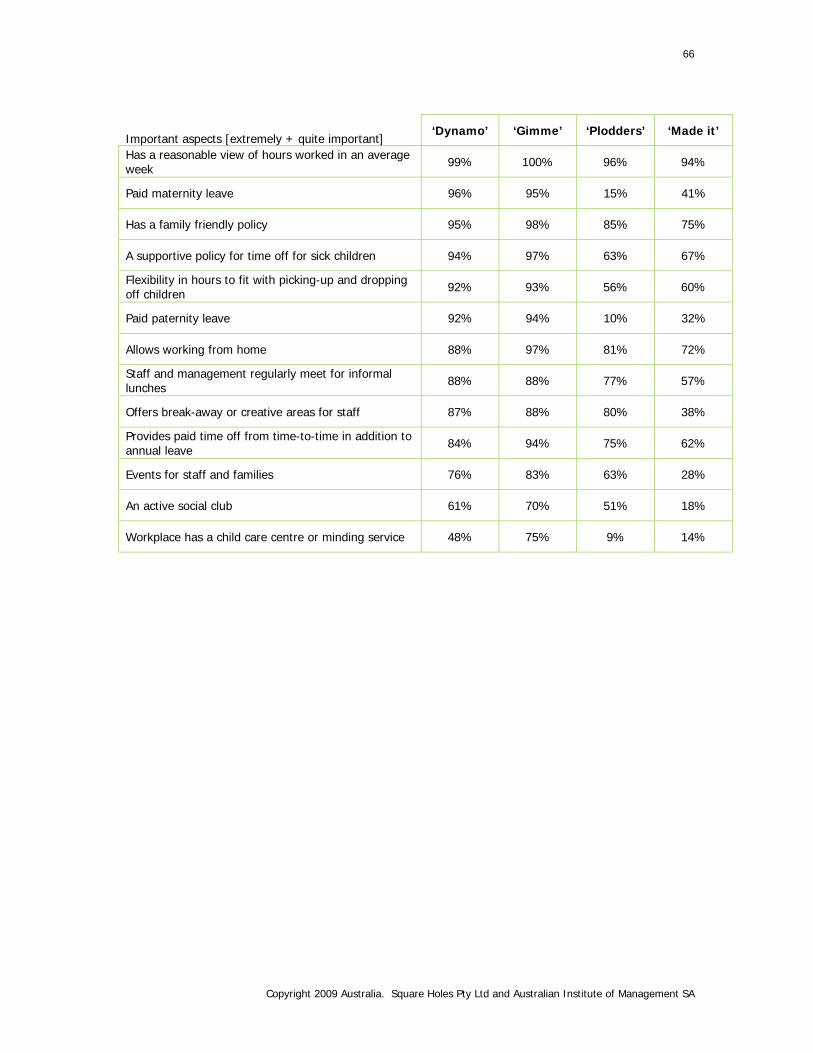
66
Copyright 2009 Australia. Square Holes Pty Ltd and Australian Institute of Management SA
Important aspects [extremely + quite important] ‘Dynamo’ ‘Gimme’ ‘Plodders’ ‘Made it’
Has a reasonable view of hours worked in an average week 99% 100% 96% 94%
Paid maternity leave 96% 95% 15% 41%
Has a family friendly policy 95% 98% 85% 75%
A supportive policy for time off for sick children 94% 97% 63% 67%
Flexibility in hours to fit with picking-up and dropping off children 92% 93% 56% 60%
Paid paternity leave 92% 94% 10% 32%
Allows working from home 88% 97% 81% 72%
Staff and management regularly meet for informal lunches 88% 88% 77% 57%
Offers break-away or creative areas for staff 87% 88% 80% 38%
Provides paid time off from time-to-time in addition to annual leave 84% 94% 75% 62%
Events for staff and families 76% 83% 63% 28%
An active social club 61% 70% 51% 18%
Workplace has a child care centre or minding service 48% 75% 9% 14%
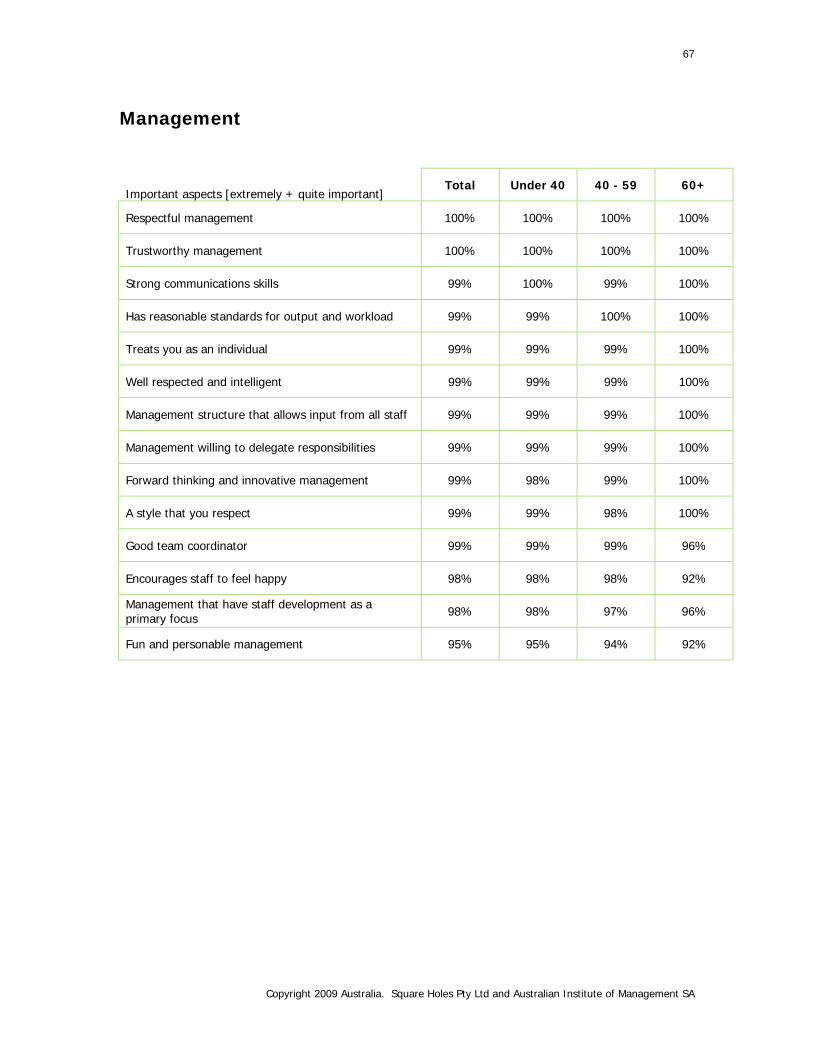
67
Copyright 2009 Australia. Square Holes Pty Ltd and Australian Institute of Management SA
Management
Important aspects [extremely + quite important] Total Under 40 40 - 59 60+
Respectful management 100% 100% 100% 100%
Trustworthy management 100% 100% 100% 100%
Strong communications skills 99% 100% 99% 100%
Has reasonable standards for output and workload 99% 99% 100% 100%
Treats you as an individual 99% 99% 99% 100%
Well respected and intelligent 99% 99% 99% 100%
Management structure that allows input from all staff 99% 99% 99% 100%
Management willing to delegate responsibilities 99% 99% 99% 100%
Forward thinking and innovative management 99% 98% 99% 100%
A style that you respect 99% 99% 98% 100%
Good team coordinator 99% 99% 99% 96%
Encourages staff to feel happy 98% 98% 98% 92%
Management that have staff development as a primary focus 98% 98% 97% 96%
Fun and personable management 95% 95% 94% 92%
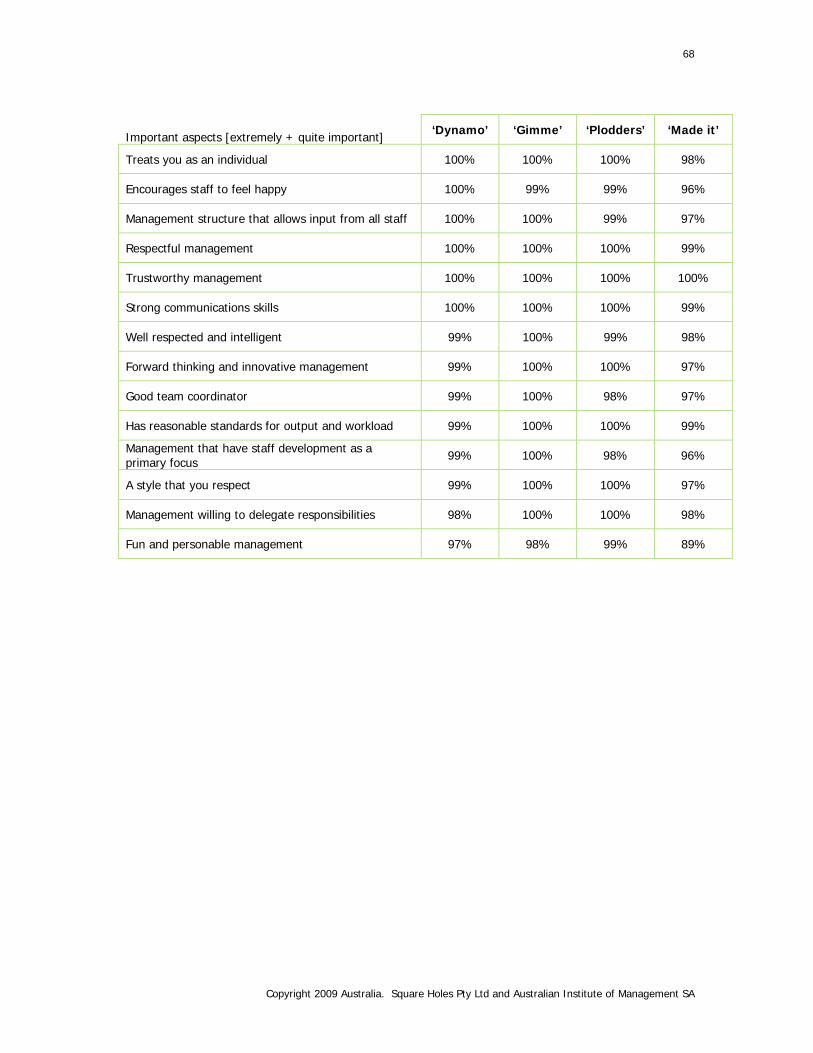
68
Copyright 2009 Australia. Square Holes Pty Ltd and Australian Institute of Management SA
Important aspects [extremely + quite important] ‘Dynamo’ ‘Gimme’ ‘Plodders’ ‘Made it’
Treats you as an individual 100% 100% 100% 98%
Encourages staff to feel happy 100% 99% 99% 96%
Management structure that allows input from all staff 100% 100% 99% 97%
Respectful management 100% 100% 100% 99%
Trustworthy management 100% 100% 100% 100%
Strong communications skills 100% 100% 100% 99%
Well respected and intelligent 99% 100% 99% 98%
Forward thinking and innovative management 99% 100% 100% 97%
Good team coordinator 99% 100% 98% 97%
Has reasonable standards for output and workload 99% 100% 100% 99%
Management that have staff development as a primary focus 99% 100% 98% 96%
A style that you respect 99% 100% 100% 97%
Management willing to delegate responsibilities 98% 100% 100% 98%
Fun and personable management 97% 98% 99% 89%
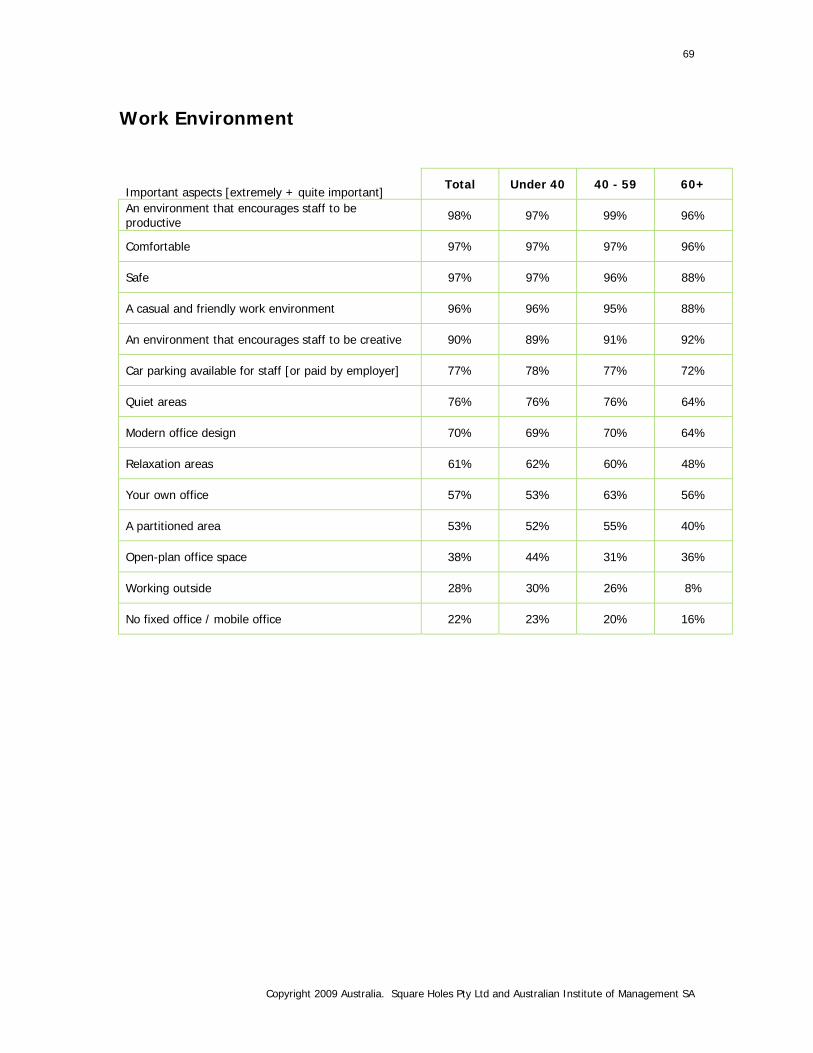
69
Copyright 2009 Australia. Square Holes Pty Ltd and Australian Institute of Management SA
Work Environment
Important aspects [extremely + quite important] Total Under 40 40 - 59 60+
An environment that encourages staff to be productive 98% 97% 99% 96%
Comfortable 97% 97% 97% 96%
Safe 97% 97% 96% 88%
A casual and friendly work environment 96% 96% 95% 88%
An environment that encourages staff to be creative 90% 89% 91% 92%
Car parking available for staff [or paid by employer] 77% 78% 77% 72%
Quiet areas 76% 76% 76% 64%
Modern office design 70% 69% 70% 64%
Relaxation areas 61% 62% 60% 48%
Your own office 57% 53% 63% 56%
A partitioned area 53% 52% 55% 40%
Open-plan office space 38% 44% 31% 36%
Working outside 28% 30% 26% 8%
No fixed office / mobile office 22% 23% 20% 16%
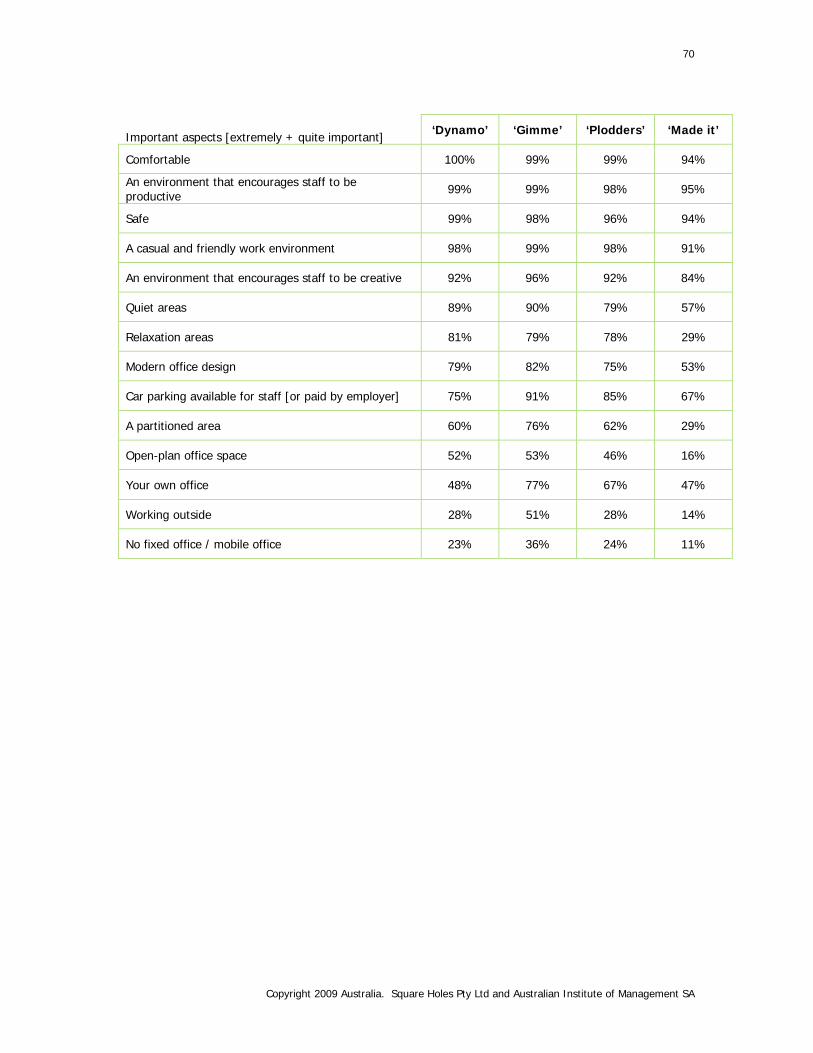
70
Copyright 2009 Australia. Square Holes Pty Ltd and Australian Institute of Management SA
Important aspects [extremely + quite important] ‘Dynamo’ ‘Gimme’ ‘Plodders’ ‘Made it’
Comfortable 100% 99% 99% 94%
An environment that encourages staff to be productive 99% 99% 98% 95%
Safe 99% 98% 96% 94%
A casual and friendly work environment 98% 99% 98% 91%
An environment that encourages staff to be creative 92% 96% 92% 84%
Quiet areas 89% 90% 79% 57%
Relaxation areas 81% 79% 78% 29%
Modern office design 79% 82% 75% 53%
Car parking available for staff [or paid by employer] 75% 91% 85% 67%
A partitioned area 60% 76% 62% 29%
Open-plan office space 52% 53% 46% 16%
Your own office 48% 77% 67% 47%
Working outside 28% 51% 28% 14%
No fixed office / mobile office 23% 36% 24% 11%
71
Copyright 2009 Australia. Square Holes Pty Ltd and Australian Institute of Management SA
Methodology
A total of 1053 online surveys were completed by employees. The
online questionnaire was formulated and launched from the Square
Holes facility on Regent Street North in Adelaide in March 2009. The
approach was identical to that of the SA Great, AIM ‘retention study’
in 2007, which was conducted to research the attitudes and needs of
younger workers.
The questionnaire was based on exploring broader issues in relation
to the needs of differing groups of workers. Issues explored include
age, demographic difference and how employers can work towards
creating a harmonious work team.
Following collection of the data, cross tabulations and cluster
analysis were produced using the statistical package SPSS.
Cluster analysis is a statistical technique used to segment the
sample. For scientific details of cluster analysis, refer to the website
http://www.statsoft.com/textbook/glosfra.html. The website explains
the technique...
“Cluster analysis is an exploratory data analysis tool which aims
at sorting different objects into groups in a way that the degree
of association between two objects is maximal if they belong to
the same group and minimal otherwise.”
This report summarises the findings of the total sample and each of
the four clusters identified.
72
Copyright 2009 Australia. Square Holes Pty Ltd and Australian Institute of Management SA
Confidence interval
Figures throughout this report are subject to a confidence interval.
The margin of error for this study is +/- 3%, as the sample is 1053.
For example, if 50% of the population sample [n=200] gave a response, the actual confidence interval would be between 43% and 57%. Movements
beyond this are statistically significant.
73
Copyright 2009 Australia. Square Holes Pty Ltd and Australian Institute of Management SA
About Square Holes Square Holes is a
progressive market
research agency with a
passion for supporting
great branding,
advertising and
digital. We provide
‘illumination’,
‘testing’ and
‘monitoring’ based on solid and reliable evidence and
marketing intelligence using surveys, focus groups and
other methods of gathering insights.
Branding: we love emotive brands. Not logos or nice
names, but ‘brands’ with heart and soul. Brands that spark
emotions and underpin consumer identity. A cult-like
connection. Square Holes has a passion for supporting
emotive brands.
Advertising: we love inspiring advertising. The big
problem is inspiring advertising is rare. Way too much
advertising is mediocre or even pointless. Consumers are
inspired by advertising with imagination. Square Holes has
a passion for supporting inspiring advertising.
Digital: we love empowering digital media. It is not about
talking to. It is about engaging with. You do not have a
captive audience. Digital media is largely confused and
misguided. Imagination is essential. Square Holes has
passion for supporting empowering digital media.
Why Square Holes?
1. We are passionate about being the strategic
voice of consumers [not commodity or factory
researchers]
2. We are specialists in branding, advertising
and digital media [not generalists]
3. We are creative in our approach to research,
staff and outputs [not the same as other
research firms]
4. We are solid in the evidence we collect to
support our consulting [not guided by
unsubstantiated opinions or advice]
5. We attract the best clients and staff
6. We are the best at what we do
7. We understand our clients
8. We provide professional service
Research: We do awesome market research. Great
research is rare. Not all research is equal. It is typically
without vision or imagination. Research is about
empathising with consumers, observing and truly hearing
and engaging with their opinions.
Insight: We provide great insight. Consumer insight
does not have an on-off switch. It should be continuous,
agile and proactive. What was hip a few months ago may
now be passé. What was never possible is now an
opportunity. Success is about being the best not one of the
best.
Engagement: We engage with consumers. We
empower and embrace consumers. Powerful engagement
tools, video, digital media, social networking… The new
consumer is about ‘me’.
Consulting: We are the voice of consumers. Our
mandate is to keep things real. To cut the bullshit. Allow a
window into the consumers’ truth. Tens of thousands of
consumers talk to us every year about brands, advertising
and digital media. Our team are in-tune with consumer
trends, media and culture.
Passion: Square Holes has a passion for research to
inspire creativity allow clarity and support commitment.
Square Holes a passion for partnering with clients to inspire
creativity allow clarity and support commitment.
Square Holes has a passion for engaging consumers, to
inspire creativity allow clarity and support commitment.
Square Holes has a passion for guiding clients to inspire
creativity allow clarity and support commitment.
Copyright 2009 Australia. Square Holes Pty Ltd and Australian Institute of Management SA
Questionnaire
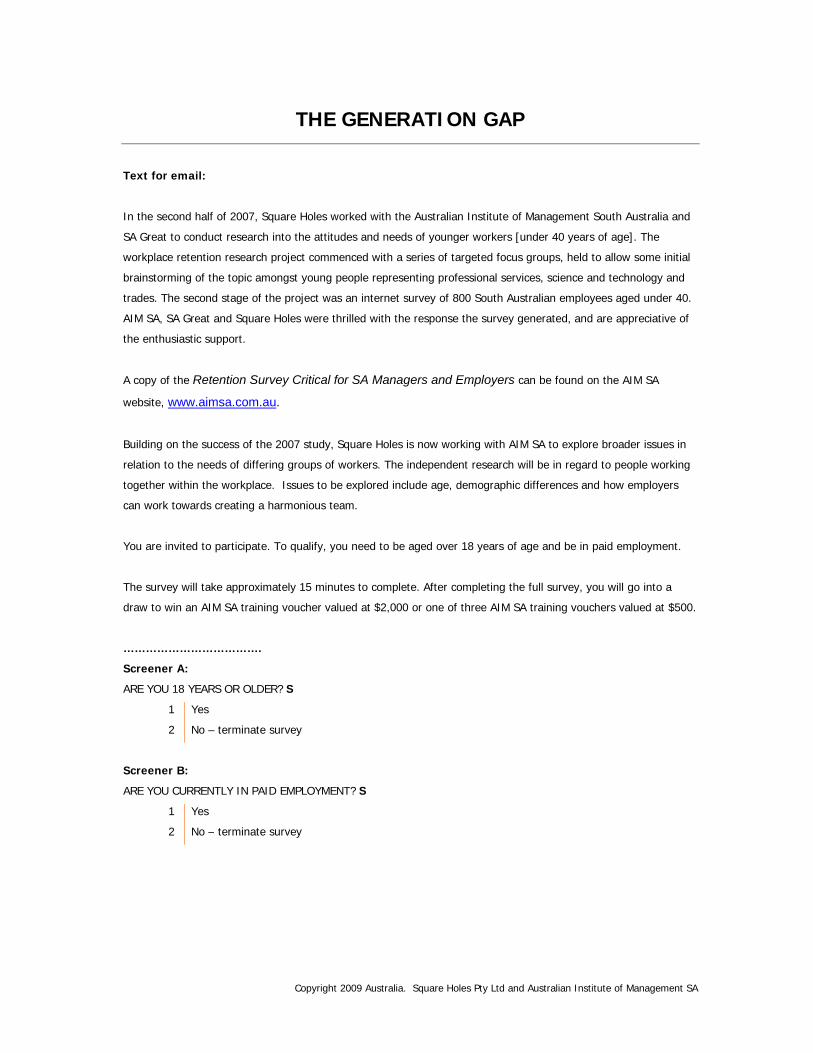
Copyright 2009 Australia. Square Holes Pty Ltd and Australian Institute of Management SA
THE GENERATION GAP
Text for email:
In the second half of 2007, Square Holes worked with the Australian Institute of Management South Australia and
SA Great to conduct research into the attitudes and needs of younger workers [under 40 years of age]. The
workplace retention research project commenced with a series of targeted focus groups, held to allow some initial
brainstorming of the topic amongst young people representing professional services, science and technology and
trades. The second stage of the project was an internet survey of 800 South Australian employees aged under 40.
AIM SA, SA Great and Square Holes were thrilled with the response the survey generated, and are appreciative of
the enthusiastic support.
A copy of the Retention Survey Critical for SA Managers and Employers can be found on the AIM SA
website, www.aimsa.com.au.
Building on the success of the 2007 study, Square Holes is now working with AIM SA to explore broader issues in
relation to the needs of differing groups of workers. The independent research will be in regard to people working
together within the workplace. Issues to be explored include age, demographic differences and how employers
can work towards creating a harmonious team.
You are invited to participate. To qualify, you need to be aged over 18 years of age and be in paid employment.
The survey will take approximately 15 minutes to complete. After completing the full survey, you will go into a
draw to win an AIM SA training voucher valued at $2,000 or one of three AIM SA training vouchers valued at $500.
……………………………….
Screener A:
ARE YOU 18 YEARS OR OLDER? S
1 Yes
2 No – terminate survey
Screener B:
ARE YOU CURRENTLY IN PAID EMPLOYMENT? S
1 Yes
2 No – terminate survey
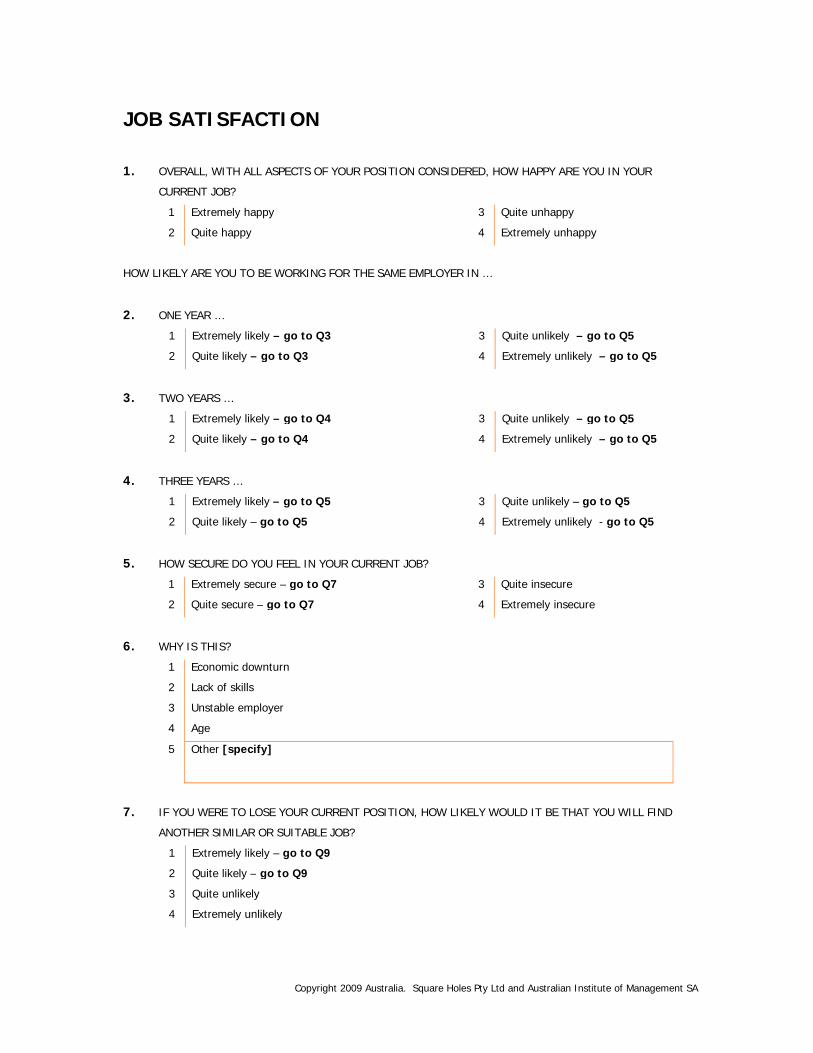
Copyright 2009 Australia. Square Holes Pty Ltd and Australian Institute of Management SA
JOB SATISFACTION
1. OVERALL, WITH ALL ASPECTS OF YOUR POSITION CONSIDERED, HOW HAPPY ARE YOU IN YOUR
CURRENT JOB?
1 Extremely happy
2 Quite happy
3 Quite unhappy
4 Extremely unhappy
HOW LIKELY ARE YOU TO BE WORKING FOR THE SAME EMPLOYER IN …
2. ONE YEAR …
1 Extremely likely – go to Q3
2 Quite likely – go to Q3
3 Quite unlikely – go to Q5
4 Extremely unlikely – go to Q5
3. TWO YEARS …
1 Extremely likely – go to Q4
2 Quite likely – go to Q4
3 Quite unlikely – go to Q5
4 Extremely unlikely – go to Q5
4. THREE YEARS …
1 Extremely likely – go to Q5
2 Quite likely – go to Q5
3 Quite unlikely – go to Q5
4 Extremely unlikely - go to Q5
5. HOW SECURE DO YOU FEEL IN YOUR CURRENT JOB?
1 Extremely secure – go to Q7
2 Quite secure – go to Q7
3 Quite insecure
4 Extremely insecure
6. WHY IS THIS?
1 Economic downturn
2 Lack of skills
3 Unstable employer
4 Age
5 Other [specify]
7. IF YOU WERE TO LOSE YOUR CURRENT POSITION, HOW LIKELY WOULD IT BE THAT YOU WILL FIND
ANOTHER SIMILAR OR SUITABLE JOB?
1 Extremely likely – go to Q9
2 Quite likely – go to Q9
3 Quite unlikely
4 Extremely unlikely
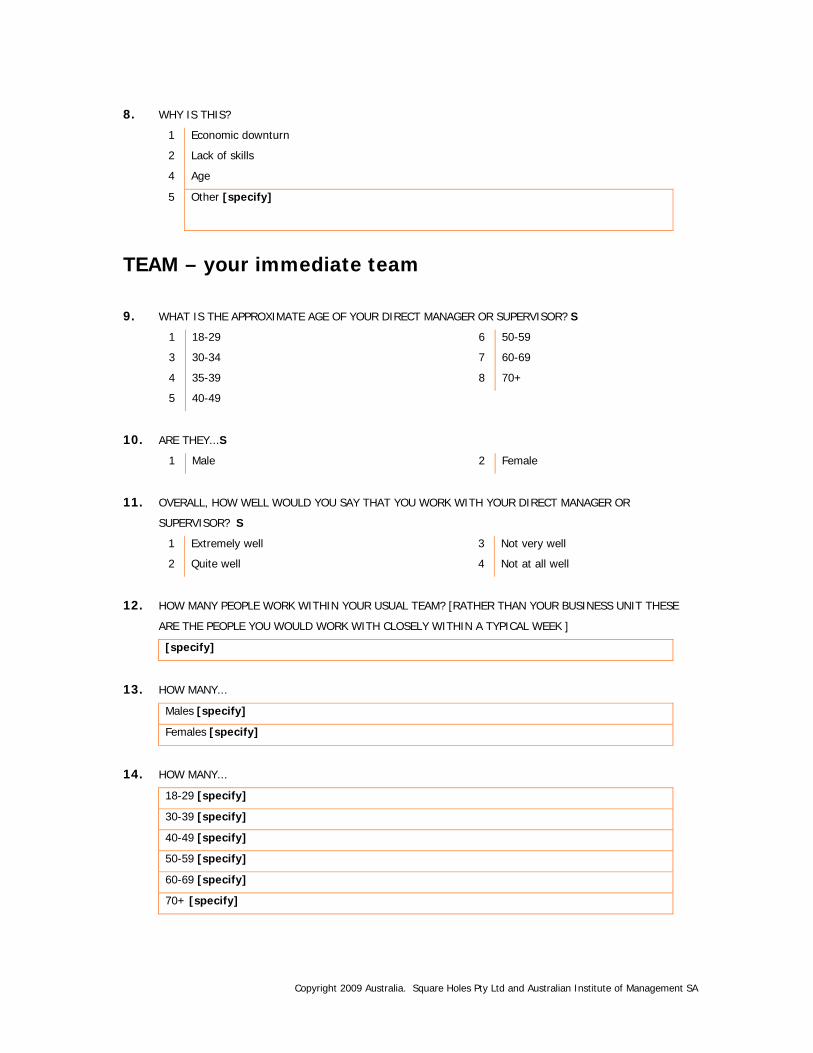
Copyright 2009 Australia. Square Holes Pty Ltd and Australian Institute of Management SA
8. WHY IS THIS?
1 Economic downturn
2 Lack of skills
4 Age
5 Other [specify]
TEAM – your immediate team
9. WHAT IS THE APPROXIMATE AGE OF YOUR DIRECT MANAGER OR SUPERVISOR? S
1 18-29
3 30-34
4 35-39
5 40-49
6 50-59
7 60-69
8 70+
10. ARE THEY...S
1 Male 2 Female
11. OVERALL, HOW WELL WOULD YOU SAY THAT YOU WORK WITH YOUR DIRECT MANAGER OR
SUPERVISOR? S
1 Extremely well
2 Quite well
3 Not very well
4 Not at all well
12. HOW MANY PEOPLE WORK WITHIN YOUR USUAL TEAM? [RATHER THAN YOUR BUSINESS UNIT THESE
ARE THE PEOPLE YOU WOULD WORK WITH CLOSELY WITHIN A TYPICAL WEEK ]
[specify]
13. HOW MANY...
Males [specify]
Females [specify]
14. HOW MANY...
18-29 [specify]
30-39 [specify]
40-49 [specify]
50-59 [specify]
60-69 [specify]
70+ [specify]
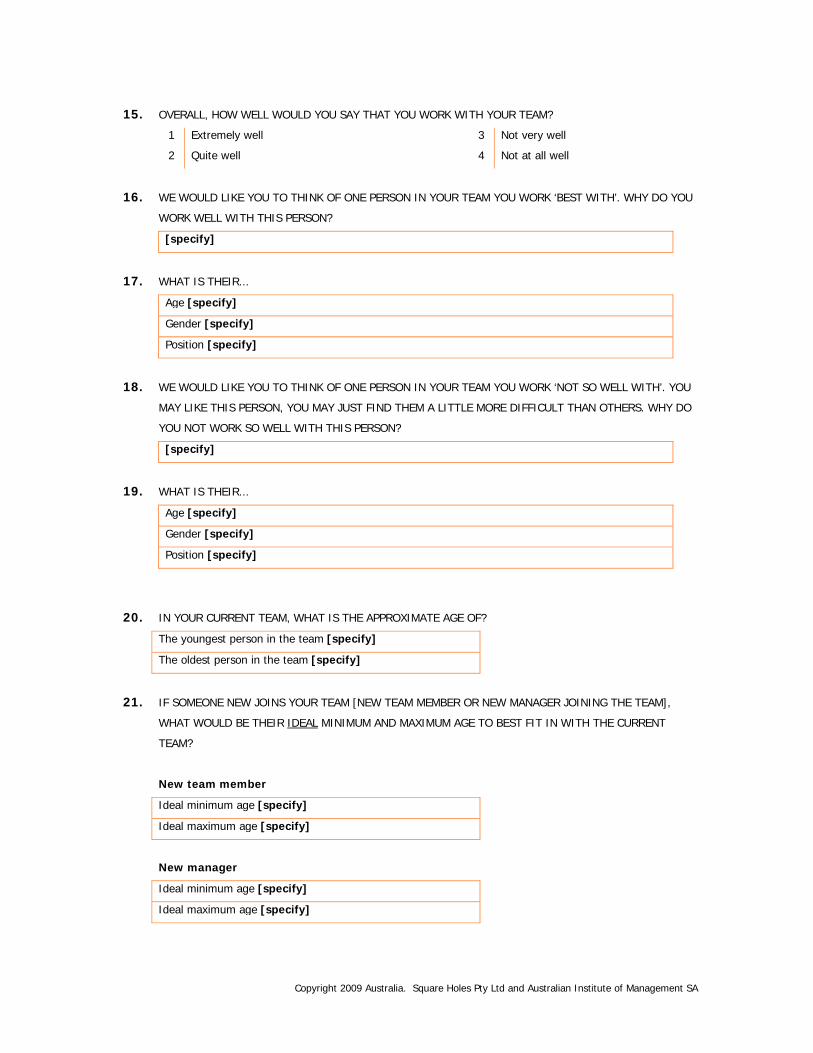
Copyright 2009 Australia. Square Holes Pty Ltd and Australian Institute of Management SA
15. OVERALL, HOW WELL WOULD YOU SAY THAT YOU WORK WITH YOUR TEAM?
1 Extremely well
2 Quite well
3 Not very well
4 Not at all well
16. WE WOULD LIKE YOU TO THINK OF ONE PERSON IN YOUR TEAM YOU WORK ‘BEST WITH’. WHY DO YOU
WORK WELL WITH THIS PERSON?
[specify]
17. WHAT IS THEIR...
Age [specify]
Gender [specify]
Position [specify]
18. WE WOULD LIKE YOU TO THINK OF ONE PERSON IN YOUR TEAM YOU WORK ‘NOT SO WELL WITH’. YOU
MAY LIKE THIS PERSON, YOU MAY JUST FIND THEM A LITTLE MORE DIFFICULT THAN OTHERS. WHY DO
YOU NOT WORK SO WELL WITH THIS PERSON?
[specify]
19. WHAT IS THEIR...
Age [specify]
Gender [specify]
Position [specify]
20. IN YOUR CURRENT TEAM, WHAT IS THE APPROXIMATE AGE OF?
The youngest person in the team [specify]
The oldest person in the team [specify]
21. IF SOMEONE NEW JOINS YOUR TEAM [NEW TEAM MEMBER OR NEW MANAGER JOINING THE TEAM],
WHAT WOULD BE THEIR IDEAL MINIMUM AND MAXIMUM AGE TO BEST FIT IN WITH THE CURRENT
TEAM?
New team member
Ideal minimum age [specify]
Ideal maximum age [specify]
New manager
Ideal minimum age [specify]
Ideal maximum age [specify]
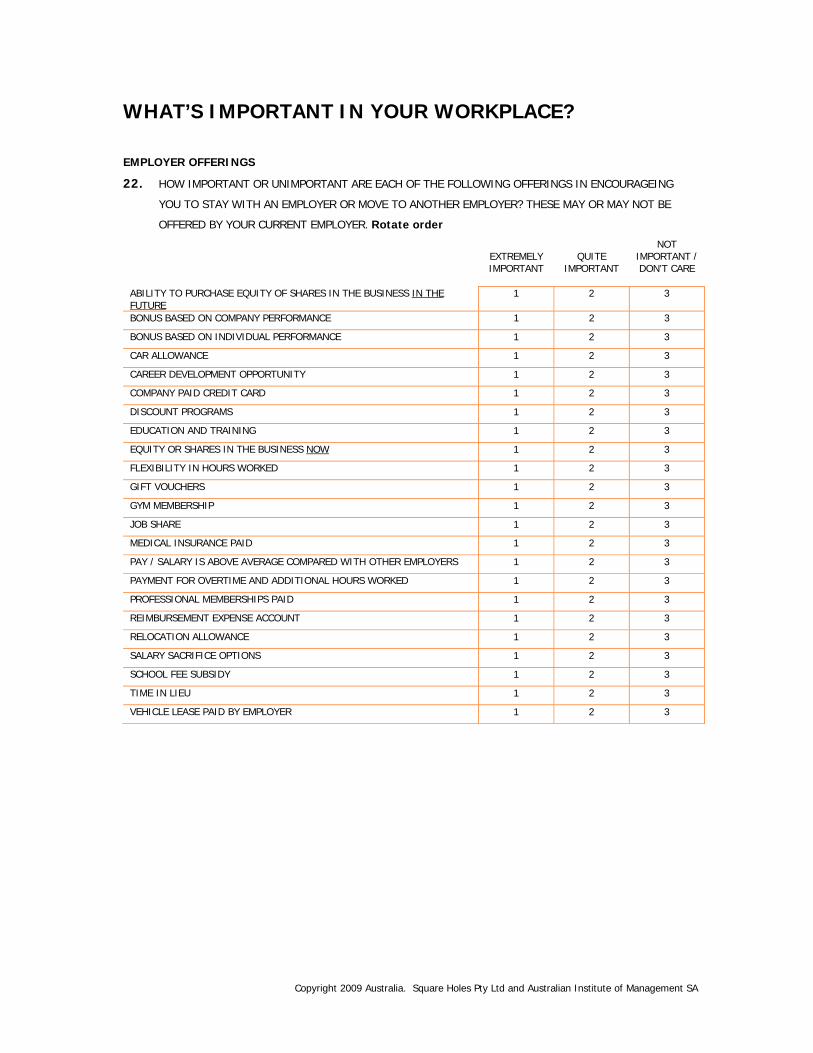
Copyright 2009 Australia. Square Holes Pty Ltd and Australian Institute of Management SA
WHAT’S IMPORTANT IN YOUR WORKPLACE?
EMPLOYER OFFERINGS
22. HOW IMPORTANT OR UNIMPORTANT ARE EACH OF THE FOLLOWING OFFERINGS IN ENCOURAGEING
YOU TO STAY WITH AN EMPLOYER OR MOVE TO ANOTHER EMPLOYER? THESE MAY OR MAY NOT BE
OFFERED BY YOUR CURRENT EMPLOYER. Rotate order
EXTREMELY IMPORTANT
QUITE IMPORTANT
NOT IMPORTANT / DON’T CARE
ABILITY TO PURCHASE EQUITY OF SHARES IN THE BUSINESS IN THE FUTURE
1 2 3
BONUS BASED ON COMPANY PERFORMANCE 1 2 3
BONUS BASED ON INDIVIDUAL PERFORMANCE 1 2 3
CAR ALLOWANCE 1 2 3
CAREER DEVELOPMENT OPPORTUNITY 1 2 3
COMPANY PAID CREDIT CARD 1 2 3
DISCOUNT PROGRAMS 1 2 3
EDUCATION AND TRAINING 1 2 3
EQUITY OR SHARES IN THE BUSINESS NOW 1 2 3
FLEXIBILITY IN HOURS WORKED 1 2 3
GIFT VOUCHERS 1 2 3
GYM MEMBERSHIP 1 2 3
JOB SHARE 1 2 3
MEDICAL INSURANCE PAID 1 2 3
PAY / SALARY IS ABOVE AVERAGE COMPARED WITH OTHER EMPLOYERS 1 2 3
PAYMENT FOR OVERTIME AND ADDITIONAL HOURS WORKED 1 2 3
PROFESSIONAL MEMBERSHIPS PAID 1 2 3
REIMBURSEMENT EXPENSE ACCOUNT 1 2 3
RELOCATION ALLOWANCE 1 2 3
SALARY SACRIFICE OPTIONS 1 2 3
SCHOOL FEE SUBSIDY 1 2 3
TIME IN LIEU 1 2 3
VEHICLE LEASE PAID BY EMPLOYER 1 2 3
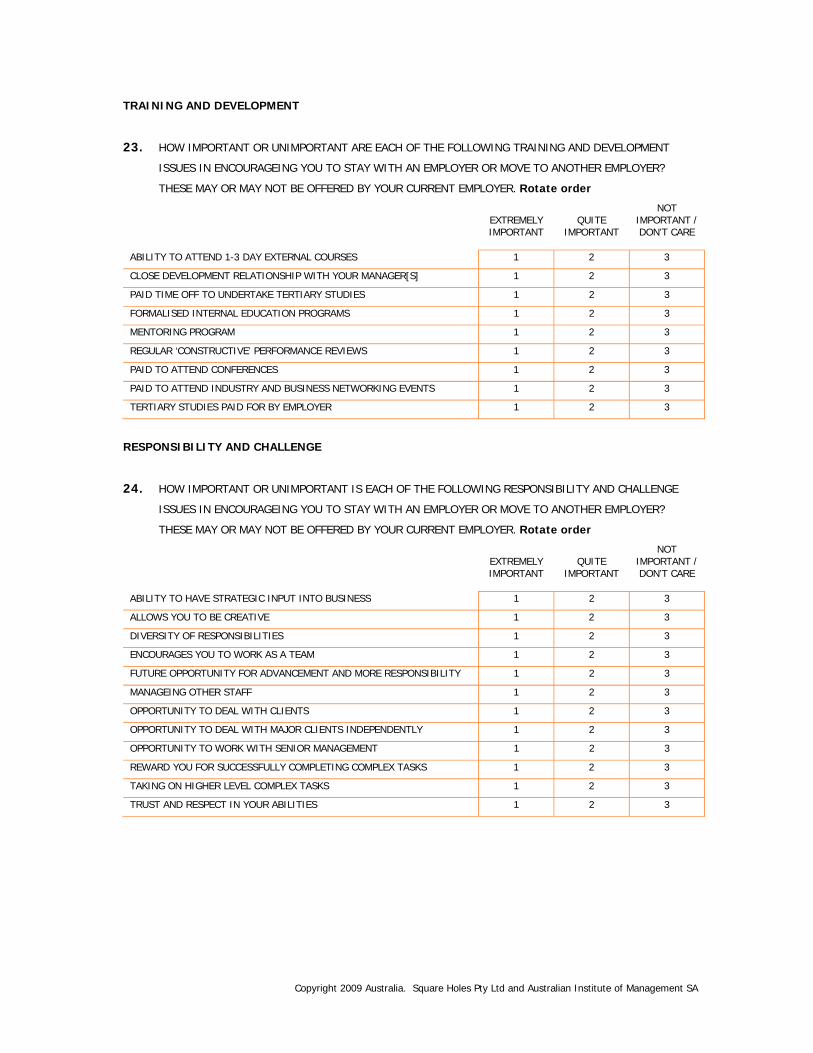
Copyright 2009 Australia. Square Holes Pty Ltd and Australian Institute of Management SA
TRAINING AND DEVELOPMENT
23. HOW IMPORTANT OR UNIMPORTANT ARE EACH OF THE FOLLOWING TRAINING AND DEVELOPMENT
ISSUES IN ENCOURAGEING YOU TO STAY WITH AN EMPLOYER OR MOVE TO ANOTHER EMPLOYER?
THESE MAY OR MAY NOT BE OFFERED BY YOUR CURRENT EMPLOYER. Rotate order
EXTREMELY IMPORTANT
QUITE IMPORTANT
NOT IMPORTANT / DON’T CARE
ABILITY TO ATTEND 1-3 DAY EXTERNAL COURSES 1 2 3
CLOSE DEVELOPMENT RELATIONSHIP WITH YOUR MANAGER[S] 1 2 3
PAID TIME OFF TO UNDERTAKE TERTIARY STUDIES 1 2 3
FORMALISED INTERNAL EDUCATION PROGRAMS 1 2 3
MENTORING PROGRAM 1 2 3
REGULAR ‘CONSTRUCTIVE’ PERFORMANCE REVIEWS 1 2 3
PAID TO ATTEND CONFERENCES 1 2 3
PAID TO ATTEND INDUSTRY AND BUSINESS NETWORKING EVENTS 1 2 3
TERTIARY STUDIES PAID FOR BY EMPLOYER 1 2 3
RESPONSIBILITY AND CHALLENGE
24. HOW IMPORTANT OR UNIMPORTANT IS EACH OF THE FOLLOWING RESPONSIBILITY AND CHALLENGE
ISSUES IN ENCOURAGEING YOU TO STAY WITH AN EMPLOYER OR MOVE TO ANOTHER EMPLOYER?
THESE MAY OR MAY NOT BE OFFERED BY YOUR CURRENT EMPLOYER. Rotate order
EXTREMELY IMPORTANT
QUITE IMPORTANT
NOT IMPORTANT / DON’T CARE
ABILITY TO HAVE STRATEGIC INPUT INTO BUSINESS 1 2 3
ALLOWS YOU TO BE CREATIVE 1 2 3
DIVERSITY OF RESPONSIBILITIES 1 2 3
ENCOURAGES YOU TO WORK AS A TEAM 1 2 3
FUTURE OPPORTUNITY FOR ADVANCEMENT AND MORE RESPONSIBILITY 1 2 3
MANAGEING OTHER STAFF 1 2 3
OPPORTUNITY TO DEAL WITH CLIENTS 1 2 3
OPPORTUNITY TO DEAL WITH MAJOR CLIENTS INDEPENDENTLY 1 2 3
OPPORTUNITY TO WORK WITH SENIOR MANAGEMENT 1 2 3
REWARD YOU FOR SUCCESSFULLY COMPLETING COMPLEX TASKS 1 2 3
TAKING ON HIGHER LEVEL COMPLEX TASKS 1 2 3
TRUST AND RESPECT IN YOUR ABILITIES 1 2 3
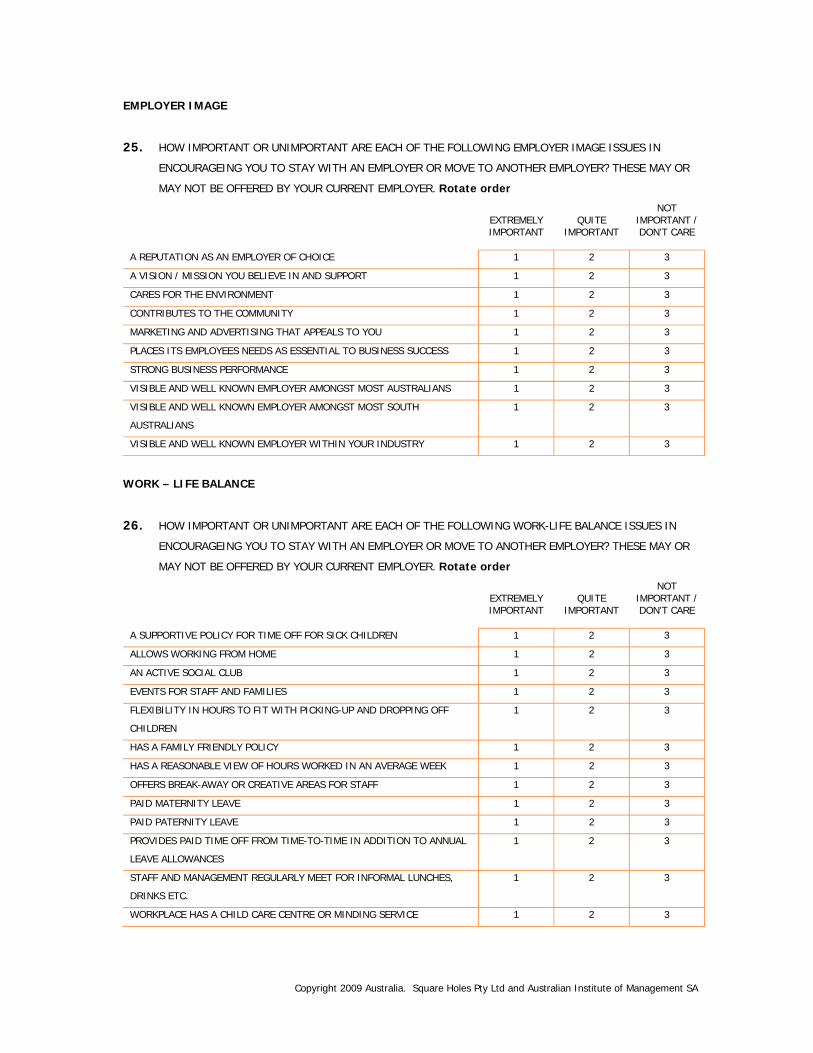
Copyright 2009 Australia. Square Holes Pty Ltd and Australian Institute of Management SA
EMPLOYER IMAGE
25. HOW IMPORTANT OR UNIMPORTANT ARE EACH OF THE FOLLOWING EMPLOYER IMAGE ISSUES IN
ENCOURAGEING YOU TO STAY WITH AN EMPLOYER OR MOVE TO ANOTHER EMPLOYER? THESE MAY OR
MAY NOT BE OFFERED BY YOUR CURRENT EMPLOYER. Rotate order
EXTREMELY IMPORTANT
QUITE IMPORTANT
NOT IMPORTANT / DON’T CARE
A REPUTATION AS AN EMPLOYER OF CHOICE 1 2 3
A VISION / MISSION YOU BELIEVE IN AND SUPPORT 1 2 3
CARES FOR THE ENVIRONMENT 1 2 3
CONTRIBUTES TO THE COMMUNITY 1 2 3
MARKETING AND ADVERTISING THAT APPEALS TO YOU 1 2 3
PLACES ITS EMPLOYEES NEEDS AS ESSENTIAL TO BUSINESS SUCCESS 1 2 3
STRONG BUSINESS PERFORMANCE 1 2 3
VISIBLE AND WELL KNOWN EMPLOYER AMONGST MOST AUSTRALIANS 1 2 3
VISIBLE AND WELL KNOWN EMPLOYER AMONGST MOST SOUTH
AUSTRALIANS
1 2 3
VISIBLE AND WELL KNOWN EMPLOYER WITHIN YOUR INDUSTRY 1 2 3
WORK – LIFE BALANCE
26. HOW IMPORTANT OR UNIMPORTANT ARE EACH OF THE FOLLOWING WORK-LIFE BALANCE ISSUES IN
ENCOURAGEING YOU TO STAY WITH AN EMPLOYER OR MOVE TO ANOTHER EMPLOYER? THESE MAY OR
MAY NOT BE OFFERED BY YOUR CURRENT EMPLOYER. Rotate order
EXTREMELY IMPORTANT
QUITE IMPORTANT
NOT IMPORTANT / DON’T CARE
A SUPPORTIVE POLICY FOR TIME OFF FOR SICK CHILDREN 1 2 3
ALLOWS WORKING FROM HOME 1 2 3
AN ACTIVE SOCIAL CLUB 1 2 3
EVENTS FOR STAFF AND FAMILIES 1 2 3
FLEXIBILITY IN HOURS TO FIT WITH PICKING-UP AND DROPPING OFF
CHILDREN
1 2 3
HAS A FAMILY FRIENDLY POLICY 1 2 3
HAS A REASONABLE VIEW OF HOURS WORKED IN AN AVERAGE WEEK 1 2 3
OFFERS BREAK-AWAY OR CREATIVE AREAS FOR STAFF 1 2 3
PAID MATERNITY LEAVE 1 2 3
PAID PATERNITY LEAVE 1 2 3
PROVIDES PAID TIME OFF FROM TIME-TO-TIME IN ADDITION TO ANNUAL
LEAVE ALLOWANCES
1 2 3
STAFF AND MANAGEMENT REGULARLY MEET FOR INFORMAL LUNCHES,
DRINKS ETC.
1 2 3
WORKPLACE HAS A CHILD CARE CENTRE OR MINDING SERVICE 1 2 3
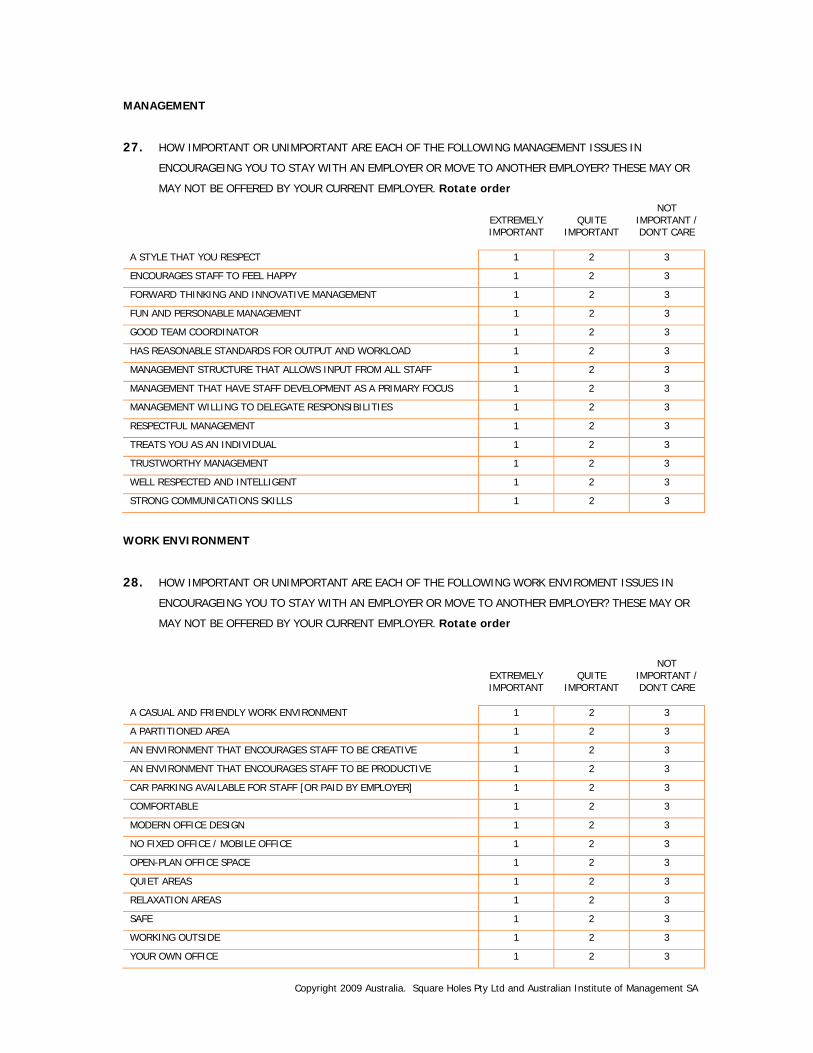
Copyright 2009 Australia. Square Holes Pty Ltd and Australian Institute of Management SA
MANAGEMENT
27. HOW IMPORTANT OR UNIMPORTANT ARE EACH OF THE FOLLOWING MANAGEMENT ISSUES IN
ENCOURAGEING YOU TO STAY WITH AN EMPLOYER OR MOVE TO ANOTHER EMPLOYER? THESE MAY OR
MAY NOT BE OFFERED BY YOUR CURRENT EMPLOYER. Rotate order
EXTREMELY IMPORTANT
QUITE IMPORTANT
NOT IMPORTANT / DON’T CARE
A STYLE THAT YOU RESPECT 1 2 3
ENCOURAGES STAFF TO FEEL HAPPY 1 2 3
FORWARD THINKING AND INNOVATIVE MANAGEMENT 1 2 3
FUN AND PERSONABLE MANAGEMENT 1 2 3
GOOD TEAM COORDINATOR 1 2 3
HAS REASONABLE STANDARDS FOR OUTPUT AND WORKLOAD 1 2 3
MANAGEMENT STRUCTURE THAT ALLOWS INPUT FROM ALL STAFF 1 2 3
MANAGEMENT THAT HAVE STAFF DEVELOPMENT AS A PRIMARY FOCUS 1 2 3
MANAGEMENT WILLING TO DELEGATE RESPONSIBILITIES 1 2 3
RESPECTFUL MANAGEMENT 1 2 3
TREATS YOU AS AN INDIVIDUAL 1 2 3
TRUSTWORTHY MANAGEMENT 1 2 3
WELL RESPECTED AND INTELLIGENT 1 2 3
STRONG COMMUNICATIONS SKILLS 1 2 3
WORK ENVIRONMENT
28. HOW IMPORTANT OR UNIMPORTANT ARE EACH OF THE FOLLOWING WORK ENVIROMENT ISSUES IN
ENCOURAGEING YOU TO STAY WITH AN EMPLOYER OR MOVE TO ANOTHER EMPLOYER? THESE MAY OR
MAY NOT BE OFFERED BY YOUR CURRENT EMPLOYER. Rotate order
EXTREMELY IMPORTANT
QUITE IMPORTANT
NOT IMPORTANT / DON’T CARE
A CASUAL AND FRIENDLY WORK ENVIRONMENT 1 2 3
A PARTITIONED AREA 1 2 3
AN ENVIRONMENT THAT ENCOURAGES STAFF TO BE CREATIVE 1 2 3
AN ENVIRONMENT THAT ENCOURAGES STAFF TO BE PRODUCTIVE 1 2 3
CAR PARKING AVAILABLE FOR STAFF [OR PAID BY EMPLOYER] 1 2 3
COMFORTABLE 1 2 3
MODERN OFFICE DESIGN 1 2 3
NO FIXED OFFICE / MOBILE OFFICE 1 2 3
OPEN-PLAN OFFICE SPACE 1 2 3
QUIET AREAS 1 2 3
RELAXATION AREAS 1 2 3
SAFE 1 2 3
WORKING OUTSIDE 1 2 3
YOUR OWN OFFICE 1 2 3
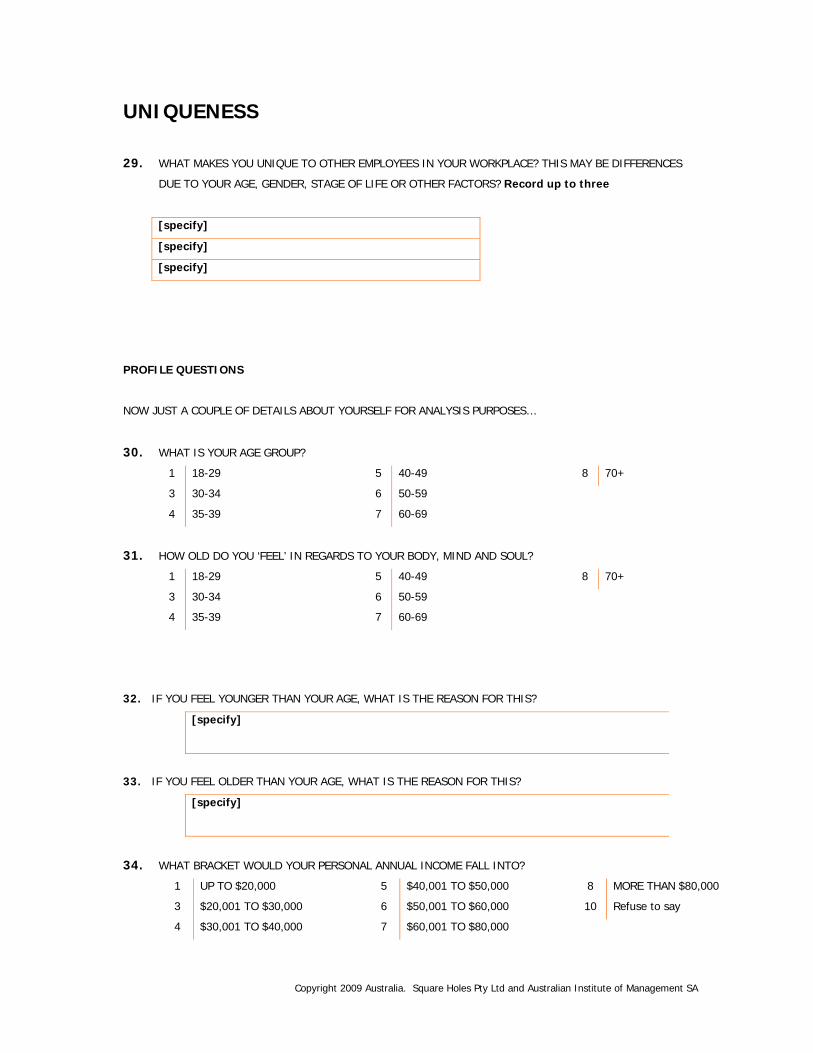
Copyright 2009 Australia. Square Holes Pty Ltd and Australian Institute of Management SA
UNIQUENESS
29. WHAT MAKES YOU UNIQUE TO OTHER EMPLOYEES IN YOUR WORKPLACE? THIS MAY BE DIFFERENCES
DUE TO YOUR AGE, GENDER, STAGE OF LIFE OR OTHER FACTORS? Record up to three
[specify]
[specify]
[specify]
PROFILE QUESTIONS
NOW JUST A COUPLE OF DETAILS ABOUT YOURSELF FOR ANALYSIS PURPOSES…
30. WHAT IS YOUR AGE GROUP?
1 18-29
3 30-34
4 35-39
5 40-49
6 50-59
7 60-69
8 70+
31. HOW OLD DO YOU ‘FEEL’ IN REGARDS TO YOUR BODY, MIND AND SOUL?
1 18-29
3 30-34
4 35-39
5 40-49
6 50-59
7 60-69
8 70+
32. IF YOU FEEL YOUNGER THAN YOUR AGE, WHAT IS THE REASON FOR THIS?
[specify]
33. IF YOU FEEL OLDER THAN YOUR AGE, WHAT IS THE REASON FOR THIS?
[specify]
34. WHAT BRACKET WOULD YOUR PERSONAL ANNUAL INCOME FALL INTO?
1 UP TO $20,000
3 $20,001 TO $30,000
4 $30,001 TO $40,000
5 $40,001 TO $50,000
6 $50,001 TO $60,000
7 $60,001 TO $80,000
8 MORE THAN $80,000
10 Refuse to say
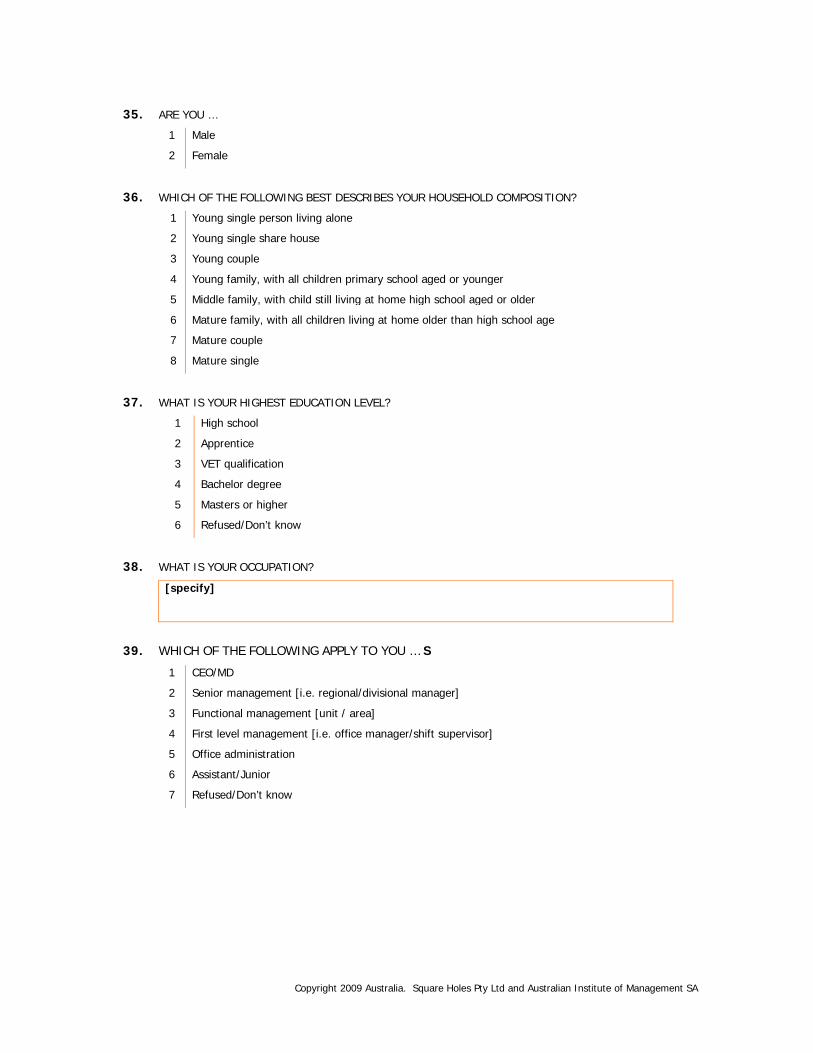
Copyright 2009 Australia. Square Holes Pty Ltd and Australian Institute of Management SA
35. ARE YOU …
1 Male
2 Female
36. WHICH OF THE FOLLOWING BEST DESCRIBES YOUR HOUSEHOLD COMPOSITION?
1 Young single person living alone
2 Young single share house
3 Young couple
4 Young family, with all children primary school aged or younger
5 Middle family, with child still living at home high school aged or older
6 Mature family, with all children living at home older than high school age
7 Mature couple
8 Mature single
37. WHAT IS YOUR HIGHEST EDUCATION LEVEL?
1 High school
2 Apprentice
3 VET qualification
4 Bachelor degree
5 Masters or higher
6 Refused/Don’t know
38. WHAT IS YOUR OCCUPATION?
[specify]
39. WHICH OF THE FOLLOWING APPLY TO YOU … S
1 CEO/MD
2 Senior management [i.e. regional/divisional manager]
3 Functional management [unit / area]
4 First level management [i.e. office manager/shift supervisor]
5 Office administration
6 Assistant/Junior
7 Refused/Don’t know
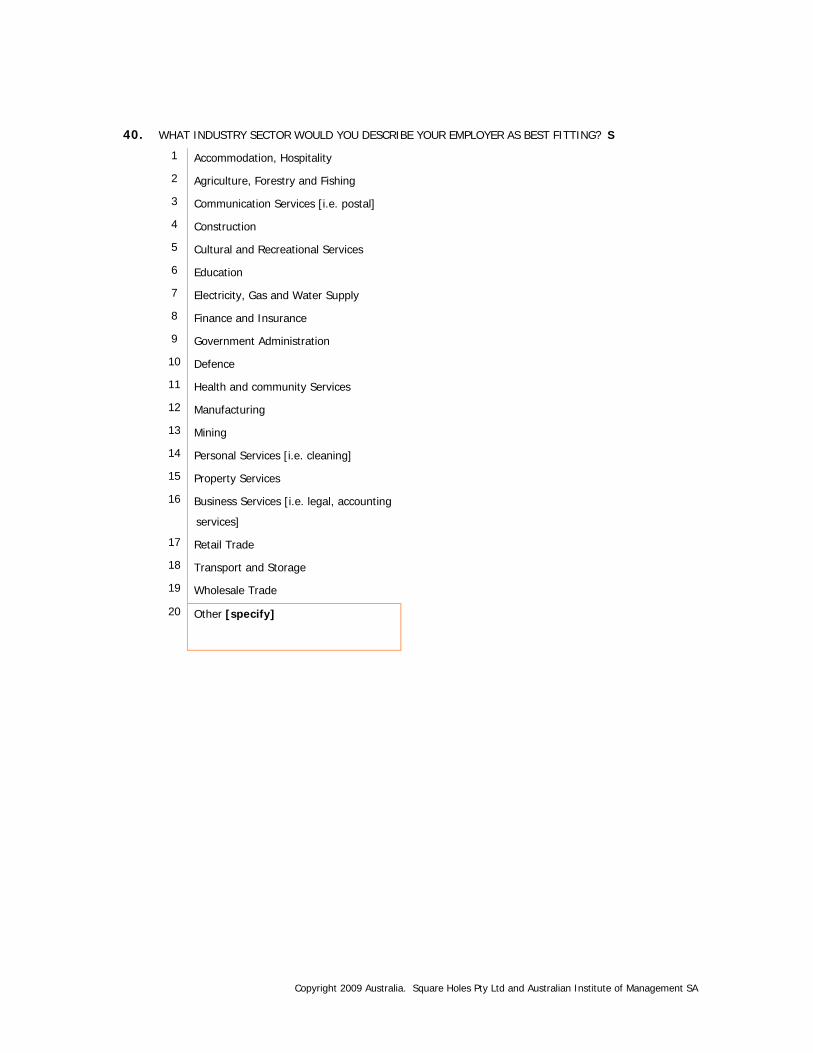
Copyright 2009 Australia. Square Holes Pty Ltd and Australian Institute of Management SA
40. WHAT INDUSTRY SECTOR WOULD YOU DESCRIBE YOUR EMPLOYER AS BEST FITTING? S
1 Accommodation, Hospitality
2 Agriculture, Forestry and Fishing
3 Communication Services [i.e. postal]
4 Construction
5 Cultural and Recreational Services
6 Education
7 Electricity, Gas and Water Supply
8 Finance and Insurance
9 Government Administration
10 Defence
11 Health and community Services
12 Manufacturing
13 Mining
14 Personal Services [i.e. cleaning]
15 Property Services
16 Business Services [i.e. legal, accounting
services]
17 Retail Trade
18 Transport and Storage
19 Wholesale Trade
20 Other [specify]
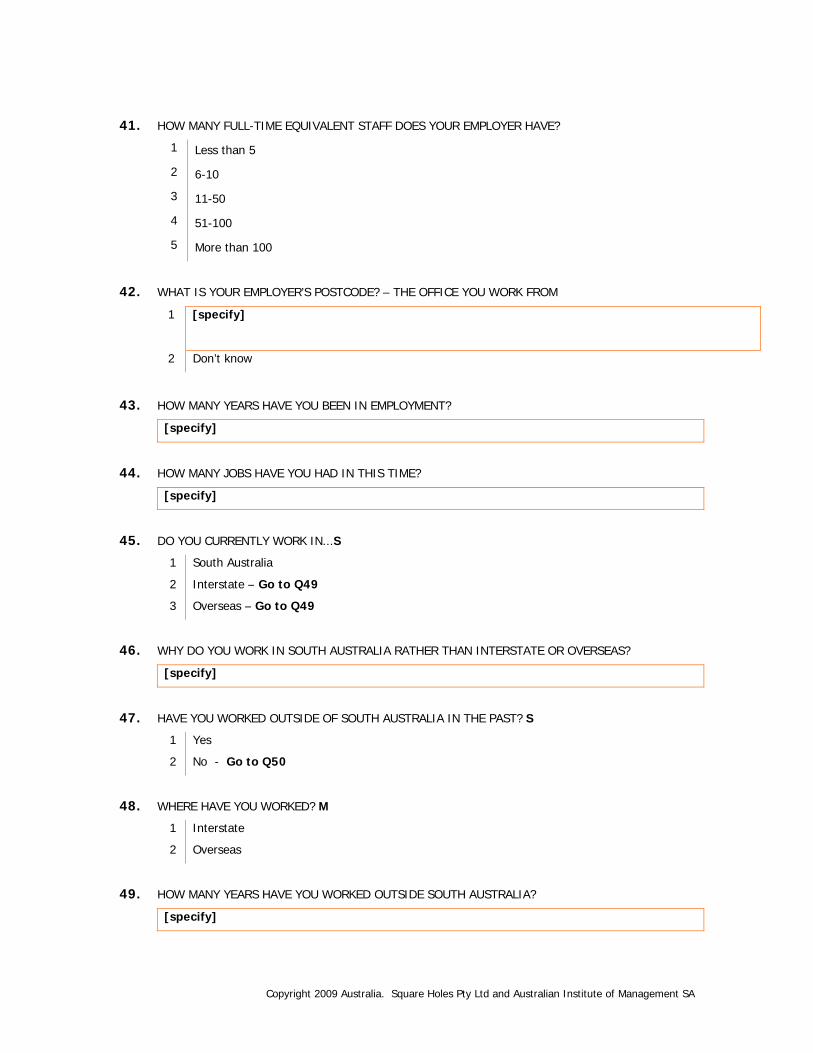
Copyright 2009 Australia. Square Holes Pty Ltd and Australian Institute of Management SA
41. HOW MANY FULL-TIME EQUIVALENT STAFF DOES YOUR EMPLOYER HAVE?
1 Less than 5
2 6-10
3 11-50
4 51-100
5 More than 100
42. WHAT IS YOUR EMPLOYER’S POSTCODE? – THE OFFICE YOU WORK FROM
1 [specify]
2 Don’t know
43. HOW MANY YEARS HAVE YOU BEEN IN EMPLOYMENT?
[specify]
44. HOW MANY JOBS HAVE YOU HAD IN THIS TIME?
[specify]
45. DO YOU CURRENTLY WORK IN...S
1 South Australia
2 Interstate – Go to Q49
3 Overseas – Go to Q49
46. WHY DO YOU WORK IN SOUTH AUSTRALIA RATHER THAN INTERSTATE OR OVERSEAS?
[specify]
47. HAVE YOU WORKED OUTSIDE OF SOUTH AUSTRALIA IN THE PAST? S
1 Yes
2 No - Go to Q50
48. WHERE HAVE YOU WORKED? M
1 Interstate
2 Overseas
49. HOW MANY YEARS HAVE YOU WORKED OUTSIDE SOUTH AUSTRALIA?
[specify]
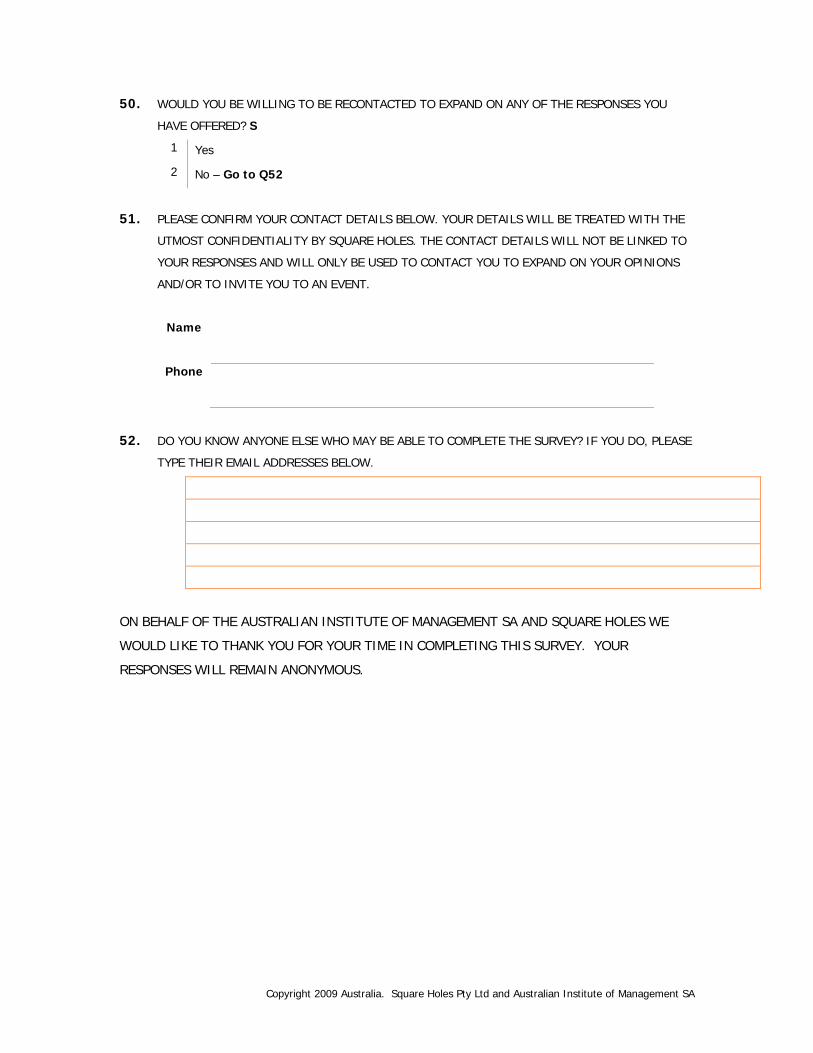
Copyright 2009 Australia. Square Holes Pty Ltd and Australian Institute of Management SA
50. WOULD YOU BE WILLING TO BE RECONTACTED TO EXPAND ON ANY OF THE RESPONSES YOU
HAVE OFFERED? S
1 Yes
2 No – Go to Q52
51. PLEASE CONFIRM YOUR CONTACT DETAILS BELOW. YOUR DETAILS WILL BE TREATED WITH THE
UTMOST CONFIDENTIALITY BY SQUARE HOLES. THE CONTACT DETAILS WILL NOT BE LINKED TO
YOUR RESPONSES AND WILL ONLY BE USED TO CONTACT YOU TO EXPAND ON YOUR OPINIONS
AND/OR TO INVITE YOU TO AN EVENT.
Name
Phone
52. DO YOU KNOW ANYONE ELSE WHO MAY BE ABLE TO COMPLETE THE SURVEY? IF YOU DO, PLEASE
TYPE THEIR EMAIL ADDRESSES BELOW.
ON BEHALF OF THE AUSTRALIAN INSTITUTE OF MANAGEMENT SA AND SQUARE HOLES WE
WOULD LIKE TO THANK YOU FOR YOUR TIME IN COMPLETING THIS SURVEY. YOUR
RESPONSES WILL REMAIN ANONYMOUS.