Embed Size (px)
Citation preview

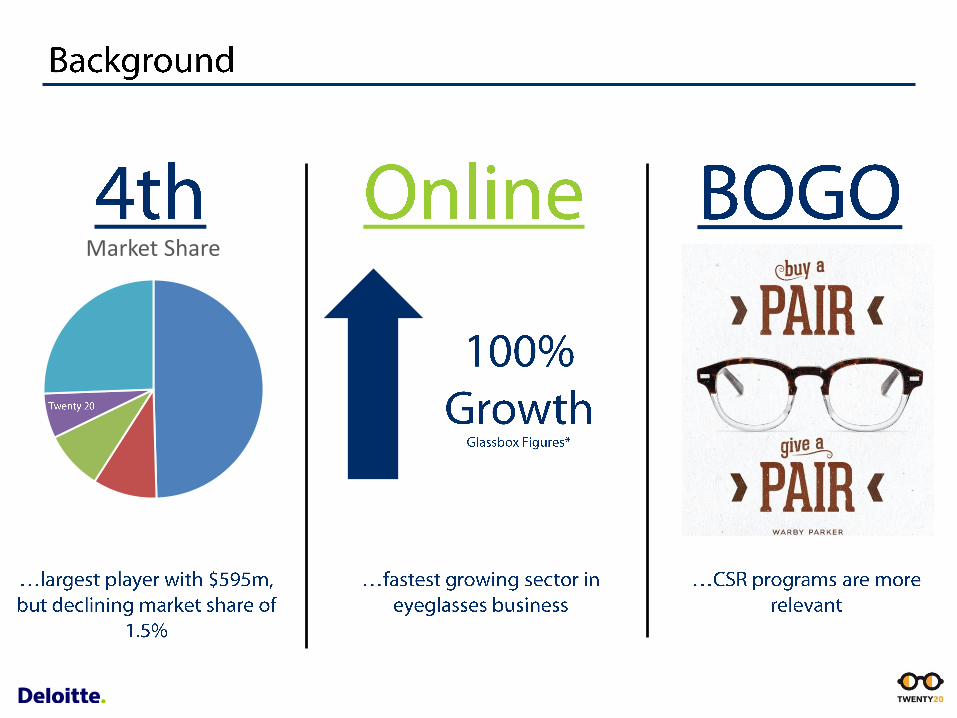
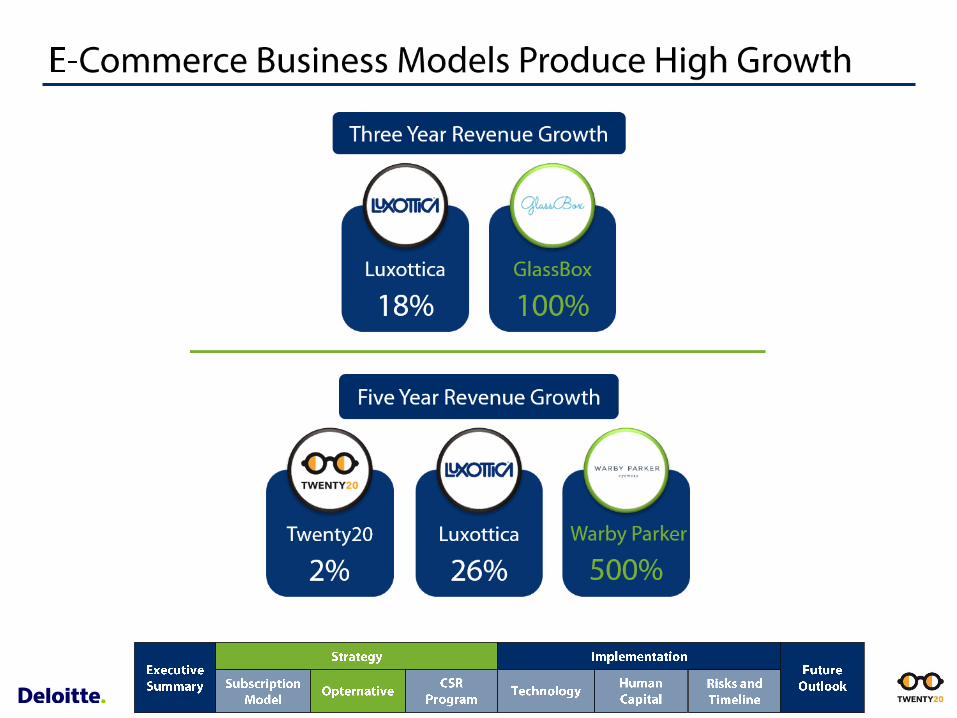
Market Share
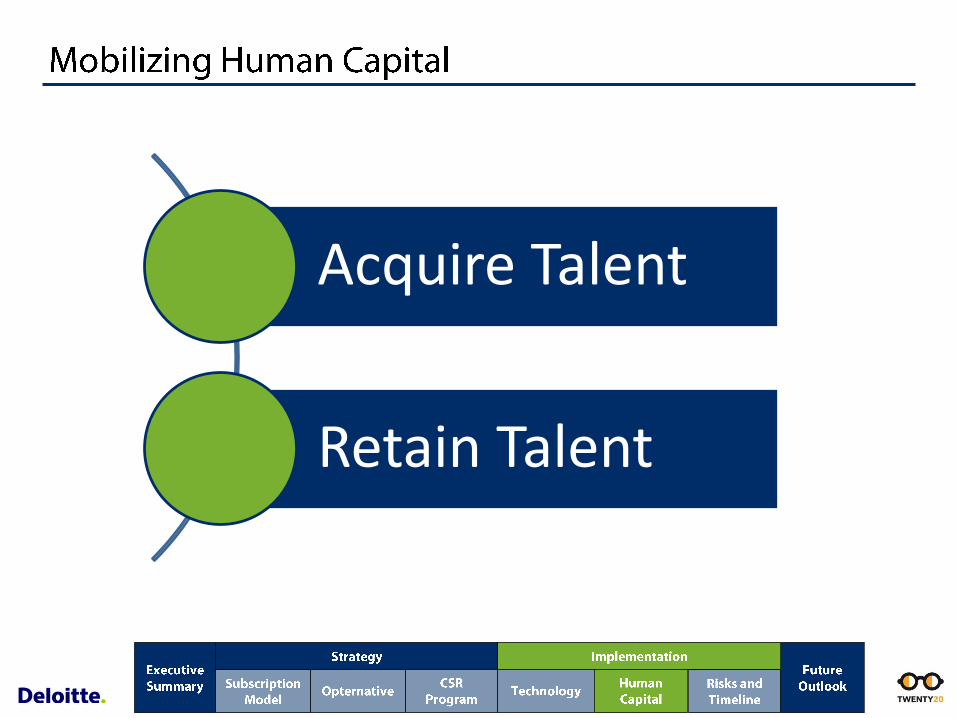
Acquire Talent
Retain Talent
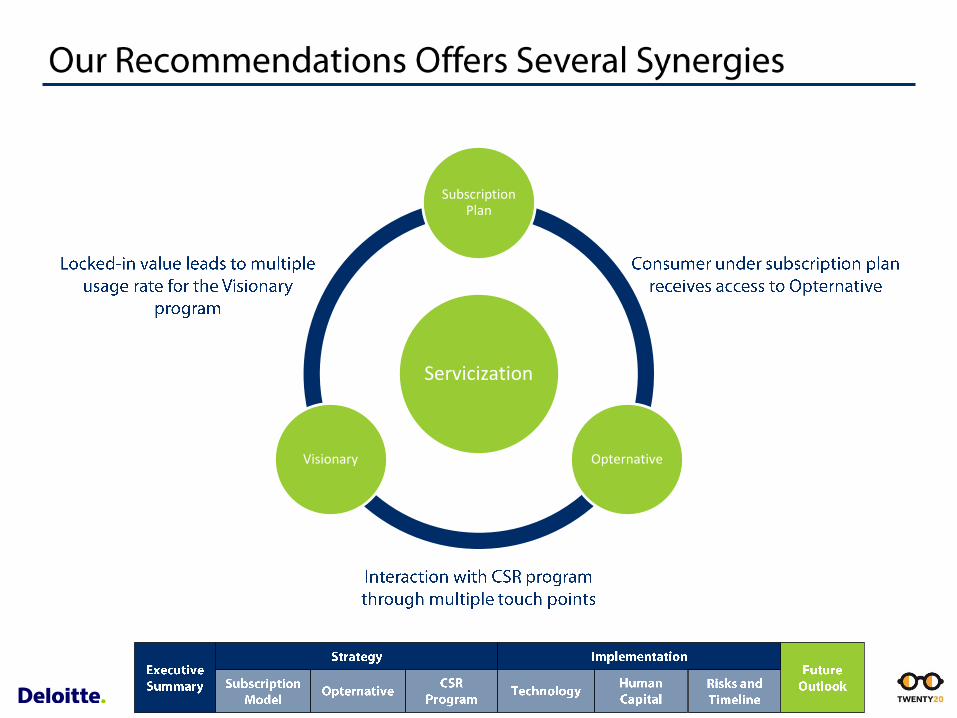
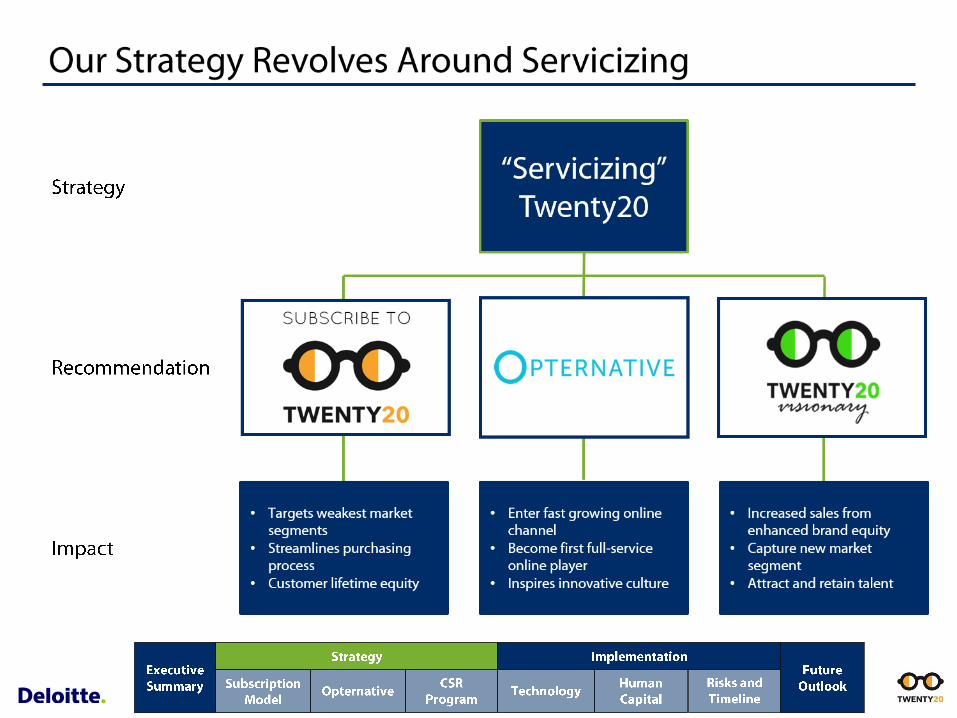
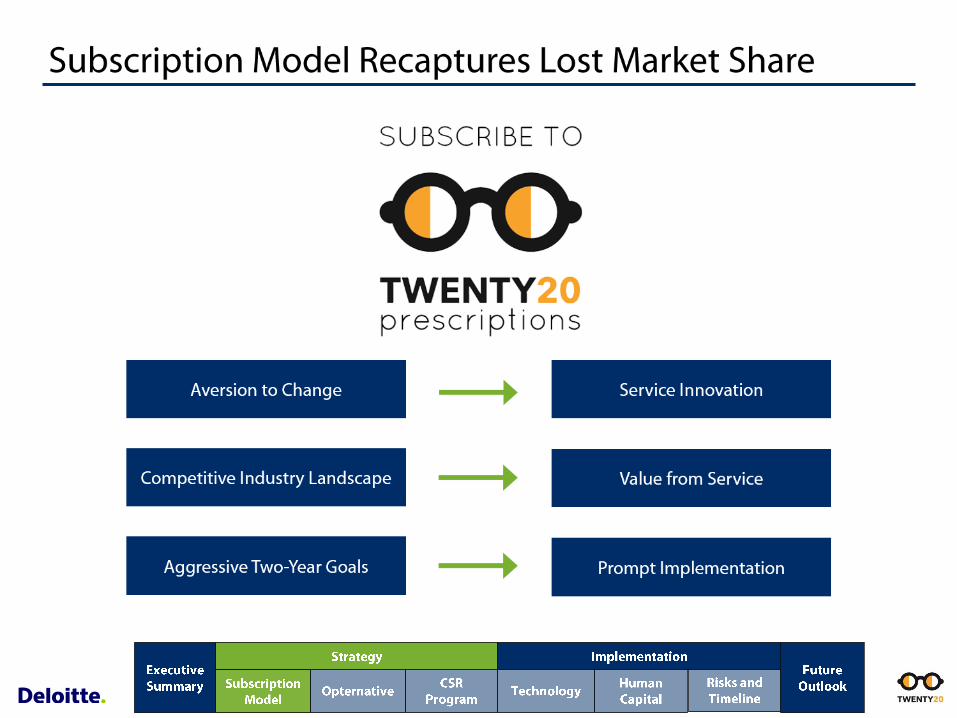
Servicization
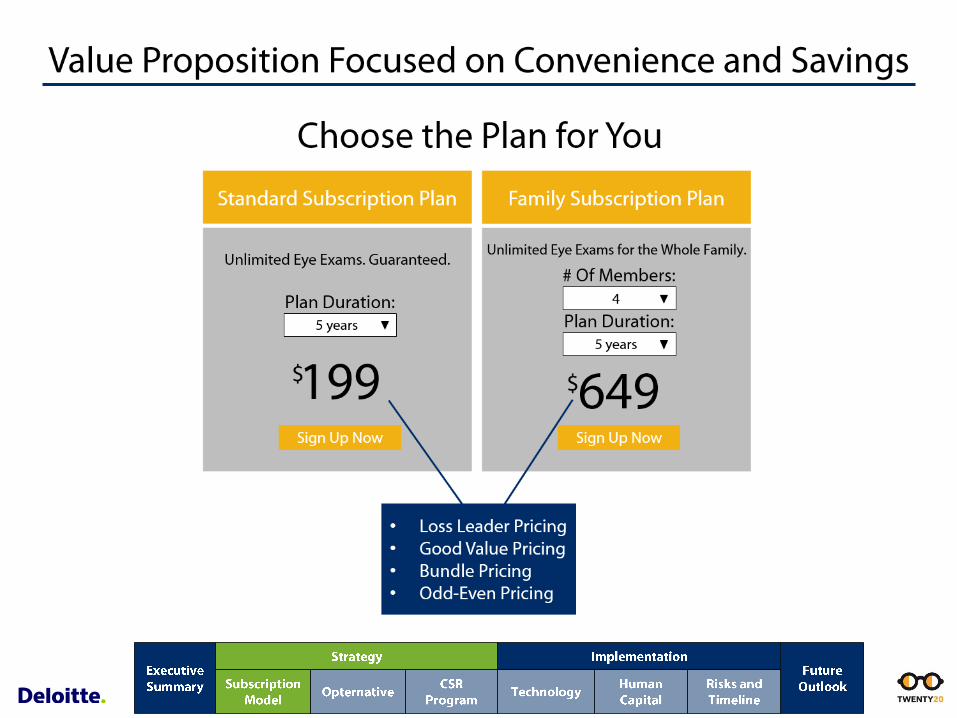
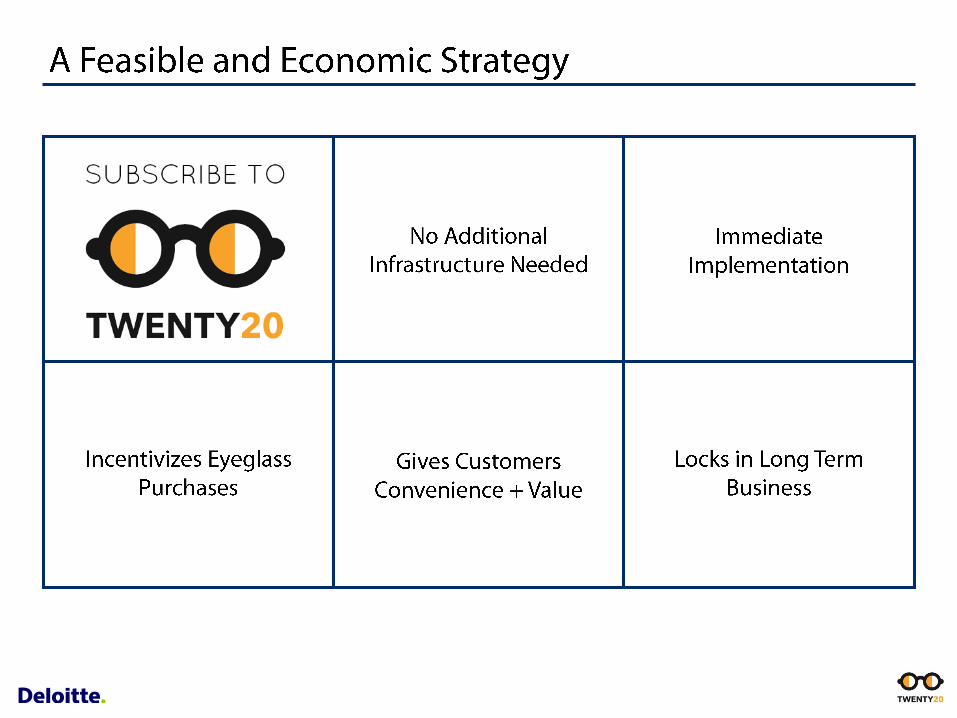
Subscription Plan
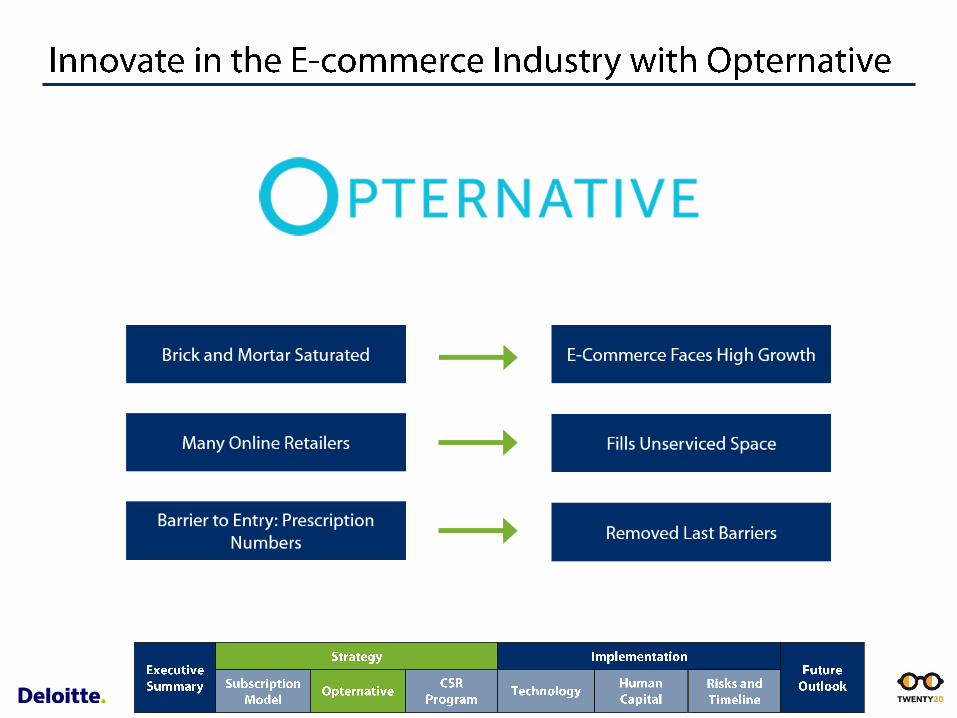
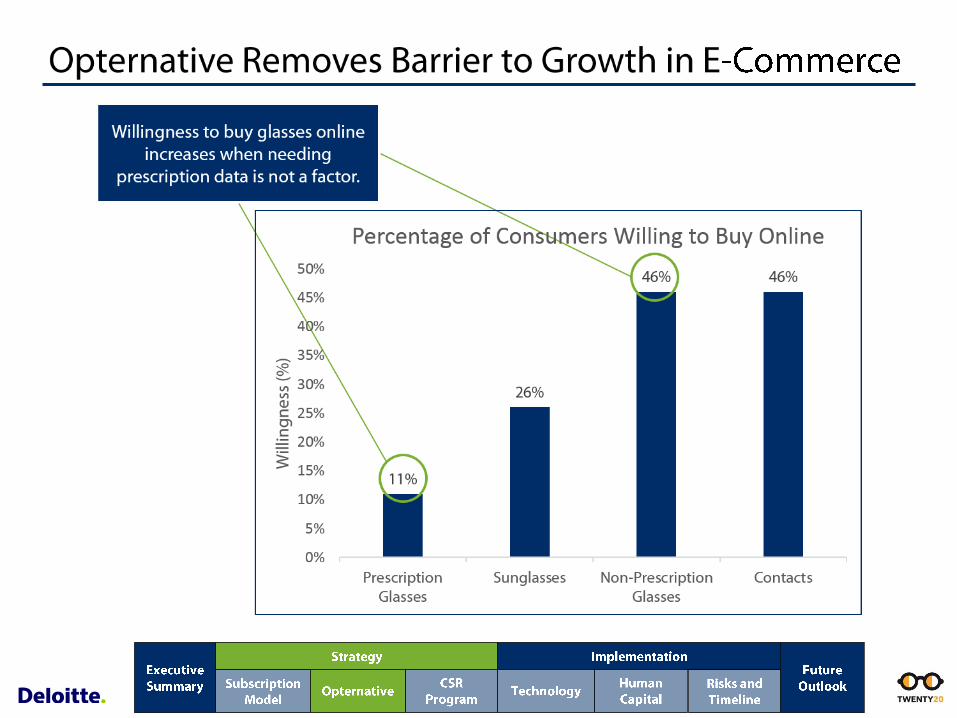
OpternativeVisionary
Copyright © 2012 Deloitte Development LLC. All rights reserved.
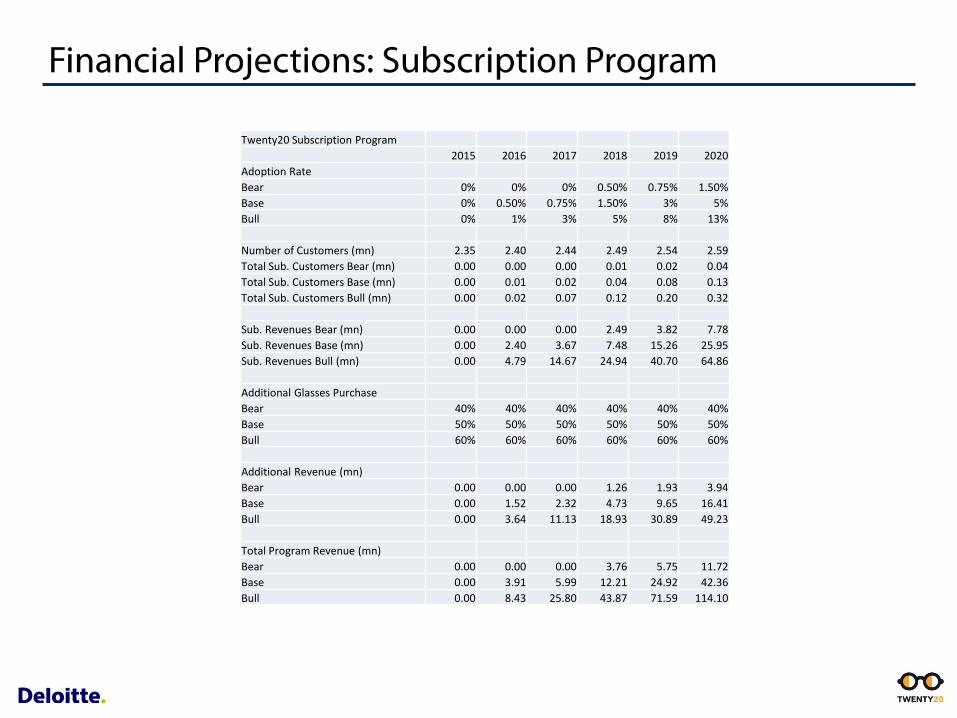
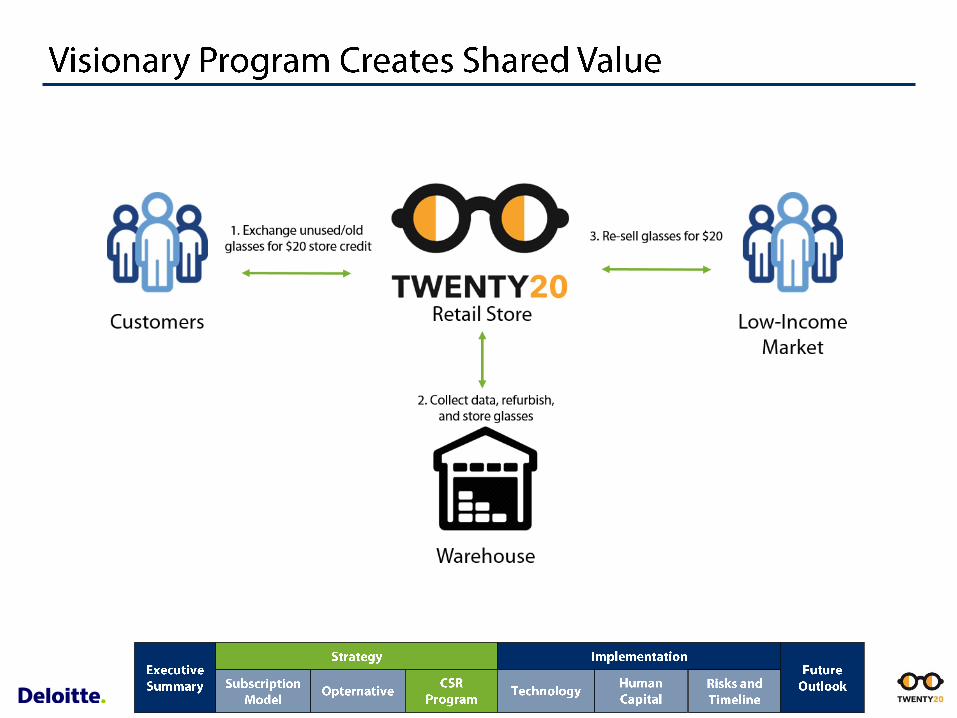
Twenty20 Subscription Program
2015 2016 2017 2018 2019 2020
Adoption Rate
Bear 0% 0% 0% 0.50% 0.75% 1.50%
Base 0% 0.50% 0.75% 1.50% 3% 5%
Bull 0% 1% 3% 5% 8% 13%
Number of Customers (mn) 2.35 2.40 2.44 2.49 2.54 2.59
Total Sub. Customers Bear (mn) 0.00 0.00 0.00 0.01 0.02 0.04
Total Sub. Customers Base (mn) 0.00 0.01 0.02 0.04 0.08 0.13
Total Sub. Customers Bull (mn) 0.00 0.02 0.07 0.12 0.20 0.32
Sub. Revenues Bear (mn) 0.00 0.00 0.00 2.49 3.82 7.78
Sub. Revenues Base (mn) 0.00 2.40 3.67 7.48 15.26 25.95
Sub. Revenues Bull (mn) 0.00 4.79 14.67 24.94 40.70 64.86
Additional Glasses Purchase
Bear 40% 40% 40% 40% 40% 40%
Base 50% 50% 50% 50% 50% 50%
Bull 60% 60% 60% 60% 60% 60%
Additional Revenue (mn)
Bear 0.00 0.00 0.00 1.26 1.93 3.94
Base 0.00 1.52 2.32 4.73 9.65 16.41
Bull 0.00 3.64 11.13 18.93 30.89 49.23
Total Program Revenue (mn)
Bear 0.00 0.00 0.00 3.76 5.75 11.72
Base 0.00 3.91 5.99 12.21 24.92 42.36
Bull 0.00 8.43 25.80 43.87 71.59 114.10
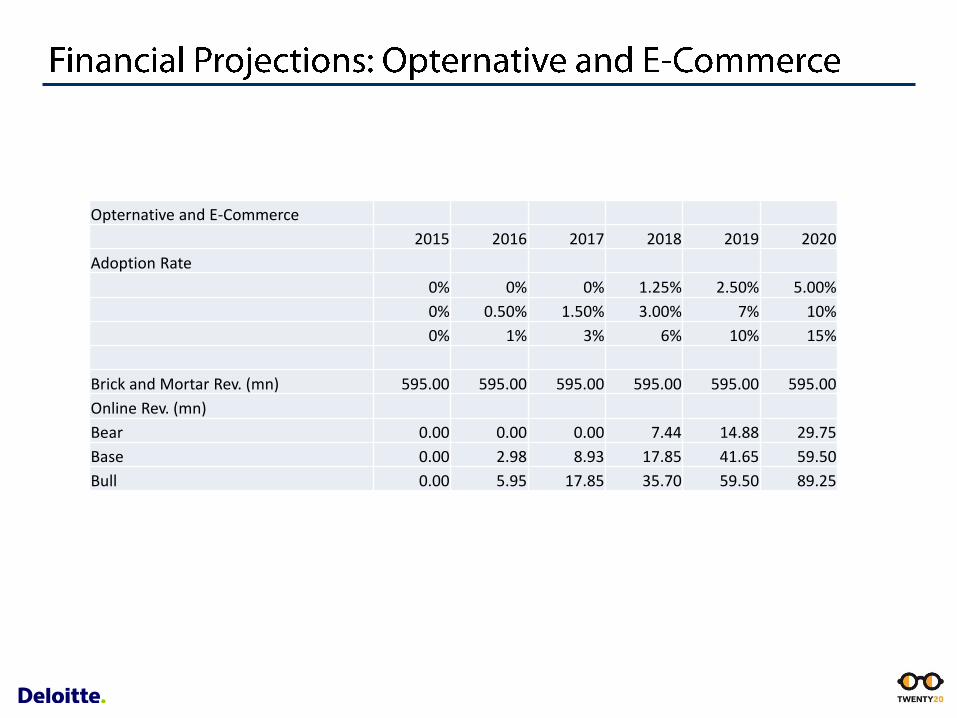
Opternative and E-Commerce
2015 2016 2017 2018 2019 2020
Adoption Rate
0% 0% 0% 1.25% 2.50% 5.00%
0% 0.50% 1.50% 3.00% 7% 10%
0% 1% 3% 6% 10% 15%
Brick and Mortar Rev. (mn) 595.00 595.00 595.00 595.00 595.00 595.00
Online Rev. (mn)
Bear 0.00 0.00 0.00 7.44 14.88 29.75
Base 0.00 2.98 8.93 17.85 41.65 59.50
Bull 0.00 5.95 17.85 35.70 59.50 89.25
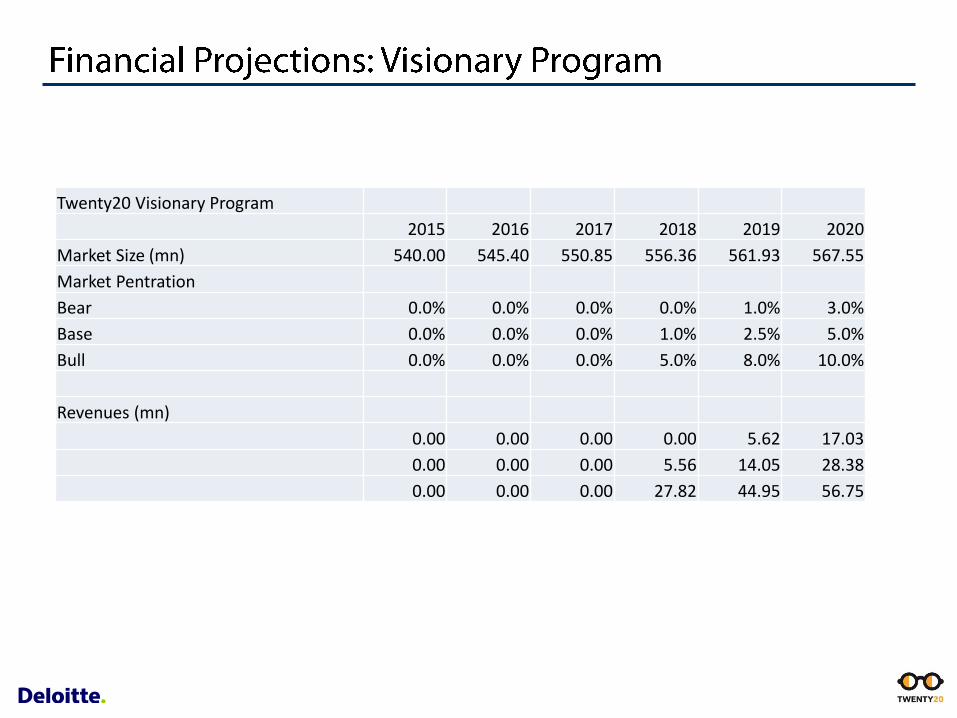
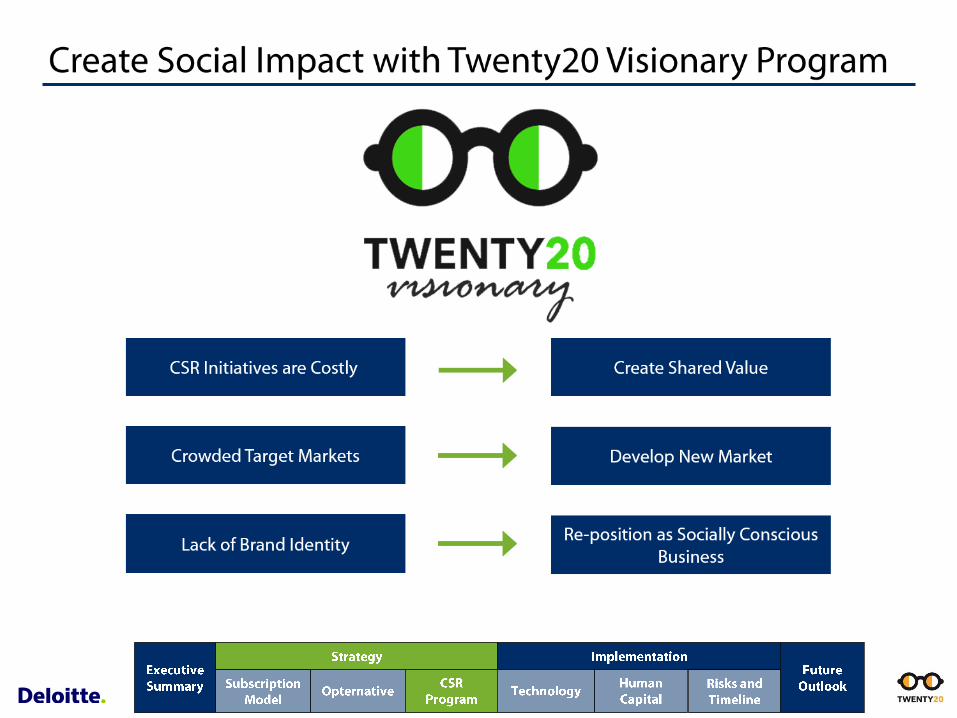
Twenty20 Visionary Program
2015 2016 2017 2018 2019 2020
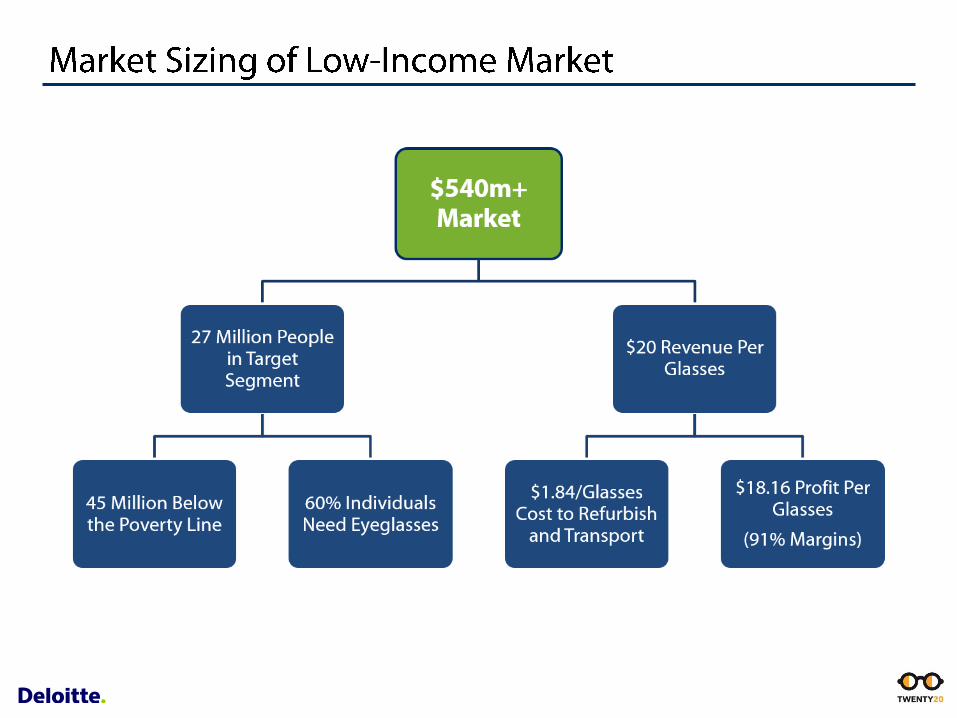
Market Size (mn) 540.00 545.40 550.85 556.36 561.93 567.55
Market Pentration
Bear 0.0% 0.0% 0.0% 0.0% 1.0% 3.0%
Base 0.0% 0.0% 0.0% 1.0% 2.5% 5.0%
Bull 0.0% 0.0% 0.0% 5.0% 8.0% 10.0%
Revenues (mn)
0.00 0.00 0.00 0.00 5.62 17.03
0.00 0.00 0.00 5.56 14.05 28.38
0.00 0.00 0.00 27.82 44.95 56.75

Combined Revenues (mn)
Bear 0.00 0.00 0.00 11.19 26.24 58.50 10%
Base 0.00 6.89 14.91 35.63 80.61 130.23 22%
Bull 0.00 14.38 43.65 107.38 176.04 260.10 44%
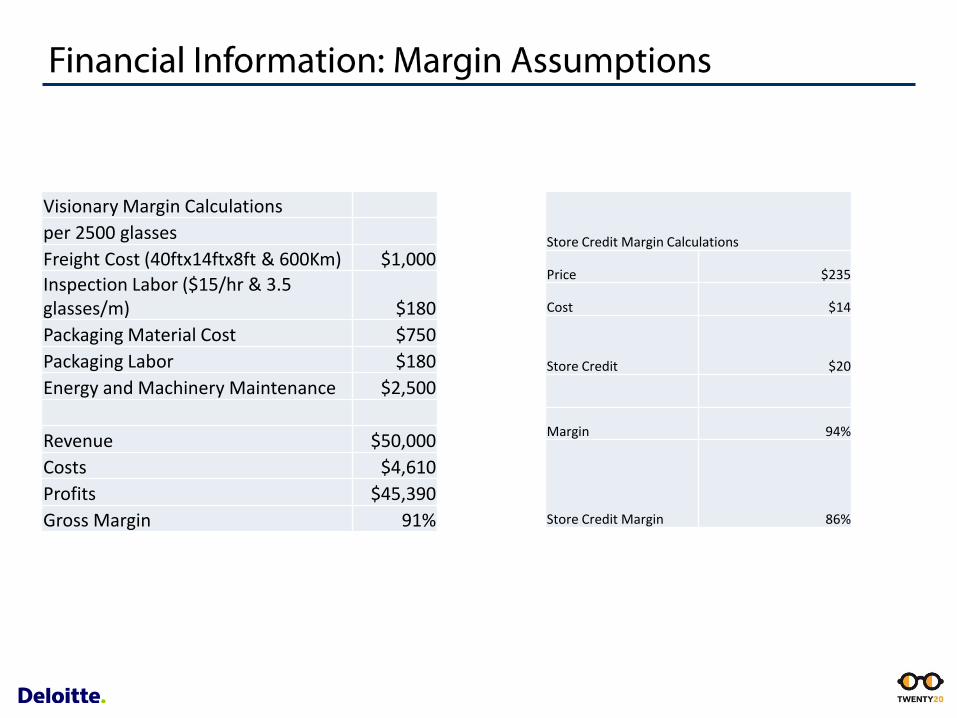
Visionary Margin Calculations
per 2500 glasses
Freight Cost (40ftx14ftx8ft & 600Km) $1,000
Inspection Labor ($15/hr & 3.5 glasses/m) $180
Packaging Material Cost $750
Packaging Labor $180
Energy and Machinery Maintenance $2,500
Revenue $50,000
Costs $4,610
Profits $45,390
Gross Margin 91%
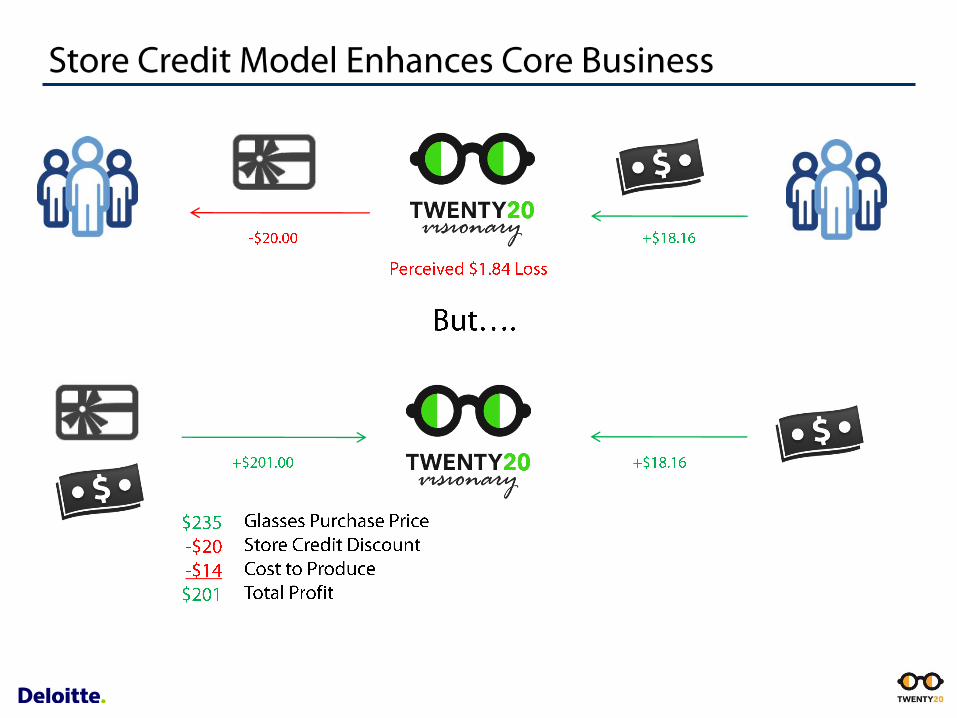
Store Credit Margin Calculations
Price $235
Cost $14
Store Credit $20
Margin 94%
Store Credit Margin 86%
Major Points Major PointsMajor Points
Major Points Major PointsMajor Points
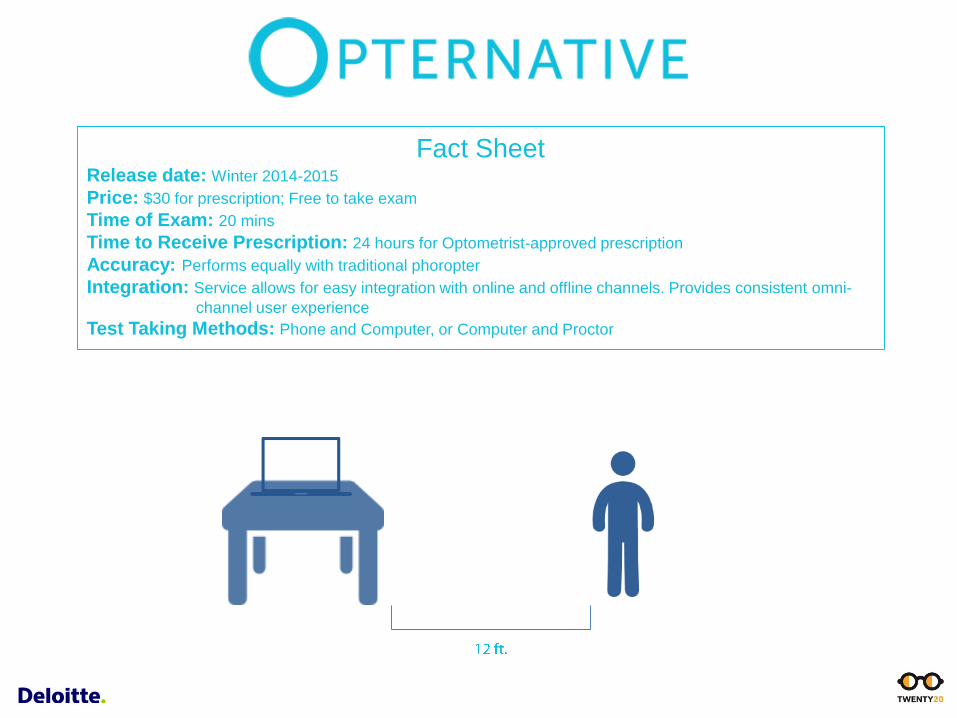
Fact SheetRelease date: Winter 2014-2015
Price: $30 for prescription; Free to take exam
Time of Exam: 20 mins
Time to Receive Prescription: 24 hours for Optometrist-approved prescription
Accuracy: Performs equally with traditional phoropter
Integration: Service allows for easy integration with online and offline channels. Provides consistent omni-
channel user experience
Test Taking Methods: Phone and Computer, or Computer and Proctor