Embed Size (px)
Citation preview
© 2013 Zuum
1
ZuumSocial.com
Report:
Facebook Page DataAverages May 2013 Know
What Works
Key performance metrics for 90 top brands in 10 major industries: Beauty, Fast Food, Luxury Fashion, Snack Foods, Hybrid/Electric autos, Children’s Hospitals, Energy Drinks, Hotels, Toothpaste.
© 2013 Zuum
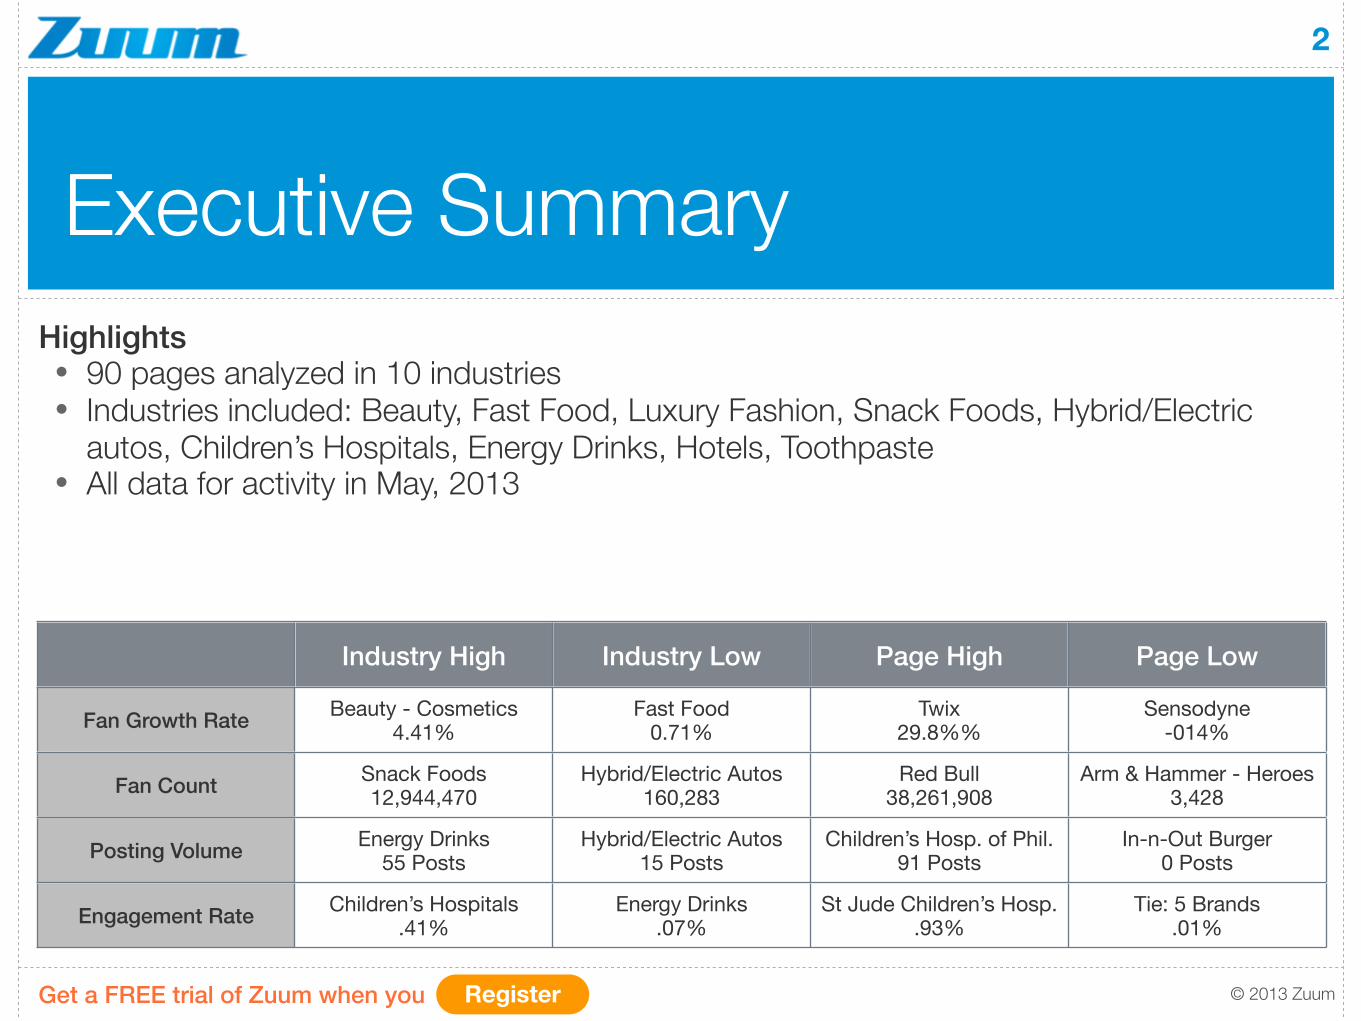
Executive Summary
2
Highlights• 90 pages analyzed in 10 industries • Industries included: Beauty, Fast Food, Luxury Fashion, Snack Foods, Hybrid/Electric
autos, Children’s Hospitals, Energy Drinks, Hotels, Toothpaste • All data for activity in May, 2013
Industry High Industry Low Page High Page Low
Fan Growth Rate
Fan Count
Posting Volume
Engagement Rate
Beauty - Cosmetics4.41%
Fast Food0.71%
Twix29.8%%
Sensodyne-014%
Snack Foods12,944,470
Hybrid/Electric Autos160,283
Red Bull38,261,908
Arm & Hammer - Heroes3,428
Energy Drinks55 Posts
Hybrid/Electric Autos15 Posts
Children’s Hosp. of Phil.91 Posts
In-n-Out Burger0 Posts
Children’s Hospitals.41%
Energy Drinks.07%
St Jude Children’s Hosp..93%
Tie: 5 Brands.01%
RegisterGet a FREE trial of Zuum when you
© 2013 Zuum
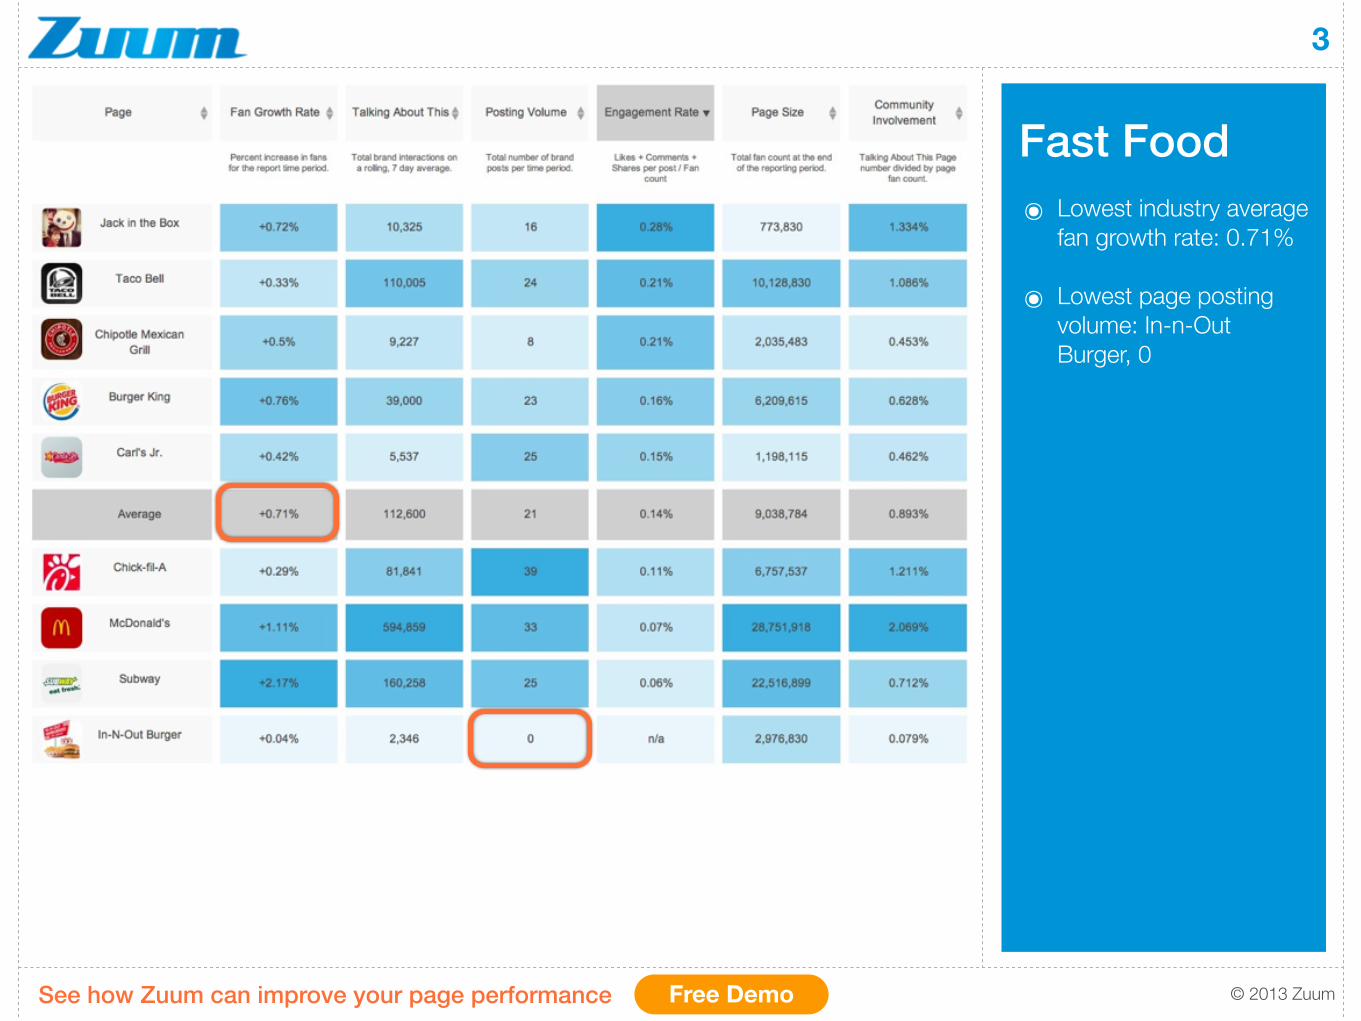
Fast Food
3
๏ Lowest industry average fan growth rate: 0.71%
๏ Lowest page posting volume: In-n-Out Burger, 0
Free DemoSee how Zuum can improve your page performance
© 2013 Zuum
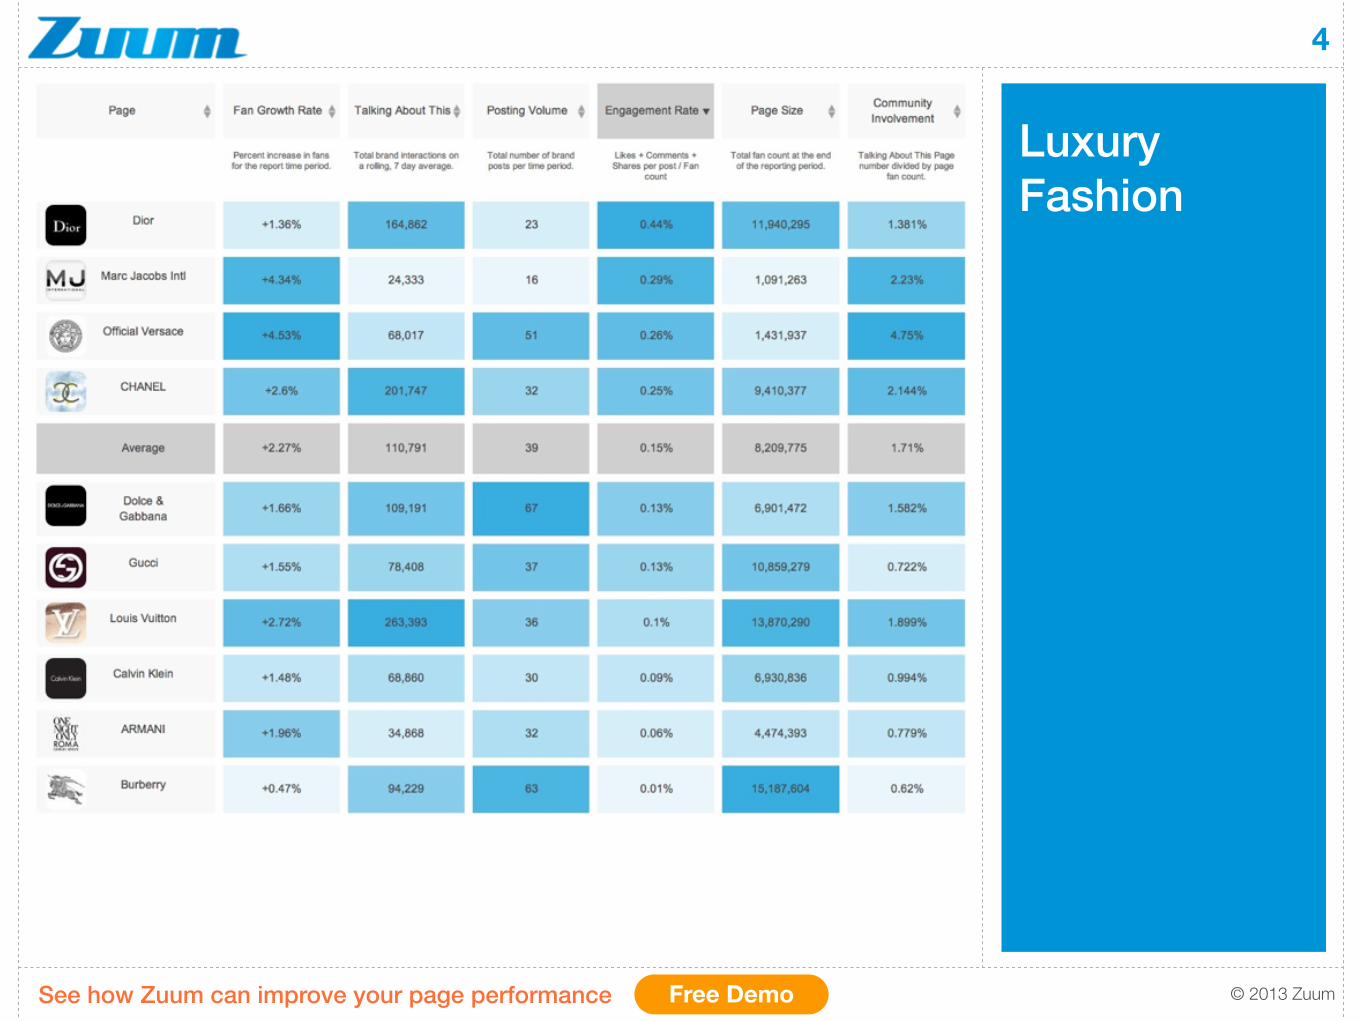
Luxury Fashion
4
Free DemoSee how Zuum can improve your page performance
© 2013 Zuum
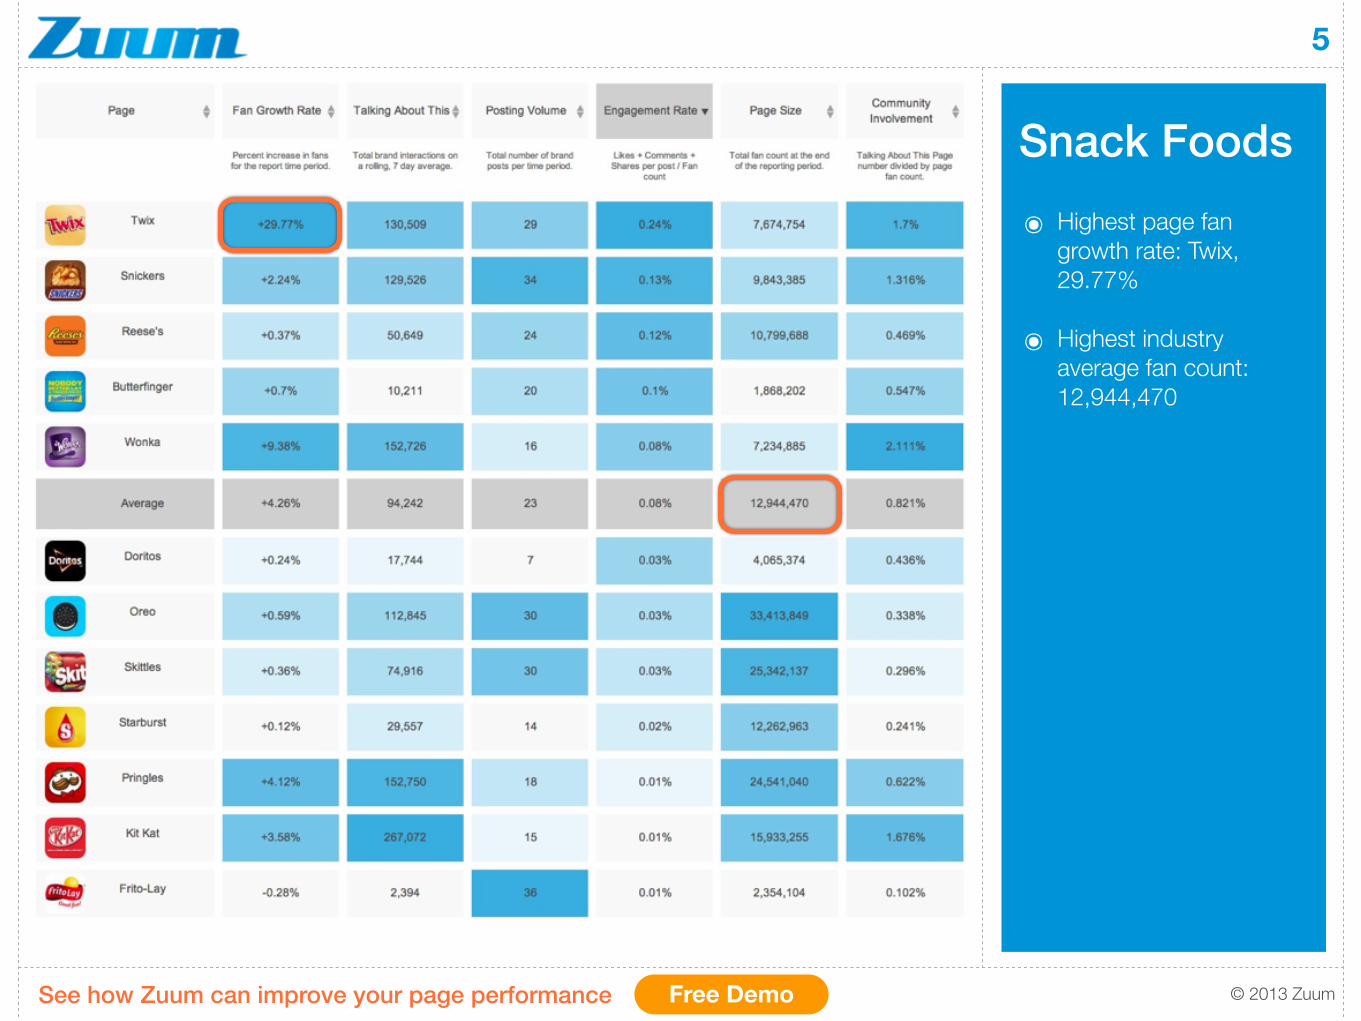
Snack Foods
5
Free DemoSee how Zuum can improve your page performance
๏ Highest page fan growth rate: Twix, 29.77%
๏ Highest industry average fan count: 12,944,470
© 2013 Zuum
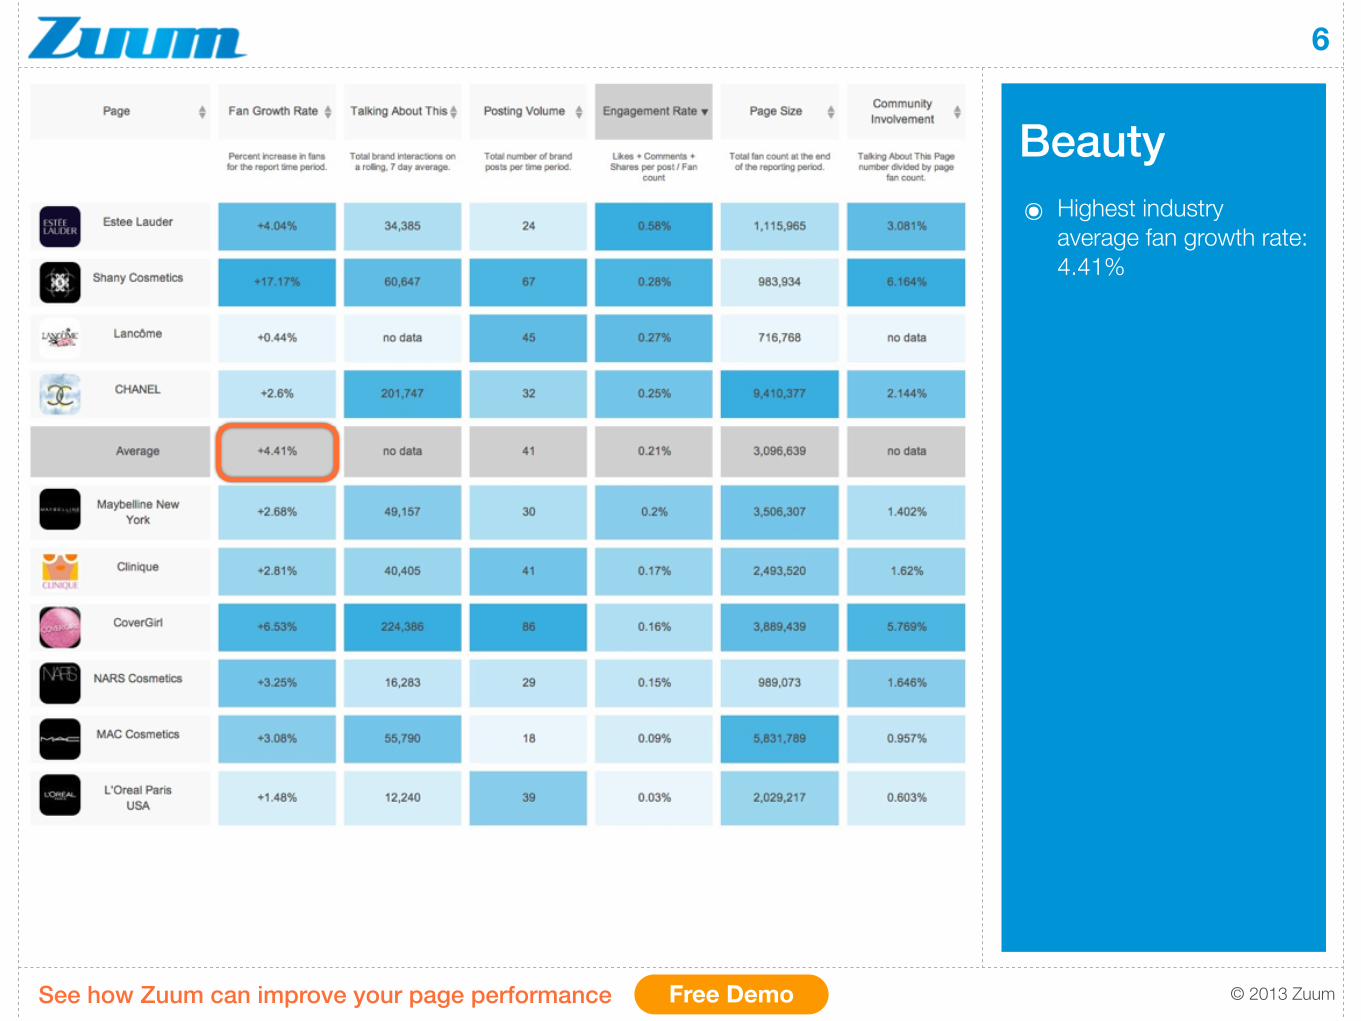
Beauty
6
๏ Highest industry average fan growth rate: 4.41%
Free DemoSee how Zuum can improve your page performance
© 2013 Zuum
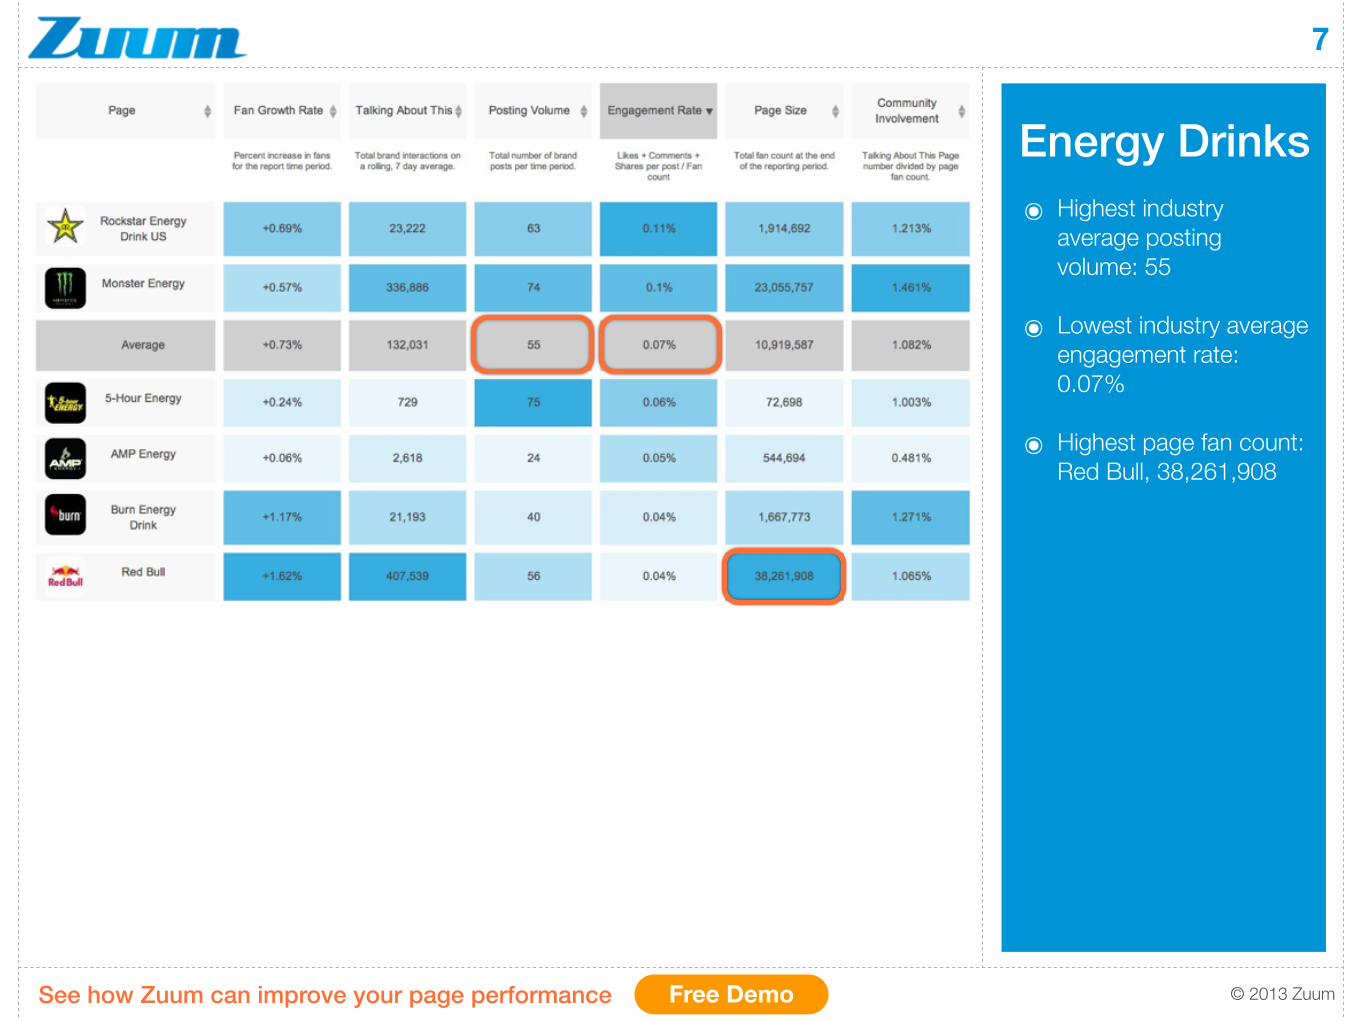
Energy Drinks
7
๏ Highest industry average posting volume: 55
๏ Lowest industry average engagement rate: 0.07%
๏ Highest page fan count: Red Bull, 38,261,908
Free DemoSee how Zuum can improve your page performance
© 2013 Zuum
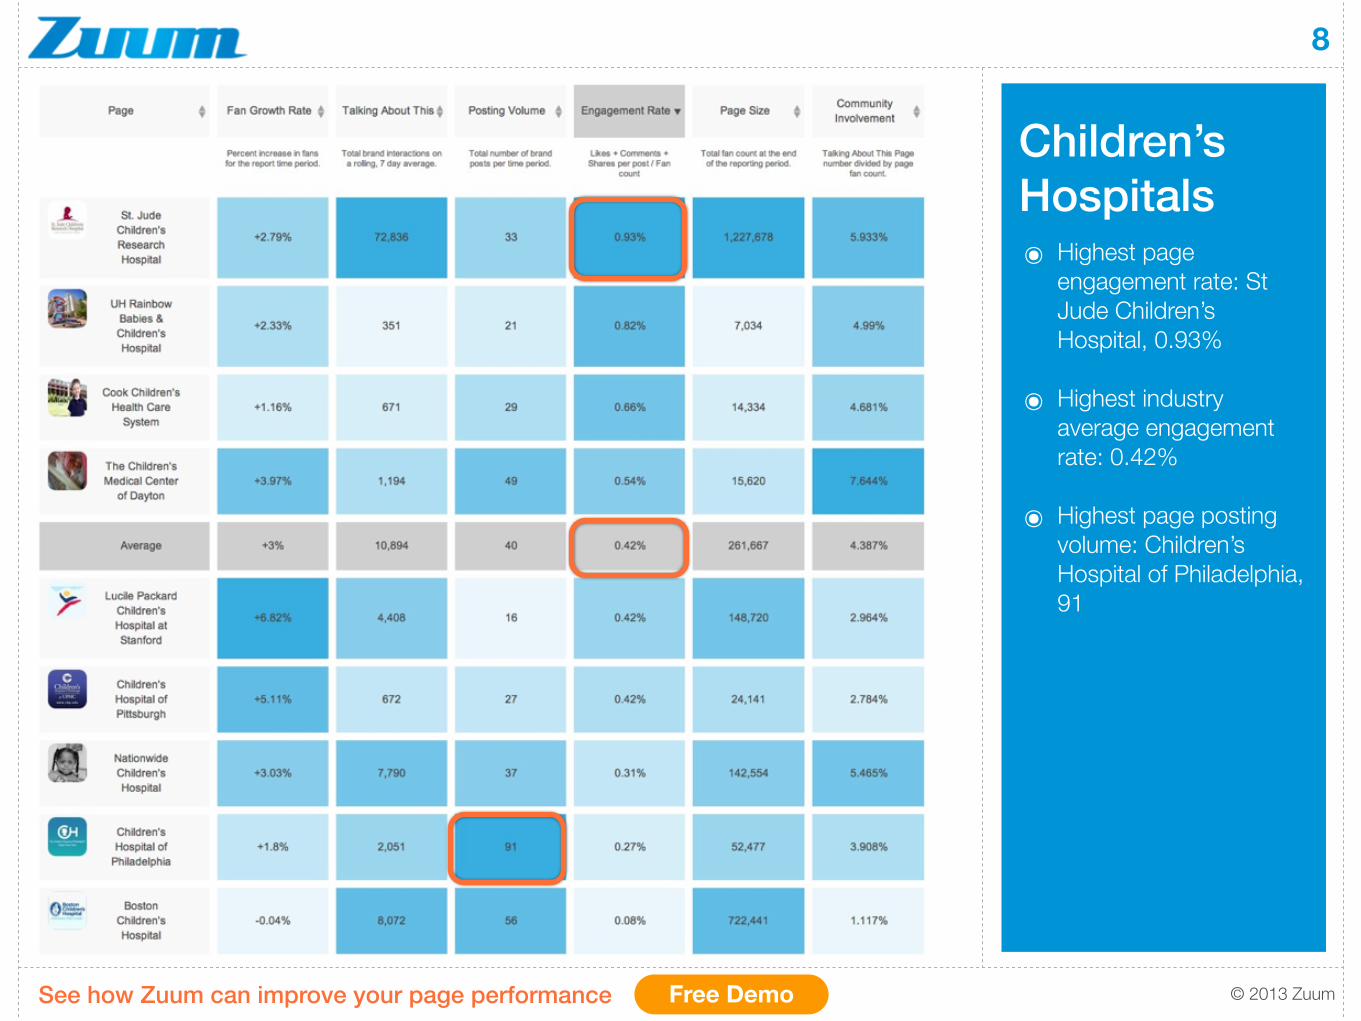
Children’s Hospitals
8
๏ Highest page engagement rate: St Jude Children’s Hospital, 0.93%
๏ Highest industry average engagement rate: 0.42%
๏ Highest page posting volume: Children’s Hospital of Philadelphia, 91
Free DemoSee how Zuum can improve your page performance
© 2013 Zuum
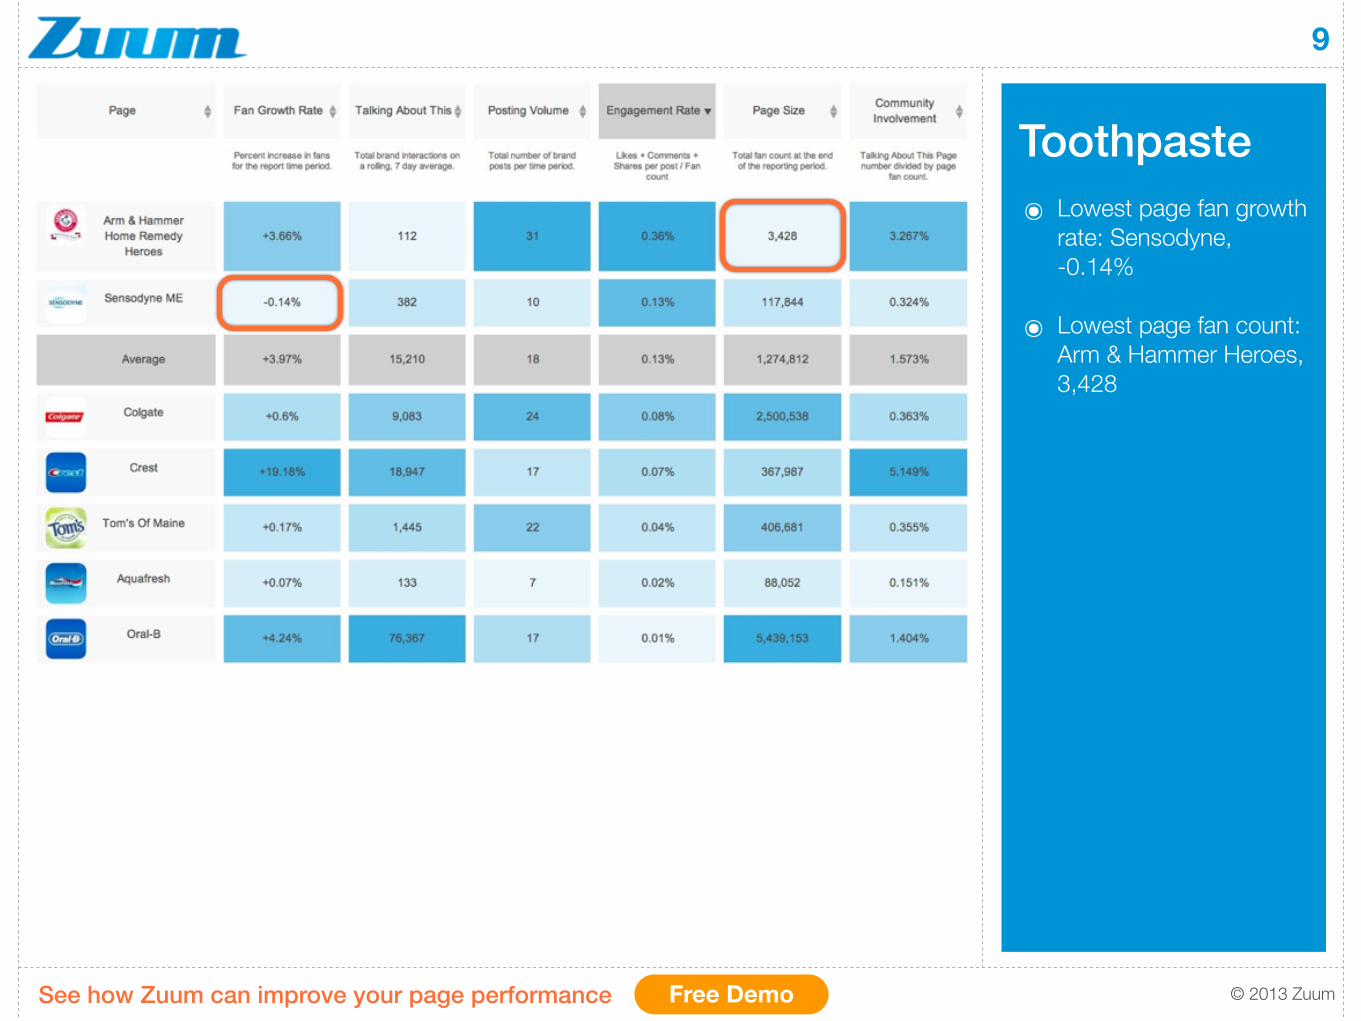
Toothpaste
9
๏ Lowest page fan growth rate: Sensodyne, -0.14%
๏ Lowest page fan count: Arm & Hammer Heroes, 3,428
Free DemoSee how Zuum can improve your page performance
© 2013 Zuum
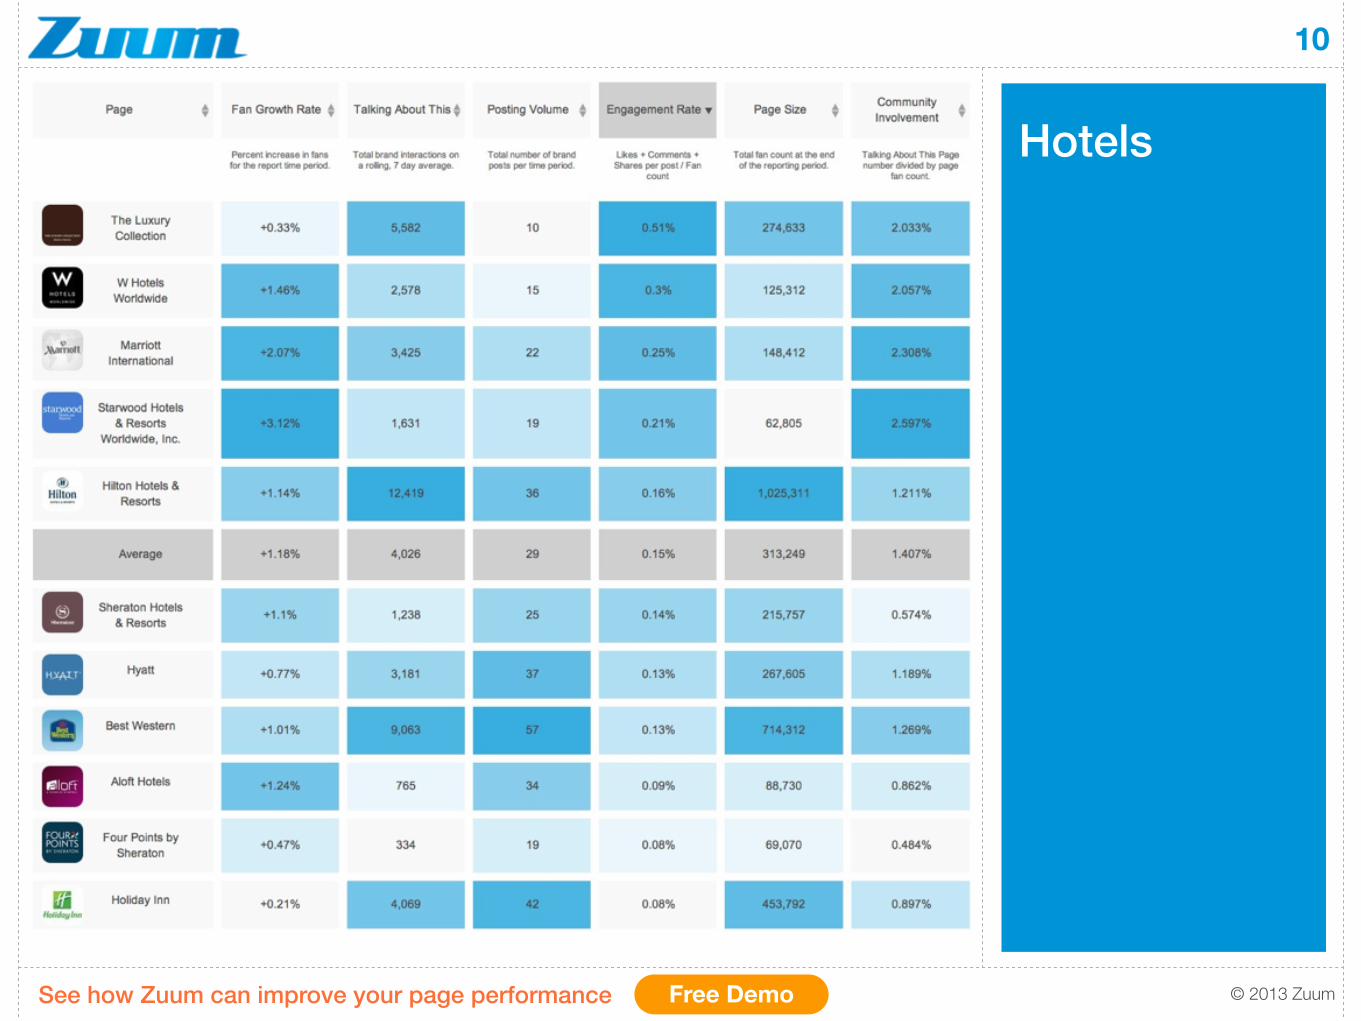
Hotels
10
Free DemoSee how Zuum can improve your page performance
© 2013 Zuum
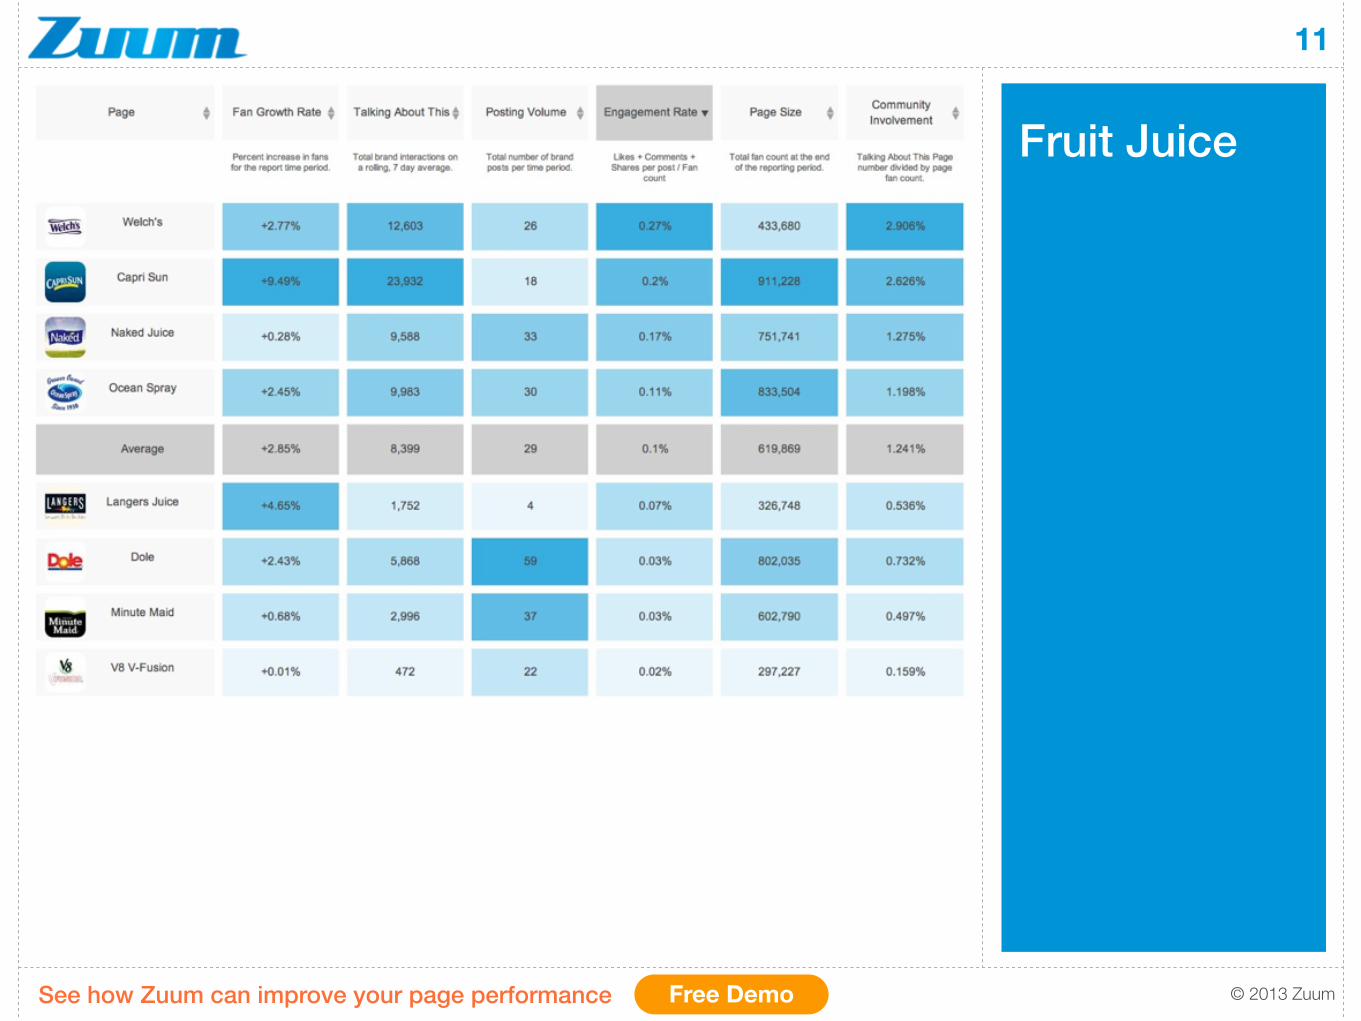
Fruit Juice
11
Free DemoSee how Zuum can improve your page performance
© 2013 Zuum
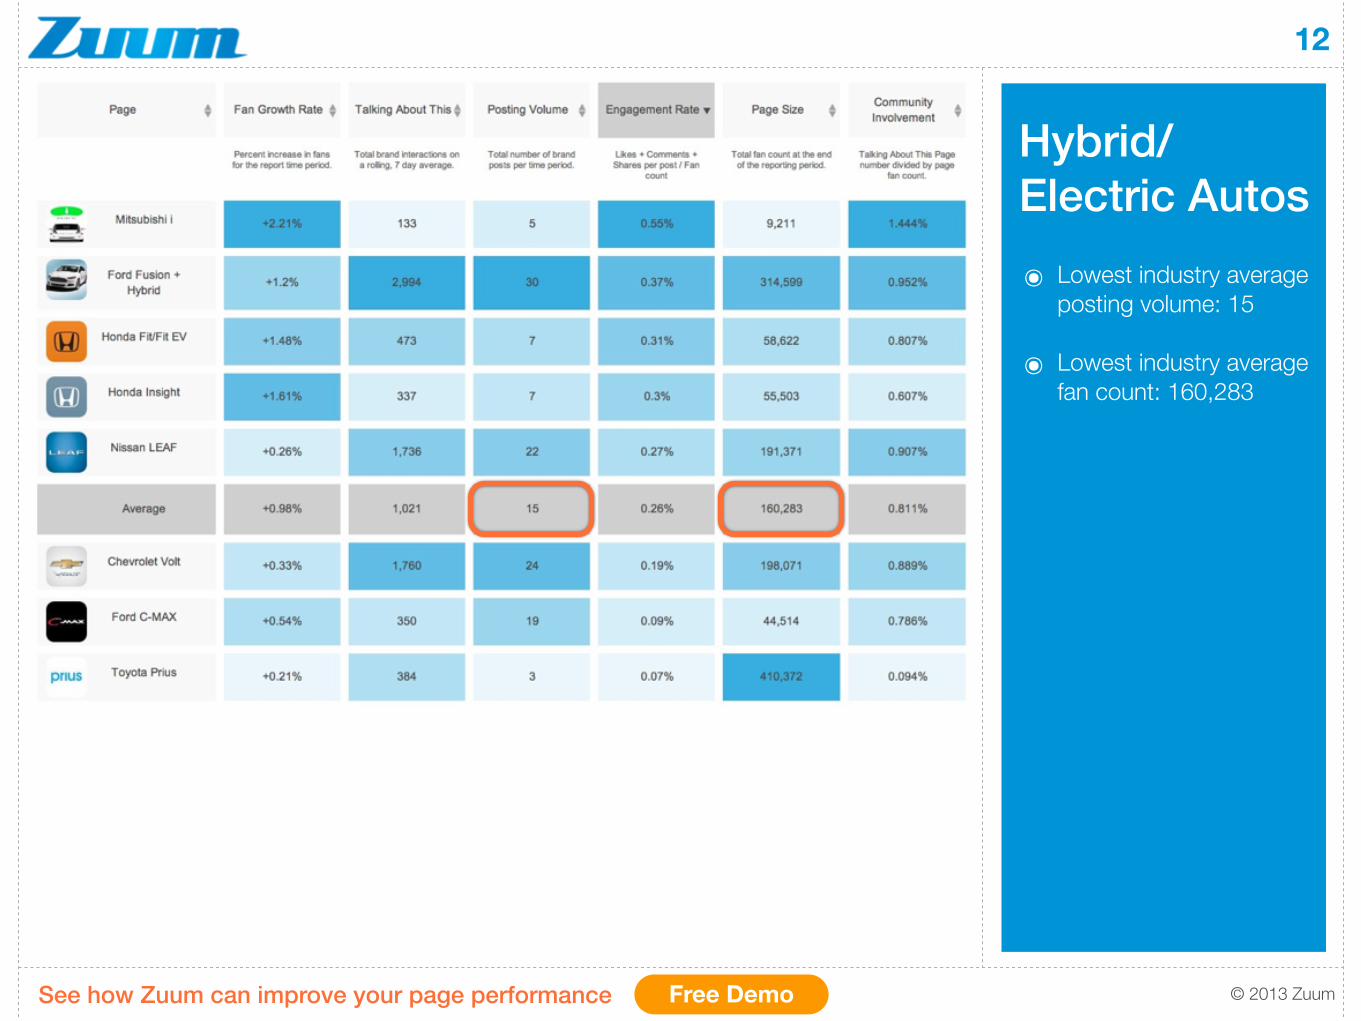
Hybrid/Electric Autos
12
๏ Lowest industry average posting volume: 15
๏ Lowest industry average fan count: 160,283
Free DemoSee how Zuum can improve your page performance
© 2013 Zuum
Key Takeaways
13
๏ Brands with large fan counts can gain fans rapidly (Twix)
๏ Industries with large fan counts can generate impressive engagement (Fast Food & Luxury Fashion)
๏ Only 2 of 90 pages experienced negative fan growth (Sensodyne & Children’s Hospital of Boston)
Free DemoSee how Zuum can improve your page performance
© 2013 Zuum
About This Report
14
Zuum frequently reports on the major trends and activities in social media for the leading consumer brands.
All data was gathered and analyzed using content strategy tool Zuum.
If you’d like to be notified when we publish reports like this one, please either follow us on any of our social media properties, or send us an email at [email protected] with “Reports” in the subject line.
Thank you,
Doug SchumacherCo-FounderZuum
© 2013 Zuum
A Social Media Strategy Tool
15
Zuum helps marketers maximize performance for their social media properties by showing them specifically what types of content drive the highest levels of engagement.
ZuumSocial.comFree DemoSee how Zuum can improve your page performance