Embed Size (px)
Citation preview

Visit web: www.tradenivesh.com
Call Us On : + 91-9039261444
Trade House 426 Alok Nagar, Kanadia Main Road Near Bangali Square
Indore-452001 (M.P.) India Mobile :+91-9039261444
E-mail: [email protected] Telephone :+91-731-698.3000
COMMODITY WEEKLY REPORT 9 TO 13 JAN. 2017 EQUITY WEEKLY REPORT 20 MAR.TO 24 MAR. 2017

Visit web: www.tradenivesh.com
Call Us On : + 91-9039261444
INDIAN MARKET WEEKLY OUTLOOK
INDIAN INDICES WEEKLY
INDICES CLOSE CHANGE (%)
NIFTY 50 8740.95 1.15
SENSEX 30 28240.52 1.28
NIFTY 500 6650.10 -10.8
NIFTY BANK 20196.80 2.48
NIFTY IT 10025.80 -1.53
NIFTY MIDCAP 16.035.20 2.52
NIFTY NEXT 50 23943.15 1.8
INDIAN SECTORIAL INDICES WEEKLY
INDICES CLOSE CHANGE (%)
NIFTY PHARMA 10555 1.81
NIFTY AUTO 9975.10 -0.39
NIFTY METAL 3128.70 0.61
NIFTY FMCG 22645.15 3.88
NIFTY INFRA 2930.20 2.01
NIFTY WEEKLY TOP GAINERS
SCRIPT CLOSE CHANGE (%)
IDEA CELLULAR 109.45 40.32
BANK OF BARODA 186.45 11.18
BHARTI AIRTEL 353.80 9.28
ITC 273.05 6.08
DR. REDDYS LAB 3144.55 5.01
GLOBAL INDICES WEEKLY
INDICES CLOSE CHANGE (%)
NASDAQ 5666.77 0.10
CAC 40 4825.42 -0.30
DAX 11651.49 -1.38
FTSE 100 7188.30 0.05
NIKKEI 18918.20 -2.82
HANG SENG 23129.21 -0.99
SHANGHAI COM. 3140.65 -0.58
INDIAN CURRENCY WEEKLY
CURRENCY CLOSE CHANGE (%)
USD-INR 67.32 1.04
EUR-INR 72.61 0.79
GBP-INR 84.21 0.477
JPY-INR 59.69 0.91
USD INDEX 100.56 -0.86
NIFTY WEEKLY TOP LOSERS
SCRIPT CLOSE CHANGE (%)
DR.REDDYS LAB 2976.05 -5.36
HINDALCO 191.75 -5.06
CIPLA -4.05
TATA MOTORS 522.60 -3.57
NTPC 171.95 -3.13
INDIAN INDICES WEEKLY
INDICES CLOSE CHANGE (%)
NIFTY 50 8793.55 0.6
SENSEX 30 28334.25 0.33
NIFTY 500 7631.25 14.75
NIFTY BANK 20213.90 0.08
NIFTY IT 10387.85 3.61
NIFTY MIDCAP 16227.70 1.2
NIFTY NEXT 50 24201.85 1.08
INDIAN SECTORIAL INDICES WEEKLY
INDICES CLOSE CHANGE (%)
NIFTY PHARMA 10542.60 -0.12
NIFTY AUTO 10028.05 0.53
NIFTY METAL 3084.65 -1.40
NIFTY FMCG 22874.95 1.01
NIFTY INFRA 3038.85 1.66
NIFTY WEEKLY TOP GAINERS
SCRIPT CLOSE CHANGE (%)
BHEL 158.00 10.72
TCS 2397.95 7.41
GRASIM INDUST. 1011.10 7.07
BHARTI INFRATEL 317.05 5.74
ZEE ENTERTAIN. 518.05 4.48
INDIAN MARKET WEEKLY OUTLOOK
INDIAN INDICES WEEKLY
INDICES CLOSE CHANGE (%)
NIFTY 50 9160.05 2.52
SENSEX 30 28946.23 0.18
NIFTY 500 7933.10 19.29
NIFTY BANK 21175.05 2.15
NIFTY IT 10900.75 1.40
NIFTY MIDCAP 16901.70 3.74
NIFTY NEXT 50 24914.80 3.62
INDIAN SECTORIAL INDICES WEEKLY
INDICES CLOSE CHANGE (%)
NIFTY PHARMA 10674.95 1.97
NIFTY AUTO 10009.40 2.35
NIFTY METAL 3127.50 3.05
NIFTY FMCG 23491.25 5.14
NIFTY INFRA 3066.25 2.64
NIFTY WEEKLY TOP GAINERS
SCRIPT CLOSE CHANGE (%)
ADANI PORTS 325.40 8.14
BHEL 168.65 7.08
TATA STEEL 469.45 6.98
ITC 281.25 6.15
HDFC 1451.20 5.81
GLOBAL INDICES WEEKLY
INDICES CLOSE CHANGE (%)
NASDAQ 5901.00 0.67
CAC 40 5029.24 0.71
DAX 12095.24 1.10
FTSE 100 7424.96 1.11
NIKKEI 19521.59 -0.42
HANG SENG 24309.93 3.14
SHANGHAI COM. 3237.31 0.77
INDIAN CURRENCY WEEKLY
CURRENCY CLOSE CHANGE (%)
USD-INR 65.57 -1.72
EUR-INR 70.50 -0.50
GBP-INR 81.09 -0.13
JPY-INR 57.96 0.12
USD INDEX 100.14 -1.22
NIFTY WEEKLY TOP LOSERS
SCRIPT CLOSE CHANGE (%)
COAL INDAI 289.25 -9.07
BHARTI AIRTEL 346.85 -3.71
GAIL INDIA 375.15 -1.08
TECH MAHINDRA 484.25 -0.96
POWER GRID COR 194.00 -0.01
Visit web: www.tradenivesh.com
Call Us On : + 91-9039261444
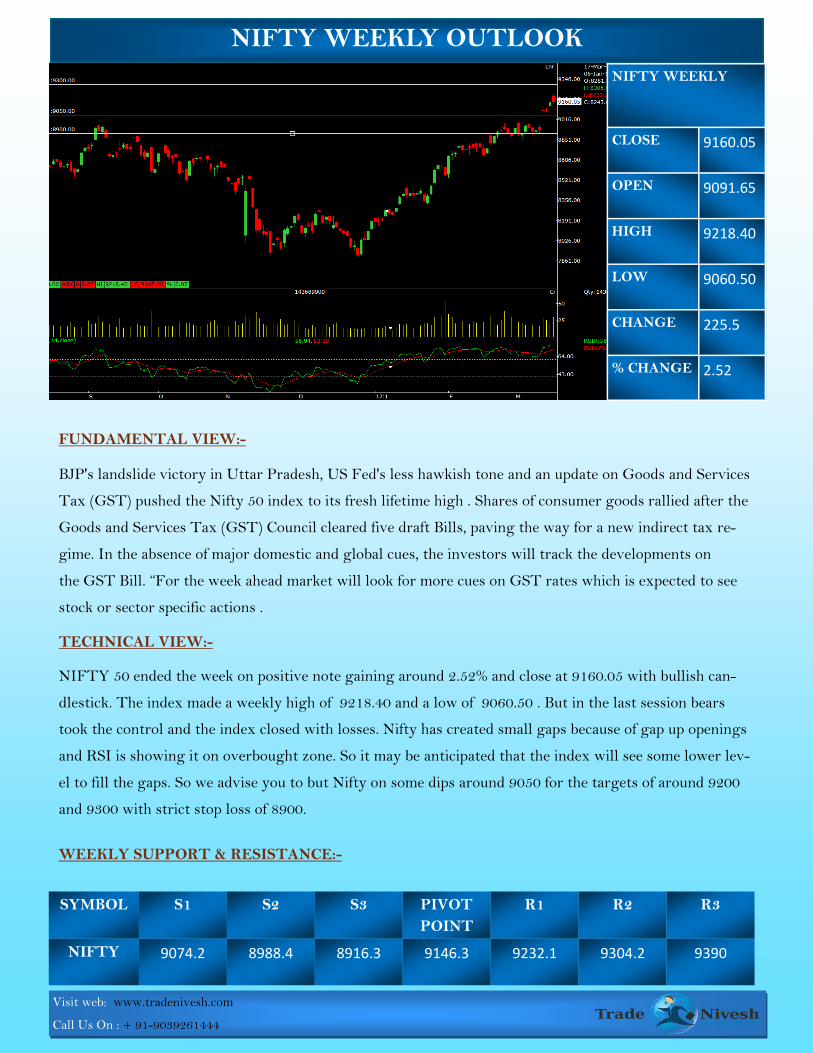
FUNDAMENTAL VIEW:-
BJP's landslide victory in Uttar Pradesh, US Fed's less hawkish tone and an update on Goods and Services
Tax (GST) pushed the Nifty 50 index to its fresh lifetime high . Shares of consumer goods rallied after the
Goods and Services Tax (GST) Council cleared five draft Bills, paving the way for a new indirect tax re-
gime. In the absence of major domestic and global cues, the investors will track the developments on
the GST Bill. “For the week ahead market will look for more cues on GST rates which is expected to see
stock or sector specific actions .
TECHNICAL VIEW:-
NIFTY 50 ended the week on positive note gaining around 2.52% and close at 9160.05 with bullish can-
dlestick. The index made a weekly high of 9218.40 and a low of 9060.50 . But in the last session bears
took the control and the index closed with losses. Nifty has created small gaps because of gap up openings
and RSI is showing it on overbought zone. So it may be anticipated that the index will see some lower lev-
el to fill the gaps. So we advise you to but Nifty on some dips around 9050 for the targets of around 9200
and 9300 with strict stop loss of 8900.
WEEKLY SUPPORT & RESISTANCE:-
NIFTY WEEKLY OUTLOOK
NIFTY WEEKLY
CLOSE 9160.05
OPEN 9091.65
HIGH 9218.40
LOW 9060.50
CHANGE 225.5
% CHANGE 2.52
SYMBOL S1 S2 S3 PIVOT
POINT
R1 R2 R3
NIFTY 9074.2 8988.4 8916.3 9146.3 9232.1 9304.2 9390
Visit web: www.tradenivesh.com
Call Us On : + 91-9039261444
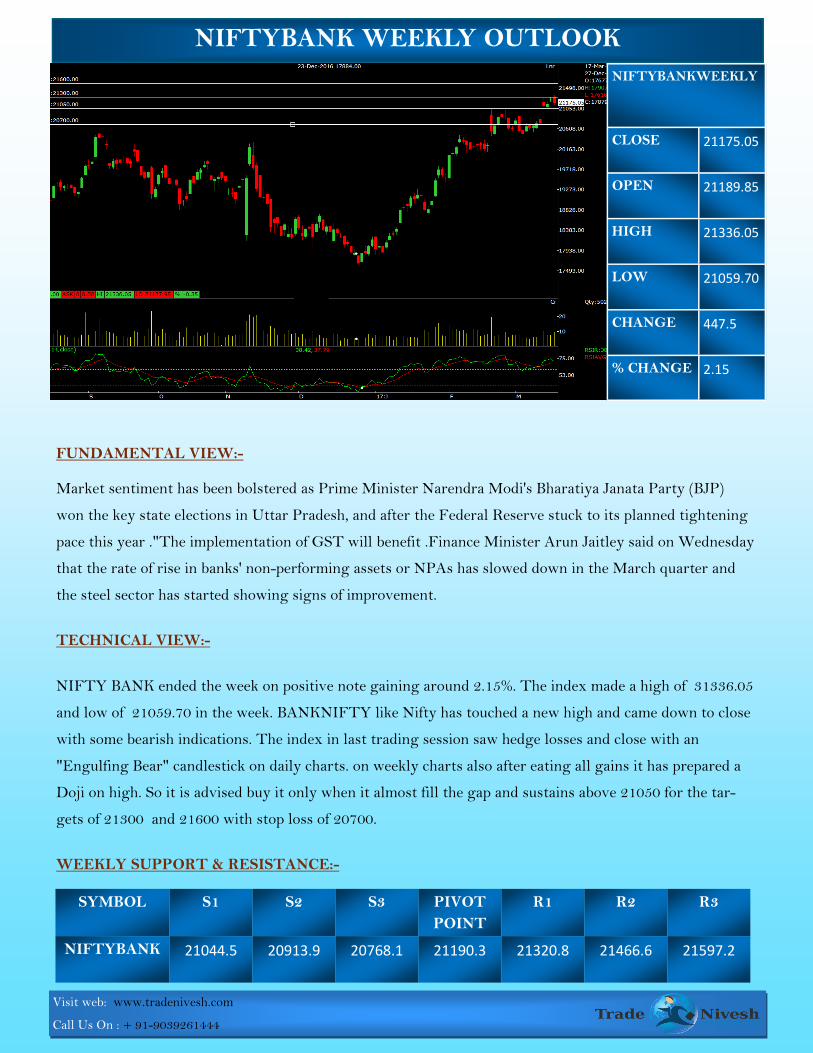
FUNDAMENTAL VIEW:-
Market sentiment has been bolstered as Prime Minister Narendra Modi's Bharatiya Janata Party (BJP)
won the key state elections in Uttar Pradesh, and after the Federal Reserve stuck to its planned tightening
pace this year ."The implementation of GST will benefit .Finance Minister Arun Jaitley said on Wednesday
that the rate of rise in banks' non-performing assets or NPAs has slowed down in the March quarter and
the steel sector has started showing signs of improvement.
TECHNICAL VIEW:-
NIFTY BANK ended the week on positive note gaining around 2.15%. The index made a high of 31336.05
and low of 21059.70 in the week. BANKNIFTY like Nifty has touched a new high and came down to close
with some bearish indications. The index in last trading session saw hedge losses and close with an
"Engulfing Bear" candlestick on daily charts. on weekly charts also after eating all gains it has prepared a
Doji on high. So it is advised buy it only when it almost fill the gap and sustains above 21050 for the tar-
gets of 21300 and 21600 with stop loss of 20700.
WEEKLY SUPPORT & RESISTANCE:-
NIFTYBANK WEEKLY OUTLOOK
SYMBOL S1 S2 S3 PIVOT
POINT
R1 R2 R3
NIFTYBANK 21044.5 20913.9 20768.1 21190.3 21320.8 21466.6 21597.2
NIFTYBANKWEEKLY
CLOSE 21175.05
OPEN 21189.85
HIGH 21336.05
LOW 21059.70
CHANGE 447.5
% CHANGE 2.15
Visit web: www.tradenivesh.com
Call Us On : + 91-9039261444
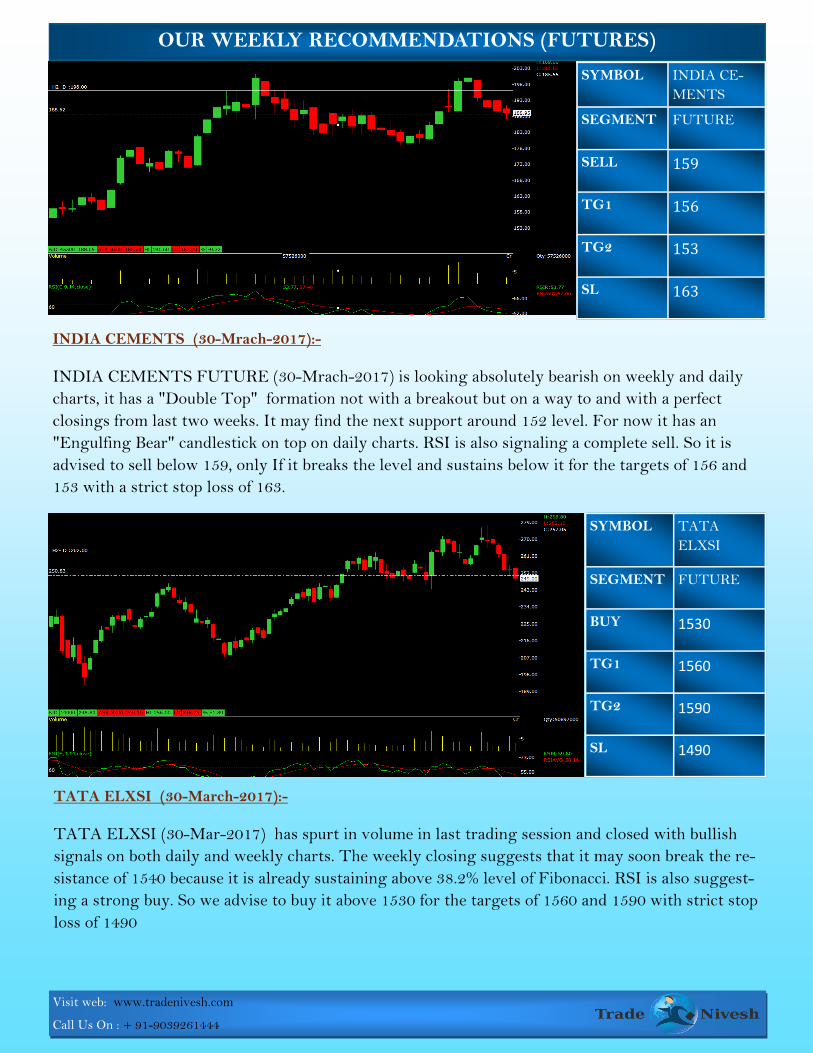
OUR WEEKLY RECOMMENDATIONS (FUTURES)
INDIA CEMENTS (30-Mrach-2017):-
INDIA CEMENTS FUTURE (30-Mrach-2017) is looking absolutely bearish on weekly and daily
charts, it has a "Double Top" formation not with a breakout but on a way to and with a perfect
closings from last two weeks. It may find the next support around 152 level. For now it has an
"Engulfing Bear" candlestick on top on daily charts. RSI is also signaling a complete sell. So it is
advised to sell below 159, only If it breaks the level and sustains below it for the targets of 156 and
153 with a strict stop loss of 163.
TATA ELXSI (30-March-2017):-
TATA ELXSI (30-Mar-2017) has spurt in volume in last trading session and closed with bullish
signals on both daily and weekly charts. The weekly closing suggests that it may soon break the re-
sistance of 1540 because it is already sustaining above 38.2% level of Fibonacci. RSI is also suggest-
ing a strong buy. So we advise to buy it above 1530 for the targets of 1560 and 1590 with strict stop
loss of 1490
SYMBOL TATA
ELXSI
SEGMENT FUTURE
BUY 1530
TG1 1560
TG2 1590
SL 1490
SYMBOL INDIA CE-
MENTS
SEGMENT FUTURE
SELL 159
TG1 156
TG2 153
SL 163

Visit web: www.tradenivesh.com
Call Us On : + 91-9039261444
OUR WEEKLY RECOMMENDATIONS (CASH)
M&M FINANCIALS :-
M&M FINANCIALS is looking good buy for this week, as even after breaking the immediate sup-
port, it will go upside . On RSI and MACD chart is moving upside . chart is showing uptrend after
breakout.
Buy M&M FINANCIALS above 312 for the targets of 325 and 345 maintain stop loss around 300.
TVS MOTORS :-
TVS MOTORS is good on chart and is showing upside trend with good volumes . On RSI and
MACD is looking upside move after breakout.
Buy TVS MOTORS above 443 keeping first target around 458 and final target around 480 , main-
taining a stop loss below 425.
SYMBOL TVS MO-
TORS
SEGMENT CASH
BUY 443
TG1 458
TG2 480
SL 425
SYMBOL M&M FI-
NANCE
SEGMENT CASH
BUY 312
TG1 325
TG2 345
SL 300
Visit web: www.tradenivesh.com
Call Us On : + 91-9039261444
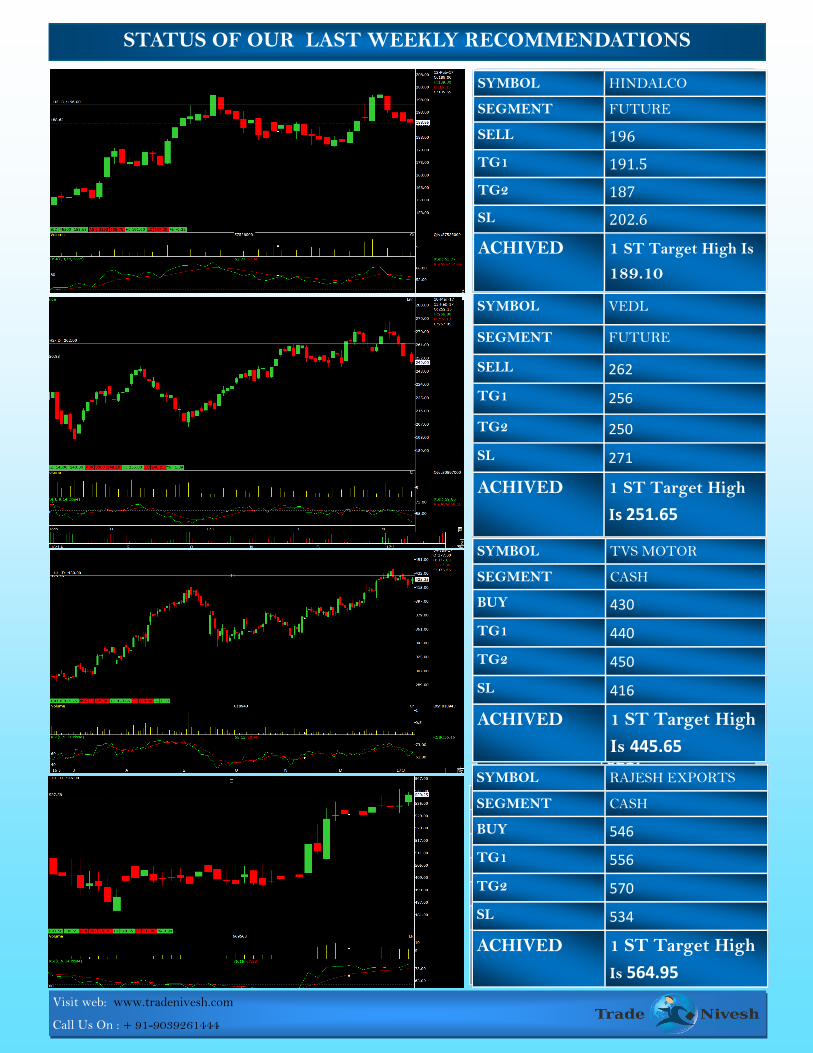
STATUS OF OUR LAST WEEKLY RECOMMENDATIONS
SYMBOL MARUTI SUZUKI
SEGMENT CASH
ENTRY 5980
TG1 6200
TG2 6500
SL 5700
ACHIVED 6200and High is
6217
SYMBOL TIMKEN INDIA
SEGMENT CASH
ENTRY 670
TG1 710
TG2 760
SL 645
ACHIVED 645 and Low is
602
SYMBOL INDIA BULLS REAL ESTATE
SEGMENT Future
ENTRY 78.30
TG1 76.50
TG2 74
SL 79.50
ACHIVED 74 and High is
74.95
SYMBOL ACC
SEGMENT Future
ENTRY 1420
TG1 1455
TG2 1500
SL 1360
ACHIVED 1455 and High is
1473
STATUS OF OUR LAST WEEKLY RECOMMENDATIONS
SYMBOL TVS MOTOR
SEGMENT CASH
BUY 430
TG1 440
TG2 450
SL 416
ACHIVED 1 ST Target High
Is 445.65
SYMBOL RAJESH EXPORTS
SEGMENT CASH
BUY 546
TG1 556
TG2 570
SL 534
ACHIVED 1 ST Target High
Is 564.95
SYMBOL VEDL
SEGMENT FUTURE
SELL 262
TG1 256
TG2 250
SL 271
ACHIVED 1 ST Target High
Is 251.65
SYMBOL HINDALCO
SEGMENT FUTURE
SELL 196
TG1 191.5
TG2 187
SL 202.6
ACHIVED 1 ST Target High Is
189.10

Visit web: www.tradenivesh.com
Call Us On : + 91-9039261444
STOCKS IN NEWS
TECH MAHINDRA -
IT major Tech Mahindra and Huawei on Friday signed a global partnership agreement under which Tech Mahindra will market Huawei's enterprise products and services across 44 countries, including in India. The alliance would also involve launching a joint go-to-market (GTM) strategy, thus giving a boost to the competitiveness of both companies in the global marketplace, by leverag-ing each other's core strengths. "This partnership enables us to implement our unique solutions along with Huawei's innovations and latest ICT infrastructure to bring faster ROI for our customers," Manoj Chugh, President, Enterprise Business at Tech Mahindra, said in a statement. .
KOTAK MAHINDRABANK :-
Kotak Mahindra Bank today said it will seek shareholders' approval to raise foreign investment limit to up to 49 per cent from existing 42 per cent.The board of directors' meeting held today granted consent to seek approval of shareholders to increase ceil-ing on total shareholding of FIIs/FPIs to up to 49 per cent of the paid up capital, the bank said in a BSE filing. Earlier this month, Kotak Mahindra Bank raised investment limit by foreign institutional investors(FIIs)/foreign portfolio inves-tors (FPIs) to 42 per cent from 40 per cent previously. Foreign investors are allowed to invest up to 74 per cent in an Indian private sector bank through direct or portfolio investment. .
ADANI GROUP:-
Adani group on Friday said Queensland premier Annastacia Palaszczuk has reaffirmed her government's committment to the $16.5 billion Carmichael mine project in the Australian province.. "Adani Group, a global integrated infrastructure conglomerate, today hosted a high-level delegation led by Annastacia Palaszczuk, Premier of Queensland, Australia, at Mundra Port who reaf-firmed Queensland government's commitment to the $16.5 billion Carmichael mine project," the group said in a statement. The statement came a day after cricket legends Ian and Greg Chappell and few other prominent Australians urging Adani Group Chairman Gautam Adani to abandon the mine project. The group, however, rejected the demand and said it was "motivated" by a very small group of "misled" people. .
TORRENT POWER :-
Torrent Power on Friday said its shareholders have approved a proposal to raise up to Rs 1,500 crore through issuance of secured,
redeemable, non-convertible debentures (NCDs).
"The special resolution to approve issuance of Secured, Redeemable, Non-Convertible Debentures (NCDs) not exceeding Rs 1,500
crore at par, on a private placement basis within the overall borrowing limits of the company has been approved by the majority
vote," Torrent Power said in a BSE filing on Friday. .
RELIANCE CAPITAL :-
Reliance Capital is eyeing large capital gains from sale of non-core investments by March next year and its Executive Director
Anmol Ambani has favoured a 'digital transformation' to serve new-age customers.
"India and China are the largest digital markets in the world, and Reliance Capital intends to 'go digital' in all its businesses to
serve the new age customers," Anmol said while addressing analysts along with his father and chairman Anil Ambani on business
plans of Reliance Capital.
SUN PHARMACEUTICAL -
Sun Pharmaceutical Industries today said an indirect arm of its group firm Taro will fully acquire Canada's Thallion Pharmaceuti-cals for 2.7 million Canadian dollar. Taro Pharmaceuticals Inc (Canada) has entered into an agreement to acquire all of the issued and outstanding shares of Thallion Pharmaceuticals, a Canadian pharmaceutical corporation, Sun Pharma said in a regulatory fil-ing. The cost of all-cash acquisition will be Canadian dollar 2.3 million with an additional amount of Canadian dollar 0.4 million due at the completion of an additional pre-clinical animal study or April 1, 2019, it added .
JET AIRWAYS :-
As competition among airlines in the Indian market takes a new turn, Jet Airways is offering flyers "guaranteed JPMiles" and a chance to win daily prizes of 100,000 JPMiles on every flight under 'The Billion Miles Festival'. This special scheme is applicable on bookings made on Jet Airways' website or mobile app before March 31, 2017 for travel up to May 31, 2017, the airline - which competes with the likes of Air India, IndiGo, SpiceJet and AirAsia in the domestic market - said on its website. Terming its scheme a "big opportunity", Jet Airways said a million JPMiles is "equal to redeeming 10 return trips between Mumbai and Lon-don or 100 return trips between Mumbai and Goa, simply using your JPMiles".
Visit web: www.tradenivesh.com
Call Us On : + 91-9039261444
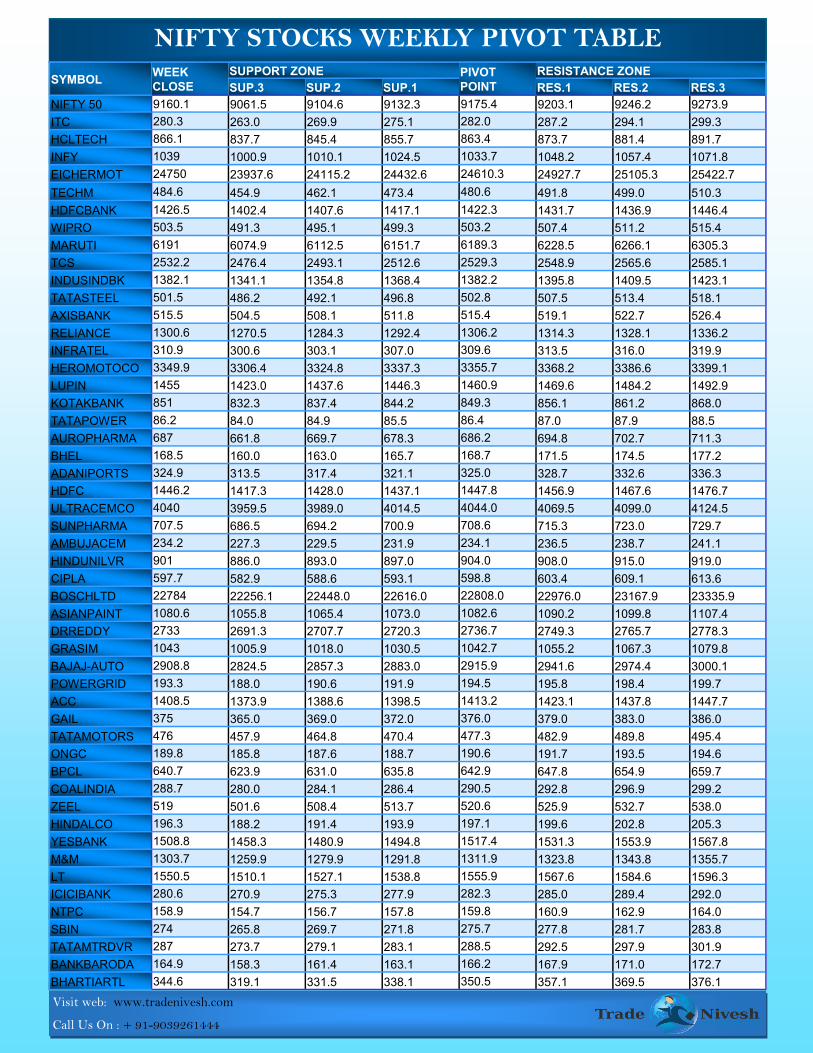
NIFTY STOCKS WEEKLY PIVOT TABLE
SYMBOL WEEK
CLOSE
SUPPORT ZONE PIVOT
POINT
RESISTANCE ZONE
SUP.3 SUP.2 SUP.1 RES.1 RES.2 RES.3
NIFTY 50 9160.1 9061.5 9104.6 9132.3 9175.4 9203.1 9246.2 9273.9
ITC 280.3 263.0 269.9 275.1 282.0 287.2 294.1 299.3
HCLTECH 866.1 837.7 845.4 855.7 863.4 873.7 881.4 891.7
INFY 1039 1000.9 1010.1 1024.5 1033.7 1048.2 1057.4 1071.8
EICHERMOT 24750 23937.6 24115.2 24432.6 24610.3 24927.7 25105.3 25422.7
TECHM 484.6 454.9 462.1 473.4 480.6 491.8 499.0 510.3
HDFCBANK 1426.5 1402.4 1407.6 1417.1 1422.3 1431.7 1436.9 1446.4
WIPRO 503.5 491.3 495.1 499.3 503.2 507.4 511.2 515.4
MARUTI 6191 6074.9 6112.5 6151.7 6189.3 6228.5 6266.1 6305.3
TCS 2532.2 2476.4 2493.1 2512.6 2529.3 2548.9 2565.6 2585.1
INDUSINDBK 1382.1 1341.1 1354.8 1368.4 1382.2 1395.8 1409.5 1423.1
TATASTEEL 501.5 486.2 492.1 496.8 502.8 507.5 513.4 518.1
AXISBANK 515.5 504.5 508.1 511.8 515.4 519.1 522.7 526.4
RELIANCE 1300.6 1270.5 1284.3 1292.4 1306.2 1314.3 1328.1 1336.2
INFRATEL 310.9 300.6 303.1 307.0 309.6 313.5 316.0 319.9
HEROMOTOCO 3349.9 3306.4 3324.8 3337.3 3355.7 3368.2 3386.6 3399.1
LUPIN 1455 1423.0 1437.6 1446.3 1460.9 1469.6 1484.2 1492.9
KOTAKBANK 851 832.3 837.4 844.2 849.3 856.1 861.2 868.0
TATAPOWER 86.2 84.0 84.9 85.5 86.4 87.0 87.9 88.5
AUROPHARMA 687 661.8 669.7 678.3 686.2 694.8 702.7 711.3
BHEL 168.5 160.0 163.0 165.7 168.7 171.5 174.5 177.2
ADANIPORTS 324.9 313.5 317.4 321.1 325.0 328.7 332.6 336.3
HDFC 1446.2 1417.3 1428.0 1437.1 1447.8 1456.9 1467.6 1476.7
ULTRACEMCO 4040 3959.5 3989.0 4014.5 4044.0 4069.5 4099.0 4124.5
SUNPHARMA 707.5 686.5 694.2 700.9 708.6 715.3 723.0 729.7
AMBUJACEM 234.2 227.3 229.5 231.9 234.1 236.5 238.7 241.1
HINDUNILVR 901 886.0 893.0 897.0 904.0 908.0 915.0 919.0
CIPLA 597.7 582.9 588.6 593.1 598.8 603.4 609.1 613.6
BOSCHLTD 22784 22256.1 22448.0 22616.0 22808.0 22976.0 23167.9 23335.9
ASIANPAINT 1080.6 1055.8 1065.4 1073.0 1082.6 1090.2 1099.8 1107.4
DRREDDY 2733 2691.3 2707.7 2720.3 2736.7 2749.3 2765.7 2778.3
GRASIM 1043 1005.9 1018.0 1030.5 1042.7 1055.2 1067.3 1079.8
BAJAJ-AUTO 2908.8 2824.5 2857.3 2883.0 2915.9 2941.6 2974.4 3000.1
POWERGRID 193.3 188.0 190.6 191.9 194.5 195.8 198.4 199.7
ACC 1408.5 1373.9 1388.6 1398.5 1413.2 1423.1 1437.8 1447.7
GAIL 375 365.0 369.0 372.0 376.0 379.0 383.0 386.0
TATAMOTORS 476 457.9 464.8 470.4 477.3 482.9 489.8 495.4
ONGC 189.8 185.8 187.6 188.7 190.6 191.7 193.5 194.6
BPCL 640.7 623.9 631.0 635.8 642.9 647.8 654.9 659.7
COALINDIA 288.7 280.0 284.1 286.4 290.5 292.8 296.9 299.2
ZEEL 519 501.6 508.4 513.7 520.6 525.9 532.7 538.0
HINDALCO 196.3 188.2 191.4 193.9 197.1 199.6 202.8 205.3
YESBANK 1508.8 1458.3 1480.9 1494.8 1517.4 1531.3 1553.9 1567.8
M&M 1303.7 1259.9 1279.9 1291.8 1311.9 1323.8 1343.8 1355.7
LT 1550.5 1510.1 1527.1 1538.8 1555.9 1567.6 1584.6 1596.3
ICICIBANK 280.6 270.9 275.3 277.9 282.3 285.0 289.4 292.0
NTPC 158.9 154.7 156.7 157.8 159.8 160.9 162.9 164.0
SBIN 274 265.8 269.7 271.8 275.7 277.8 281.7 283.8
TATAMTRDVR 287 273.7 279.1 283.1 288.5 292.5 297.9 301.9
BANKBARODA 164.9 158.3 161.4 163.1 166.2 167.9 171.0 172.7
BHARTIARTL 344.6 319.1 331.5 338.1 350.5 357.1 369.5 376.1
Visit web: www.tradenivesh.com
Call Us On : + 91-9039261444
This document is solely for the personal information of the recipient, and must not be singularly used as the
basis of any investment decision. Nothing in this document should be construed as investment or financial
advice. Each recipient of this document should make such investigations as they deem necessary to arrive at
an independent evaluation of an investment in the securities of the companies referred to in this document
including the merits and risks involved, and should consult their own advisors to determine the merits and
risks of such an investment.
Reports based on technical and derivative analysis center on studying charts of a stock's price movement,
outstanding positions and trading volume. The information in this document has been printed on the basis
of publicly available information, internal data and other reliable sources believed to be true, but we do not
represent that it is accurate or complete and it should not be relied on as such, as this document is for gen-
eral guidance only. Trade Nivesh shall not be in any way responsible for any loss or damage that may arise
to any person from any inadvertent error in the information contained in this report. Trade Nivesh has not
independently verified all the information contained within this document. Accordingly, we cannot testify,
nor make any representation or warranty, express or implied, to the accuracy, contents or data contained
within this document. While Trade Nivesh endeavors to update on a reasonable basis the information dis-
cussed in this material, there may be regulatory, compliance, or other reasons that prevent us from doing so.
Investment in equity & Commodity market has its own risks. We Trade Nivesh shall not be liable or re-
sponsible for any loss or damage that may arise from the use of this information.
DISCLAIMER