Embed Size (px)
DESCRIPTION
CapitalHeight Financial Services is a Stock Advisory Company, having a strong hold in providing most authentic and accurate Equity Tips as well as Commodity Tips. We are a team of highly qualified analysts, who deliver their expertise in providing stock market calls for traders which include Stock Tips, Commodity Tips, MCX Tips, Equity Tips and Intraday Tips. http://www.capitalheight.com
Citation preview

Weekly Newsletter28/03/2011
Weekly Newsletter-Equity
www.Capitalheight.com
Capitalheight.com
www.capitalheight.com
capitalheight.wordpress.com
Phone- (0731)4295950
Weekly Newsletter
Contents
Market Wrap
Market Performance
NSE Gainers
NSE Losers
NIFTY Five Days Up
World Indices
Indian Equity Market
Technical Analysis
Nifty Spot
Bank Nifty Future
www.capitalheight.com
capitalheight.wordpress.com
Phone- (0731)4295950
MARKET WRAP
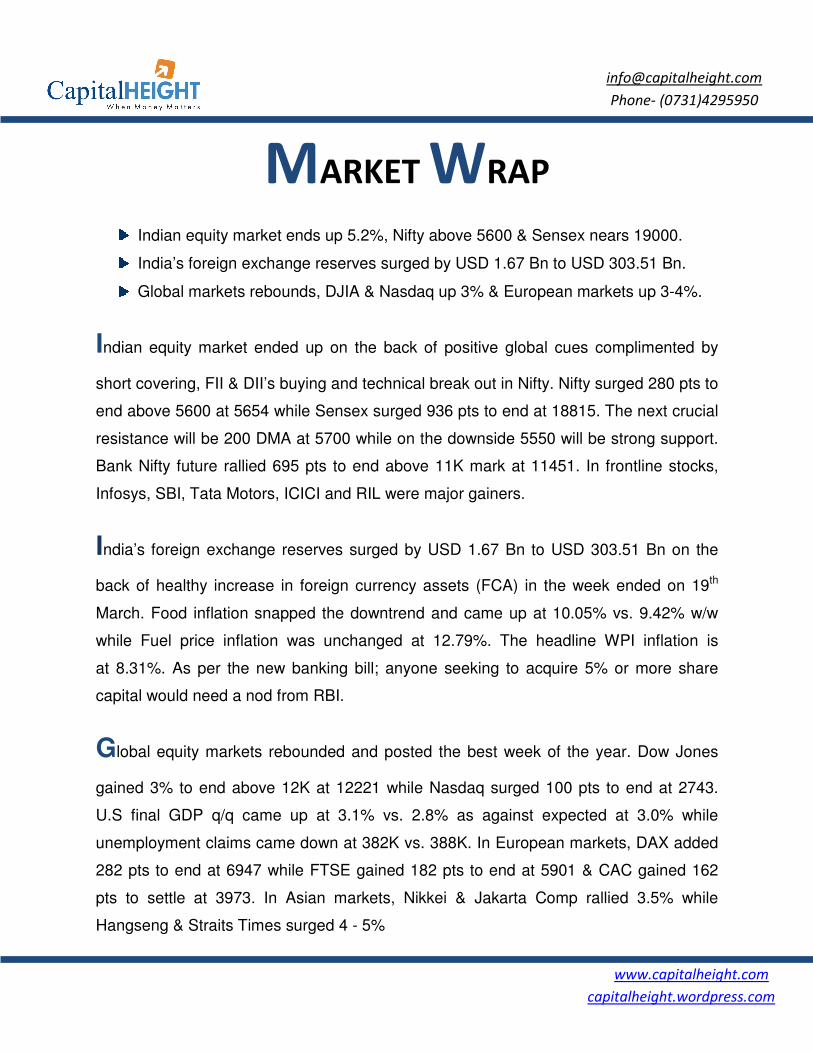
Indian equity market ends up 5.2%, Nifty above 5600 & Sensex nears 19000.
India’s foreign exchange reserves surged by USD 1.67 Bn to USD 303.51 Bn.
Global markets rebounds, DJIA & Nasdaq up 3% & European markets up 3-4%.
Indian equity market ended up on the back of positive global cues complimented by
short covering, FII & DII’s buying and technical break out in Nifty. Nifty surged 280 pts to
end above 5600 at 5654 while Sensex surged 936 pts to end at 18815. The next crucial
resistance will be 200 DMA at 5700 while on the downside 5550 will be strong support.
Bank Nifty future rallied 695 pts to end above 11K mark at 11451. In frontline stocks,
Infosys, SBI, Tata Motors, ICICI and RIL were major gainers.
India’s foreign exchange reserves surged by USD 1.67 Bn to USD 303.51 Bn on the
back of healthy increase in foreign currency assets (FCA) in the week ended on 19th
March. Food inflation snapped the downtrend and came up at 10.05% vs. 9.42% w/w
while Fuel price inflation was unchanged at 12.79%. The headline WPI inflation is
at 8.31%. As per the new banking bill; anyone seeking to acquire 5% or more share
capital would need a nod from RBI.
Global equity markets rebounded and posted the best week of the year. Dow Jones
gained 3% to end above 12K at 12221 while Nasdaq surged 100 pts to end at 2743.
U.S final GDP q/q came up at 3.1% vs. 2.8% as against expected at 3.0% while
unemployment claims came down at 382K vs. 388K. In European markets, DAX added
282 pts to end at 6947 while FTSE gained 182 pts to end at 5901 & CAC gained 162
pts to settle at 3973. In Asian markets, Nikkei & Jakarta Comp rallied 3.5% while
Hangseng & Straits Times surged 4 - 5%
www.capitalheight.com
capitalheight.wordpress.com
Phone- (0731)4295950
MARKET PERFORMANCE
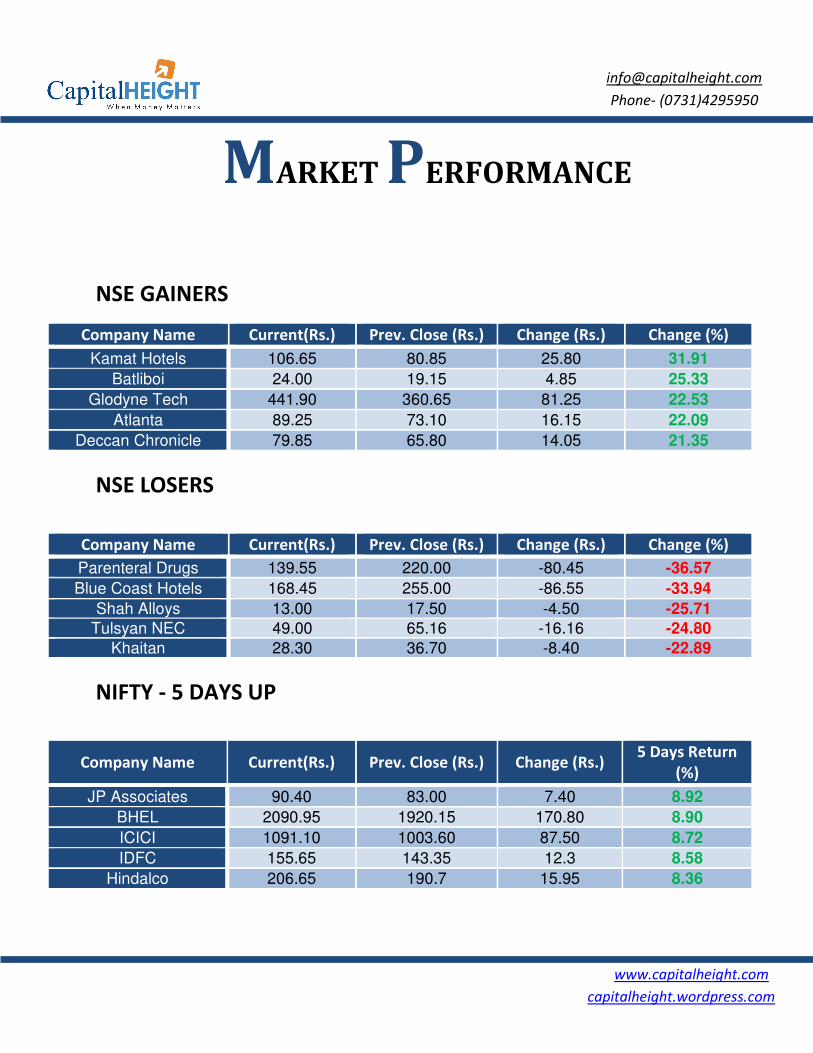
NSE GAINERS
Company Name Current(Rs.) Prev. Close (Rs.) Change (Rs.) Change (%)
Kamat Hotels 106.65 80.85 25.80 31.91
Batliboi 24.00 19.15 4.85 25.33
Glodyne Tech 441.90 360.65 81.25 22.53
Atlanta 89.25 73.10 16.15 22.09
Deccan Chronicle 79.85 65.80 14.05 21.35
NSE LOSERS
Company Name Current(Rs.) Prev. Close (Rs.) Change (Rs.) Change (%)
Parenteral Drugs 139.55 220.00 -80.45 -36.57
Blue Coast Hotels 168.45 255.00 -86.55 -33.94
Shah Alloys 13.00 17.50 -4.50 -25.71
Tulsyan NEC 49.00 65.16 -16.16 -24.80
Khaitan 28.30 36.70 -8.40 -22.89
NIFTY - 5 DAYS UP
Company Name Current(Rs.) Prev. Close (Rs.) Change (Rs.) 5 Days Return
(%)
JP Associates 90.40 83.00 7.40 8.92
BHEL 2090.95 1920.15 170.80 8.90
ICICI 1091.10 1003.60 87.50 8.72
IDFC 155.65 143.35 12.3 8.58
Hindalco 206.65 190.7 15.95 8.36
www.capitalheight.com
capitalheight.wordpress.com
Phone- (0731)4295950
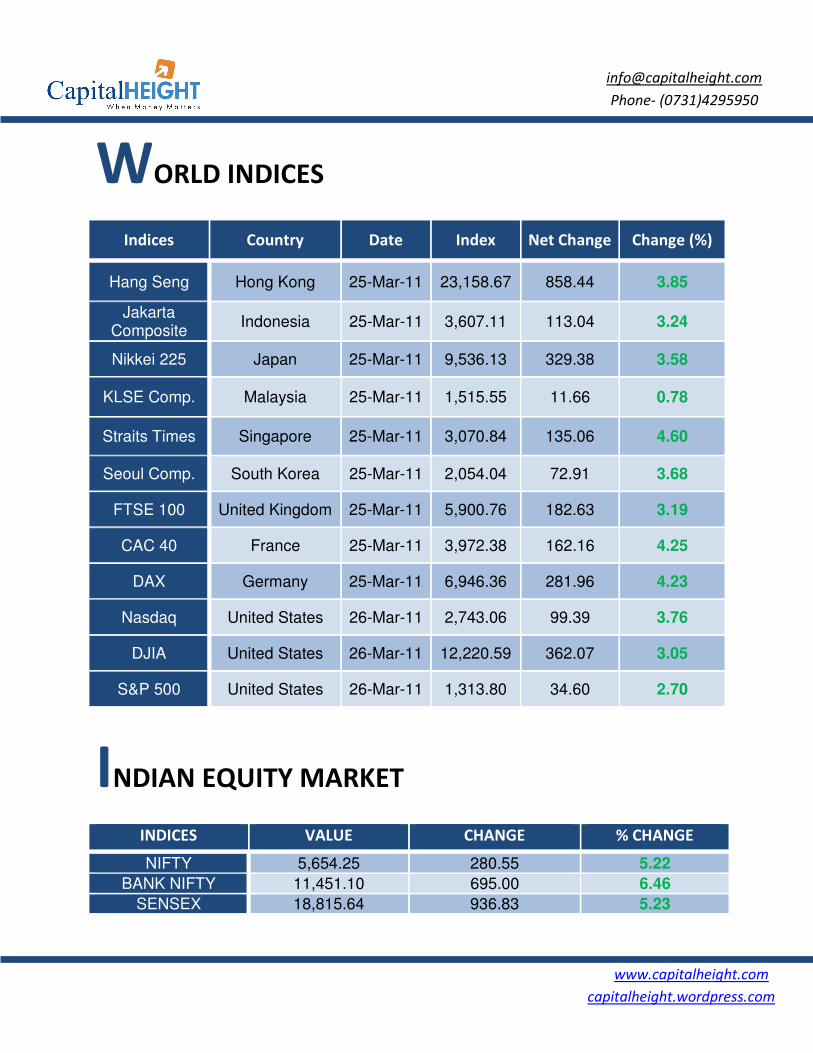
WORLD INDICES
Indices Country Date Index Net Change Change (%)
Hang Seng Hong Kong 25-Mar-11 23,158.67 858.44 3.85
Jakarta Composite
Indonesia 25-Mar-11 3,607.11 113.04 3.24
Nikkei 225 Japan 25-Mar-11 9,536.13 329.38 3.58
KLSE Comp. Malaysia 25-Mar-11 1,515.55 11.66 0.78
Straits Times Singapore 25-Mar-11 3,070.84 135.06 4.60
Seoul Comp. South Korea 25-Mar-11 2,054.04 72.91 3.68
FTSE 100 United Kingdom 25-Mar-11 5,900.76 182.63 3.19
CAC 40 France 25-Mar-11 3,972.38 162.16 4.25
DAX Germany 25-Mar-11 6,946.36 281.96 4.23
Nasdaq United States 26-Mar-11 2,743.06 99.39 3.76
DJIA United States 26-Mar-11 12,220.59 362.07 3.05
S&P 500 United States 26-Mar-11 1,313.80 34.60 2.70
INDIAN EQUITY MARKET
INDICES VALUE CHANGE % CHANGE
NIFTY 5,654.25 280.55 5.22
BANK NIFTY 11,451.10 695.00 6.46
SENSEX 18,815.64 936.83 5.23
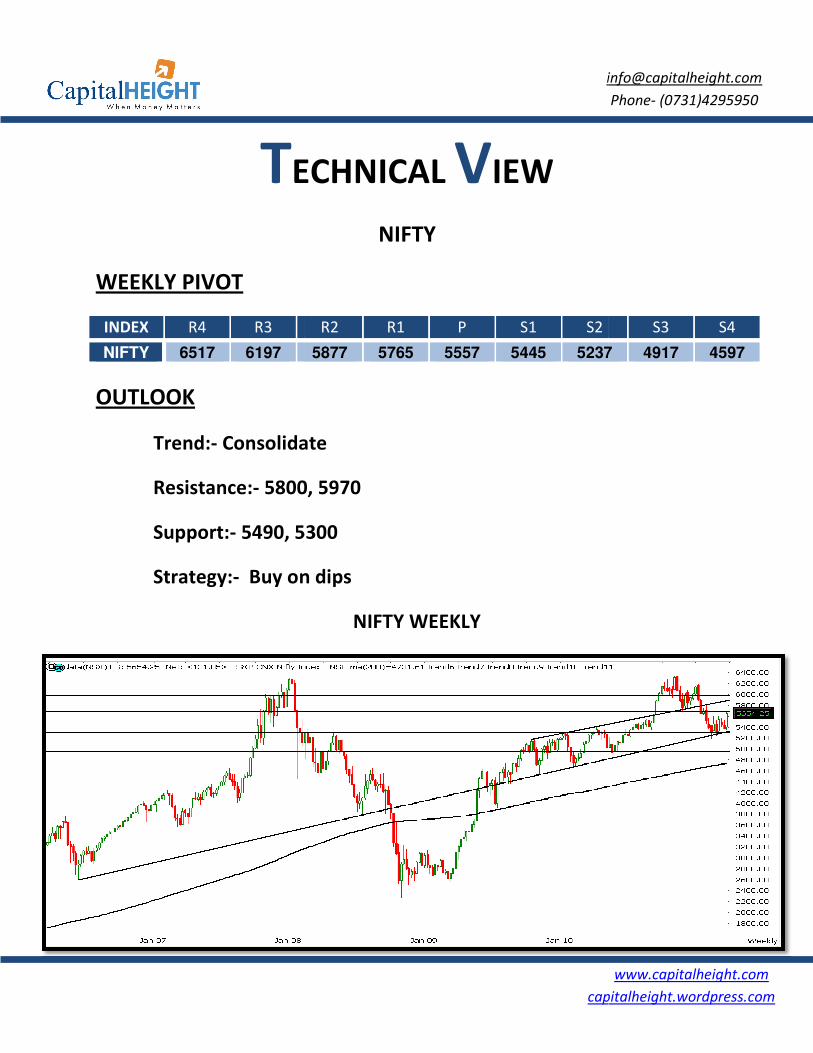
TECHNICAL
WEEKLY PIVOT
INDEX R4 R3
NIFTY 6517 6197
OUTLOOK
Trend:- Consolidate
Resistance:- 5800
Support:- 5490, 5
Strategy:- Buy on dips
capitalheight.wordpress.com
ECHNICAL VIEW
NIFTY
R2 R1 P S1 S2
5877 5765 5557 5445 5237
ate
800, 5970
5300
Buy on dips
NIFTY WEEKLY
www.capitalheight.com
capitalheight.wordpress.com
Phone- (0731)4295950
S3 S4
5237 4917 4597
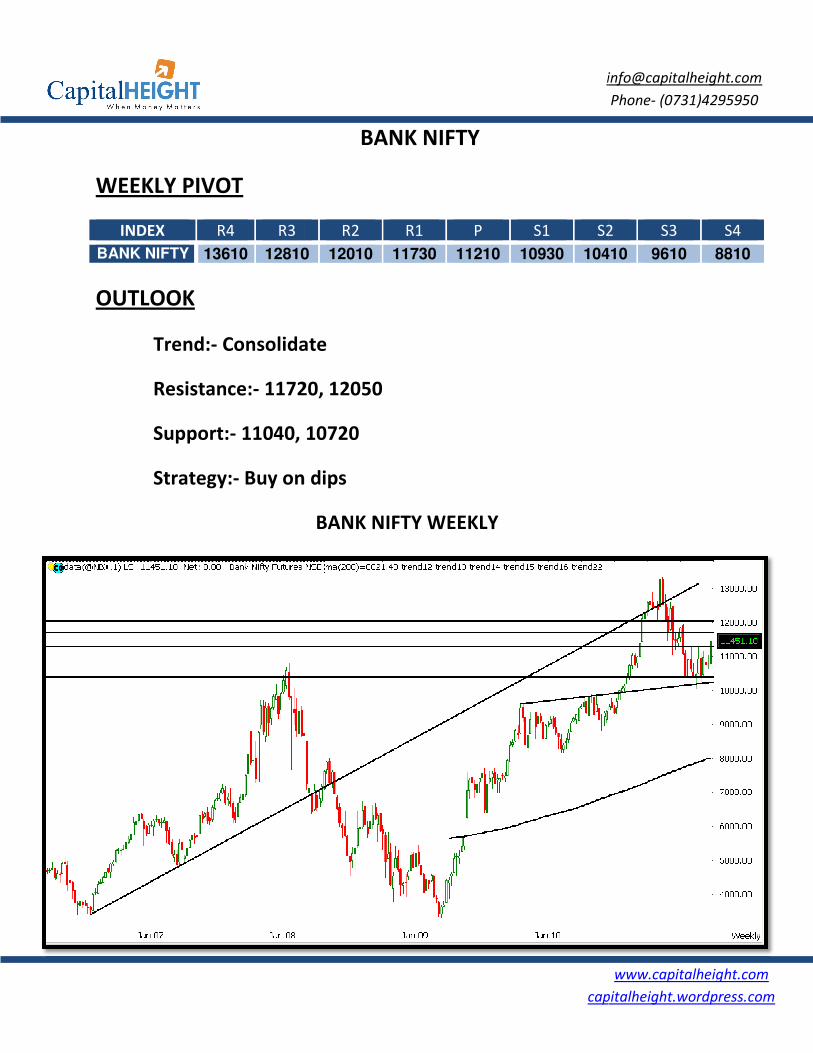
WEEKLY PIVOT
INDEX R4 R3
BANK NIFTY 13610 12810
OUTLOOK
Trend:- Consolidate
Resistance:- 11720
Support:- 11040,
Strategy:- Buy on dips
capitalheight.wordpress.com
BANK NIFTY
R2 R1 P S1 S2
12810 12010 11730 11210 10930 10410
Consolidate
720, 12050
, 10720
Buy on dips
BANK NIFTY WEEKLY
www.capitalheight.com
capitalheight.wordpress.com
Phone- (0731)4295950
S2 S3 S4
10410 9610 8810
www.capitalheight.com
capitalheight.wordpress.com
Phone- (0731)4295950
Disclaimer
The information and views in this report, our website & all the service we provide are believed to be reliable, but we do not
accept any responsibility (or liability) for errors of fact or opinion. Users have the right to choose the product/s that suits
them the most.
Sincere efforts have been made to present the right investment perspective. The information contained herein is based on
analysis and up on sources that we consider reliable.
This material is for personal information and based upon it & takes no responsibility
The information given herein should be treated as only factor, while making investment decision. The report does not
provide individually tailor-made investment advice. Capitalheight recommends that investors independently evaluate
particular investments and strategies, and encourages investors to seek the advice of a financial adviser. Capitalheight shall
not be responsible for any transaction conducted based on the information given in this report, which is in violation of rules
and regulations of NSE and BSE.
The share price projections shown are not necessarily indicative of future price performance. The information herein,
together with all estimates and forecasts, can change without notice. Analyst or any person related to Capitalheight might be
holding positions in the stocks recommended. It is understood that anyone who is browsing through the site has done so at
his free will and does not read any views expressed as a recommendation for which either the site or its owners or
anyone can be held responsible for . Any surfing and reading of the information is the acceptance of this disclaimer.
All Rights Reserved.
Investment in Commodity and equity market has its own risks.
We, however, do not vouch for the accuracy or the completeness thereof. we are not responsible for any loss incurred
whatsoever for any financial profits or loss which may arise from the recommendations above. Capitalheight does not
purport to be an invitation or an offer to buy or sell any financial instrument. Our Clients (Paid Or Unpaid), Any third party or
anyone else have no rights to forward or share our calls or SMS or Report or Any Information Provided by us to/with anyone
which is received directly or indirectly by them. If found so then Serious Legal Actions can be taken.