Embed Size (px)
Citation preview

Feed efficiency: Measuring, Genetic Trends, and Current
State of the Industry
Pedro E. Urriola, DVM PhDDepartment of Animal Sciences
University of Minnesota

Feed efficiency
• Unit of output divided by unit of input
• How to express this efficiency?
Feed Animal
Input Output What it measures
Mass, kg of feed Mass, kg live weight Efficiency of growth
Mass, kg of feed Mass, kg of carcass Efficiency of pork
Energy, kcal of NE Mass, kg of carcass Nutritional efficiency

Feed efficiency
“Feed efficiency is a good thing to measure, but terrible driver of decision making” quoting Steve Pollmann

Different ways of expressing and looking at efficiency
0.320
0.325
0.330
0.335
0.340
0.345
0.350
0.355
CSB WM DDGS WM+DDGS
Effi
cien
cy
Diets
Gain:feed HCW:feed Linear (Gain:feed) Linear (HCW:feed)
Wu et al. (2016)

GENETIC TRENDS AND INDUSTRY DATA
Feed efficiency: Measuring, Genetic Trends, and Current State of the Industry

Comparative trends in quarterly reports
Item Q2 – 2015 Q2 – 2016 % ChangeAv. Start Weight 55.93 54.25 -3.00Mortality, % 4.30 4.37 1.67Av. Weight Out 279.1 278.9 -0.06Lb Feed/head 627.8 628.8 0.16ADG 1.89 1.90 0.42FCR 2.85 2.83 -0.53ADFI 5.39 5.38 -0.11%
Source: MetaFarms


Factors affecting feed efficiency
Environmental factors
Feed composition/processing
Pig

ANIMAL COMPONENTS
Feed efficiency: Measuring, Genetic Trends, and Current State of the Industry

What factors affect feed efficiency?
• Animal side:– Age– Sex– Genetics (Lean growth)– Health

Classes of Nutrients
• Carbohydrates• Lipids• Amino acids• Mineral• Vitamins• Water
Energy is not a nutrient
Boisen, 2007

Lean gain drives a large proportion of feed efficiency

FEED COMPONENTS
Feed efficiency: Measuring, Genetic Trends, and Current State of the Industry

Efficiency of using energy varies among nutrients
• Carbohydrates• Lipids• Amino acids• Mineral• Vitamins• Water
Energy is not a nutrient
Boisen, 2007
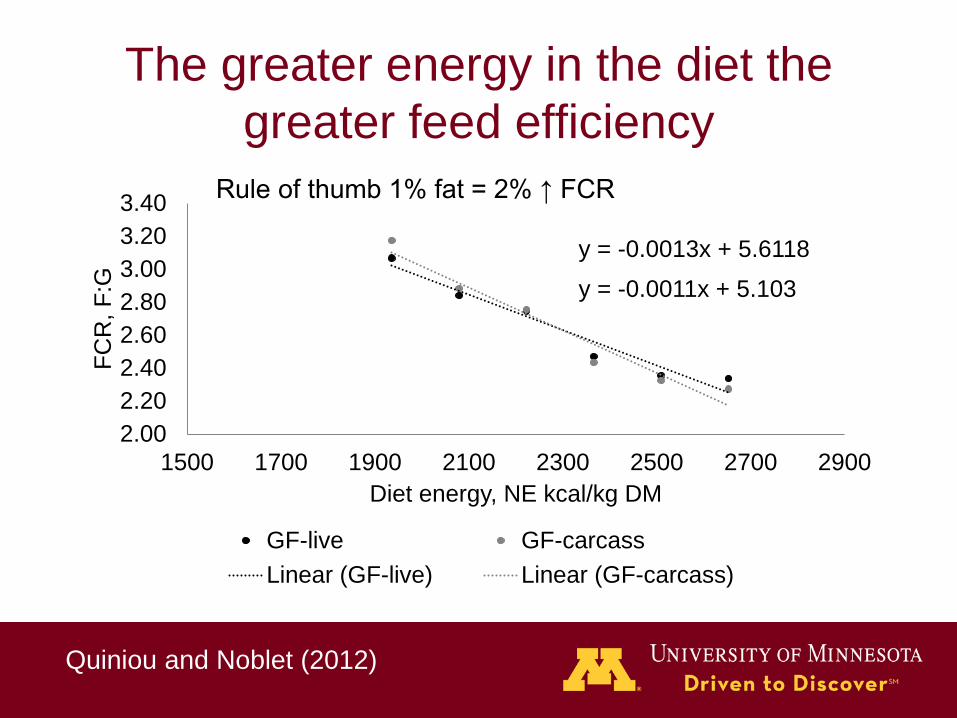
The greater energy in the diet the greater feed efficiency
y = -0.0011x + 5.103
y = -0.0013x + 5.6118
2.002.202.402.602.803.003.203.40
1500 1700 1900 2100 2300 2500 2700 2900
FCR
, F:G
Diet energy, NE kcal/kg DM
GF-live GF-carcassLinear (GF-live) Linear (GF-carcass)
Quiniou and Noblet (2012)
Rule of thumb 1% fat = 2% ↑ FCR

Pigs adjust their feed intake to energy intake, but it depends on age
y = -0.0004x + 3.1449
y = -0.001x + 5.7179
2.00
2.50
3.00
3.50
4.00
1500 1700 1900 2100 2300 2500 2700 2900
AD
FI, k
g
Diet energy, NE kcal/kg DM
ADFI-014 ADFI-28-54Linear (ADFI-014) Linear (ADFI-28-54)
Quiniou and Noblet (2012)

Grinding – particle size reduction
More smaller particles = greater surface area
Greater surface area

Grinding – particle size reduction
Greater surface area

Effect of diet grinding on productivity and health
Particle size, μ 1000 800 600 400ADG, kg/d 0.96 0.94 0.95 0.98ADFI, kg/d 3.25 3.21 3.26 3.16Feed to gain 3.39 3.41 3.43 3.23
Stomach health1 95 85 75 501Percent of normal stomachs or without macroscopic lesions

Survey on most common feed grinding size
0
5
10
15
20
25
30
35
> 800 700-800 600-700 500-600 400-500 < 400 Not sure
% o
f sur
vey
resp
onde
rs
% Responders
Flohr et al. (2012)

Feed production cost increases as particle size decreases
Wondra et al. (2012)
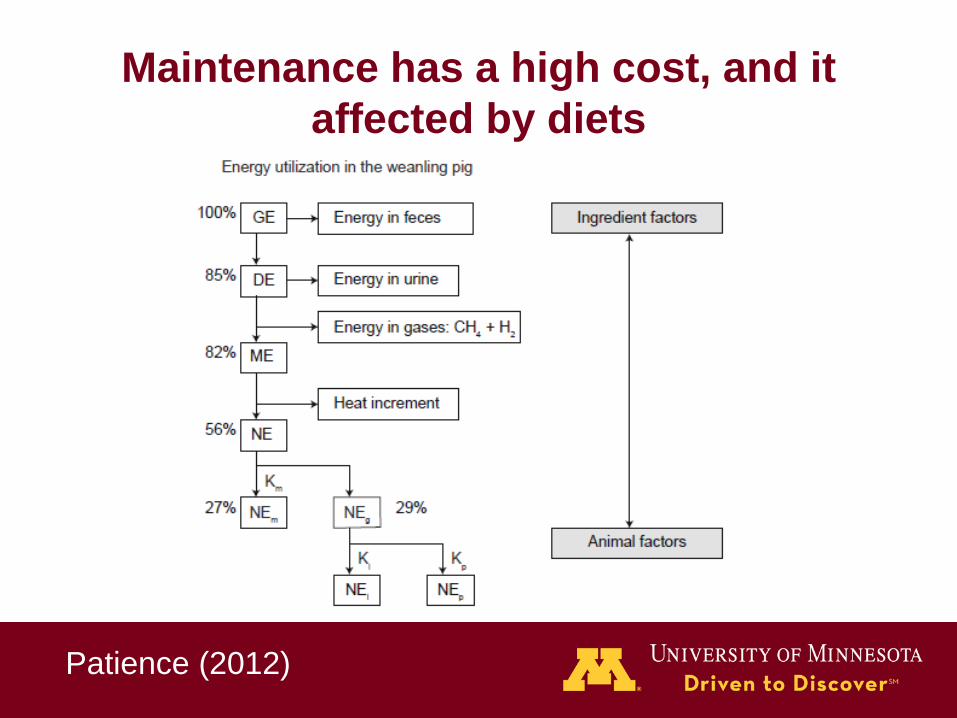
Maintenance has a high cost, and it affected by diets
Patience (2012)

Increase the proportion of GE in the diet that is digested
Item Corn DDGS WM SBH WS
GE, kcal/kg 3,933 4,710 3,901 4,210 4,036
NE, kcal/kg 2,672 2,343 2,113 989 239
GE:NE 0.68 0.50 0.54 0.23 0.06
Corn DDGSCorn-soybean

Alternative feed ingredients have high content of poorly digestible nutrients
0% 20% 40% 60% 80% 100%
DDGS
Corn
Water CP Fat Sugars Starch Fiber Other

Contribution of nutrients in DDGS towards predicted ME kcal/kg DM
Nutrient Min Mean Max SD CVDM 60.1 62.7 68.6 2.5 4.0CP 23.3 24.9 26.8 1.0 4.0Ether extract 3.2 6.0 9.1 1.7 28.3NDF 14.5 18.8 23.5 3.1 16.3ADF 5.5 7.9 10.4 1.8 22.9dHemi 8.4 10.9 13.9 1.8 16.9
Kerr et al. (2013), Huang (2016)
ME = 4.83(dCP) + 9.58(dEE) + 4.14 (ST) + 3.9(SU) + 4.4(dHemi) + 2.81(dADF) + 4.04 (dRes)
N = 12 source of corn DDGS
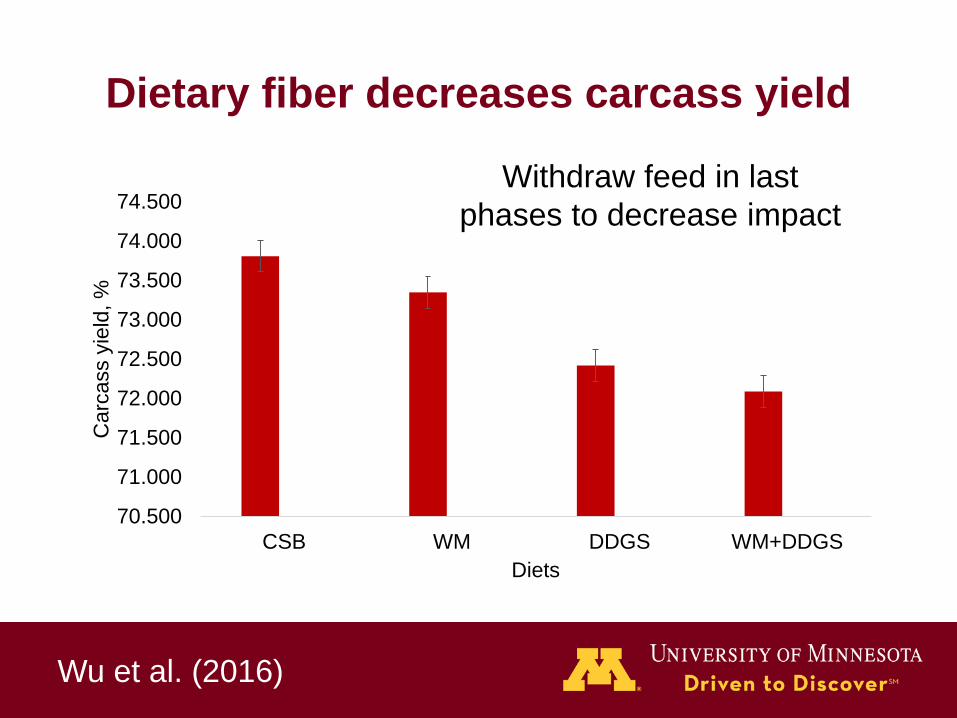
Dietary fiber decreases carcass yield
70.500
71.000
71.500
72.000
72.500
73.000
73.500
74.000
74.500
CSB WM DDGS WM+DDGS
Car
cass
yie
ld, %
Diets
Wu et al. (2016)
Withdraw feed in last phases to decrease impact

The digestibility of fiber can be predicted using laboratory procedures
y = 0.1643x + 2.8959R² = 0.819
0102030405060708090
0 100 200 300 400 500
ATTD
of T
DF,
%
Asymptotic gas production (A), mL/g DM
Wheat strawCorn DDGS
Soybean hulls
Huang (2016)

Dietary fiber modifies the type of secretory cells in the GIT of pigs
DDGS SBH
WS Control
Huang (2016)

Maintenance has a high cost, and it affected by diets
Patience (2012)
0%
10%
20%
30%
40%
50%
60%
70%
80%
90%
100%
DDGS Corn
Water CP Fat SugarsStarch Fiber Other

Looking for more information?

Thanks!