Embed Size (px)
Citation preview
©2010 Pedro Enrique Urriola
DIGESTIBILITY OF DIETARY FIBER BY GROWING PIGS
BY
PEDRO ENRIQUE URRIOLA
DISSERTATION
Submitted in partial fulfillment of the requirements
for the degree of Doctor of Philosophy in Animal Sciences
in the Graduate College of the
University of Illinois at Urbana-Champaign, 2010
Urbana, Illinois
Doctoral Committee:
Associate Professor Hans H. Stein, Chair and Director of Research
Professor George C. Fahey, Jr.
Professor James E. Pettigrew
Associate Professor Kelly S. Swanson
Research Leader Brian J. Kerr, Agricultural Research Service, USDA
ii
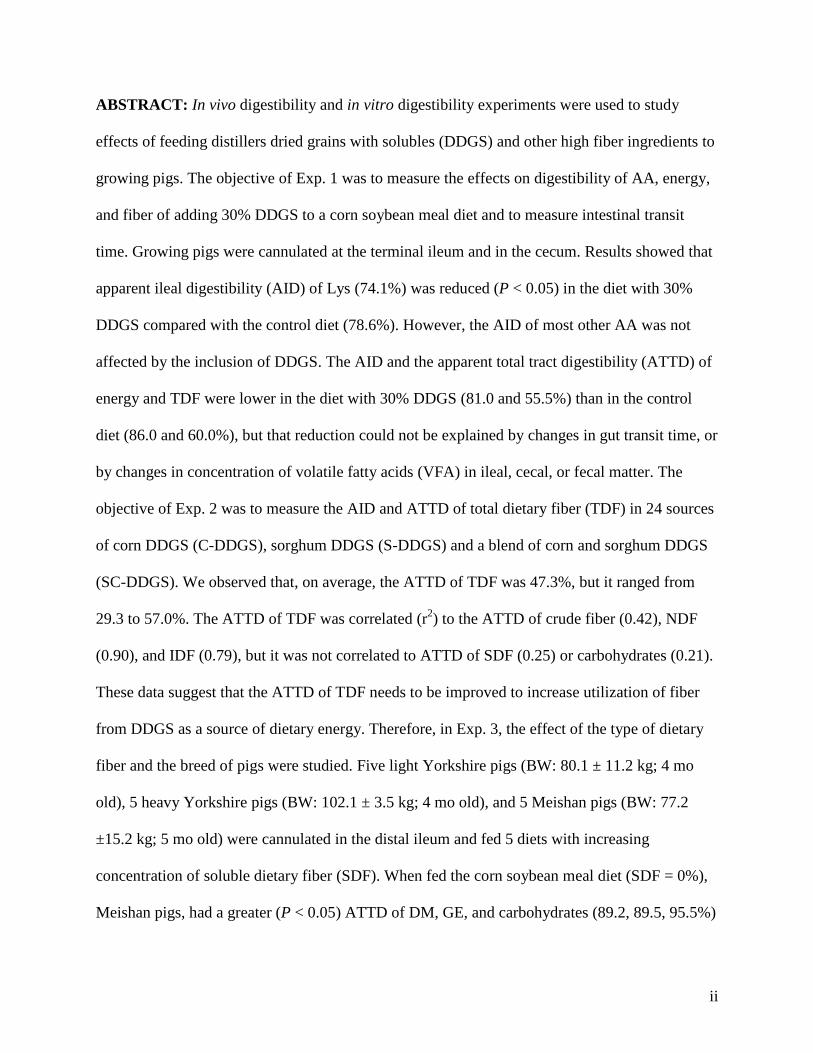
ABSTRACT: In vivo digestibility and in vitro digestibility experiments were used to study
effects of feeding distillers dried grains with solubles (DDGS) and other high fiber ingredients to
growing pigs. The objective of Exp. 1 was to measure the effects on digestibility of AA, energy,
and fiber of adding 30% DDGS to a corn soybean meal diet and to measure intestinal transit
time. Growing pigs were cannulated at the terminal ileum and in the cecum. Results showed that
apparent ileal digestibility (AID) of Lys (74.1%) was reduced (P < 0.05) in the diet with 30%
DDGS compared with the control diet (78.6%). However, the AID of most other AA was not
affected by the inclusion of DDGS. The AID and the apparent total tract digestibility (ATTD) of
energy and TDF were lower in the diet with 30% DDGS (81.0 and 55.5%) than in the control
diet (86.0 and 60.0%), but that reduction could not be explained by changes in gut transit time, or
by changes in concentration of volatile fatty acids (VFA) in ileal, cecal, or fecal matter. The
objective of Exp. 2 was to measure the AID and ATTD of total dietary fiber (TDF) in 24 sources
of corn DDGS (C-DDGS), sorghum DDGS (S-DDGS) and a blend of corn and sorghum DDGS
(SC-DDGS). We observed that, on average, the ATTD of TDF was 47.3%, but it ranged from
29.3 to 57.0%. The ATTD of TDF was correlated (r2) to the ATTD of crude fiber (0.42), NDF
(0.90), and IDF (0.79), but it was not correlated to ATTD of SDF (0.25) or carbohydrates (0.21).
These data suggest that the ATTD of TDF needs to be improved to increase utilization of fiber
from DDGS as a source of dietary energy. Therefore, in Exp. 3, the effect of the type of dietary
fiber and the breed of pigs were studied. Five light Yorkshire pigs (BW: 80.1 ± 11.2 kg; 4 mo
old), 5 heavy Yorkshire pigs (BW: 102.1 ± 3.5 kg; 4 mo old), and 5 Meishan pigs (BW: 77.2
±15.2 kg; 5 mo old) were cannulated in the distal ileum and fed 5 diets with increasing
concentration of soluble dietary fiber (SDF). When fed the corn soybean meal diet (SDF = 0%),
Meishan pigs, had a greater (P < 0.05) ATTD of DM, GE, and carbohydrates (89.2, 89.5, 95.5%)
iii
than light (86.6, 86.6, and 92.4%) and heavy (87.0, 86.5, and 93.0%) Yorkshire pigs. The ATTD
of TDF was greater (P < 0.05) in Meishan pigs fed DDGS (75.3%) than in light (39.0%) and
heavy (55.7%) Yorkshire pigs. The ATTD of TDF (P < 0.05) in DDGS was also greater (P <
0.05) in heavy than in light Yorkshire pigs. However, the ATTD of TDF was not different
among the 3 groups of pigs when fed sugar beet pulp, soybean hulls, and pectin. These results
indicate that the ATTD of TDF is greater in Meishan than in Yorkshire pigs in feed ingredients
with high concentration of IDF, but in ingredients containing more SDF, no differences were
observed. Because, ATTD of GE is dependent on the ATTD of TDF and because in vivo
digestibility experiments are expensive and time consuming, it is advantageous to develop
procedures to measure digestibility of fiber in vitro. The objective of Exp. 4 was, therefore, to
modify the 3 step in vitro digestibility of OM to measure the in vitro ATTD of NDF in a subset
of samples that was analyzed in Exp. 2. Results indicate that in vitro AID (28.5%) and in vitro
ATTD (37.5%) of NDF were lower than the in vivo AID (45.9%) and ATTD (59.3%) values
observed in Exp. 2. There were some agreements between values obtained using both
procedures. In DDG, the AID and ATTD of DM (30.1 and 42.5%) and NDF (-19.2 and 17.5%)
were lower (P < 0.01) than in any source of DDGS and this pattern also was observed in Exp. 2.
However, the relationships were not strong enough (R2 = 0.12) to predict in vivo ATTD of NDF.
In conclusion, dietary fiber from DDGS has an intermediate digestibility and does not affect
digestibility of the other nutrients in the diet. The ability of pigs to digest fiber varies with age
and breed and there are interactions with the type of fiber. A procedure that measures
digestibility of fiber is, therefore, necessary.
Key words: Dietary Fiber, Digestibility, Distillers Dried Grains with Solubles, Energy, Pig
iv
ACKNOWLEDGEMENTS
The experience at the graduate program of the University of Illinois was exciting,
educative, and full of rewards, but it was also the most difficult step in my career. There were
challenges that were only overcome thanks to the patience, guidance, and support of my adviser,
Dr. Hans Stein. Dr. Stein has allowed me to grow as a scientist, listening to my ideas and
carefully guiding my efforts. He also understood the challenges of working away from my
family. I also thank the examination committee, Dr. James Pettigrew, Dr. Kelly Swanson, Dr.
Brian Kerr, and Dr George Fahey.
I had the strange opportunity of belonging to two excellent research groups. I did not
share office space with the students that were advised by Dr Stein. However, this eventuality did
not stop them from coming and visiting me at my office to check how I was doing, offer their
help, or simply chat. I want to thank my office mates for their hospitality. They along with their
advisor, Dr. James Pettigrew received me as one more of their group. Minho Song, a former
colleague at Minnesota, offered me unconditional friendship and support to find solutions to
problems with my research projects and class work.
The graduate program in Swine Nutrition requires a wide array of skills from class, to
writing, to laboratory, and to farm work. It is only with the support of instructors, professors,
laboratory technicians, secretaries, and farm staff that one can get all the work completed. In
these times of institutional hardships, I want to highlight the value of the University as a place
where students gather to explore their creativity, improve their talent, and work together for the
benefit humanity.
Thanks to my family for their support. Last, to Maria for sharing ideas, happiness, and
understanding that I’m just a dreamer.
v
TABLE OF CONTENTS
LIST OF ABBREVIATIONS ................................................................................................... viii
CHAPTER 1: INTRODUCTION ..................................................................................................1
Literature Cited ....................................................................................................................3
CHAPTER 2: Digestibility of dietary fiber by growing pigs: Review of literature.......................6
Definition of Dietary Fiber ..................................................................................................6
Classification of Dietary Carbohydrates and Dietary Fiber .................................................8
Characteristics of Dietary Fiber .........................................................................................10
Methods to Measure Dietary Fiber ....................................................................................12
Utilization of Dietary Fiber by Growing Pigs....................................................................16
Factors Affecting Energy Value of Dietary Fiber ..............................................................19
Contribution of Energy from Dietary Fiber .......................................................................21
Literature Cited ..................................................................................................................25
Tables and Figures .............................................................................................................36
CHAPTER 3: Effects of distillers dried grains with solubles on AA, energy, and fiber
digestibility and on intestinal marker appearance of a corn soybean meal diet fed to
growing pigs.......................................................................................................................45
Abstract ..............................................................................................................................45
Introduction ........................................................................................................................46
Materials and Methods .......................................................................................................47
Results ................................................................................................................................53
Discussion ..........................................................................................................................55
Literature Cited ..................................................................................................................60
vi
Tables and Figures .............................................................................................................66
CHAPTER 4: Digestibility of dietary fiber in distillers co-products fed to growing pigs ...........78
Abstract ..............................................................................................................................78
Introduction ........................................................................................................................79
Materials and Methods .......................................................................................................80
Results ................................................................................................................................83
Discussion ..........................................................................................................................85
Literature Cited ..................................................................................................................90
Tables and Figures .............................................................................................................94
CHAPTER 5: Comparative digestibility of energy and nutrients in fibrous feed ingredients in
Meishan and Yorkshire pigs ............................................................................................106
Abstract ............................................................................................................................106
Introduction ......................................................................................................................107
Materials and Methods .....................................................................................................108
Results ..............................................................................................................................112
Discussion ........................................................................................................................115
Literature Cited ................................................................................................................121
Tables and Figures ...........................................................................................................126
CHAPTER 6: Evaluation of in vitro procedures to measure digestibility of fiber in distillers
dried grains with solubles ................................................................................................141
Abstract ............................................................................................................................141
Introduction ......................................................................................................................142
Materials and Methods .....................................................................................................143
vii
Results ..............................................................................................................................151
Discussion ........................................................................................................................153
Literature Cited ................................................................................................................156
Tables and Figures ...........................................................................................................159
GENERAL CONCLUSIONS: ..................................................................................................165
AUTHOR’S BIOGRAPHY: .....................................................................................................168
viii
LIST OF ABBREVIATIONS
AA amino acid(s)
ADF acid detergent fiber
ADFI average daily feed intake
ADL acid detergent lignin
AEE acid hydrolyzed ether extract
AID apparent ileal digestibility
ANOVA analysis of variance
AOAC Association of Official Analytical Chemists
Arg arginine
Asp aspartate
ATP adenosine triphosphate
ATTD apparent total tract digestibility
BW body weight
cal calorie
C-DDGS distillers dried grains produced from corn
CHO carbohydrates
CoA coenzyme A
CP crude protein (N × 6.25)
Cu copper
CV coefficient of variation
Cys cysteine
d day(s)
ix
DDG distillers dried grains
DDGS distillers dried grains with solubles
DDGSbeverage distillers dried grains with solubles from production of beverage
DDGSethanol distillers dried grains with solubles from ethanol plant
DE digestible energy
DM dry matter
DMI dry matter intake
Eq. Equation(s)
Exp. experiment
Fe iron
g gram
G:F gain-to-feed ratio
GE gross energy
GLM general linear model
Glu glutamate
Gly glycine
h hour(s)
HCl hydrochloric acid
HEPES (4-(2-hydroxyethyl)-1-piperazineethanesulfonic acid
HGF hindgut fermentation
His histidine
IDF insoluble dietary fiber
IL Illinois
x
Ile isoleucine
IVDMD in vitro dry matter disappearance
L liter
Leu leucine
Lsmeans least square means
Lys lysine
m meter
M molar (concentration; preferred over mol/L)
ME metabolizable energy
Met methionine
min minute(s)
Mn manganese
MO Missouri
mo month(s)
mol mole
N nitrogen
N normal (concentration)
n sample size
Na sodium
NAD nicotinamide adenine dinucleotide
NADH reduced form of NAD
NaOH sodium hydroxide
ND not determined
xi
NDF neutral detergent fiber
NE net energy
NFE nitrogen free extract
NRC National Research Council
OM organic matter
P probability
PPAR peroxisome proliferator-activated receptor
Pro proline
r simple correlation coefficient
r2 simple coefficient of determination
rpm revolutions/minute
s second(s)
s2 variance (sample)
SAS Statistical Analysis System
SBH soybean hulls
SBM soybean meal
SC-DDGS distillers dried grains with solubles produced a blend of sorghum and corn
SD standard deviation (sample)
SDF soluble dietary fiber
S-DDGS distillers dried grains with solubles produced from sorghum
SE standard error
SEM standard error of the mean
Ser serine
xii
TDF total dietary fiber
TN Tennessee
Thr threonine
Trp tryptophan
Val valine
VFA volatile fatty acid(s)
vol volume
vol/vol volume/volume
vs. versus
WBC water binding capacity
wk week(s)
wt weight
σ standard deviation (population)
Zn zinc
1
CHAPTER 1
INTRODUCTION
Swine feeding programs have traditionally used starch and fats as a source of dietary
energy. Dietary fiber, on the contrary, was usually kept at the lowest concentration possible,
because of its negative impacts on digestibility of energy (Bindelle et al., 2008). There is,
however, a growing need for using alternative feed ingredients with relatively high
concentrations of dietary fiber because prices of cereal grains have increased due to their
utilization in production of biofuels. Better knowledge of the physiological effects and the
energy value of dietary fiber may increase the ability of nutritionist to successfully introduce
alternative ingredients into swine diets.
Research on dietary fiber shows the diversity of structures of carbohydrates that compose
dietary fiber and the diversity of physiological responses that these complex carbohydrates exert
on the animal (Elia and Cummings, 2007; Englyst et al., 2007). This creates some difficulty in
dealing with dietary fiber and, in fact, the definition and classification are the initial challenges
(Noblet and Le Goff, 2001). The first chapter of this thesis, therefore, is a review of the literature
on dietary fiber, definitions, classifications, and the effects of fiber on energy value of swine
diets.
The newest alternative feed ingredients are coming from the production of biofuels (Stein
and Shurson, 2009), and the most common by-products that are used are distillers dried grains
with solubles (DDGS). There is evidence that dietary fiber from DDGS may reduce the
digestibility of AA and energy (Stein et al., 2006; Petersen et al., 2007; Urriola et al., 2009).
However, no data are available on the effects of adding DDGS to complete diets based on corn
and soybean meal on the physiological responses of the gut, on the transit time, or on VFA
2
production. Chapter 2, therefore, provides data on the effect of DDGS in complete diets on
physiologic responses of the pig.
The concentration and digestibility of crude fiber, ADF, and NDF have been measured in
a limited number of sources of DDGS (Guo et al., 2004; Stein et al., 2009). However, there are
no data on the concentration, solubility, and digestibility of dietary fiber in DDGS, but because
of the importance of dietary fiber for the digestibility of energy in DDGS, such data are needed.
The concentration of digestible dietary fiber was measured in a wide range of sources of DDGS
and other by-products of ethanol distillation, and data are presented in chapter 3.
Different breeds of pigs, the age of the pigs, and the time pigs are allowed to adapt to
dietary fiber may influence the digestibility of dietary fiber (Kemp et al., 1991; Longland et al.,
1993; Le Goff et al., 2002). Chinese Meishan pigs fed a basal diet composed of corn, barley, and
wheat had a greater digestibility of crude fiber than Dutch Landrace pigs, but no differences were
observed when 15% oats were added to the diet (Kemp et al., 1991). Also Meishan pigs did not
digest fiber better than modern breeds of pigs that were fed alfalfa meal (Yen et al., 2004). The
interactions among breed of pig, age of the pig, and type of dietary fiber may explain the
differences in results observed in the literature. However, there are no data on the interactions of
breeds of pigs and type of dietary fiber and there are no data on the effect of breed of pig on
digestibility of fiber from DDGS. Thus, chapter 4, tested the hypothesis that differences in
digestibility of dietary fiber among breeds of pigs is influenced by fiber type that is fed
(insoluble vs. soluble) and by pig age.
Fermentation of TDF supplies some of the energy that pigs obtain from DDGS, but on
average, only 47.3% of TDF disappears in the intestines of the pig and this value varies among
sources of DDGS (Urriola et al., 2010). There are numerous in vitro procedures to measure
3
digestibility of OM and energy (Boisen and Fernandez, 1997; Regmi et al., 2009) and to measure
products of fermentation (Coles et al., 2005). These procedures have been applied to measure in
vitro digestibility of DM, energy, and CP in corn gluten meal (Guo et al., 2004) and purified corn
fibers (de Godoy et al., 2009). However, in vitro procedures have not been applied to measure
the digestibility of fiber in DDGS and compare results to in vivo data from pigs. Chapter 5
contains data from 5 experiments that were conducted with the objective of developing a
procedure for measuring in vitro digestibility of fiber and measuring in vitro digestibility of fiber
in DDGS.
LITERATURE CITED
Boisen, S., and J. A. Fernández. 1997. Prediction of the total tract digestibility of energy in
feedstuffs and pig diets by in vitro analyses. Anim. Feed Sci. Technol. 68:277–286.
Bindelle, J., P. Leterme, and A. Buldgen. 2008. Nutritional and environmental consequences of
dietary fibre in pig nutrition: A review. Biotechnol. Agron. Soc. Environ. 12:313–324.
Coles, L. T., P. J. Moughan, A. J. Darragh. 2005. In vitro digestion and fermentation methods,
including gas production techniques, as applied to nutritive evaluation of food in the
hindgut of humans and other simple-stomached animals. Anim. Feed Sci. Technol. 123-
124:421-4444.
de Godoy, M. R. C., L. L. Bauer, C. M. Parsons, and G. C. Fahey Jr. 2009. Select corn
coproducts from the ethanol industry and their potential as ingredients in pet foods. J.
Anim. Sci. 87:189-199.
Elia M., and J. H. Cummings. 2007. Physiological aspects of energy metabolism and
gastrointestinal effects of carbohydrates. Eur. J. Clin. Nutr. 61(Suppl 1):S40-74.
4
Englyst, K. N., S. Liu, and H. N. Englyst. 2007. Nutritional characterization and measurement of
dietary fiber carbohydrates. Eur. J. Clin. Nutr. 61(Suppl 1):S19-39.
Guo, L., X. Piao, D. Li, and S. Li. 2004. The apparent digestibility of corn by-products for
growing-finishing pigs in vivo and in vitro. Asian Aust. J. Anim. Sci. 17:379-385.
Kemp, B., L. A. Hartog, J. J. den Klok, and T. Zandstra. 1991. The digestibility of nutrients,
energy and nitrogen in the Meishan and Dutch Landrace pig. J. Anim. Physiol. Anim.
Nutr. 65:263–266.
Le Goff, G., J. van Milgen, and J. Noble. 2002. Influence of dietary fiber on digestive utilization
and rate of passage of growing pigs, finishing pigs, and adult sows. Anim. Sci. 74:503-
515.
Longland, A. C., A. G. Low, D. B. Quelch, and P. Bray. 1993. Adaptation to the digestion of
non-starch polysaccharide in growing pigs fed on cereal or semi-purified basal diets. Br.
J. Nutr. 70:557-566.
Noblet, J., and G. Le Goff. 2001. Effect of dietary fiber on the energy value of feed for swine.
Anim. Feed Sci. Technol. 90:35-52.
Pedersen, C., M. G. Boersma, and H. H. Stein. 2007. Digestibility of energy and phosphorus in
ten samples of distillers dried grains with solubles fed to growing pigs. J. Anim. Sci.
85:1168-1176.
Regmi, P. R., N. S. Ferguson, and R. T. Zijlstra. 2009. In vitro digestibility techniques to predict
apparent total tract energy digestibility of wheat in growing pigs. J. Anim. Sci. 87:3620-
3629.
Stein, H. H., and G. C. Shurson. 2009. BOARD INVITED REVIEW: The use and application of
distillers dried grains with solubles (DDGS) in swine diets. J. Anim. Sci. 87:1292-1303.
5
Stein, H. H., S. P. Connot, and C. Pedersen. 2009. Energy and nutrient digestibility in four
sources of distillers dried grains with solubles produced from corn grown within a narrow
geographical area and fed to growing pigs. Asian-Aust. J. Anim. Sci. 22:1016-1025.
Stein, H. H., M. L. Gibson, C. Pedersen, and M. G. Boersma. 2006. Amino acid and energy
digestibility in ten samples of distillers dried grain with solubles fed to growing pigs. J.
Anim. Sci. 84: 853-860.
Urriola, P. E., G. C. Shurson, H. H. Stein. 2010. Digestibility of dietary fiber in distillers co-
products fed to growing pigs. J. Anim. Sci. jas.2009-2227v1-20092227.
Urriola, P. E., C. D. Hoeler, Pedersen, H. H. Stein, and G. C. Shurson. 2009. Amino acid
digestibility of distillers dried grains with solubles, produced from sorghum, a sorghum-
corn blend, and corn fed to growing pigs. J. Anim. Sci. 87:2574-2580.
Yen, J. T., V. H. Varel, J. A. Nienaber. 2004. Metabolic and microbial responses in western
crossbred and Meishan growing pigs fed a high-fiber diet. J. Anim. Sci. 82:1740-1755.
6
CHAPTER 2
Digestibility of dietary fiber by growing pigs: Review of literature
Cereal grains are currently in high demand because of their use in ethanol production
(Stein and Shurson, 2009). This trend is expected to continue and less grain will be available for
feeding livestock. As a consequence, livestock producers must use more fibrous feed ingredients
to keep feed prices at competitive levels (de Lange, 2008). It is important, therefore, to
understand the process that allows the pig to utilize dietary fiber as a source of energy. The
objective of this literature review is to determine the current state of knowledge of the utilization
of dietary fiber by growing pigs and to review methods for analysis of dietary fiber in feed
ingredients. A further objective is to identify methods to improve utilization of dietary fiber by
growing pigs.
Definition of Dietary Fiber
There are numerous definitions of dietary fiber, but most of them either define dietary
fiber as a group of compounds that are identified in analytical methods or as a group of
compounds that have specific physiological functions (Food and Nutrition Board-IOM, 2001). In
the 19th
century, the Weende procedure defined crude fiber as the organic residue that is
insoluble in acid and alkaline treatments (Mertens, 2003). This portion of the diet was considered
the de facto definition of dietary fiber and without real value to the animal (AACC, 2001).
Later, two researchers in separate ways proposed that this indigestible residue may
improve human health (Kritchevsky, 1988). Denis Burkitt reported that bowel cancer is rare in
humans who consume a ―high residue diet‖, and Hugh Trowell suggested that high intake of
undigested residue helps protect people in developing countries from ischemic heart disease
7
(Burkitt et al., 1972; Kritchevsky, 1988; Carpenter, 2003). These conclusions triggered interest
in dietary fiber, but it became clear that dietary fiber is a heterogeneous group of chemical
components with multiple physiological functions and, therefore, difficult to define (Carpenter,
2003).
It is now accepted that an accurate definition of fiber must include the physiological
effects of fiber (IOM, 2006). Therefore, an important aspect of the definition is that dietary fiber
consists of carbohydrates that are indigestible by mammalian enzymes (AACC, 2001; IOM,
2006). The inclusion of this term is important, but difficult to measure (Englyst et al., 2007).
The current definition of dietary fiber from the American Association of Cereal Chemists
(AACC, 2001) includes the following aspects:
1. It is an indigestible portion of the diet.
2. It consists of carbohydrates and lignin.
3. It originates from plants.
a. It has physiological effects that increase laxation and reduce blood
cholesterol and/or blood glucose.
The definition of dietary fiber by the Institute of Medicine separates the definition into
three parts (i. e., dietary fiber, functional fiber, and total fiber). Dietary fiber consists of non-
digestible carbohydrates and lignin that are intrinsic and intact in plants. Functional fiber consists
of isolated, nondigestible carbohydrates that have beneficial physiological effects in humans, and
total fiber is the sum of dietary fiber and functional fiber (IOM, 2006).
The term non-starch polysaccharide (NSP) is related to dietary fiber, but does not cover
all components that can be classified as dietary fiber (Elia and Cummings, 2007). For example,
NSP does not include oligosaccharides and lignin, which were included in the definitions of
8
dietary fiber by AACC (2001) and by IOM (2006). Use of the term NSP may not be an accurate
description of fiber in feed ingredients because dietary fiber is not limited to NSP or plant cell
walls (Cho et al., 1997).
There are several issues that need to be addressed in the definition of dietary fiber (Table
2.1.). Most of these issues are important when it comes to labeling the concentration of dietary
fiber in human food products, and special claims of physiological effects. Maximum guaranteed
values of crude fiber are required in labels of animal feeds (AAFCO, 2008). The value of crude
fiber of a feed ingredient does not have a nutritional relevance. Therefore, the most important
issue in swine nutrition is to clearly describe the components of dietary fiber that have nutritional
and physiological effects in animals and the compounds that contribute to the energy value of the
diet. It is also important that analytical procedures are available to accurately determine the
concentration of dietary fiber in animal feed and feed ingredients.
Classification of Dietary Carbohydrates and Dietary Fiber
The classification of dietary fiber starts with the classification of dietary carbohydrates.
There are two ways to classify carbohydrates, 1) classification and nomenclature suggested by
chemistry societies, and 2) classification according to nutritional properties. Chemistry societies
separate carbohydrates in three groups: monosaccharides, oligosaccharides (including
disaccharides), and polysaccharides (Nelson and Cox, 2008). Monosaccharides and
disaccharides, however, are often grouped together as sugars and oligosaccharides are defined as
compounds containing between 3 and 9 monosaccharides while polysaccharides contain more
than 10 (Cummings and Stephen, 2007).
Carbohydrates are polyhydroxy aldehydes or ketones or substances that yield such
compounds upon hydrolysis (Lewis, 2000).The term, carbohydrate, includes monosaccharides,
9
disaccharides, oligosaccharides, and polysaccharides, but also derived substances such as aldiols,
carboxylic acids, substances where one or more hydroxyl groups are replaced (e. g., hydrogen,
amino group, thiol group), and derivatives of these substances (IUPAC-IUB Commission on
Biochemical Nomenclature, 1996).
Monosaccharides are polyhydroxyaldehydes (aldoses) or polyhydroxyketoses (ketoses).
Monosaccharides may contain 3 (triose), 4 (tetraose), 5 (pentose), 6 (hexoses), or 7
(sepoheptulose) carbons and tend to form ring structures that are called furanoses
(tetrahydrofuran) or pyranoses (tetrahydropyran; Sturgeon, 2003). Monosaccharides also include
analogous structures such as acidic monosaccharides (e.g., glucuronic acid and galacturonic acid;
IUPAC-IUB Commission on Biochemical Nomenclature, 1996).
The word ―sugar‖ covers monosaccharides, disaccharides, and polyols (Cummings and
Stephen, 2007). Polyols are alcohol derivaties of sugars (e. g., isomaltose, lactitol, maltitol,
sorbitol) and are, therefore, included in this group (Elia and Cummings, 2007).
Disaccharides are not included as a division in the classification of carbohydrates; instead
they are included in the group called oligosaccharides (Sturgeon, 2003). Oligosaccharides are
molecules with two or more monosaccharides joined by glycosidic bonds (Sturgeon, 2003). By
convention, oligosaccharides are limited to have 2 to 10 monosaccharides (IUPAC-IUB
Commission on Biochemical Nomenclature, 1982). However, more recent publications of the
IUPAC-IUB Commissions do not specify how many monosaccharides are included in
oligosaccharides and polysaccharides (Cummings and Stephen, 2007; IUPAC-IUB Commission
on Biochemical Nomenclature, 1996). Polysaccharides are, therefore, macromolecules composed
of an undefined number of monosaccharides (Sturgeon, 2003; IUPAC-IUB Commission on
Biochemical Nomenclature, 1996). However, oligosaccharides may be separated from
10
polysaccharides because polysaccharides precipitate in 80% ethanol while oligosaccharides are
soluble (Cummings and Stephen, 2007).
Characteristics of Dietary Fiber
Dietary fiber can also be classified by physicochemical properties. The physicochemical
properties include: solubility, water holding and water binding capacity, and viscosity
(Kritchevsky, 1988). Physiological properties of dietary fiber are cation binding capacity,
binding or adsorption of organic molecules, and susceptibility to fermentation (Kritchevsky,
1988; Cho et al., 1997). The physicochemical properties are easier to measure than the
physiological properties, but physiological properties are the most important in nutrition.
Solubility. This is the property that describes how dietary fiber mixes homogenously in
different solvents (e. g., cold water, hot water, dilute acid, dilute alkali). The solubility of a
polysaccharide depends not on the monosaccharide, but on the links among them (Cho et al.,
1997). Cellulose and β-glucans are both composed of glucose, but the β(1→4) glycosidic links in
cellulose makes it insoluble whereas the β(1→6) links of β-glucans make them soluble and,
therefore, easier to access by microbes (Oakenfull, 2001).
Fractionation of the components of dietary fiber based on solubility starts with extraction
of dietary fiber in 75% alcohol (Theander and Åman, 1979). The insoluble residue then is treated
with hot water and a chelating agent to extract pectins and the second insoluble residue is treated
with alkali to obtain hemicelluloses. The final residue after the extraction with alkali is cellulose
(Southgate, 2001).
Separation of dietary fiber into soluble and insoluble fractions was the initial step in
understanding dietary fiber (Cho et al., 1997). Soluble fiber influence the absorption of lipids and
glucose, while insoluble fiber influence bowel movement and is less fermented in the large
11
intestine than soluble fiber (Cho et al., 1997; Serena et al., 2008). Some soluble fibers, however,
are not fermented in the large intestine and do not influence absorption of lipids or glucose,
while some insoluble fibers can be fermented almost completely in the large intestine
(Cummings and Stephen, 2007).
Water Holding or Water Binding Capacity. These terms refer to the amount of water
absorbed within the structure of fiber (Cho et al., 1997), and they differ because water binding
capacity describes the amount of water retained in the fiber after stress has been applied. Stress
factors such as centrifugation, pH changes, and particle size reduction can increase the amount of
water that dietary fiber retains (Cho et al., 1997). Soluble and insoluble fiber can both retain
water because water holding capacity comes from the hydroxyl groups that can form hydrogen
bonds with water (Oakenfull, 2001). Water holding capacity is greater in pectin, potato pulp, and
sugar beet pulp than in seed residues, pea hulls, and intermediate in wheat and barley (Serena
and Bach Knudsen, 2007).
Viscosity. This concept is easier to imagine than conceptualize, and there are many ways
to measure and define viscosity. Viscosity is the relationship between the flow of matter and the
force that moves it (Dikeman and Fahey, 2006). Honey is more viscous than water and flows
slower. Absorption of glucose and other nutrients may be reduced by dietary fiber with high
viscosity (Nyman, 2003).
Cation Binding Capacity. Dietary fiber can bind minerals and organic molecules
(Oakenfull, 2001). It is believed that free carboxyl groups and uronic acids (ionizable groups) are
attached to metal ions. This attachment between fiber and minerals may prevent the absorption
of minerals such as Ca+2
, Mg+2
, and Zn+2
(Cho et al., 1997). Some of the compounds in dietary
fiber that bind minerals are phytates, but lignin and other co-passengers (e. g. steryl ferulates and
12
steryl glycosidates) may also have effects on mineral absorption (Kritchevsky, 1988; Adlercreutz
et al., 2006).
Binding to Organic Molecules. Dietary fiber can also bind to organic molecules such as
bile acids (Scheneeman, 1998). Lignin seems to be one of the strongest binding substances in
dietary fiber (Kritchevsky, 1988).
Susceptibility to Fermentation. Dietary fiber differs in the degree to which it can be
fermented by microbes (Gallager, 2006). The more susceptible to fermentation a dietary fiber
source is the more energy the pig obtains as VFA (McBurney and Sauer, 1993). Fermentation of
a dietary fiber depends on the access of bacterial enzymes to their substrate, chemical
composition of the substrates, solubility, water holding capacity, and porosity of the fiber (Cho et
al., 1997; Guillon et al., 1998; Gallaher, 2006; Guillon et al., 2006).
Laxation. The effect of dietary fiber on laxation depends on many of the factors
discussed above (Oakenfull, 2001; Cho et al., 1997). Therefore, more than being a single
characteristic of fiber, laxation and fermentation are the combination of the previous
physicochemical properties of fiber.
Methods to Measure Dietary Fiber
There are many methods available for determination of the concentration of dietary fiber
in human food, animal feed, and feed ingredients. All methods include two basic steps; first,
digestion of carbohydrates and other non-fiber components of the diet (e. i., protein, fat, water,
minerals) and, second, quantification of the undigested residue. The digestion procedure can use
chemical compounds (e. g., acid, alkali, and detergents) or use enzymes (amylase,
amyloglucosidases, and proteases). Measurement of the indigestible residue can be accomplished
by weighing the residue (gravimetric) or by measuring chemical compounds in the residue using
13
chromatography, gas liquid chromatography, and high performance liquid chromatography.
There are newer methods to study the composition and structure of non-starch polysaccharides in
the cell wall of plants and it relationship with degradation in the gut (Guillon et al., 2006). These
methods include Raman Microspectroscopy, Fourier Transform Infrared Spectroscopy (FT-IR),
inmunolabeling, fluorescence, and mass spectroscopy, among others (Guillon et al., 2006).
Crude Fiber Analysis. This is a chemical-gravimetric method that is part of the
proximate analysis of feed ingredients developed at the Agricultural Experimental Station in
Weende, Germany (Grieshop et al., 2001). The method separated carbohydrates into 2 portions,
nitrogen free extract and crude fiber. Crude fiber is the residue that is left after digestion of the
sample with 1.25% sulfuric acid and 1.25% sodium hydroxide (Cho et al., 1997; Furda, 2001).
At the time of the development of the procedure, it was only known that digestion included acid
and alkaline processes, but enzymes were not known (Mertens, 2003). The crude fiber procedure
is very robust and repeatable, but there is no relationship between crude fiber and any definition
of dietary fiber (Mertens, 2003) because the recovery of cellulose (40 to 100 %), hemicelluloses
(15 to 20 %), and lignin (5 to 90 %) is not complete (Grieshop et al., 2001; Metens, 2003).
However, the procedure still is used to regulate maximum fiber concentration in animal feed
(Mertens, 2003).
Detergent Fiber Procedures. The detergent procedure is a chemical-gravimetric
procedure that empirically relates the value from the analysis to the physiological properties of
dietary fiber (Van Soest et al., 1991). The procedure separates dietary fiber into neutral detergent
fiber (NDF), acid detergent fiber (ADF), and acid detergent lignin fractions (ADL; Robertson
and Horvath, 1992). This procedure was an improvement over the crude fiber procedure;
however, it does not recover soluble dietary fiber such as pectins, mucilages, gums, and β-
14
glucans (Grieshop et al., 2001). The lack recovery of soluble dietary fiber components is less
concerning in cereal grains such as corn and DDGS that have high concentrations of insoluble
fiber (Johnston et al., 2003). Other problems with the detergent procedure include the possible
contamination of the residue with starch that reduces robustness and repeatability (Mertens,
2003).
Total Dietary Fiber. The procedure of Prosky is known as the total dietary fiber
procedure (TDF) AOAC Official Method 985.29 (AOAC Int., 2007) and has been modified to
determine soluble and insoluble dietary fiber by AOAC Official Method 991.43 (AOAC Int.,
2007). The TDF procedure uses enzymes (e.g., amylase, glucoamylase, and protease) to mimic
digestion in the small intestine, then the residue is weighed (Theander and Åman, 1979). The
residue also is analyzed for undigested proteins and ash. Therefore, the TDF procedure is more
time consuming and less reproducible than the crude fiber and detergent methods (Mertens,
2003). More work is needed to improve the TDF procedure to include low molecular weight
indigestible carbohydrates and correct for contaminants of the indigestible residue (Gordon et al.,
2007).
Enzymatic Chemical Methods. There are several methods that combine the initial steps
of enzymatic digestion with chemical determination of sugars in the undigested residue
(Theander and Åman, 1979; Campbell et al., 1997; Grieshop et al., 2001). The Uppsala method
calculates TDF as the sum of amylase-resistant polysaccharides, uronic acids, and Klason lignin
(AOAC Int., 2007; Grieshop et al., 2001). The digestion step in the AOAC Official Method
994.13 uses a heat-stable α-amylase and amyloglucosidase (AOAC Int., 2007). The residue is
divided into soluble and insoluble fractions by 80% ethanol. The neutral sugars released are
quantified as alditol acetate derivatives by gas liquid chromatography and uronic acids
15
chromatographically (Theander and Åman, 1979). The NSP method developed by Englyst and
Cummings is similar to the Uppsala method but it excludes lignin and resistant starch from the
final value (Englyst et al., 1996; Grieshop et al., 2001). There are other similar methods that are
not as common as the two methods mentioned above. These are the methods of Schweizer and
Wursh and the method developed in 1969 by Southgate (Cho et al., 1997; Southgate, 2001).
These procedures determine neutral sugars colorimetrically, which is easier than GLC, but they
are less accurate and, therefore, not used in the current research.
Campbell et al. (1997) compared values for dietary fiber in several grains as measured by
the procedures of Prosky, Englyst, and Thelander. The Uppsala and NSP methods resulted in
lower concentrations of dietary fiber than the procedure described by Prosky. The NDF
procedure resulted in the lowest concentration of dietary fiber.
Estimation of Dietary Fiber by Difference. Direct measurement of dietary carbohydrates
is a tedious procedure and it is more difficult than measurement of other dietary nutrients (e. i.,
protein, fat, water, and ash). Calculation of carbohydrates by difference is a method to
circumvent these problems (FAO, 2002). The underlining assumptions of this method are that all
other nutrients have relative low analytical errors and that all values are additive. Total
carbohydrates are calculated using Eq [1]:
Total carbohydrates/100 g = 100 – (protein, g + fat, g + water, g + ash, g) [1]
The concentration of carbohydrates in human food is commonly calculated from the
values analyzed for other nutrients following Eq. 1 (IOM, 2006). Also, the total carbohydrates
can be separated in available or digestible carbohydrates and indigestible carbohydrates or
dietary fiber. The Weendee System, developed in 1860, separated carbohydrates in crude fiber
16
and nitrogen free extract (NFE). The Cornell Net Carbohydrate and Protein System (CNCPS)
separate total carbohydrates in digestible carbohydrates and NDF.
Total carbohydrates g = non fiber carbohydrates – NDF
Other variations of the concept include calculation of indigestible carbohydrates by
analyzing starch and sugars along with protein, fat, and water (de Lange, 2008). For practical
purposes, the concentration of indigestible nutrients in feed ingredients can be calculated using
the following Eq. [2]:
Indigestible carbohydrates, g = DM, g – (ash + starch + sugars + protein + fat) [2]
Calculation of carbohydrates by difference includes, however, the cumulative errors from
all other analytical procedures (e. i. protein, fat, ash, DM). Also, these calculations do not take
into account other components of the diet that are not analyzed such as polyols, alcohol, and
organic acids. Therefore, the value is not reliable for feed ingredients and should be discouraged.
Utilization of Dietary Fiber by Growing Pigs
Fermentation. The environment in the intestine requires that microbes live without
oxigen. There are 3 types of microorganism that can live without oxygen, anaerobic phototrophs,
anaerobic respires (sulfate reducers, methanogens, acetogens), and fermentative microorganisms
(White, 2000; Müller, 2008). Fermentative microorganisms conserve energy in a process in
which electrons from redox reactions are transferred to part of the substrate from which energy is
derived. The substrate is only partially oxidized during fermentation and only a small amount of
energy is conserved for microbial growth (Müller, 2008).
Microbes start breaking down polysaccharides into smaller polysaccharides or the
constituent carbohydrates during fermentation of dietary fiber in the pig intestine (Müller, 2008).
Depolymerization occurs using a combination of reactions (e. g., hydrolysis, redox,
17
phosphorylation, and lyases). The monomers then are absorbed into the microbial cell and
channeled into the pathways of central metabolism (White, 2000). The final products are
excreted from the microbial cell into the intestinal lumen. Other microbes can use the products of
the first microbe as a substrate and excrete a second product (anaerobic food chain). Finally, the
pig absorbs some of the end products of fermentation of carbohydrates, mainly VFA (Table 2.2).
Absorption of VFA. The absorption of VFA in the pig large intestine is a very efficient
process (Barcroft et al., 1944). When VFA were infused in the cecum of growing pigs, less than
1% were excreted in the feces (Jørgensen et al., 1997). Absorption of VFA is proposed to occur
by 3 mechanisms 1) diffusion of protonated VFA 2) anion exchange (Wong et al., 2006), and 3)
transporter mediated (Kirat and Kato, 2006). Diffusion of protonated VFA is likely the least
important of the 3 mechanisms because at physiological pH, only 1% of all VFA in the intestinal
lumen is protonated (Cook and Sellin, 1998). If anion exchange is used, VFA are taken up into
the enterocyte and HCO3- is released to the intestinal lumen (Cook and Sellin, 1998). More
recent studies have documented the existence of active transportation of VFA. Active
transporters of VFA belong to the monocarboxilate family and MCT-1 is the transporter present
in the intestine of pigs (Welter and Claus, 2008). Another transporter expressed in human
colonocytes is the sodium-coupled monocarboxylate transporter or SLC5A8 that may be
implicated in absorption of VFA, especially butyrate (Thangaraju et al., 2008). The MCT1
transporter has been identified in pig intestinal cells, but is not clear if the SLC5A8 is also
present in pig colonocytes.
Absorption of VFA also facilitates absorption of other nutrients from the diet. Water and
sodium are absorbed along with VFA (Yen, 2001). Plant lignans, diphenolic compounds similar
to endogenous steroid hormones are also co-transported by VFA (Bach Knudsen et al., 2006).

18
Inulin improves the bioavailability of iron in corn and soybean meal diets in young anemic
piglets (Yasuda et al., 2006). It is not clear if inulin increases absorption of Fe by increasing
production of VFA and thereby VFA increase absorption of Fe, or if VFA reduce luminal pH
and increase solubility of Fe, or if VFA increase the expression of the Fe transporters (Tako et
al., 2008).
Metabolism of VFA. The VFA are metabolized in 3 ways: 1) by colon cells that use them
as an energy source, 2) by the liver that use propionate for gluconeogenesis, and 3) by adipose
tissue and muscle (Wong et al., 2006). The concentration and molar proportions of VFA in portal
blood is different from that in intestinal digesta suggesting that VFA are metabolized in the
intestinal cells (Argenzio et al., 1974; Marsono et al., 1993). The typical VFA molar proportions
in intestinal content is 65:25:10 (acetate:propionate:butyrate). This ratio changes after absorption
and passage thought liver to 90:10:0 in hepatic circulation demonstrating selective metabolism of
VFA in enterocytes and in liver (Robertson, 2007).
Human colonocytes metabolize 70 to 90% of absorbed butyrate to CO2 and ketone
bodies, and therefore, use butyrate as an energy source instead of glutamine (Kritchevsky 1988;
Elia and Cummings, 2007). Butyrate is not only an energy source, but it also regulates cell
proliferation and differentiation, which in turn may contribute to prevention of colorectal cancer
and other diseases (Cook and Sellin, 1999; Wong et al., 2006).
Most of the acetate and propionate leave the intestine without being metabolized and
reach the liver where propionate is metabolized for gluconeogenesis (Wong et al., 2006).
Propionate metabolism may inhibit hydroxymethyl glutaryl (HMG) CoA reductase, and
therefore, inhibit synthesis of cholesterol (Wong et al., 2006). Most of the acetate is believed to
be transported to the adipose tissue and skeletal muscle where it is used in the synthesis of fatty
19
acids or oxidized and used for synthesis of ATP (Elia and Cummings, 2007). The energy
absorbed as VFA accounted for 67 to 74% of the total energy absorbed in the hindgut of pigs fed
high fiber diets (Anguita et al., 2006), and the energy from VFA provided 7.1 to 17.6 % of the
total available energy. In some cases up to 82% of the energy infused inside the cecum as VFA
was retained as body energy (Jørgensen et al., 1997).
The effects of VFA on metabolism of fatty acids and fat distribution are not fully
understood (Robertson, 2007), but it is suggested that VFA, and especially propionate, may
change adipose tissue lipolysis, change adipocyte size and differenciation, and change body fat
distribution. Especially VFA appear to stimulate PPARγ, acetyl CoA carboxylase, and fatty acid
synthase (Lee and Hosser, 2002).
Factors Affecting Energy Value of Dietary Fiber
Estimates of production and concentration of VFA in ileal and cecal digesta and in fecal
samples vary among experiments (Table 2.3). There are several factors that influence the
concentration and production of VFA in the intestine of growing pigs. These factors may be
divided into factors inherent to the pig and factors inherent to the diet.
Factors Inherent to Pigs. Factors depending on the pigs are age and breed. Sows can
digest greater amount of dietary fiber than growing and finishing pigs (Le Goff and Noblet,
2001), which may be explained by a slower rate of digesta passage in the intestine of sows
(Grieshop et al., 2001). However, the ability of the microbial flora of sows to digest fiber is
believed to be similar to that of growing pigs (Le Goff et al., 2003), so that the greater
fermentability in sows is mainly a function of a greater microbial population and a longer
retention time of digesta.
20
Meishan pigs have a greater ability to digest fiber than pigs from Western breeds
(Fevriere et al., 1988; Kemp et al., 1991). Several other native breeds of pigs such as Mukota
(Zimbabwe), Mong Cai (Vietnam), Kune-Kune (New Zealand), Schwaebisch Haellisches
Schwein and Bunte Bentheime have greater capacity for digestion of dietary fiber than crossbred
pigs (Ndindana et al., 2002; Len et al., 2006; Morel et al., 2006; von Heimendahl et al., 2009).
However, greater fermentation capacity is not only observed among native breeds of pigs.
Among crossbred pigs, high lean growing pigs, were observed to digest more energy than slow
growing pigs, which was explained by a greater concentration of cellolytic bacteria in the large
intestine of lean growing pigs (Varel et al., 1988). However, other experiments have not
observed greater digestibility of dietary fiber in Meishan pigs than in pigs from crossbred pigs
(Yen et al., 2004). There is no information about which portion of dietary fiber (insoluble or
soluble) native breeds digest better than Western crossbreeds.
Factors Inherent to the Diet. There are several processes that can be used to improve the
microbial degradation of dietary fiber in fibrous feedstuffs, which may consequently increase the
energy value of the ingredient. These processes include physical processes (e.g., grinding,
heating, irradiation, mechanical separation of plant parts) and chemical processes such as
hydrolytic and oxidative agents. Sodium hydroxide may increase rumen digestibility of OM from
52% to 76% in barley straw and the digestibility of DM by 22% in other crop residues (Fahey et
al., 1993). The disadvantage of NaOH is that it may leak to soil where it is pollutant. Anhydrous
NH3, NH4OH, thermoammoniation, and urea have been used to treat fibrous materials, but the
increment in digestibility is not as great as when using NaOH. In 32 experiments where crop
residues were treated, digestibility of DM by ruminants increased by 15% (Fahey et al., 1993).
Other chemicals such as Ca(OH)2 and KOH have also been used to treat fibrous crop residues. In
21
fact KOH had similar effect as NaOH, but the cost of KOH may be too high to make this process
profitable (Fahey et al., 1993).
Treatment of fiber with oxidative agents, such as ozone increases IVDMD from 44% to
67%. However, at ground level ozone is also a pollutant and therefore leak to the environment
need to be controlled (Fahey et al., 1993). Hydrogen peroxide may increase the apparent rumen
digestibility of cellulose from 56.5% to 85.7% (Kerley et al., 1985) and sulfur dioxide can
increased in vitro digestibility of DM by 80%. However, the extra sulfur in the treated feed may
not be tolerable to animals (Fahey et al., 1993). Ammonia fiber expansion (AFEX) may be used
as pretreatment of DDGS before enzymatic digestion of cellulose. This procedure combines
ammonia and high pressure to increase degradability of fiber, and has been observed to degrade
100% of the cellulose in DDGS (Realf and Abbas, 2004; Bals et al., 2006).
Contribution of Energy from Dietary Fiber
Degradation of dietary fiber varies among feed ingredients, type of fiber, and the
interaction among dietary factors (Högberg and Lindberg, 2004; Bindelle et al., 2008). All those
factors are taken together as fermentability of dietary fiber. The apparent ileal digestibility (AID)
of dietary fiber by pigs vary from -10% to 62% (Bach Knudsen and Jorgensen, 2001). The
apparent total tract digestibility (ATTD) of cellulose vary from 23 to 65% in barley, from 24 to
60% in wheat and wheat by products, from 10 to 84% in rye and in rye fractions, and from 13 to
42% in bran, hulls of wheat, corn, and oats. The ATTD of TDF in DDGS produced from corn is
47.5% and varies among sources of DDGS from 29.3 to 57.0% (Urriola et al., 2009). The ATTD
of soluble dietary fiber (92.0%) is greater than the ATTD of insoluble fiber (41.3%; Urriola et
al., 2009).
22
Amount of VFA Produced per g of Fermented Fiber. The quantities of VFA that are
produced from fermentation depend on the fiber that is being fermented. As an example,
fermentation of oligosaccharides from soybeans yields more gasses (CH4, H2) that are not used
for energy by the animal than fermentation of other substrates such as resistant starch
(Cummings, 1981; Liener, 1994; Topping and Clifton, 2001; Middelbos and Fahey, 2008).
However, acetate, propionate, and butyrate are the VFA produced in the largest quantities and,
therefore, the only VFA reported in most experiments, but fermentation of branched chain AA
yields branched chain VFA (isobutyrate, isovalerate, and valerate; Nelson and Cox; 2008), but
the total production of VFA from AA fermentation is usually of minor importance and is,
therefore, often disregarded.
Fermentation of resistant starch is suggested to yield more butyrate than fermentation of
other fiber components (Topping and Clifton, 2001) and fermentation of specialized fiber yields
variable ratios of acetate: propionate: butyrate (Macfarlene and Macfarlene, 1993). As a
consequence, the energy that is available for absorption is different among these specialized
fibers (Table 2.5). However, for most raw fibrous feed ingredients, the ratio of acetate:
propionate:butyrate is relatively constant. It has, therefore, been suggested that for practical
purposes, those ratios may be assumed constant among all types of feed ingredients (Wang et al.,
2004; de Lange, 2008).
Production of ATP from VFA. The number of moles of ATP produced by each mole of
VFA that is oxidized by the animal tissues is 10 ATP for acetate, 18 ATP for propionate, and 28
ATP for butyrate (Table 2.6). The total quantity of ATP produced can be calculated by
multiplying the total amount of each VFA by the number of ATP that is produced from each
VFA. The energy that is produced from each ATP is similar for all 3 VFA and average
23
approximately 7.3 kcal/mole of ATP (Nelson and Cox, 2008) so the total kcal yield is calculated
by multiplying the total number of moles of ATP by 7.3 kcal.
Fermentation of one mole of glucose yields the following compounds (Cummings 1981):
58(C6H12O6) → 62CH3COOH + 22CH3CH2COOH + 16CH3(CH2)2COOH + 60.5COO2 +
33.5CH4 + 27H2O.
If it is assumed that all fermentation of carbohydrates is from glucose as is the case if
cellulose is fermented, the fermentation products and the total VFA production can be used to
calculate potential absorbed energy (Table 2.6). In this calculation, the potential absorbed energy
(1.02 kcal/g) from fermentation of cellulose is approximately 70% of the energy that can be
produced if glucose is oxidized (Table 2.7).
In reality, not all sugars in fiber are glucose. Hemicellulose contains also pentoses that
have lower energy value than glucose. It is, therefore likely that the actual energy value of fiber
is less than 1.02 kcal/g of glucose. It has been suggested that the amount of energy that a pig can
utilize from fiber is 60% of the value for glucose (Boisen, 2007), which is equivalent to 0.88
kcal/g of fermented fiber.
The energy value of dietary fiber from a feed ingredient can, therefore, be estimated by
measuring the ATTD of TDF in the ingredient and then multiply the resulting value by the total
concentration (g/kg DM) of TDF in the feed ingredient. The calculated value, g of digested
TDF/kg feed DM is then multiplied by 0.88 or 1.02 kcal/g digested TDF to obtain the final
energy from fermentation of the feed ingredient. The method has the limitation that it assumes no
interaction between dietary fiber and digestibility of nutrients in the diet.
In conclusion, Utilization of dietary fiber is an important subject for swine nutrition
because more high fiber ingredients will be fed to pigs. Current methods to measure dietary fiber
24
do not measure all components that are defined as dietary fiber, but the TDF procedure appears
to be the most accurate procedure available. The most important characteristic of dietary fiber
from the perspective of energy utilization is fermentation and the amount of VFA absorbed by
the pig. Fermentation of fiber depends on factors inherent to the diet pig and factors inherent to
the pig. Soluble dietary fiber is much more fermentable than insoluble dietary fiber, and the
energy value of fiber increases with the concentration of SDF. Longer adaptation time to high
fiber diets may increase the digestibility of fiber and energy and Meishan pigs may be more
efficient in fermenting dietary fiber than western crossbred pigs.
25
LITERATURE CITED
AACC. 2001. The definition of Dietary Fiber. AACC Report. Cereal Foods World 46:112-126.
AAFCO. 2008. Official Publication. Association of American Feed Control Officials, Oxford,
IN.
Adlercreutz, H., J. Penalvo, S. M. Heinonen, and A. Linko-Parvinen. 2006. Lignans and other
co-passengers. Pages 199-218 in Dietary Fiber Components and Functions. H.
Salovaara, F. Gates, and M. Tenkanen ed. Wageningen Academic Publishers.
Wageningen, The Netherlands.
AOAC Int. 2007. Official Methods of Analysis. 18th ed. AOAC Int., Gaithersburg, MD.
Anguita, M., N. Canibe, J. F. Pérez, and B. B. Jensen. 2006. Influence of the amount of dietary
fiber on the available energy from hindgut fermentation in growing pigs: Use of
cannulated pigs and in vitro fermentation. J. Anim. Sci. 84: 2766-2778.
Argenzio, R. A., J. E. Lowe, D. W. Pickard, and C. E. Stevens. 1974. Digesta passage and water
exchange in the equine large intestine. Am. J. Physiol. 226:1035.
Bach Knudsen, K. E., A. Serena, H. Jørgensen, J. L. Peñalvo, and H. Adlercreutz. 2006. Rye and
other natural cereal fibres enhance the production and plasma concentrations of
enterolactone and butyrate. Proc. Dietary Fibre, S48-49.
Bach Knudsen, K. E., and H. Jørgensen. 2001. Intestinal degradation of dietary carbohydrates –
From birth to maturity. Pages 109-120 in Digestive Physiology of Pigs. Proceedings of
the 8th
Symposium. J. E. Lindberg, and B. Ogle, ed. CABI Publishing, Wallingford, UK.
Bals B., B. Dale, and V. Balan. 2006. Enzymatic hydrolysis of distillers dry grains with solubles
using ammonia fiber expansion pretreatment. Energy Fuels 20:2732-2736.
26
Barcroft, J., R. A. McAnally, and A. T. Phillipson. 1944. Absorption of VFA from the
alimentary tract of the sheep and other animals. J. Exp. Biol. 20:120.
Bindelle, J., A. Buldgen, M. Delacollette, J. Wavreille, R. Agneessens, J. P. Destain, and P.
Leterme. 2009. Influence of source and concentrations of dietary fiber on in vivo nitrogen
excretion pathways in pigs as reflected by in vitro fermentation and nitrogen
incorporation by fecal bacteria. J. Anim. Sci. 87: 583-593.
Bindelle, J., P. Leterme, and A. Buldgen. 2008. Nutritional and environmental consequences of
dietary fibre in pig nutrition: A review. Biotechnol. Agron. Soc. Environ. 12:313–324.
Blaxter, K. L. 1989. Energy metabolism in animals and man. Cambrige University Press.
Cambridge, UK.
Boisen, S. 2007. A new concept for practical feed evaluation systems. DJF Animal Science 79:1-
70. Accessed on line: January 2010. Available:
http://www.agrsci.dk/djfpublikation/djfpdf/djfhus79.pdf
Brody, S. 1945. Bioenergetics and growth with special reference to the efficiency complex in
domestic animals. Reinhold Publishing Corporation. New York, NY
Burkitt, D. P., A. R. P. Walker, and N. S. Painter. 1972. Effect of dietary fiber on stools and
transit-times, and its role in the causation of disease. Lancet. 30:1408-1411.
Campbell, J. M., E. A. Flickinger, and G. C. Fahey. 1997. A comparative study of dietary fiber
methologies using pulsed electrochemical detection of monosaccharide constituents.
Sem. Food Anal. 2:43-53.
Carpenter, K. J. 2003. A short story of nutritional science: Part 4 (1945-1985). J. Nutr.133:3331-
3342.
27
Cho, S., J. W. DeVries, and L. Prosky. 1997. Dietary fiber analysis and applications. AOAC
International, Gaithersburg, MD.
Christensen, D. N., K. E. Bach Knudsen, K. E. Wolstrup, and B. B. Jensen. 1999. Integration of
ileum cannulated pigs and in vitro fermentation to predict the effect of diet composition
on the amount of energy available from microbial fermentation in the large intestine. J.
Sci. Food Agric. 79:755–762.
Cook, S. I., and J. H. Sellin. 1998. Review article: Short chain fatty acids in health and disease.
Aliment. Pharmacol. Ther. 12:499-507.
Cummings, J. H. 1981. Short chain fatty acids in the human colon. Gut 22:763-779.
Cummings, J. H., and A. M. Stephen. 2007. Carbohydrate terminology and classification. Eur. J.
Clin. Nutr. 61(Suppl 1):S5-S18.
De Lange, C. F. M. 2008. Efficiency of utilization of energy from protein and fiber in the pig - A
case for NE systems. Pages 58-72 in Proc. Swine Nutr. Conf. Indianapolis IN
Dikeman, C. L., and G. C. Fahey Jr. 2006. Viscosity as related to dietary fiber. A review. Crit.
Rev. Food Sci. Nutr. 45:649-663.
Ehle, F. R., J. B. Robertson, and P. J. Van Soest. 1982. Influence of dietary fibers on
fermentation in the human large intestine. J. Nutr. 112:158-166.
Elia, M., and J. H. Cummings. 2007. Physiological aspects of energy metabolism and
gastrointestinal effects of carbohydrates. Eur. J. Clin. Nutr. 61(Suppl 1):S40-S74.
Englyst, H. N., S. M. Kingman, G. J. Hodsun, and J. H. Cummings. 1996. Measurement of
resistant starch in vitro and in vivo. Br. J. Nutr. 75:749-755.
Englyst, K. N., S. Liu, and H. N. Englyst. 2007. Nutritional characterization and measurement of
dietary fiber carbohydrates. Eur. J. Clin. Nutr. 61(Suppl 1):S19-S39.
28
Fahey, G. C. Jr., L. D. Bourquin, E. C. Titgemeyer, and D. G. Atwell. 1993. Postharvest
treatment of fibrous feedstuffs to improve their nutritive value. Pages 715-766 in:
Forage Cell Wall Structure and Digestibility. H. G. Jung, D. R. Buxton, D. R.
Hatfield, and J. Ralph, ed. American Society of Agronomy, Madison, WI.
FAO, 2002. Analytical Methods for Carbohydrates in Food. Page 13 in Food Energy -
Methods of Analysis and Conversion Factors. FOOD AND AGRICULTURE
ORGANIZATION OF THE UNITED NATIONS, Rome, Italy.
Fevrier, C., D. Bourdon, A. Aumaitre, J. Peiniau., Y. Lebreton, Y. Jaguelin, N. Meziere, and
A. Blanchard. 1988. Digestive capacity of the Chinese pig—Effect of dietary fibre on
digestibility and intestinal and pancreatic enzymes. Pages 172–179 in Digestive
Physiology of Pigs. Proc. of IV Symposium. Jablona, Poland. 1988, Buraczewska L,
S. Buraczewski, B. Pastuzewska, and T. Zebrowska ed.
Food and Nutrition Board-IOM. 2001. Pages 1-64 in Dietary Reference Intakes: Proposed
Definition of Dietary Fiber. National Academy Press, Washington DC.
Furda, I. 2001. The crude fiber method. Pages 11-112 in Dietary Fiber in Human Nutrition. 3rd
ed. Spiller, G. A. ed. CRC Press, Boca Raton, FL.
Gallager, D. D. 2006. Dietary fiber. Pages 102-110 in Present Knowledge in Nutrition. ILSI.
Press. Washington, DC.
Gordon, D. T., B. V. McCleary, and T. Sontag-Strohm. 2007. Summary of Dietary Fibre
Methods Workshop. June 11, 2006, Helsinki, Finland. Pages 323-338 in Dietary Fiber
Components and Functions. Salovaara H., F. Gates, and M. Tenkanen ed. Wageningen
Academic Publishers, Wageningen, The Netherlands.
29
Grieshop, C. M., D. E. Reese, and G. C. Fahey Jr. 2001. Non-starch polysaccharides and
oligosaccharides in swine nutrition. Pages 107-130 in Swine Nutrition. Lewis, A. J., and
L. L. Southern ed. CRC Press, Boca Raton, FL.
Guillon, F., A. Auffret, J. A. Robertson, J.-F. Thibault, J.-L. Barry. 1998. Relationships between
physical characteristics of sugar-beet fibre and its fermentability by human fecal flora.
Carbohydr. Polym. 37:185-197.
Guillon, F., L. Saulnier, P. Robert, J. F. Thibault, and M. Champ. 2006. Chemical structure and
function of cell wall through cereal grains and vegetable samples. Pages 31-64 in Dietary
Fibre Components and Functions. Salovaara H., F. Gates, and M. Tenkanen ed.
Wageningen Academic Publishers, Wageningen, The Netherlands.
Högberg, A., and J. E. Lindberg. 2004. The effects of level and type of cereal non-starch
polysaccharides on the performance, nutrient utilization and gut environment of pigs
around weaning, Anim. Feed Sci. Technol. 127:200–219.
IOM. 2006. Pages 340-421 in Dietary Reference Intakes: Dietary, Functional, and Total Dietary
Fiber. National Academies Press, Washington, DC.
IUB-IUPAC Joint Commission of Biochemical Nomenclature. 1982. Pure Appli. Chem.
54:1523-1526.
IUPAC-IUB Commission on Biochemical Nomenclature. 1996. Nomenclature of Carbohydrates.
http://www.chem.qmul.ac.uk/iupac/2carb/00n01.html#01. Accessed Jan. 22, 2009.
Jensen, B. B., L. L. Mikkelsen, and D. N. Christensen. 1997. Integration of ileum cannulated
pigs and in vitro incubations to quantify the effect of diet composition on microbial
fermentation in the large intestine. Pages 106–110 in Energy and Protein Evaluation for
30
Pigs in Nordic Countries. Jørgensen, H. and J. Fernandez, ed. Research Centre Foulum,
Tjele, Denmark.
Johnston, L. J., S. Noll, A. Renteria, and G. C. Shurson. 2003. Feeding by-products high in
concentration of fiber to nonruminants in Third National Symposium on Alternative
Feeds for Livestock and Poultry Kansas City, MO.
Jørgensen, H., T. Larsen, X. Q. Zhao, and B. O. Eggum. 1997. The energy value of short-chain
fatty acids infused into the cecum of pigs. Br. J. Nutr. 77:745-756.
Just, A. 1982. The influence of ground barley straw on the net energy value of diets for growth in
pigs. Livest. Prod. Sci. 9:717-729.
Kemp, B., L. A. den Hartog, J. J. Klok, and T. Zandstra. 1991. The digestibility of nutrients,
energy, and nitrogen in the Meishan and Duroc Landrace pig. J. Anim. Physiol. Anim.
Nutr. 65:263-266.
Kerley, M. S., G. C. Fahey, Jr., L. L. Berger, J. M. Gould, and F. L. Baker. 1985. Alkaline
hydrogen peroxide treatment unlocks energy in agricultural by-products. Science
230:820.
Kirat, D., and S. Kato. 2006. Monocarboxylase transporter 1 (MCT1) mediates transport of short
chain fatty acids in bovine cecum. Exp. Physiol. 91:835-844.
Kritchevsky, D. 1988. Dietary fiber. Ann. Rev. Nutr. 8:301-328.
Le Goff, G., and J. Noblet. 2001. Comparative digestibility of dietary energy and nutrients in
growing pigs and adult sows. J. Anim. Sci. 79:2418–2427.
Le Goff, G., J. Noblet, and C. Cherbut. 2003. Intrinsic ability of the microbial flora to ferment
dietary fiber at different growth stages of pigs. Livest. Prod. Sci. 81:75-87.
31
Lee, S. H., and K. L. Hossner. 2002. Coordinate regulation of the adipose tissue gene expression
by propionate. J. Anim. Sci. 80:2840-2849.
Len, N. T., J. E. Lindberg, and B. Ogle. 2006. Digestibility and nitrogen retention of diets
containing different levels of fibre in local (Mong Cai), F1 (Mong Cai×Yorkshire) and
exotic (Landrace×Yorkshire) growing pigs in Vietnam. J. Anim. Physiol. Anim. Nutr.
91:297–303.
Lewis, B. A. 2000. Structure and properties of carbohydrates. Pages 3-22 in Biochemical and
Physiological Aspects of Human Nutrition. M. Stipanuck, ed. Saunders, Philadelphia,
PA.
Liener, I. E. 1994. Implications of antinutritional components in soybean foods. Crit. Rev. Food
Sci. Nutr. 34:31-67.
Macfarlane, G. T. 1991. Fermentation reactions in the large intestine. Page 5-10 in Short Chain
Fatty Acids: Metabolism and Clinical Importance. J. H. Cummings, J. L. Rombeau and T.
Sakata Ed. Ross Laboratories Press. Columbus, OH.
Macfarlane, G. T., and S. Macfarlane. 1993. Factors affecting fermentation reactions in the large
bowel. Proc. Nutr. Soc. 52:367-373.
Marsono Y., R. J. Illman, J. M. Clarke, R. P. Trimble, D. L. Topping. 1993. Plasma lipids and
large bowel volatile fatty acids in pigs fed white rice, brown rice and rice bran. Br.
J. Nutr. 70:503-513.
McBurney, M. I., and W. C. Sauer. 1993. Fiber and large bowel energy absorption: Validation of
the integrated ileostomy-fermentation model using pigs. J. Nutr. 123:721-727.
Mertens, D. R. 2003. Challenges in measuring insoluble dietary fiber. J. Anim. Sci. 81:3233-
3249.
32
Middelbos, I. S., and G. C. Fahey Jr. 2008. Soybean carbohydrates. Pages 269-296 in Soybean
Chemistry, Production, Processing, and Utilization. L. A. Johnson, P. J. White, and R.
Galloway ed. AOCS Press, Urbana, IL.
Morel, P. C. H., T. S. Lee, and P. J. Moughan. 2006. Effect of feeding level, live weight and
genotype on the apparent faecal digestibility of energy and organic matter in the growing
pig. Anim. Feed. Sci. Technol. 126:63–74.
Müller, V. 2008. Bacterial fermentation In: Encyclopedia of Live Sciences. John Wiley & Sons,
Ltd: Chichester. Available: http://www.els.net/ [DOI:
10.1002/9780470015902.a0001415.pub2]
Ndindana, W., K. Dzama, P. N. B. Ndiweni, S. M. Maswaure, and M. Chimonyo. 2002.
Digestibility of high fibre diets and performance of growing Zimbabwean indigenous
Mukota pigs and exotic Large White pigs fed maize based diets with graded levels of
maize cobs. Anim. Feed Sci. Technol. 97:199-208.
Nelson D. L., and M. M. Cox. 2008. Carbohydrates and glycobiology. Pages 235-241 in
Lehninger Principles of Biochemistry 5th
Ed. W. H. Freeman, New York, NY.
Nyman, E. M. G –L. 2003. Importance of processing for physico-chemical and physiological
properties of dietary fibre. Proc. Nutr. Soc. 62:187-192.
Oakenfull, D. 2001. Physical chemistry of dietary fiber. Page 33-47 in Dietary Fiber in Human
Nutrition. 3rd
ed. G. A. Spiller, ed. CRC Press, Boca Raton, FL.
Realff, M. J., and C. Abbas. 2004. Industrial symbiosis. Refining the biorefinery. J. Industr. Ecol.
7:5-9.
Robertson, J. B., and P. J. Horvath. 1992. Detergent analysis of foods. Pages 63-65 in Dietary
Fiber in Human Nutrition. 3rd
ed. Spiller, G. A. ed. CRC Press, Boca Raton, FL.

33
Robertson, M. D. 2007. Metabolic cross talk between the colon and the periphery: Implications
for insulin sensitivity. Proc. Nutr. Soc. 66:351-361.
Scheneeman, B. O. 1998. Dietary fiber and gastrointestinal function. Nutr. Res. 18:625-32.
Serena, A., and K. E. Bach Kudsen. 2007. Chemical and physicochemical characterization of co-
products from the vegetable food and agroindustries. Anim. Feed Sci. Technol. 139:109-
124.
Serena A., H. Jørgensen, and K. E. Bach Knudsen. 2008. Absorption of carbohydrate derived
nutrients in sows as influenced by types and contents of dietary fiber. J. Anim. Sci.
87:136-147.
Smiricky-Tjardes, M. R., E. A. Flickinger, C. M. Grieshop, L. L. Bauer, M. R. Murphy, and G.
C. Fahey, Jr. 2003. In vitro fermentation characteristics of selected oligosaccharides by
swine fecal microflora. J. Anim. Sci. 81:2505–2514.
Southgate, D. A. 2001. The Southgate method of dietary fiber analysis. Page 83-86 in Dietary
Fiber in Human Nutrition. 3rd
ed. Spiller, G. A. ed. CRC Press, Boca Raton, FL.
Stein H. H., and G. C. Shurson. 2009. BOARD INVITED REVIEW: The use and application of
distillers dried grains with solubles (DDGS) in swine diets. J. Anim. Sci. 87:1292-1303.
Sturgeon, R. J. 2003. Carbohydrates. Encyclopedia of Life Science.
http://www.mrw.interscience.wiley.com.proxy2.library.uiuc.edu/emrw/9780470015902/e
ls/article/a0000690/current/pdf?hd=All,monosaccharides Accessed Jan. 22, 2009.
Tako, E., R. P. Glahn, R. M. Welch, X. Lei, K. Yasuda, and D. D. Miller. 2008. Dietary inulin
affects the expression of intestinal enterocyte iron transporters, receptors, and storage
protein and alters the microbiota in the pig intestine. Br. J. Nutr. 99:472-480.
34
Thangaraju, M., G. Cresci, S. Itagaki, J. Mellinger, D. D. Browing, F. G. Berger, P. D. Prasad,
and V. Ganapathy. 2008. Sodium-coupled transport of the short chain fatty acid butyrate
by SLC5A8 and its relevance to colon cancer. J. Gastrointest. Surg. 12:1773-1782.
Theander, O., and P. Aman. 1979. The chemistry, morphology, and analysis of dietary fiber
components. Pages 215-244 in: Dietary Fiber: Chemistry and Nutrition. Inglett, G. E.,
and S. I. Falkehag. ed. Academic Press, New York, NY.
Topping, D. L., and P. M. Cliffton. 2001. Short-chain fatty acids and human colonic function:
Roles of resistant starch and non-starch polysaccharides. Physiol. Rev. 81:1031-1064.
Urriola, P. E., G. C. Shurson, and H. H. Stein. 2009. Digestibility of dietary fiber in distillers co-
products fed to growing pigs. J. Anim. Sci. 87(Suppl. 3):145 (Abstr.)
Van Soest, P., J. J. B. Robertson, and B. A. Lewis. 1991. Symposium: Carbohydrate methology,
metabolism, and nutritional implications in dairy cattle. Methods for dietary fiber, neutral
dietary fiber, and nonstarch polyssacharides in relation to animal nutrition. J. Dairy Sci.
74:3583-3597.
Varel, V. H., H. G. Jung, and W. G. Pond. 1988. Effects of dietary fiber of young genetically
lean, obese, and contemporary pigs: rate of passage, digestibility, and microbial data. J.
Anim. Sci. 66:707-712.
Von Heimendahl, E., G. Breves, and H. Abel. 2009. Fiber related digestive processes in three
different breeds of pigs. J. Anim. Sci. doi:10.2527/jas.2009-2370.
Wang, J. F., Y. H. Zhu, D. F. Li, Z. Wang, and B. B. Jensen. 2004. In vitro fermentation of
various fiber and starch sources by pig fecal inocula. J. Anim. Sci. 82:2615-2622.
Welter H., and R. Claus. 2008. Expression of the monocarboxylate transporter 1 (MCT1) in cells
of the porcine intestine. Cell Biol. Int. 32:638-645.
35
White, D. 2000. The physiology and biochemistry of prokaryotes. 2nd
ed Oxford University
Press. New York, NY.
Wong, J. M., R. de Souza, C. W. Kendall, A. Emam, and D. J. Jenkins. 2006. Colonic health:
fermentation and short chain fatty acids. J. Clin. Gastroenterol. 40:235-243.
Yasuda, K., K. R. Roneker, D. D. Miller, R. M. Welch, and X. G. Lei. 2006. Supplemental
dietary inulin affects bioavailability of iron present in corn and soybean meal to young
pigs. J. Nutr. 136:3033–3038.
Yen, J. T. 2001. Anatomy of the digestive system and nutritional physiology. Pages 31-63 in
Swine nutrition. Lewis, A. J., and L. L. Southern ed. CRC Press, Boca Raton, FL.
Yen, J. T., V. H. Varel, and J. A. Nienaber. 2004. Metabolic and microbial responses in western
crossbred and Meishan growing pigs fed a high-fiber diet. J. Anim. Sci. 82:1740-1755.
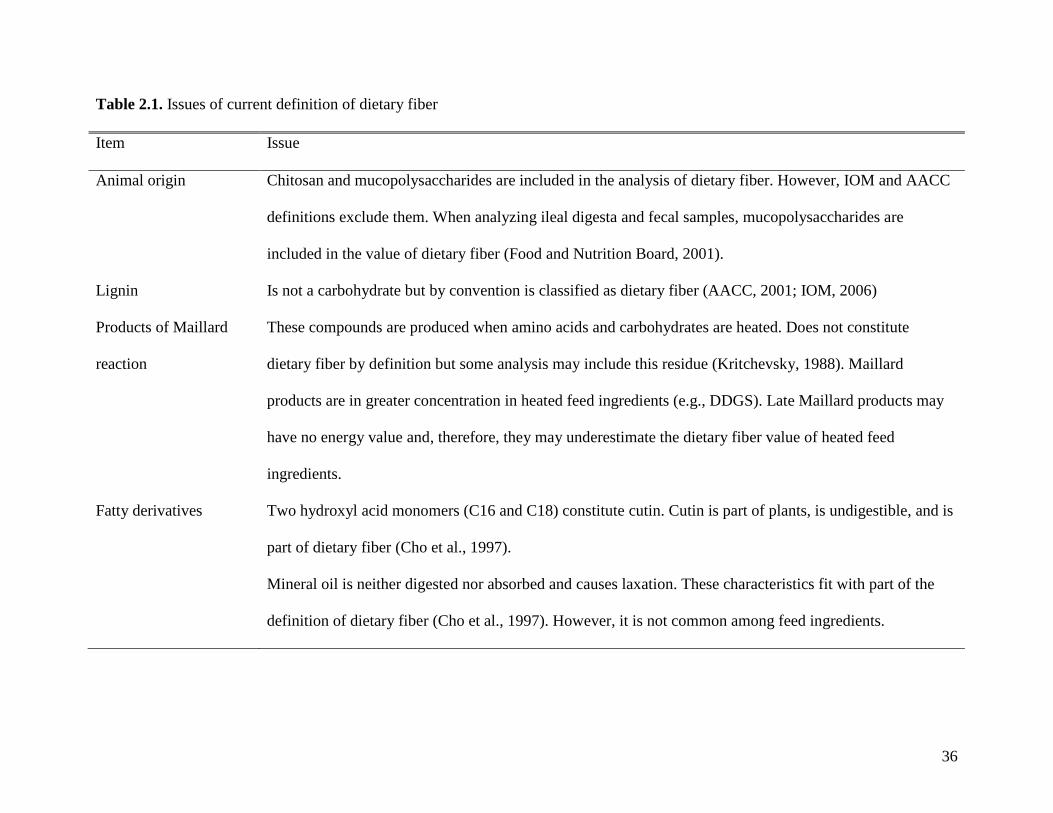
36
Table 2.1. Issues of current definition of dietary fiber
Item Issue
Animal origin Chitosan and mucopolysaccharides are included in the analysis of dietary fiber. However, IOM and AACC
definitions exclude them. When analyzing ileal digesta and fecal samples, mucopolysaccharides are
included in the value of dietary fiber (Food and Nutrition Board, 2001).
Lignin Is not a carbohydrate but by convention is classified as dietary fiber (AACC, 2001; IOM, 2006)
Products of Maillard
reaction
These compounds are produced when amino acids and carbohydrates are heated. Does not constitute
dietary fiber by definition but some analysis may include this residue (Kritchevsky, 1988). Maillard
products are in greater concentration in heated feed ingredients (e.g., DDGS). Late Maillard products may
have no energy value and, therefore, they may underestimate the dietary fiber value of heated feed
ingredients.
Fatty derivatives Two hydroxyl acid monomers (C16 and C18) constitute cutin. Cutin is part of plants, is undigestible, and is
part of dietary fiber (Cho et al., 1997).
Mineral oil is neither digested nor absorbed and causes laxation. These characteristics fit with part of the
definition of dietary fiber (Cho et al., 1997). However, it is not common among feed ingredients.
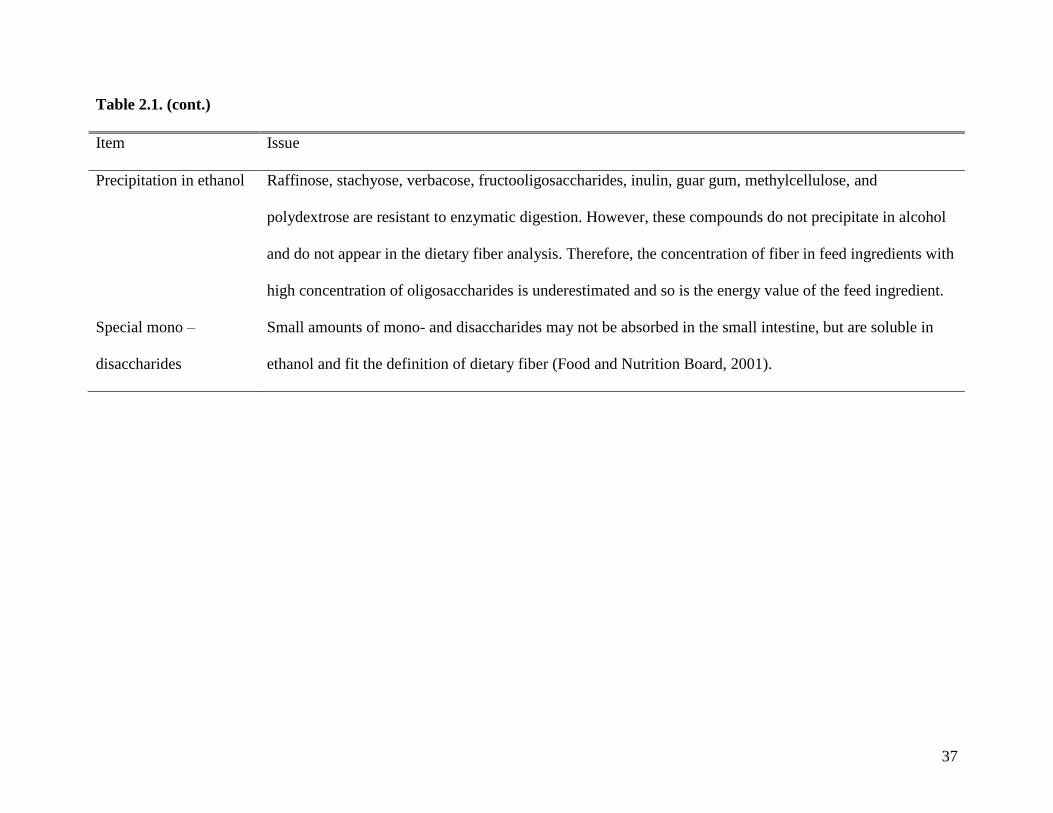
37
Table 2.1. (cont.)
Item Issue
Precipitation in ethanol Raffinose, stachyose, verbacose, fructooligosaccharides, inulin, guar gum, methylcellulose, and
polydextrose are resistant to enzymatic digestion. However, these compounds do not precipitate in alcohol
and do not appear in the dietary fiber analysis. Therefore, the concentration of fiber in feed ingredients with
high concentration of oligosaccharides is underestimated and so is the energy value of the feed ingredient.
Special mono –
disaccharides
Small amounts of mono- and disaccharides may not be absorbed in the small intestine, but are soluble in
ethanol and fit the definition of dietary fiber (Food and Nutrition Board, 2001).
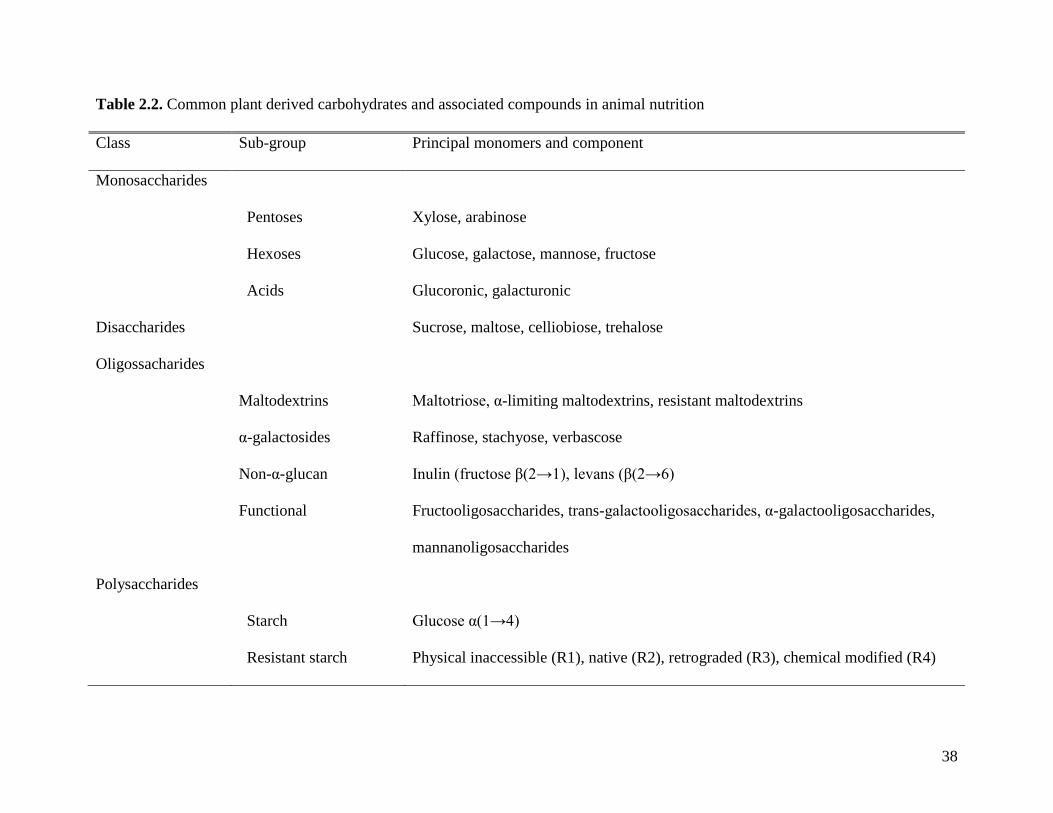
38
Table 2.2. Common plant derived carbohydrates and associated compounds in animal nutrition
Class Sub-group Principal monomers and component
Monosaccharides
Pentoses Xylose, arabinose
Hexoses Glucose, galactose, mannose, fructose
Acids Glucoronic, galacturonic
Disaccharides Sucrose, maltose, celliobiose, trehalose
Oligossacharides
Maltodextrins Maltotriose, α-limiting maltodextrins, resistant maltodextrins
α-galactosides Raffinose, stachyose, verbascose
Non-α-glucan Inulin (fructose β(2→1), levans (β(2→6)
Functional Fructooligosaccharides, trans-galactooligosaccharides, α-galactooligosaccharides,
mannanoligosaccharides
Polysaccharides
Starch Glucose α(1→4)
Resistant starch Physical inaccessible (R1), native (R2), retrograded (R3), chemical modified (R4)
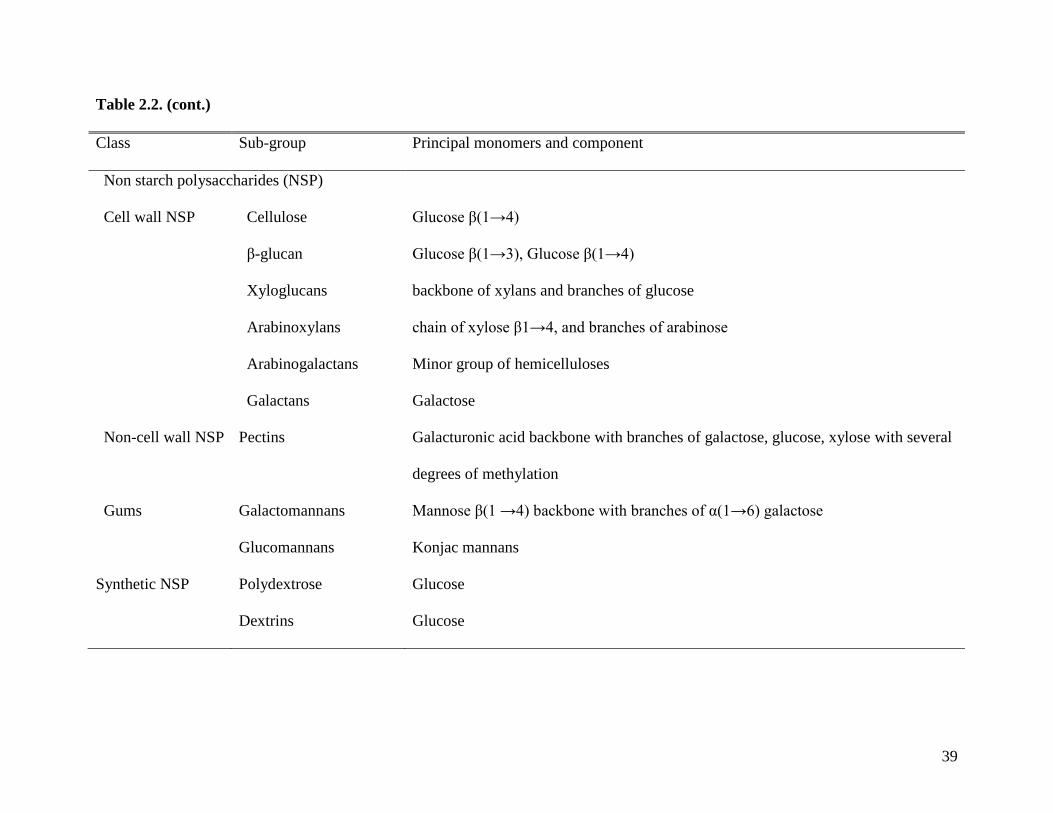
39
Table 2.2. (cont.)
Class Sub-group Principal monomers and component
Non starch polysaccharides (NSP)
Cell wall NSP Cellulose Glucose β(1→4)
β-glucan Glucose β(1→3), Glucose β(1→4)
Xyloglucans backbone of xylans and branches of glucose
Arabinoxylans chain of xylose β1→4, and branches of arabinose
Arabinogalactans Minor group of hemicelluloses
Galactans Galactose
Non-cell wall NSP Pectins Galacturonic acid backbone with branches of galactose, glucose, xylose with several
degrees of methylation
Gums Galactomannans Mannose β(1 →4) backbone with branches of α(1→6) galactose
Glucomannans Konjac mannans
Synthetic NSP Polydextrose Glucose
Dextrins Glucose
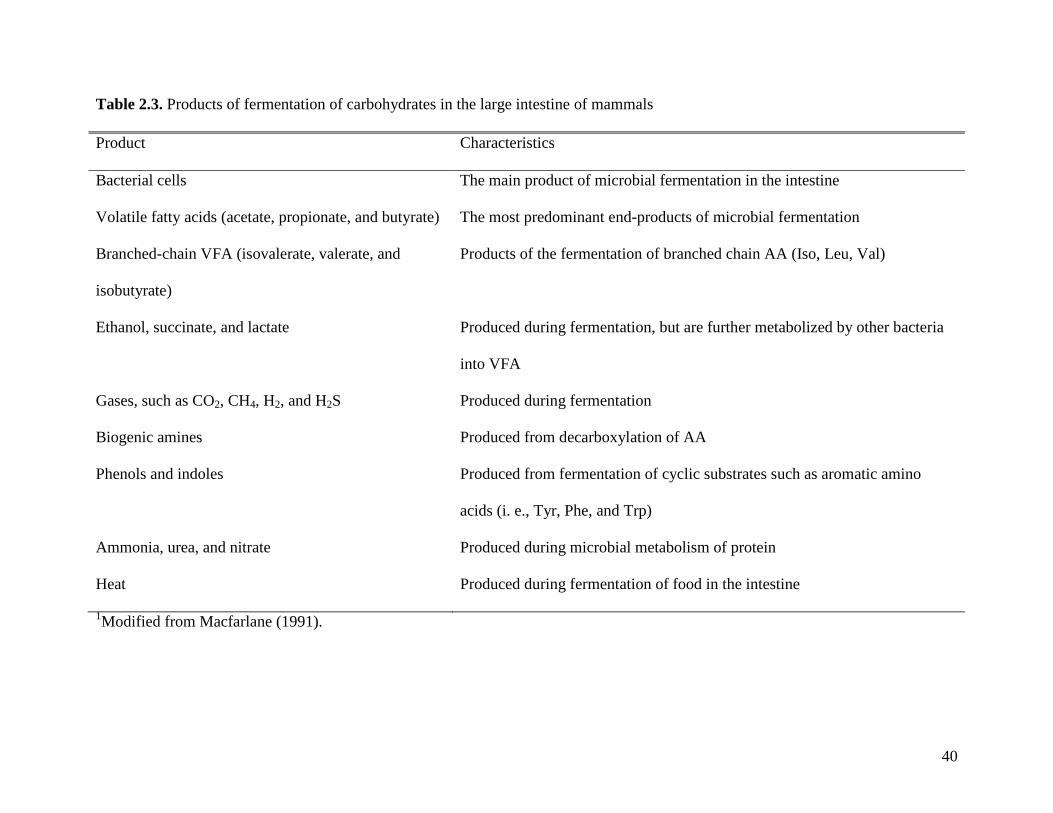
40
Table 2.3. Products of fermentation of carbohydrates in the large intestine of mammals
Product Characteristics
Bacterial cells The main product of microbial fermentation in the intestine
Volatile fatty acids (acetate, propionate, and butyrate) The most predominant end-products of microbial fermentation
Branched-chain VFA (isovalerate, valerate, and
isobutyrate)
Products of the fermentation of branched chain AA (Iso, Leu, Val)
Ethanol, succinate, and lactate Produced during fermentation, but are further metabolized by other bacteria
into VFA
Gases, such as CO2, CH4, H2, and H2S Produced during fermentation
Biogenic amines Produced from decarboxylation of AA
Phenols and indoles Produced from fermentation of cyclic substrates such as aromatic amino
acids (i. e., Tyr, Phe, and Trp)
Ammonia, urea, and nitrate Produced during microbial metabolism of protein
Heat Produced during fermentation of food in the intestine
1Modified from Macfarlane (1991).
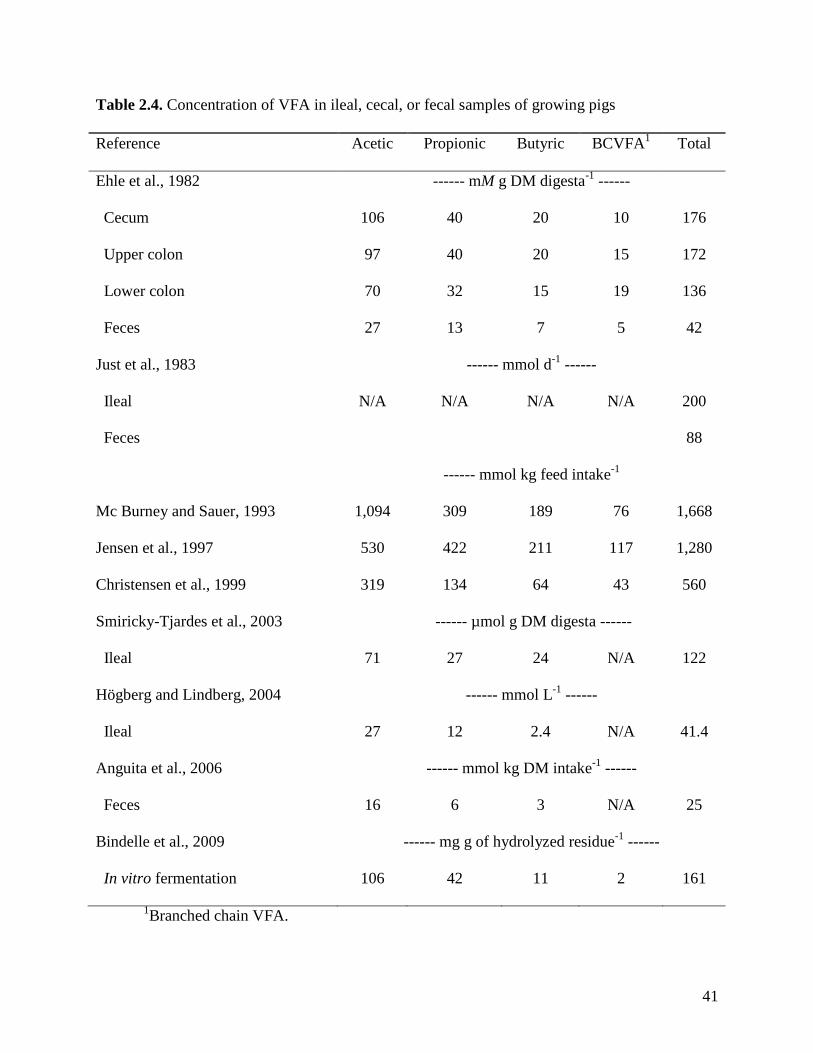
41
Table 2.4. Concentration of VFA in ileal, cecal, or fecal samples of growing pigs
Reference Acetic Propionic Butyric BCVFA1
Total
Ehle et al., 1982 ------ mM g DM digesta-1
------
Cecum 106 40 20 10 176
Upper colon 97 40 20 15 172
Lower colon 70 32 15 19 136
Feces 27 13 7 5 42
Just et al., 1983 ------ mmol d-1
------
Ileal N/A N/A N/A N/A 200
Feces 88
------ mmol kg feed intake-1
Mc Burney and Sauer, 1993 1,094 309 189 76 1,668
Jensen et al., 1997 530 422 211 117 1,280
Christensen et al., 1999 319 134 64 43 560
Smiricky-Tjardes et al., 2003 ------ µmol g DM digesta ------
Ileal 71 27 24 N/A 122
Högberg and Lindberg, 2004 ------ mmol L-1
------
Ileal 27 12 2.4 N/A 41.4
Anguita et al., 2006 ------ mmol kg DM intake-1
------
Feces 16 6 3 N/A 25
Bindelle et al., 2009 ------ mg g of hydrolyzed residue-1
------
In vitro fermentation 106 42 11 2 161
1Branched chain VFA.
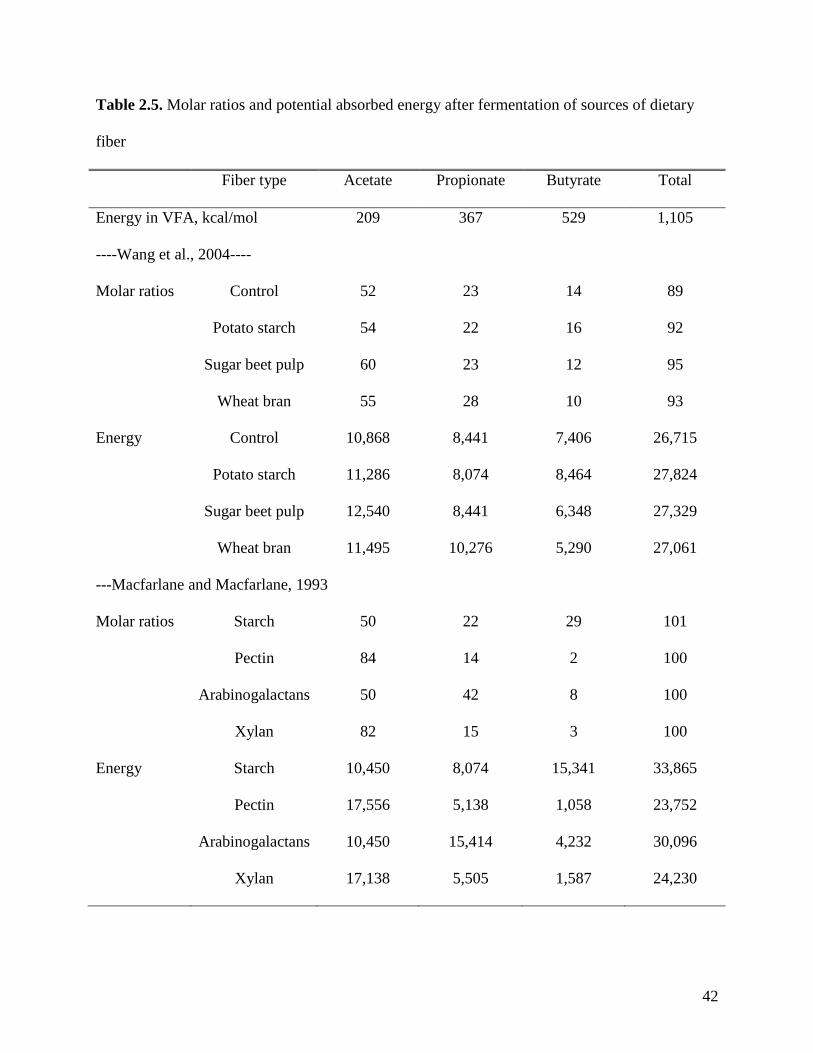
42
Table 2.5. Molar ratios and potential absorbed energy after fermentation of sources of dietary
fiber
Fiber type Acetate Propionate Butyrate Total
Energy in VFA, kcal/mol 209 367 529 1,105
----Wang et al., 2004----
Molar ratios Control 52 23 14 89
Potato starch 54 22 16 92
Sugar beet pulp 60 23 12 95
Wheat bran 55 28 10 93
Energy Control 10,868 8,441 7,406 26,715
Potato starch 11,286 8,074 8,464 27,824
Sugar beet pulp 12,540 8,441 6,348 27,329
Wheat bran 11,495 10,276 5,290 27,061
---Macfarlane and Macfarlane, 1993
Molar ratios Starch 50 22 29 101
Pectin 84 14 2 100
Arabinogalactans 50 42 8 100
Xylan 82 15 3 100
Energy Starch 10,450 8,074 15,341 33,865
Pectin 17,556 5,138 1,058 23,752
Arabinogalactans 10,450 15,414 4,232 30,096
Xylan 17,138 5,505 1,587 24,230
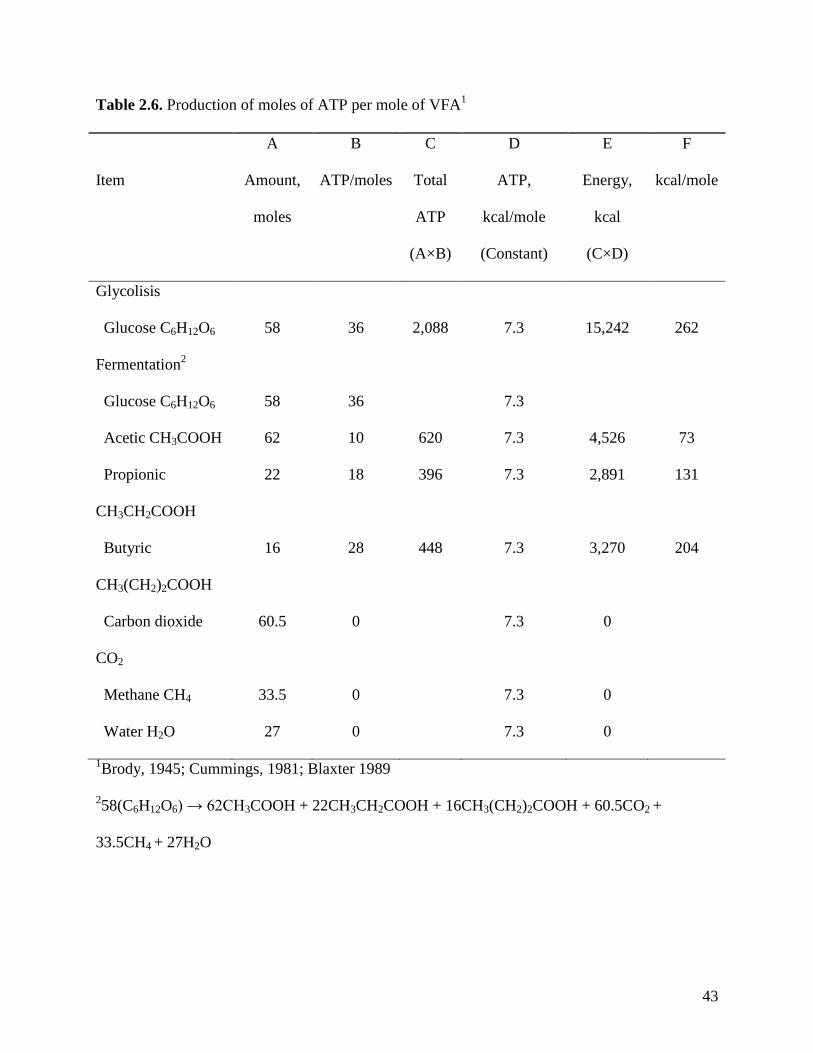
43
Table 2.6. Production of moles of ATP per mole of VFA1
A B C D E F
Item Amount,
moles
ATP/moles Total
ATP
(A×B)
ATP,
kcal/mole
(Constant)
Energy,
kcal
(C×D)
kcal/mole
Glycolisis
Glucose C6H12O6 58 36 2,088 7.3 15,242 262
Fermentation2
Glucose C6H12O6 58 36 7.3
Acetic CH3COOH 62 10 620 7.3 4,526 73
Propionic
CH3CH2COOH
22 18 396 7.3 2,891 131
Butyric
CH3(CH2)2COOH
16 28 448 7.3 3,270 204
Carbon dioxide
CO2
60.5 0 7.3 0
Methane CH4 33.5 0 7.3 0
Water H2O 27 0 7.3 0
1Brody, 1945; Cummings, 1981; Blaxter 1989
258(C6H12O6) → 62CH3COOH + 22CH3CH2COOH + 16CH3(CH2)2COOH + 60.5CO2 +
33.5CH4 + 27H2O
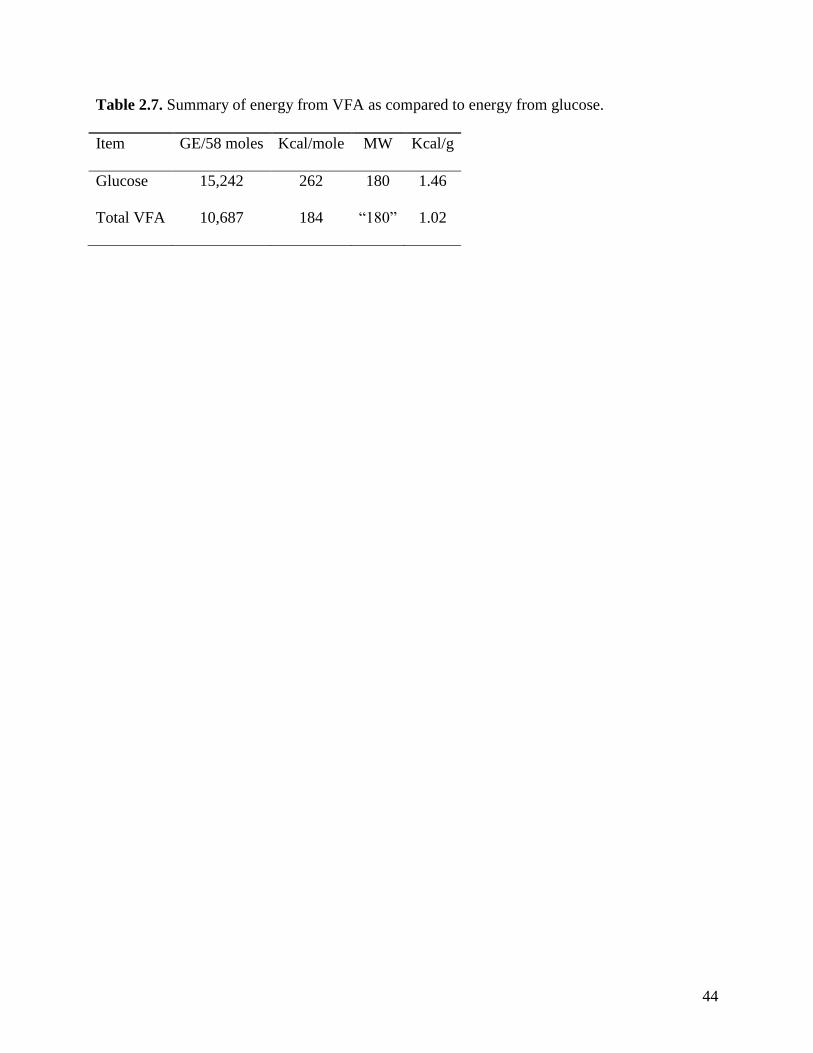
44
Table 2.7. Summary of energy from VFA as compared to energy from glucose.
Item GE/58 moles Kcal/mole MW Kcal/g
Glucose 15,242 262 180 1.46
Total VFA 10,687 184 ―180‖ 1.02
45
CHAPTER 3
Effects of distillers dried grains with solubles on AA, energy, and fiber digestibility and on
intestinal marker appearance of a corn soybean meal diet fed to growing pigs1
ABSTRACT: The objective of this experiment was to measure the effect of distillers dried
grains with solubles (DDGS) on the digestibility of AA, energy, and fiber, on the fermentation of
fiber, and on the first appearance of digesta at the end of the ileum, in the cecum, and in the feces
of growing pigs fed a corn soybean meal-based diet. Sixteen pigs (initial BW: 38.0 ± 1.6 kg)
were prepared with a T-cannula in the distal ileum and a T-cannula in the cecum and allotted to 2
treatments. In period 1, all pigs were fed a corn soybean meal diet. In periods 2, 3, and 4, pigs
were fed the control diet or a diet containing corn, soybean meal, and 30% DDGS. First
appearance of digesta at the end of the ileum, in the cecum, and over the entire intestinal tract
was measured at the end of period 4. The apparent ileal digestibility (AID) and the apparent total
tract digestibility (ATTD) of nutrients were measured and the concentration of VFA was
analyzed in ileal, cecal, and fecal samples. The AID of Lys (74.1%) in the DDGS diet was lower
(P < 0.05) than in the control diet (78.6%), but the AID of most other AA and GE, NDF, and
total dietary fiber (TDF) were not different between the 2 diets. The ATTD of GE (81.0%), NDF
(57.2%), TDF (55.5%), and DM (81.7%) were lower (P < 0.05) in the DDGS diet than in the
control diet (86.0, 69.3, 66.0, and 87.2%, respectively). The concentration of VFA in ileal, cecal,
and fecal samples was not different between pigs fed the 2 diets. The pH of ileal and cecal
digesta from pigs fed the DDGS diet (6.3 and 5.5) was greater (P < 0.01) than from pigs fed the
control diet (5.8 and 5.3). The ATTD of DM, GE, ADF, NDF, and TDF did not change with
1Used with permission J Anim Sci 2009 :doi: jas.2009-2162v1-20092162
46
collection period, but the AID of ADF, NDF, and TDF increased (P < 0.05) from period 2 to
period 4. The concentration of all VFA, except isobuturate, was greater (P < 0.05) in cecal
samples from period 4 compared with period 2, and the concentration of all VFA except
propionate and isovalerate were greater (P < 0.05) in fecal samples collected in period 4
compared with those collected in period 2. The first appearance of digesta at the end of the
ileum, in the cecum, and in the feces was not affected by DDGS. In conclusion, pigs fed the diet
containing DDGS had a lower digestibility of Lys, GE, ADF, NDF, and TDF than pigs fed the
control diet. The digestibility of DM and GE was not influenced by collection period, but the
concentration of VFA in cecal digesta and feces increased with the length of time pigs received
the diets.
Key words: digestibility, distillers dried grains with solubles, energy, fiber, pig
INTRODUCTION
The apparent total tract digestibility (ATTD) of energy and the apparent ileal digestibility
(AID) of AA are less in distillers dried grains with solubles (DDGS) than in corn (Stein et al.,
2006; Pedersen et al., 2007; Urriola et al., 2009a). This may be a result of the fiber concentration
in DDGS because DDGS contains approximately 3 times more dietary fiber than corn (Stein and
Shurson, 2009). The reason dietary fiber reduces digestibility of energy and AA is that fiber has
a low digestibility, induces an increase in endogenous nutrient losses, and increases the rate of
passage (Grieshop et al., 2001; Souffrant, 2001). Dietary fiber in DDGS consists mainly of
insoluble dietary fiber (Urriola et al., 2009b) that may increase the water binding capacity and
the bulkiness of the diet (Potkins et al., 1991; Cherbut et al., 1994). The AID and ATTD of
dietary fiber varies among sources of DDGS (Urriola et al., 2009b), but there is no information
47
on the effects of DDGS on digestibility of AA, energy, and fiber in mixed diets containing corn,
soybean meal, and DDGS.
The digestibility of energy may change as pigs adapt to the presence of fiber in the diet
(Longland et al., 1993) and fermentation of fiber increases over time. This results in greater
production of VFA and greater absorption of energy (Castillo et al., 2007), but there are no data
on the time it takes for pigs to adapt to the presence of DDGS in the diet.
The first objective of this experiment was to test the hypothesis that AID and ATTD of
energy and nutrients is lower in a diet containing 30% DDGS than in a corn soybean meal diet.
The second objective was to test the hypothesis that the digestibility of nutrients and energy will
increase if pigs are allowed to adapt to the presence of DDGS in the diet. The third objective was
to test the hypothesis that digesta from diets containing DDGS will appear sooner at the end of
the ileum, in the cecum, and in the feces than the digesta from pigs fed no DDGS.
MATERIALS AND METHODS
The protocol for this experiment was reviewed and approved by the Institutional Animal
Care and Use Committee at the University of Illinois at Urbana-Champaign.
Animals, Housing, and Diets
Sixteen growing barrows (initial BW: 38.0 ± 1.6 kg) that were the offspring of line 337
boars mated to C-22 females (Pig Improvement Company, Hendersonville, TN) were surgically
prepared with a T-cannula with an inner diameter of 1.6 cm in the distal ileum (Stein et al.,
1998). Another T-cannula with an inner diameter of 2.1 cm was inserted in the mid-cecum. The
ileal cannula was exteriorized immediately behind the last rib, while the cecal cannula was
exteriorized approximately 10 cm caudal to the ileal cannula. Following surgeries, pigs were
48
allowed to recover for 30 d and a corn soybean meal diet was provided on an ad libitum basis
during this time. All pigs were housed in individual pens (1.2 × 1.5 m) that had a nipple drinker,
a feeder, and a fully slatted tri-bar floor. The room temperature was between 20 and 22°C
throughout the experiment.
Two diets were formulated to contain similar concentrations of total Lys without using
crystalline Lys. The control diet was based on corn and soybean meal and the DDGS diet
contained corn, soybean meal, and 30% DDGS (Table 3.1). Because of the greater concentration
of GE, CP, and dietary fiber in DDGS than in corn and soybean meal, the concentration of these
components was greater in the DDGS diet than in the control diet. Titanium dioxide (Chicago
Sweeteners, Chicago, IL) was included at 3 g/kg in both diets as an indigestible marker.
Vitamins and minerals were included in both diets to meet or exceed nutrient requirements of
growing pigs (NRC, 1998).
Experimental Design and Sample Collection
Pigs were randomly allotted to 2 treatment groups with 8 pigs per treatment in a
randomized complete block design. Feed was provided to each pig at a daily level of 3.4 times
the maintenance requirement for energy (i.e., 106 kcal of ME per kg BW0.75
; NRC, 1998). The
calculated ME of the control diet and the DDGS diet was 3,336 kcal∙kg-1
and 3,350 kcal∙kg-1
,
respectively.
The daily feed allotments were divided into 2 equal meals that were provided at 0800 and
1700. Pigs were fed experimental diets during four 9-d periods. During the first period, all pigs
were fed the control diet. During the following 3 periods, pigs on each treatment group were fed
1 of the 2 treatment diets, and the same diet was provided during all 3 periods.
49
Feces were collected via grab sampling in the morning of d 5 of each period. The pH of
the fecal samples was measured immediately after collection using a pH meter (Model Accumet
Basic, Fisher Scientific, Pittsburgh, PA). Twenty grams of each fecal sample were mixed with
2N HCl in a 1:1 ratio and stored at -20°C until analyzed for concentrations of VFA. The
remaining feces were stored in plastic bags at -20°C. One sample of cecal digesta were collected
every 2 h from 0700 to 1700 h on d 6 and 7 of each collection period and ileal digesta were
collected continuously from 0730 to 1630 h on d 8 and 9. The procedures for collection and
storage of cecal and ileal digesta were similar to the procedure for ileal digesta described by
Cervantes-Pahm and Stein (2008). However, from each bag of cecal and ileal digesta, a
subsample of 10% was collected and mixed with 2N HCl at a 1:1 ratio. These samples were
combined within pig and collection period and stored at -20°C until analyzed for VFA. The pH
of the first cecal and the first ileal sample collected from each pig after 1000, 1200, 1400, and
1600 h on each collection d was also measured as described for the fecal samples.
After the conclusion of period 4, pigs were fed their respective diets for another 3 d to
measure the time it takes for digesta to appear at the end of the ileum, in the cecum, and in the
feces. On d 3 of this last period, the morning meal of each pig was mixed with 5 g/kg of chromic
oxide. Pigs were allowed to eat their meal and the start of eating was considered time zero. The
ileal cannula of each pig was opened 1 h after the morning meal was fed to observe if green
digesta were present in the cannula. The cannula was closed again if no green digesta were
present and the cannula was opened every 15 min thereafter until green digesta were detected.
The time of first appearance of green digesta was recorded. From that time, the cecal cannula
was opened every 15 min and the time for the first appearance of green color in the cecal digesta
50
was recorded. During the following 36 h, feces were scored every 30 min from all pigs, and the
first time green feces appeared was recorded.
Sample Processing and Chemical Analysis
At the conclusion of each experimental period, samples were thawed and mixed within
animal and a sub-sample was collected for chemical analysis. Ileal and fecal samples were
lyophilized and ground prior to analysis.
Samples of corn, soybean meal, DDGS, diets, ileal digesta, and feces were analyzed for
DM (method 930.15; AOAC Int., 2007), CP (method 990.03; AOAC Int., 2007), ADF (method
973.18; AOAC Int., 2007), NDF (Holst, 1973), and total dietary fiber (TDF; method 985.29;
AOAC Int., 2007). Energy was also analyzed in these samples using a bomb calorimeter (Model
6300, Parr Instuments, Moline, IL). Amino acids were analyzed on an amino acid analyzer
(Model No. L8800; Hitachi High Technologies America, Inc, Pleasaton, CA) using ninhydrin for
post-column derivatization and norleucine as the internal standard. Before analysis, samples
were hydrolyzed with 6N HCl for 24 h at 110°C (method 982.30 E[a]; AOAC Int., 2007).
Methionine and Cys were determined as Met sulfone and cysteic acid after cold performic acid
oxidation overnight before hydrolysis (method 982.30 E[b]; AOAC Int., 2007). Tryptophan was
determined after NaOH hydrolysis for 22 h at 110°C (method 982.30 E[c]; AOAC Int., 2007).
All diets and ileal digesta samples were analyzed for titanium (Myers et al., 2004). Water
binding capacity (WBC) was measured by weighing 1 g of sample into a centrifuge tube. This
sample was then mixed with 30 mL of distilled water (Robertson et al., 2000). After stirring,
samples were allowed to settle and were centrifuged for 20 min at 3,000 rpm. The supernatant
was removed and sample weights were recorded. Values for WBC were expressed as the amount
of water retained by the pellet (g/g DM).
51
The ileal, cecal, and fecal samples that were preserved in HCl were thawed and stirred,
and 1 mL was mixed with 9 mL of distilled water. One mL of this mixture was added to 4 mL of
25% metaphosphoric acid and vortexed. Samples were analyzed for VFA following the
procedure described by Erwin et al. (1961). Briefly, a gas chromatograph (Hewlett-Packard
5890A series II; Hewlett-Packard, Palo Alto, CA) was standardized with a glass column (180 cm
x 4 mm i.d.) packed with 10% SP-1200/1% H3PO4 on 80/100+ mesh Chromosorb WAW
(Supelco Inc., Bellefonte, PA). Nitrogen was used as the carrier with a flow rate of 75 mL/min.
Oven, detector, and injector temperatures were set at 125, 175, and 180°C, respectively.
Calculations
The AID of CP, AA, ADF, NDF, TDF, DM, and energy were calculated for each diet as
previously described (Stein et al., 2007), and the ATTD of ADF, NDF, TDF, DM, and energy
was also calculated using this equation. The fermentation of DM, energy, ADF, NDF, and TDF
in the large intestine was calculated by subtraction of the amount (g) of ileal digested nutrient or
DM from the amount (g) of total tract digested nutrient or DM. Fermentation of energy was
calculated by subtracting the amount (kcal) of ileal digested energy from the amount of total tract
digested energy (kcal).
The ileal flow of DM, ADF, NDF, and TDF was calculated using the following equation:
Flownutrient = Nutrientdigesta × (Markerdiet / Markerdigesta),
where Flownutrient is the flow of ADF, NDF, or TDF (g/kg DMI), Nutrientdigesta is the
concentration of DM, ADF, NDF, and TDF in ileal digesta (g/kg DM), Markerdiet is the
concentration of titanium in the diet (g/kg DM), and Markerdigesta is the concentration of titanium
in ileal digesta (g/kg DM). The flow over the entire intestinal tract was calculated using the same
equation and the ileal and fecal flow of energy (kcal/kg DMI) and the ileal, cecal, and fecal flow
52
of VFA were also calculated using this equation. The first appearance of digesta in the intestinal
tract of pigs was calculated as the difference between the time that the green marker was fed and
the time that it appeared in ileal, cecal, or fecal samples.
Statistical Analyses
The UNIVARIATE procedure of SAS (SAS Inst. Inc., Cary, NC) was used to determine
normal distribution of the data, equal variances, and to identify outliers. An observation was
considered an outlier if the value was more than 3 SD away from the mean. The AID data for
periods 2, 3, and 4 were analyzed by the MIXED procedure of SAS. The REPEATED statement
was used to model the effect of collection period on AID and ATTD values using the individual
pig as the subject from which repeated observations were recorded (Littell et al., 1998).
Digestibility values from period 1 were used as the covariate for each pig to correct for
differences in digestibility among pigs. Main effects were period and DDGS. The interaction
between period and DDGS was included in the initial model and considered significant at P ≤
0.05, but if it was not significant, the interaction was removed and only main effects were
included in the final model. Least square means were calculated using the LSMEAN statement
of SAS. The contrast option was used to identify linear and quadratic effects of collection period
on digestibility values. Pig was the experimental unit for all analyses. Differences among main
effects were considered significant if P < 0.05 and they were considered a trend if the P – value
was between 0.05 and 0.10. Data for first appearance of the digesta at the end of the ileum, in the
cecum, and in the feces were also analyzed by the MIXED procedure of SAS using pig as a
random variable. Period and DDGS were fixed effects and the interaction between period and
DDGS was included in the model, but removed from the final model if not significant.
53
RESULTS
All pigs were successfully cannulated at the distal ileum and in the mid-cecum. Pigs
recovered from surgery without complications. The BW of pigs at the start of period 1, 2, 3, and
4 was 71.7 ± 6.4, 75.4 ± 6.6, 84.8 ± 10.0, and 95.4 ± 8.3 kg, respectively. The final BW at the
end of period 4 was 103.7 ± 9.2 kg. The analyzed nutrient concentration in the diets was similar
to calculated values (Table 3.2). The control diet had a lower concentration of GE (3,897
kcal/kg), CP (14.8%), ADF (2.85%), NDF (11.3%), and TDF (12.4%) than the diet containing
30% DDGS (GE, 4,294 kcal/kg; CP, 18.5%; ADF, 4.65%; NDF, 15.1%; and TDF, 17.0%).
Whenever effects of period were analyzed, no differences between period 2 and 3 were observed.
Therefore, values for period 3 are not reported.
Apparent Ileal Digestibility, Apparent Total Tract Digestibility, and Hindgut Fermentation
The AID of Lys and Asp were lower (P < 0.05) in the DDGS diet than in the control diet
(Table 3.3), and the AID for Leu and Ala were greater (P < 0.05) in the DDGS diet than in the
control diet. There was also a tendency (P < 0.10) for the digestibility of Met and Tyr to be
greater in the DDGS diet than in the control diet, but there were no differences in the AID of CP
or any other AA between the 2 diets, and there was no effect of period on the AID of CP or AA.
The AID of GE, NDF, and TDF were not affected by inclusion of 30% DDGS in the diet
(Table 3.4). The AID of DM in the DDGS diet (71.2%) was lower (P < 0.01) than the AID of
DM in the control diet (74.0%). In contrast, the AID of ADF in the DDGS diet (33.8%) was
greater (P < 0.01) than in the control diet (13.1%). The ATTD of DM (81.7%), GE (81.0%),
NDF (57.2%), and TDF (55.5%) were also less (P < 0.05) in the DDGS diet than in the control
diet (87.2, 86.0, 69.3, and 66.0, respectively). The AID of ADF, NDF, and TDF increased
(linear, P < 0.05) from period 2 (21.0, 38.5, and 32.2%, respectively) to period 4 (29.4, 44.7, and
54
39.8, respectively). However, there was no effect of period on the ATTD of DM, GE, ADF,
NDF, and TDF.
The hindgut fermentation of DM (11.5%), GE (8.9%), ADF (21.0%), NDF (18.1%), and
TDF (20.5%) were less (P < 0.05) in the DDGS diet than in the control diet (13.9, 13.2, 41.1,
26.8, and 29.9%, respectively). The hindgut fermentation of ADF, NDF, and TDF was reduced
(linear, P < 0.05) from period 2 (36.0, 27.2, and 31.1%, respectively) to period 4 (28.2, 20.7, and
23.2%, respectively).
Ileal and Total Tract Flow of DM, GE, ADF, NDF, and TDF
The ileal flow of DM, ADF, NDF, and TDF was greater (P < 0.01) in pigs fed the DDGS
diet (273, 35, 105, and 126 g/kg DMI) than in pigs fed the control diet (239, 29, 75, 92 g/kg
DMI; Table 3.5). The ileal flow of GE was also greater (P < 0.01) in pigs fed the DDGS diet
(1,371 kcal/kg DMI) than in pigs fed the control diet (1,220 kcal/kg DMI). The ileal flow of
ADF and TDF decreased (linear, P < 0.05) from period 2 (33 and 114 g/kg DMI) to period 4 (30
and 102 g/kg DMI), and there was a tendency (linear, P < 0.10) for a decrease in the ileal flow of
NDF and DM from period 2 to period 4.
The total tract flow of DM, ADF, NDF, and TDF were greater (P < 0.01) in pigs fed the
DDGS diet (169, 39, 120, and 140 g/kg DMI) than in pigs fed the control diet (118, 31, 84, and
103 g/kg DMI). The total tract flow of GE was also greater in pigs fed the DDGS diet (926
kcal/kg DMI) than in pigs fed the control diet (633 kcal/kg of DMI).
Ileal, Cecal, and Fecal pH and concentration of VFA
The pH of ileal digesta (Table 3.6) from pigs fed the DDGS diet (6.3) was greater (P <
0.05) than the pH of ileal digesta from pigs fed the control diet (5.8). Likewise, the pH of cecal
digesta from pigs fed the DDGS diet (5.5) was greater (P < 0.05) than the pH of cecal digesta
55
from pigs fed the control diet (5.3). There was, however, no effect of collection period on the pH
of feces and the pH of feces in period 4 was not different from the pH of feces in period 2.
The concentration of VFA in ileal, cecal, and fecal samples was not different between the
control diet and the DDGS diet, but the ileal concentrations of isobutyrate, isovalerate, and
valerate were below detection levels and are, therefore, not reported. The concentration of
acetate (416 mmol/kg), propionate (162 mmol/kg), butyrate (66 mmol/kg), isovalerate (0.8
mmol/kg), and valerate (17.6 mmol/kg) measured in cecal samples in period 2 increased linearly
(P < 0.05) to 443, 196, 76, 9.8, and 26.4 mmol/kg in period 4. The concentration of acetate (596
vs. 350 mmol/kg), isobutyrate (79 vs. 10 mmol/kg), butyrate (83 vs. 52 mmol/kg), and valerate
(33 vs. 21 mmol/kg) also increased (linear P < 0.01) in fecal samples from period 2 to period 4,
but the concentration of propionate in fecal samples was not affected by collection period.
First Appearance of Digesta
The time from feed was ingested until it first appeared in ileal digesta in pigs fed the
control diet (238 min) was not different from the time it took for digesta to appear at the end of
the ileum in pigs fed the DDGS diet (225 min; Table 3.7). Likewise, the time for the first
appearance of digesta in the cecum of pigs fed the control diet (263 min) was not different from
that of pigs fed the DDGS diet (277 min). The time it took for digesta to appear in the feces of
pigs fed the control diet (1,603 min) was not different from the time it took for pigs fed the diet
containing DDGS (1,674 min).
DISCUSSION
Inclusion of DDGS in a corn soybean meal diet increases the concentration of dietary
fiber in the diet. The effects of dietary fiber on energy and nutrient digestibility may be
56
influenced by the physicochemical characteristics of dietary fiber. In DDGS, most of the TDF is
insoluble (Urriola et al., 2009b).
The AID of Lys may be reduced by heating and by the addition of solubles to the distilled
grains during the production of DDGS (Stein and Shurson, 2009). The AID of Lys in the DDGS
diet was lower than the AID of Lys in the control diet, which agrees with the observation that the
AID of Lys in DDGS is lower than the AID of Lys in corn (Stein et al., 2006). Dietary fiber may
reduce the digestibility of AA (Shultze et al., 1994). The DDGS diet contained more TDF
(17.0%) than the control diet (12.4%), but there was no difference in the AID of most AA
between the 2 diets. The reason for this observation may be that insoluble dietary fiber has only
minor effects on the digestibility of dietary AA (Zhu et al., 2005) and on the basal endogenous
losses of AA (Leterme et al., 1996). The DDGS diet also contained more ether extract than the
control diet and dietary ether extract may increase the digestibility of AA because high fat
digesta moves through the intestinal tract more slowly than low fat digesta (Cervantes-Pahm and
Stein, 2008). This may be the reason why the digestibility of only Lys was less in the DDGS diet
than in the control diet.
Insoluble fiber have minimal effect on the ileal digestion and absorption of nutrients and
energy, which has been demonstrated in several experiments that used different sources of
insoluble dietary fiber (Wang et al., 2002; Serena et al., 2008b). It has also been shown that the
AID and the ATTD of acid hydrolyzed fat is not affected by dietary levels of NDF provided as
wood cellulose (Kil et al., 2007). Results of this experiment showing that there is no effect of
DDGS on the AID of GE and most AA in a corn soybean meal diet, therefore, is in agreement
with previous results.
57
The lower ATTD of DM, GE, NDF, and TDF in the DDGS diet than in the control diet
may be due to the lower ATTD of NDF and TDF in DDGS than in soybean meal. Dietary fiber
in soybean meal is more soluble and contains highly fermentable oligosaccharides such as
stachyose and raffinose (Bach Knudsen, 1997; Karr-Lilienthal et. al., 2005), whereas corn fiber
is mainly insoluble and composed of cellulose and arabinoxylans that are more resistant to
hindgut fermentation (Bach Knudsen, 1997; Guillon et al., 2007). It is, therefore, likely that the
increased concentration of corn fiber in the DDGS diet is the reason for the lower ATTD of NDF
and TDF in the DDGS diet than in the control diet.
It was expected that the fiber in DDGS would stimulate bowel movement and reduce the
time it took for first digesta appearance at the end of the ileum, in the cecum, and in the feces
(Bastianelli et al., 1996; Scheneeman, 1998; Bindelle et al., 2008). However, in the current
experiment, the first appearance of digesta in pigs fed the DDGS diet and the control diet was not
different, despite the greater concentration of TDF in DDGS than in corn and soybean meal. The
time it took for digesta to appear at the end of the ileum for pigs fed both diets is similar to
previously reported data for growing-finishing pigs fed diets containing no DDGS (Ehle et al.,
1982; Kim et al., 2007; Wilfart et al., 2007). The reason for this observation may be that DDGS
contains more fat than corn and soybean meal (Spiehs et al., 2002; Stein and Shurson, 2009) and
the presence of fat in the small intestine increases the secretion of cholecystokinin, which may
reduce gastric emptying (Cervantes-Pahm and Stein, 2008). The lack of an effect of DDGS on
marker appearance at the end of the ileum, in the cecum, and over the entire tract indicates that
the effects of TDF and fat in DDGS neutralize each other so that the net effect is that first
appearance of digesta at the end of the ileum, in the cecum, and in the feces is not changed when
DDGS is included in the diet.
58
It was expected that the AID and the ATTD of nutrients, especially TDF, would increase
with time as has been shown in previous experiments (Longland et al., 1993; Castillo et al.,
2007). This effect was observed for the AID of ADF, NDF and TDF, but not for the ATTD of
DM, GE, ADF, NDF, or TDF. This observation indicates that fermentation in the small intestine
increases if fiber is fed for a longer time, but this increase is followed by a reduction in hindgut
fermentation so the end result is that the ATTD of fiber is not changed. We are not aware of any
other data that have shown this effect of time on the fermentation of fiber in pigs fed DDGS
containing diets.
This experiment used pigs that had a T-cannula installed in the distal ileum and another
T-cannula was installed in the cecum. This allowed for collection of digesta from the distal ileum
and from the cecum in the same pigs. The pigs that were used in this experiment tolerated the
procedure well and did not seem to have any discomfort from the 2 cannulas. Previous
experiments used 2 sets of pigs to collect ileal and cecal digesta for measurements of VFA
concentration (Htoo et al., 2007). The ileal cannula is needed for the measurement of ileal
digestibility of AA and also allows for measurement of VFA in the ileal digesta. The cecal
cannula allows for measurements of VFA in cecal contents, which is an important indicator of
cecal fermentation as it has been demonstrated that there is a substantial synthesis of VFA in the
cecum (Htoo et al., 2007; Serena et al., 2008a).
Fermentation of branched chained AA yields branched chained fatty acids (Macfarlane et
al., 1992). The concentration of the branched chained fatty acids was below the detection limit in
ileal digesta, but concentrations of these fatty acids in cecal digesta and in fecal samples was
greater than in ileal digesta, which indicates fermentation of undigested protein in the cecum and
colon. There were, however, no differences between the 2 treatment groups, which indicate that
59
the greater concentration of CP in the DDGS-containing diet than in the control diet did not
increase the synthesis of branched chained fatty acids in the cecum and colon. The concentration
of VFA in feces that were obtained in the current experiment is within the range of reported
values for pigs fed diets based on cereal by products (McBurney and Sauer, 1993; Jensen et al.,
1997), but no differences among treatments were observed.
In conclusion, results of this experiment indicate that inclusion of 30% DDGS in a corn
soybean meal diet does not affect ileal digestibility of energy or most AA, but the ileal
digestibility of Lys is reduced if DDGS is included in the diet. The total tract digestibility of
energy and fiber is also reduced if DDGS is used in the diet because dietary fiber in DDGS is
partially resistant to hindgut fermentation and the flow through the intestinal tract of DM and
energy increases if DDGS is included in the diet. The pH of the feces and the digesta passage
rate are, however, not influenced by the presence of DDGS in the diet. The AID of AA did not
change as pigs were fed their diet for a longer time indicating that a 7-d adaptation period is
sufficient for measuring AA digestibility. Likewise, the digestibility of energy was not
influenced by the time the diet was fed to the pigs, but the ileal digestibility of ADF, NDF, and
TDF increased as pigs were fed their respective diets for a longer period. However, this increase
was followed by a reduction in hindgut fermentation of fiber, and the ATTD of ADF, NDF, and
TDF was, therefore, not influenced by the time diets were fed to the pigs.
60
LITERATURE CITED
AOAC Int. 2007. Official Methods of Analysis of AOAC Int. 18th
ed. AOAC Int., Gaithersburg,
MD.
Bach Knudsen, K. E. 1997. Carbohydrate and lignin contents of plant materials used in animal
feeding. Anim. Feed Sci. Technol. 67:319-338.
Bastianelli, D., D. Sauvant, and A. Rerat. 1996. Mathematical modeling of digestion and nutrient
absorption in the pig. J. Anim. Sci. 74:1873–1887.
Bindelle J., P. Leterme, and A. Buldgen. 2008. Nutritional and environmental consequences of
dietary fibre in pig nutrition: a review. Biotechnol. Agron. Soc. Environ. 12:69-80.
Castillo, M., S. M. Martin-Orue, M. Anguita, J. F. Perez, and J. Gasa. 2007. Adaptation of gut
microbiota to corn physical structure and different types of dietary fibre. Livest. Sci.
109:149-152.
Cervantes-Pahm, S. K., and H. H. Stein. 2008. Effects of soybean oil and soybean protein
concentration on the concentration of digestible amino acids in soybean products fed to
growing pigs. J. Anim Sci. 2008. 86:1841-1849.
Cherbut, C. S. B. Des Varannes, M. Scnee, M. Rival, J-P. Galmiche, and J. Delort-Laval. 1994.
Involvement of small intestinal motility in blood glucose response to dietary fibre in man. Br.
J. Nutr. 71:675-685.
Ehle, F. R., J. L. Jeraci, J. B. Robertson, and P. J. van Soest. 1982. The influence of dietary fiber
on digestibility, rate of passage and gastrointestinal fermentation in pigs. J. Anim. Sci.
55:1071-1081.
Erwin, E. S., G. J. Marco, and E. M. Emery. 1961. Volatile fatty acid analyses of blood and
rumen fluid by gas chromatography. J. Dairy Sci. 44:1768–1771.
61
Guillon, F., L. Saulnier, P. Robert, J. F. Thibault, and M. Champ. 2007. Chemical structure and
function of cell wall through cereal grains and vegetable samples. Pages 31-64 in Dietary
Fibre Components and Functions. H. Salovaara, F. Gates, and M. Tenkanen, ed.
Wageningen Academic Publishers. Wageningen, the Netherlands.
Grieshop, C. M., D. E. Reese, and G. C. Fahey Jr. 2001. Non-starch polysaccharides and
oligosaccharides in swine nutrition. Pages 107-130 in Swine Nutrition. Lewis, A. J., and
L. L. Southern, ed. CRC Press Boca Raton, FL.
Htoo, J. K., B. A. Araiza, W. C. Sauer, M. Rademacher, Y. Zhang, M. Cervantes, and R. T.
Zijlstra. 2007. Effect of dietary protein content on ileal amino acid digestibility, growth
performance, and formation of microbial metabolites in ileal and cecal digesta of early-
weaned pigs J. Anim. Sci. 85: 3303-3312.
Holst, D. O. 1973. Holst filtration apparatus for Van Soest detergent fiber analysis. J. AOAC
56:1352-1356.
Karr-Lilienthal, L. K., C. T. Kadzere, C. M. Grieshop, and G. C. Fahey Jr. 2005. Chemical and
nutritional properties of soybean carbohydrates as related to nonruminants: A review. Livest.
Prod. Sci. 97:1-12.
Kil, D. Y., T. E. Sauber, and H. H. Stein. 2007. Effect of form of fat and NDF addition on
apparent ileal and apparent total tract digestibility of fat in diets fed to growing pigs. J. Anim.
Sci. 85(Suppl. 1):611. (Abstr.)
Kim, B. G., M. D. Lindemann, G. L. Cromwell, A. Balfagon, and J. H. Agudelo. 2007. The
correlation between passage rate of digesta and dry matter digestibility in various stages of
swine. Livest. Sci. 109:81-84.
62
Jensen, B. B., L. L. Mikkelsen, and D. N. Christensen. 1997. Integration of ileum cannulated
pigs and in vitro incubations to quantify the effect of diet composition on microbial
fermentation in the large intestine. Pages 106–110 in Energy and Protein Evaluation for Pigs
in Nordic Countries. H. Jørgensen and J. Fernandez, ed. Research Centre Foulum, Tjele,
Denmark.
Leterme, P., P. van Leeuwen, A. Thewis, and J. Huisman. 1996. Chemical composition of pea
inner fiber isolates and their effect on endogenous digestive secretions in pigs. J. Sci. Food
Agric. 72:127-134.
Littell, R. C., P. R. Henry, and C. B. Ammerman. 1998. Statistical analysis of repeated measures
data using SAS procedures. J. Anim. Sci. 76:1216–1231.
Longland, A. C., A. G. Low, D. B. Quelch, and S. P. Bray. 1993. Adaptation to the digestion of
non-starch polysaccharide in growing pigs fed on cereal or semi-purified basal diets. Br. J.
Nutr. 70:557-566.
Macfarlane, G. T., G. R. Gibson, E. Beatty, and J. H. Cummings. 1992. Estimation of short-chain
fatty acid production from protein by human intestinal bacteria based on branched-chain fatty
acid measurements. FEMS Microb. Ecol. 101:81-88.
McBurney, M. I., and W. C. Sauer. 1993. Fiber and large bowel energy absorption: Validation of
the integrated ileostomy-fermentation model using pigs. J. Nutr. 123:721–727.
Myers, W. D., P. A. Ludden, V. Nayigihugu, and B. W. Hess. 2004. Technical note: A procedure
for the preparation and quantitative analysis of samples for titanium dioxide. J. Anim. Sci.
82:179-183.
NRC. 1998. Nutrient Requirements of Swine. 10th
rev. ed. Natl. Acad. Press, Washington, DC.
63
Pedersen C., M. G. Boersma, and H. H. Stein. 2007. Digestibility of energy and phosphorous in
ten samples of distillers dried grains with soluble fed to growing pigs. J. Anim. Sci. 85:1168-
1176.
Potkins, Z. V., T. L. J. Lawrence, and J. R. Thomlinson. 1991. Effects of structural and non-
structural polysaccharides in the diet of the growing pig on gastric emptying rate and rate of
passage of digesta to the terminal ileum and throught the total gastrointestinal tract. Br. J.
Nutr. 65:391-413.
Robertson, J. A., F. D. de Monredon, P. Dysseler, F. Guillon, R. Amado, and J. F. Thibault.
2000. Hydration properties of dietary fiber and resistant starch: a european collaborative
study. Lebensmittel-Wissenschaft und Technologie 33:72-79.
Serena A., M. S. Hedemann, and K. E. Bach Knudsen. 2008a. Influence of dietary fiber on
luminal environment and morphology in the small and large intestine of sows. J. Anim. Sci.
86:2217-2227.
Serena A., H. Jørgensen, and K. E. Bach Knudsen. 2008b. Digestion of carbohydrates and
utilization of energy in sows fed diets with contrasting levels and physicochemical properties
of dietary fiber. J. Anim. Sci. 86:2208-2216.
Schneeman, B. O. 1998. Dietary fiber and gastrointestinal function. Nutr. Res. 4:625-632.
Schulze, H., P. van Leeuwen, M. W. A. Verstegen, J. Huisman, W. B. Souffrant, and F. Ahrens.
1994. Effect of level of dietary neutral detergent fiber on ileal apparent digestibility and ileal
nitrogen losses in pigs. J. Anim. Sci. 72:2362-2368.
Souffrant, W. B. 2001. Effect of dietary fiber on ileal digestibility and endogenous nitrogen
losses in the pig. Anim. Feed Sci. Technol. 90:93-102.
64
Spiehs, M. J., M. H. Whitney, and G. C. Shurson. 2002. Nutrient database for distiller’s dried
grains with solubles produced from new ethanol plants in Minnesota and South Dakota. J.
Anim. Sci. 80:2639–2645.
Stein H. H., and G. C. Shurson. 2009. BOARD INVITED REVIEW: The use and application of
distillers dried grains with solubles (DDGS) in swine diets. J. Anim. Sci. 87:1292-1303.
Stein, H. H., M. L. Gibson, C. Pedersen, and M. G. Boersma. 2006. Amino acid and energy
digestibility in ten samples of distillers dried grain with solubles fed to growing pigs. J.
Anim. Sci. 84: 853-860.
Stein, H. H., B. Sève, M. F. Fuller, P. J. Moughan, and C. F. M. de Lange. 2007. Invited review:
Amino acid bioavailability and digestibility in pig feed ingredients: Terminology and
application. J. Anim. Sci. 85:172-180.
Stein, H. H., C. F. Shipley, and R. A. Easter. 1998. Technical Note: A technique for inserting a
T-cannula into the distal ileum of pregnant sows. J. Anim. Sci. 76:1433-1436.
Urriola, P. E., C. Pedersen, H. H. Stein, and G. C. Shurson. 2009a. Amino acid digestibility of
distillers dried grains with solubles, produced from sorghum, a sorghum-corn blend, and corn
fed to growing pigs. J. Anim. Sci. 87:2574-2580.
Urriola, P. E., G. C. Shurson, and H. H. Stein. 2009b. Digestibility of dietary fiber in distillers
co-products fed to growing pigs. J. Anim. Sci. 87(Suppl. 3): 145. (Abstr.)
Wang, J. F., B. B. Jensen, H. Jørgensen, D. F. Li, and J. E. Lindberg. 2002. Ileal and total tract
digestibility, and protein and fat balance in pigs fed rice with addition of potato starch, sugar
beet pulp or wheat bran. Anim. Feed Sci. Technol. 102:125–136.
65
Wilfart A., L. Montagne, H. Simmins, J. Noblet, and J. van Milgen. 2007. Digesta transit in
different segments of the gastrointestinal tract of pigs as affected by insoluble fibre supplied
by wheat bran. Br. J. Nutr. 98:54-62.
Zhu, C. L., M. Rademacher, and C. F. M. de Lange. 2005. Increasing dietary pectin level reduces
utilization of digestible threonine intake, but not lysine intake, for body protein deposition in
growing pigs. J. Anim. Sci. 83:1044-1053.
66
Table 3.1. Composition of experimental diets, as-fed basis
Distillers dried grains with solubles, %
Item 0 30
Ingredient, %
Ground corn 78.75 54.60
Soybean meal (48% CP) 18.00 12.50
Distillers dried grains with solubles
- 30.00
Cornstarch 1.00 1.00
Ground limestone 0.75 1.00
Dicalcium phosphate 0.80 0.20
Salt 0.40 0.40
Vitamin mineral premix1 0.30 0.30
Calculated concentration
ME, kcal∙kg-1
3,336 3,350
CP, % 15.10 18.70
Lys, standardized ileal digestible, % 0.66 0.66
Ether extract, % 3.30 5.60
NDF, % 9.10 19.00
Total dietary fiber, % 10.00 16.20
1The vitamin-micromineral premix provided the following quantities of vitamins and
micro minerals per kilogram of complete diet: Vitamin A, 11,128 IU; vitamin D3, 2,204 IU;
vitamin E, 66 IU; vitamin K, 1.42 mg; thiamin, 0.24 mg; riboflavin, 6.58 mg; pyridoxine, 0.24
mg; vitamin B12, 0.03 mg; D-pantothenic acid, 23.5 mg; niacin, 44 mg; folic acid, 1.58 mg;
67
biotin, 0.44 mg; Cu, 10 mg as copper sulfate; Fe, 125 mg as iron sulfate; I, 1.26 mg as potassium
iodate; Mn, 60 mg as manganese sulfate; Se, 0.3 mg as sodium selenite; and Zn, 100 mg as zinc
oxide.
68
Table 3.2. Analyzed nutrient composition of experimental diets, as-fed basis
Distillers dried grains with solubles, %
Item 0 30
GE, kcal/kg 3,897 4,294
CP, % 14.8 18.5
Acid hydrolyzed ether extract, % 3.07 7.42
ADF, % 2.85 4.65
NDF, % 11.3 15.1
Total dietary fiber, % 12.4 17.0
Water binding capacity, g/g 1.81 1.96
Indispensable AA, %
Arg 0.89 0.99
His 0.39 0.48
Ile 0.59 0.69
Leu 1.43 1.94
Lys 0.74 0.77
Met 0.26 0.35
Phe 0.71 0.88
Thr 0.53 0.66
Trp 0.18 0.19
Val 0.73 0.87
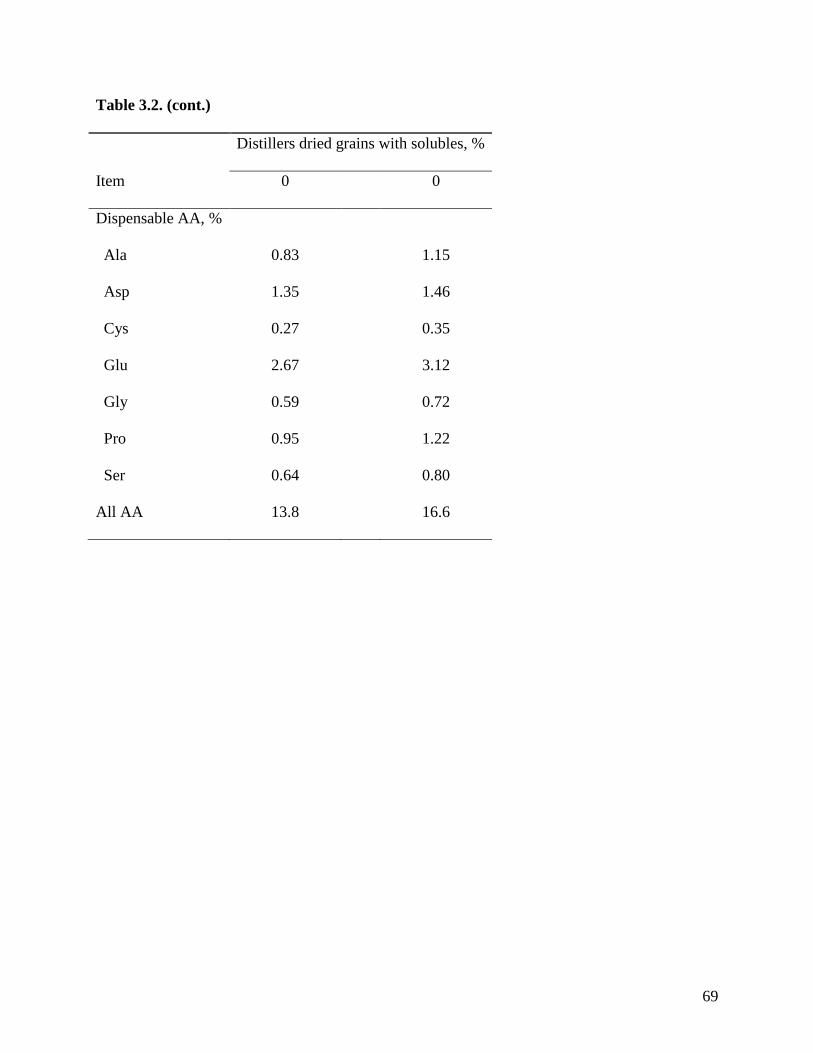
69
Table 3.2. (cont.)
Distillers dried grains with solubles, %
Item 0 0
Dispensable AA, %
Ala 0.83 1.15
Asp 1.35 1.46
Cys 0.27 0.35
Glu 2.67 3.12
Gly 0.59 0.72
Pro 0.95 1.22
Ser 0.64 0.80
All AA 13.8 16.6
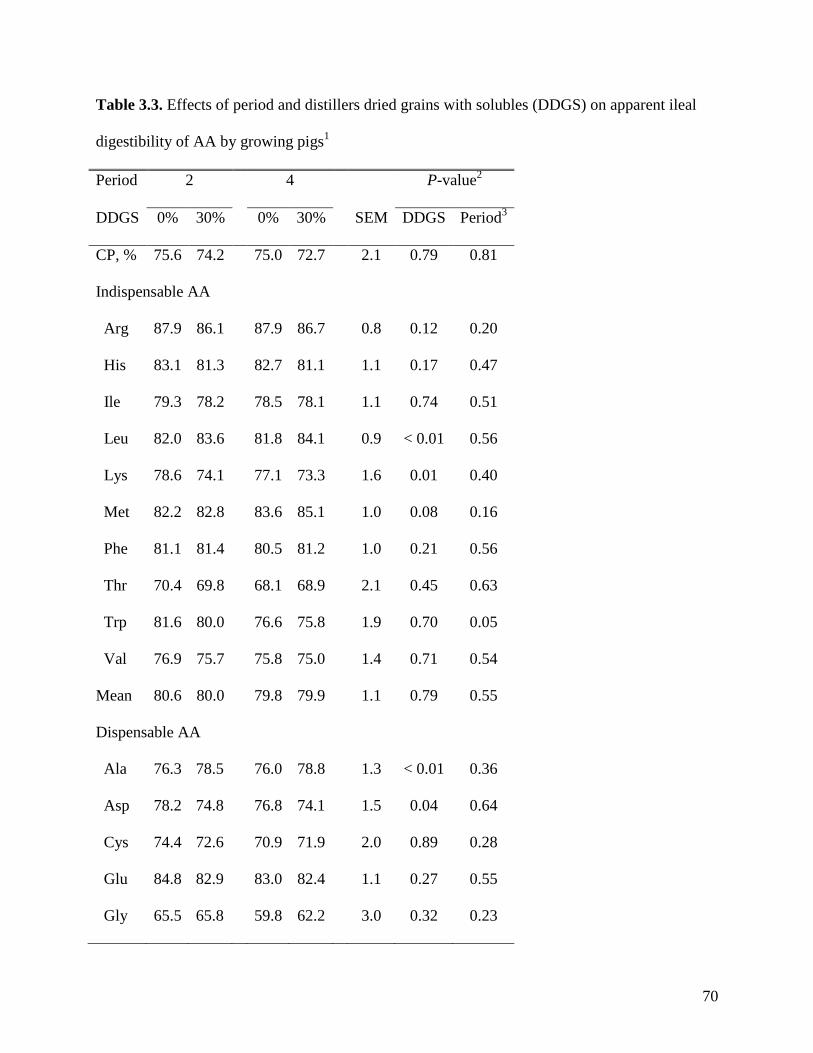
70
Table 3.3. Effects of period and distillers dried grains with solubles (DDGS) on apparent ileal
digestibility of AA by growing pigs1
Period 2 4 P-value2
DDGS 0% 30% 0% 30% SEM DDGS Period3
CP, % 75.6 74.2 75.0 72.7 2.1 0.79 0.81
Indispensable AA
Arg 87.9 86.1 87.9 86.7 0.8 0.12 0.20
His 83.1 81.3 82.7 81.1 1.1 0.17 0.47
Ile 79.3 78.2 78.5 78.1 1.1 0.74 0.51
Leu 82.0 83.6 81.8 84.1 0.9 < 0.01 0.56
Lys 78.6 74.1 77.1 73.3 1.6 0.01 0.40
Met 82.2 82.8 83.6 85.1 1.0 0.08 0.16
Phe 81.1 81.4 80.5 81.2 1.0 0.21 0.56
Thr 70.4 69.8 68.1 68.9 2.1 0.45 0.63
Trp 81.6 80.0 76.6 75.8 1.9 0.70 0.05
Val 76.9 75.7 75.8 75.0 1.4 0.71 0.54
Mean 80.6 80.0 79.8 79.9 1.1 0.79 0.55
Dispensable AA
Ala 76.3 78.5 76.0 78.8 1.3 < 0.01 0.36
Asp 78.2 74.8 76.8 74.1 1.5 0.04 0.64
Cys 74.4 72.6 70.9 71.9 2.0 0.89 0.28
Glu 84.8 82.9 83.0 82.4 1.1 0.27 0.55
Gly 65.5 65.8 59.8 62.2 3.0 0.32 0.23
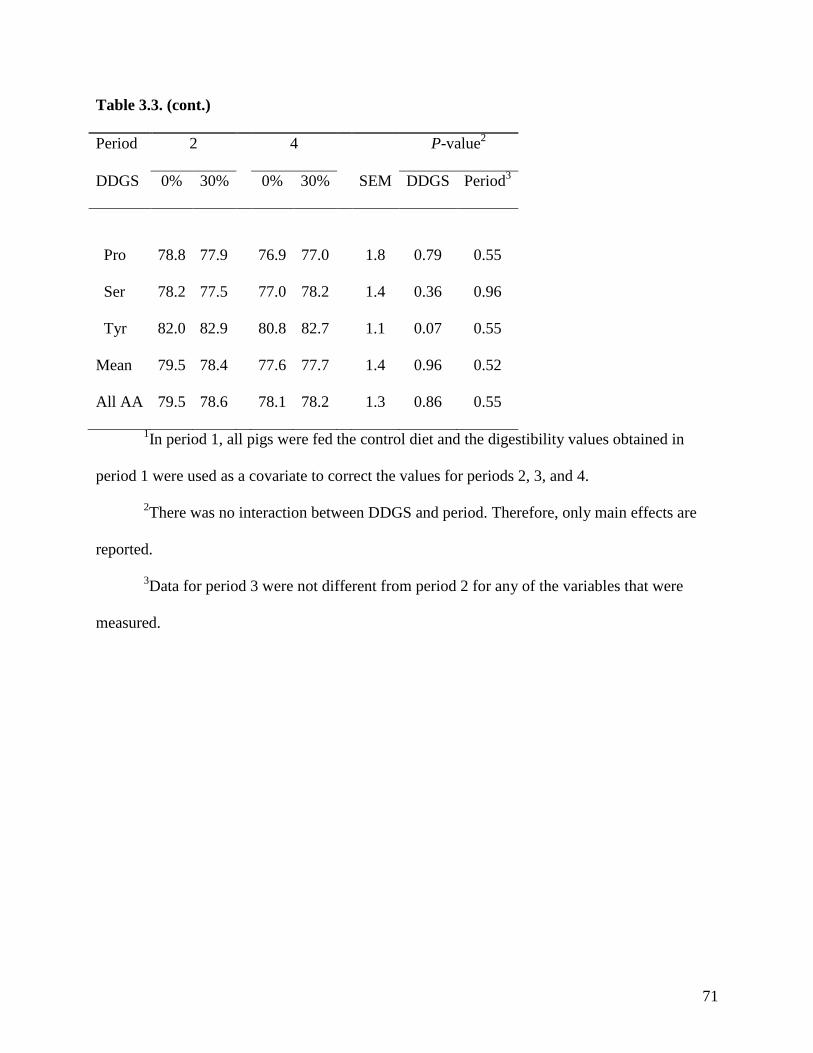
71
Table 3.3. (cont.)
Period 2 4 P-value2
DDGS 0% 30% 0% 30% SEM DDGS Period3
Pro 78.8 77.9 76.9 77.0 1.8 0.79 0.55
Ser 78.2 77.5 77.0 78.2 1.4 0.36 0.96
Tyr 82.0 82.9 80.8 82.7 1.1 0.07 0.55
Mean 79.5 78.4 77.6 77.7 1.4 0.96 0.52
All AA 79.5 78.6 78.1 78.2 1.3 0.86 0.55
1In period 1, all pigs were fed the control diet and the digestibility values obtained in
period 1 were used as a covariate to correct the values for periods 2, 3, and 4.
2There was no interaction between DDGS and period. Therefore, only main effects are
reported.
3Data for period 3 were not different from period 2 for any of the variables that were
measured.
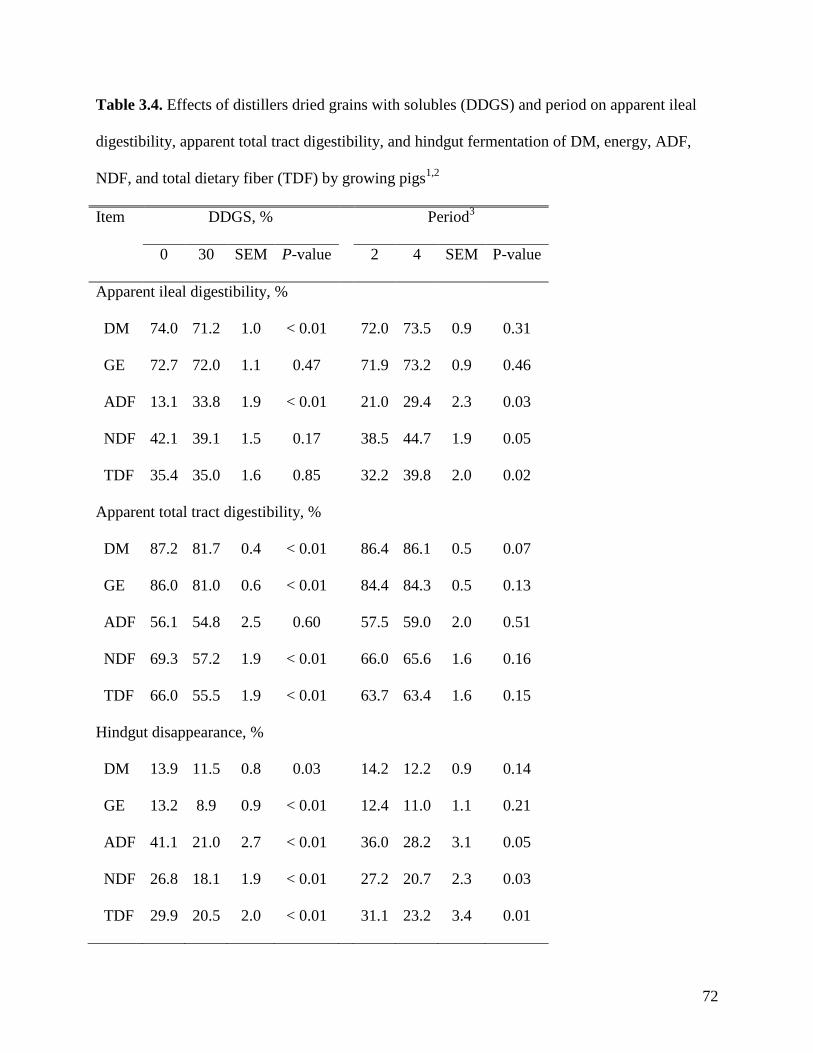
72
Table 3.4. Effects of distillers dried grains with solubles (DDGS) and period on apparent ileal
digestibility, apparent total tract digestibility, and hindgut fermentation of DM, energy, ADF,
NDF, and total dietary fiber (TDF) by growing pigs1,2
Item DDGS, % Period3
0 30 SEM P-value 2 4 SEM P-value
Apparent ileal digestibility, %
DM 74.0 71.2 1.0 < 0.01 72.0 73.5 0.9 0.31
GE 72.7 72.0 1.1 0.47 71.9 73.2 0.9 0.46
ADF 13.1 33.8 1.9 < 0.01 21.0 29.4 2.3 0.03
NDF 42.1 39.1 1.5 0.17 38.5 44.7 1.9 0.05
TDF 35.4 35.0 1.6 0.85 32.2 39.8 2.0 0.02
Apparent total tract digestibility, %
DM 87.2 81.7 0.4 < 0.01 86.4 86.1 0.5 0.07
GE 86.0 81.0 0.6 < 0.01 84.4 84.3 0.5 0.13
ADF 56.1 54.8 2.5 0.60 57.5 59.0 2.0 0.51
NDF 69.3 57.2 1.9 < 0.01 66.0 65.6 1.6 0.16
TDF 66.0 55.5 1.9 < 0.01 63.7 63.4 1.6 0.15
Hindgut disappearance, %
DM 13.9 11.5 0.8 0.03 14.2 12.2 0.9 0.14
GE 13.2 8.9 0.9 < 0.01 12.4 11.0 1.1 0.21
ADF 41.1 21.0 2.7 < 0.01 36.0 28.2 3.1 0.05
NDF 26.8 18.1 1.9 < 0.01 27.2 20.7 2.3 0.03
TDF 29.9 20.5 2.0 < 0.01 31.1 23.2 3.4 0.01
73
Table 3.4. (cont.)
1In period 1, all pigs were fed the control diet and the digestibility value from period 1 for
each pig was used as covariate to correct the values for periods 2, 3, and 4.
2There was no interaction between DDGS and period. Therefore, only main effects are
reported.
3Data for period 3 were not different from period 2 for any of the variables that were
measured.
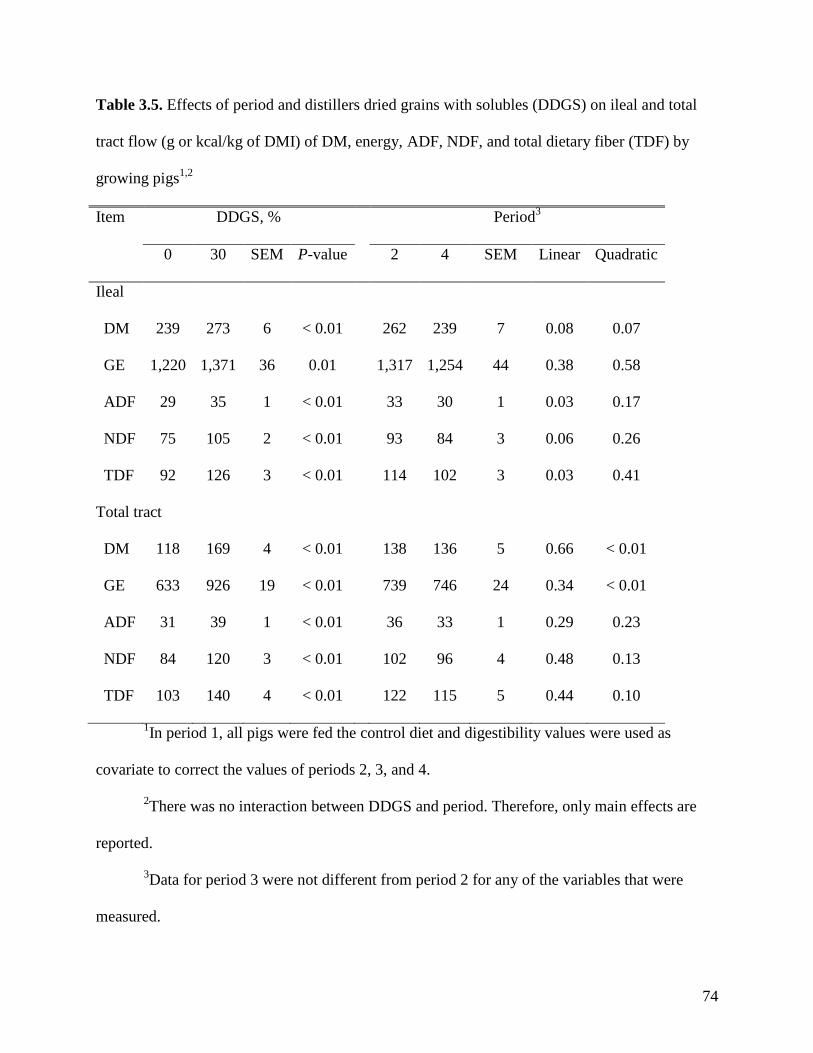
74
Table 3.5. Effects of period and distillers dried grains with solubles (DDGS) on ileal and total
tract flow (g or kcal/kg of DMI) of DM, energy, ADF, NDF, and total dietary fiber (TDF) by
growing pigs1,2
Item DDGS, % Period3
0 30 SEM P-value 2 4 SEM Linear Quadratic
Ileal
DM 239 273 6 < 0.01 262 239 7 0.08 0.07
GE 1,220 1,371 36 0.01 1,317 1,254 44 0.38 0.58
ADF 29 35 1 < 0.01 33 30 1 0.03 0.17
NDF 75 105 2 < 0.01 93 84 3 0.06 0.26
TDF 92 126 3 < 0.01 114 102 3 0.03 0.41
Total tract
DM 118 169 4 < 0.01 138 136 5 0.66 < 0.01
GE 633 926 19 < 0.01 739 746 24 0.34 < 0.01
ADF 31 39 1 < 0.01 36 33 1 0.29 0.23
NDF 84 120 3 < 0.01 102 96 4 0.48 0.13
TDF 103 140 4 < 0.01 122 115 5 0.44 0.10
1In period 1, all pigs were fed the control diet and digestibility values were used as
covariate to correct the values of periods 2, 3, and 4.
2There was no interaction between DDGS and period. Therefore, only main effects are
reported.
3Data for period 3 were not different from period 2 for any of the variables that were
measured.
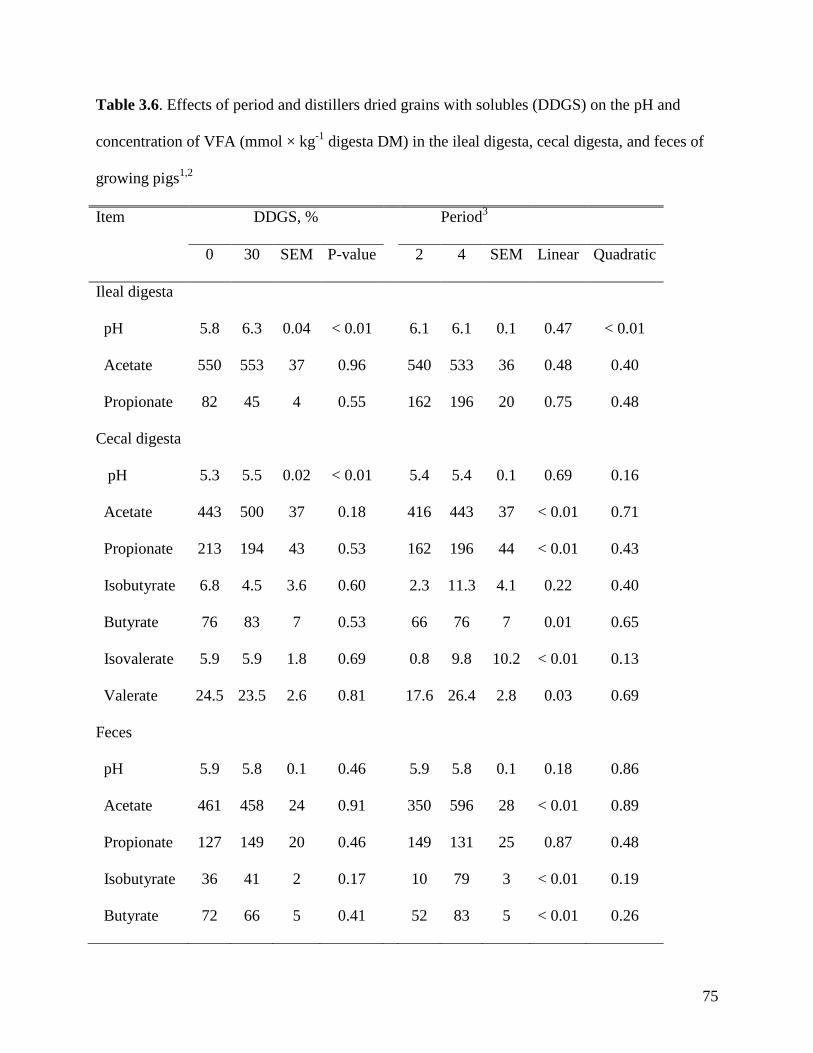
75
Table 3.6. Effects of period and distillers dried grains with solubles (DDGS) on the pH and
concentration of VFA (mmol × kg-1
digesta DM) in the ileal digesta, cecal digesta, and feces of
growing pigs1,2
Item DDGS, % Period3
0 30 SEM P-value 2 4 SEM Linear Quadratic
Ileal digesta
pH
5.8 6.3 0.04 < 0.01 6.1 6.1 0.1 0.47 < 0.01
Acetate 550 553 37 0.96 540 533 36 0.48 0.40
Propionate 82 45 4 0.55 162 196 20 0.75 0.48
Cecal digesta
pH 5.3 5.5 0.02 < 0.01 5.4 5.4 0.1 0.69 0.16
Acetate
443 500 37 0.18 416 443 37 < 0.01 0.71
Propionate
213 194 43 0.53 162 196 44 < 0.01 0.43
Isobutyrate 6.8 4.5 3.6 0.60 2.3 11.3 4.1 0.22 0.40
Butyrate
76 83 7 0.53 66 76 7 0.01 0.65
Isovalerate
5.9 5.9 1.8 0.69 0.8 9.8 10.2 < 0.01 0.13
Valerate
24.5 23.5 2.6 0.81 17.6 26.4 2.8 0.03 0.69
Feces
pH 5.9 5.8 0.1 0.46 5.9 5.8 0.1 0.18 0.86
Acetate
461 458 24 0.91 350 596 28 < 0.01 0.89
Propionate 127 149 20 0.46 149 131 25 0.87 0.48
Isobutyrate
36 41 2 0.17 10 79 3 < 0.01 0.19
Butyrate
72 66 5 0.41 52 83 5 < 0.01 0.26
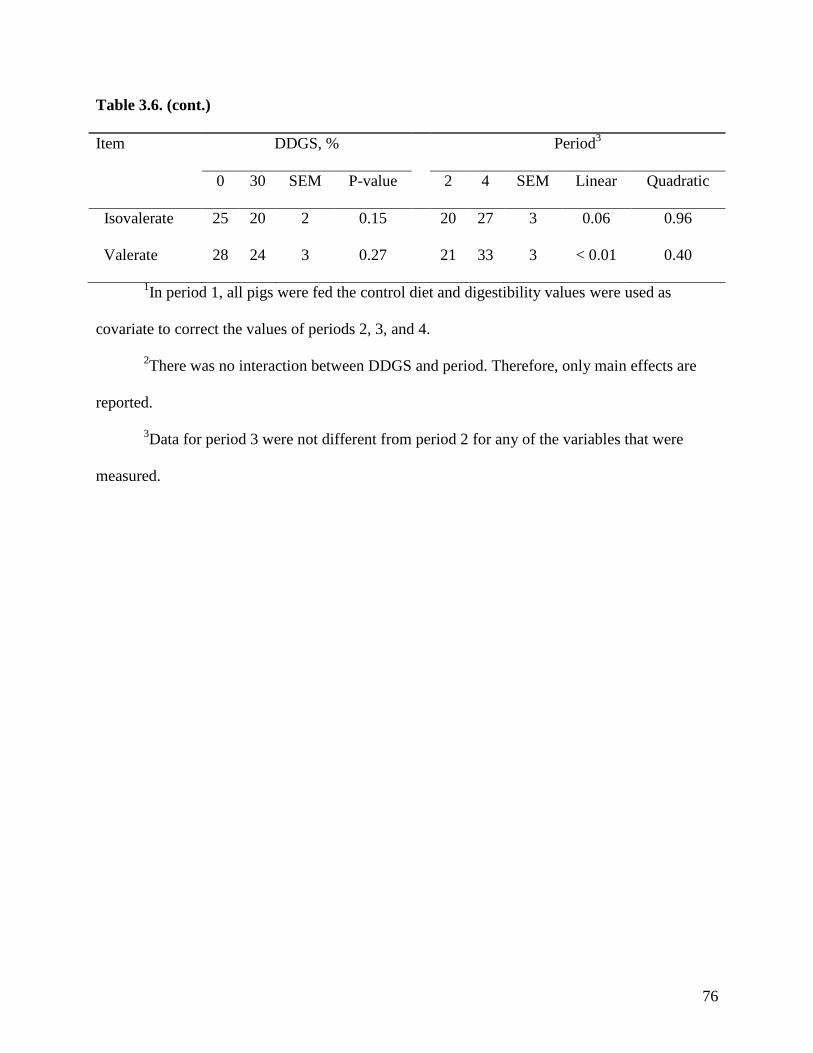
76
Table 3.6. (cont.)
Item DDGS, % Period3
0 30 SEM P-value 2 4 SEM Linear Quadratic
Isovalerate
25 20 2 0.15 20 27 3 0.06 0.96
Valerate
28 24 3 0.27 21 33 3 < 0.01 0.40
1In period 1, all pigs were fed the control diet and digestibility values were used as
covariate to correct the values of periods 2, 3, and 4.
2There was no interaction between DDGS and period. Therefore, only main effects are
reported.
3Data for period 3 were not different from period 2 for any of the variables that were
measured.
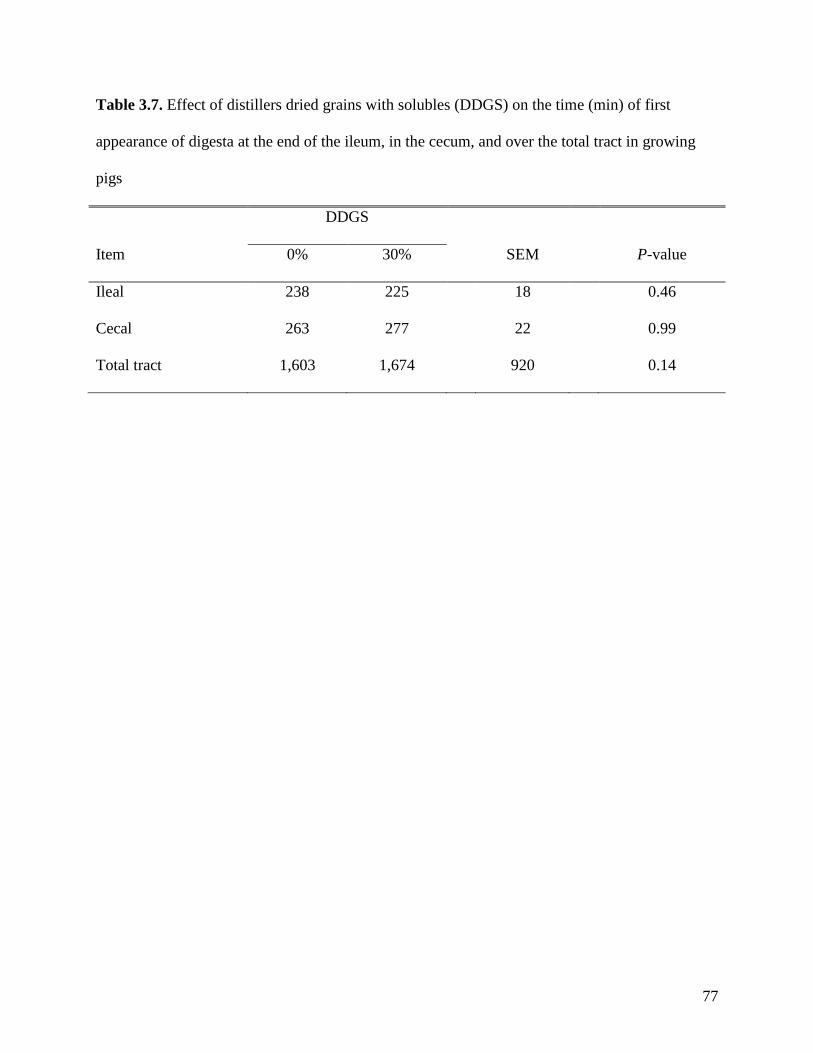
77
Table 3.7. Effect of distillers dried grains with solubles (DDGS) on the time (min) of first
appearance of digesta at the end of the ileum, in the cecum, and over the total tract in growing
pigs
DDGS
Item 0% 30% SEM P-value
Ileal 238 225 18 0.46
Cecal 263 277 22 0.99
Total tract 1,603 1,674 920 0.14
78
CHAPTER 4
Digestibility of dietary fiber in distillers co-products fed to growing pigs1
ABSTRACT: The objective of this work was to measure the apparent ileal digestibility (AID)
and the apparent total tract digestibility (ATTD) of dietary fiber in different sources of distillers
dried grains with solubles (DDGS) and to calculate hindgut fermentation of dietary fiber in
DDGS fed to growing pigs. Diets, ileal digesta, and fecal samples from pigs fed corn or diets
containing 1 of 28 sources of distillers co-products were analyzed for fiber. Of the 28 sources of
co-products, 24 sources were corn DDGS (C-DDGS), 1 source was sorghum DDGS (S-DDGS),
1 source was DDGS from a blend of sorghum and corn (SC-DDGS), 1 source was C-DDGS
from beverage production (DDGSbeverage), and a source of corn distillers dried grain (DDG) was
also included in the experiment. Total dietary fiber (TDF) and DM were analyzed in all DDGS
sources, ileal digesta, and fecal samples. Hindgut fermentation was calculated by subtracting
values for AID from values for ATTD. In 10 sources of DDGS and in ileal and fecal samples
from pigs fed those sources, crude fiber, ADF, NDF, insoluble dietary fiber (IDF), and soluble
dietary fiber (SDF) were also determined. Concentrations of CP, ether extract, and ash were also
analyzed in these samples and the organic residue (OR) was calculated by subtracting the
concentration of CP, ether extract, and water from OM. Results showed that the AID and the
ATTD of TDF differed (P < 0.01) among sources of C-DDGS. The average AID of TDF in 10
sources of C-DDGS (21.5%) was not different from the AID of TDF in corn (16.5%), but the
ATTD and the hindgut fermentation of TDF in the 10 sources of C-DDGS (44.5 and 23.0%,
respectively) were greater (P < 0.05) than in corn (23.1 and 6.6%, respectively). The AID of
1Used with permission JAS doi:10.2527/jas.2009-2227
79
crude fiber, NDF, IDF, SDF, and TDF were not different between C-DDGS and S-DDGS, but
the AID of ADF was greater (P < 0.01) in S-DDGS (57.4%) than in C-DDGS (36.8%). The
ATTD of OR in S-DDGS (72.5%) and SC-DDGS (68.4%) were less (P < 0.05) than in C-DDGS
(77.1%), but the ATTD of ADF, NDF, IDF, SDF, and TDF were not different among the 3
sources of DDGS. The AID, ATTD, and hindgut fermentation of TDF were not different
between DDGS from an ethanol plant and DDGS from a beverage plant. The average AID,
ATTD, and hindgut fermentation of TDF in the 24 sources of C-DDGS was 23.0, 47.3, and
24.4%, respectively. It is concluded that the AID and ATTD of fiber differ among sources of
DDGS and those differences may contribute to differences in the digestibility of energy in
DDGS.
Key words: dietary fiber, digestibility, distillers co-products, distillers dried grains with
solubles, pigs
INTRODUCTION
Dietary fiber is the sum of carbohydrates and lignin that are resistant to digestion by
mammalian enzymes in the small intestine, but they may be partially or completely fermented in
the hindgut (AACC, 2001; IOM, 2006). Methods to measure dietary fiber include the crude fiber
analysis (Mertens, 2003), the ADF and NDF procedures (Van Soest, 1963), and the total dietary
fiber (TDF) procedure, which may separate dietary fiber into insoluble dietary fiber (IDF) and
soluble dietary fiber (SDF; Prosky et al., 1992). An alternative to analyzing samples for dietary
fiber is to calculate the concentration of organic residue (OR) by subtracting CP, ash, moisture,
ether extract, sugar, and starch from 100 (de Lange, 2008).
80
The greater concentration of dietary fiber in distillers dried grains with solubles (DDGS)
compared with corn and soybean meal may be one of the primary reasons for the lower
digestibility of energy in DDGS than in corn (Stein and Shurson, 2009). The efficiency of energy
utilization in fibrous feed ingredients such as DDGS in pigs is affected by the digestibility of
dietary fiber and the production of VFA (Bindelle et al., 2008). Values for the apparent total tract
digestibility (ATTD) of ADF and NDF in DDGS have been reported (Guo et al., 2004; Stein et
al., 2009), but no values for the ATTD of TDF, IDF, SDF, or OR are available. Likewise,
hindgut fermentation of fiber in DDGS has not been measured, but fiber fermentation can
provide energy to pigs. The first objective of this study, therefore, was to measure the apparent
ileal digestibility (AID), the ATTD, and the hindgut fermentation of dietary fiber and OR in
DDGS and to compare these values to the AID and ATTD and hindgut fermentation in corn and
distillers dried grain (DDG). The second objective was to determine the relationship between the
ATTD of TDF and the ATTD of crude fiber, ADF, NDF, IDF, SDF, and OR.
MATERIALS AND METHODS
Samples
Samples of DDGS, diets containing DDGS, ileal digesta, and feces from 3 experiments
(Stein et al., 2006; Urriola et al., 2009; Pahm et al., 2008) designed to measure AID and ATTD
of nutrients in DDGS were used. The diets contained 66.7% DDGS or DDG. Corn was included
in 1 of the experiments and the only source of dietary fiber in the diets was DDGS, DDG, or corn
(Table 4.1). In each of the 3 experiments, pigs were allotted to Youden square designs with 7 or
8 replicates per sample. Ileal digesta and fecal samples were collected according to standard
procedures described by Stein et al. (2006), Urriola et al. (2009), and Pahm et al. (2008) in Exp.
81
1, 2, and 3, respectively. Experiment 1 was designed to compare the digestibility of nutrients in
10 sources of DDGS produced from corn (C-DDGS) to the digestibility of nutrients in corn grain
(Table 4.2). In Exp. 2, the digestibility of 8 sources of C-DDGS was compared with the
digestibility of nutrients in 1 source of DDGS produced from sorghum (S-DDGS) and in 1
source of DDGS produced from a blend of sorghum and corn (SC-DDGS; Table 4.3). In Exp. 3,
the digestibility of nutrients in DDGS produced by 6 dry-grind ethanol plants (DDGSethanol) was
compared with the digestibility of nutrients in 1 source of DDG and 1 source of DDGS from a
beverage plant (DDGSbeverage; Table 4.4).
Chemical Analyses
Ingredients that were used in Exp 1, 2, and 3 were analyzed for DM (method 930.15;
AOAC Int., 2007), CP (method 990.03; AOAC Int., 2007), starch (method 979.10; AOAC Int.,
2007), ADF (method 973.18; AOAC Int., 2007), NDF (Holst, 1973), and TDF (method 985.29;
AOAC Int., 2007). Ingredients used in Exp. 2 were also analyzed for crude fiber (method 978.10;
AOAC Int., 2007), and IDF (method 985.29; AOAC Int., 2007), and the concentration of SDF in
these ingredients was calculated as the difference between TDF and IDF.
Diets, ileal digesta, and feces from Exp. 1 were also analyzed for DM and TDF, and the
concentration of chromium in these samples was analyzed after nitric acid – perchloric acid wet
ash sample preparation (method 990.08; AOAC Int., 2007). Diets, ileal digesta, and fecal
samples from Exp. 2 were analyzed for DM, CP, ether extract, ash, starch, TDF, chromium,
crude fiber, ADF, NDF, and IDF, and the concentration of SDF was calculated. Diets, ileal
digesta, and feces from Exp. 3 were analyzed for TDF, DM, and chromium.
82
Calculations
The AID and ATTD of TDF were calculated for samples used in all 3 experiments
according to Stein et al. (2007). For samples used in Exp. 2, the concentration of OR in the diets
were calculated using the following equation:
ORdiet (%) = OM – [CP + ether extract + (100 – DM) + starchadded + sucroseadded],
where starchadded and sucroseadded were the added cornstarch and sucrose that were included in the
diet. Starch and sucrose were assumed to be 100% digestible in the small intestine. Therefore,
the calculations of OR in ileal digesta and feces were as follows:
ORileal or feces (%) = OM – [CP + ether extract + (100 – DM)].
The hindgut fermentation of nutrients was calculated using the following equation
(Högberg and Lindberg, 2004):
Hindgut fermentation (%) = ATTD – AID.
For samples used in Exp. 2, the AID, ATTD, and the hindgut fermentation of crude fiber, ADF,
NDF, IDF, and SDF were also calculated using this equation.
Statistical Analysis
In all 3 experiments, the UNIVARIATE procedure of SAS (SAS Inst. Inc., Cary, NC)
was used to determine normal distribution of the data and equal variances, and to identify
outliers. An observation was considered an outlier if the value was more than 3 SD away from
the grand mean. No outliers were identified in any of the 3 experiments. Data were analyzed by
ANOVA using the MIXED procedure of SAS (Littell et al., 1998). The pig was considered as
the experimental unit. Pig and period were random effects and DDGS source was considered a
fixed effect. The LSMeans procedure in SAS was used to calculate mean values. The
CONTRAST option of SAS was used to compare the digestibility of DDGS and corn in Exp. 1,
83
C-DDGS, S-DDGS, and SC-DDGS in Exp. 2, and DDGSethanol, DDGSbeverage, and DDG in Exp.
3. In all analyses, the differences were considered significant if P < 0.05. The PROC REG
procedure of SAS was used to determine the relationship between the ATTD of TDF and the
ATTD of IDF, SDF, ADF, NDF, crude fiber, and OR that were estimated in Exp. 2.
RESULTS
Exp. 1
The concentration of TDF varied from 18.6 to 31.4% among the 10 sources of DDGS and
starch concentration was between 5.2 and 7.9% (Table 4.2). The AID of TDF (12.6 to 25.9%)
also varied (P < 0.01) among the 10 sources of DDGS (Table 4.5). There was no difference
between the mean AID of TDF in DDGS (21.5%) and the AID of TDF in corn (16.5%). The
ATTD of TDF (30.5 to 52.4%) also varied (P < 0.01) among the 10 DDGS sources. The mean
ATTD of TDF was greater (P < 0.05) in the 10 DDGS sources (44.5%) than in corn (23.1%).
There was no difference among DDGS sources in hindgut fermentation of TDF, but the mean
hindgut fermentation of TDF in C-DDGS (23.1%) was greater (P < 0.01) than in corn grain
(6.6%).
Exp. 2
There was variation in the concentration of crude fiber (6.1 to 7.4%), ADF (9.7 to
12.9%), NDF (37.4 to 44.4%), IDF (28.3 to 33.8%), SDF (0.0 to 1.6%), and TDF (28.7 to
34.9%) among the 8 sources of C-DDGS (Table 4.3). The concentration of TDF in S-DDGS
(32.2%) was similar to the average for C-DDGS (31.8%) and for SC-DDGS (35.8%). The AID
of crude fiber (13.7 to 42.8%), ADF (28.2 to 47.0%), NDF (37.5 to 52.1%), IDF (5.9 to 33.6%),
SDF (56.4 to 81.7%), TDF (19.6 to 38.2%), and OR (38.4 to 67.0%) were different (P < 0.01)
84
among the 8 sources of C-DDGS (Table 4.6). The AID of ADF in S-DDGS (57.4%) was greater
(P < 0.01) than the mean AID of ADF in C-DDGS (36.8%), and the AID of crude fiber in S-
DDGS (38.6%) tended (P = 0.07) to be greater than the mean AID of crude fiber in C-DDGS
(31.0%). However, the AID of OR in S-DDGS (41.6%) was lower (P < 0.01) than in C-DDGS
(58.6%), but the AID for NDF, IDF, SDF, and TDF were not different in S-DDGS compared
with C-DDGS. The AID of NDF (37.9%), IDF (4.8%), and TDF (15.9%) were lower (P < 0.01)
in SC-DDGS than in C-DDGS, but the AID of crude fiber, ADF, and SDF were not different
between SC-DDGS and C-DDGS.
The ATTD of crude fiber (36.3 to 51.2%), ADF (51.8 to 64.3%), NDF (51.6 to 65.8%),
IDF (29.3 to 51.0%), SDF (89.4 to 95.3%), TDF (39.4 to 56.4%), and OR (72.4 to 81.3%) were
different (P < 0.01) among the 8 sources of C-DDGS. There were no differences in the ATTD of
crude fiber, ADF, NDF, IDF, SDF, and TDF between S-DDGS and the mean of the 8 sources of
C-DDGS. However, the ATTD of OR was less (P < 0.05) in S-DDGS (72.5%) and SC-DDGS
(68.4%) than in the 8 sources of C-DDGS (77.1%). The ATTD of IDF (28.6%) in SC-DDGS
was lower (P = 0.05) than in C-DDGS and there was a tendency (P < 0.10) for a lower ATTD of
NDF (51.5%) and TDF (39.2%) in SC-DDGS than in C-DDGS, but for crude fiber, ADF, and
SDF, no differences between SC-DDGS and C-DDGS were observed.
Hindgut fermentation of crude fiber (0.1 to 23.9%), ADF (12.9 to 28.1%), NDF (6.5 to
20.3%), IDF (8.2 to 31.2%), SDF (13.6 to 35.2%), TDF (11.1 to 30.9%), and OR (9.5 to 39.2%)
were different (P < 0.01) among the 8 sources of C-DDGS. Hindgut fermentation of ADF was
less (P < 0.05) in S-DDGS and SC-DDGS (3.3 and 12.3%) than in the 8 sources of C-DDGS
(21.7%). The hindgut fermentation of OR, however, was greater (P < 0.01) in S-DDGS and SC-
DDGS (30.9 and 35.5%) than in C-DDGS (18.5%).
85
Exp. 3
The concentration of TDF varied from 28.6 to 32.4% among the 6 sources of DDGSethanol,
and was lower than the concentration of TDF in DDGSbeverage (38.5%) and in DDG (43.9%;
Table 4.4). The AID (11.4 to 30.8%) and the ATTD (29.3 to 57.0%) of TDF were different (P <
0.01) among the 6 sources of DDGSethanol, but there were no differences between the AID and
ATTD of TDF in DDGSbeverage and DDGSethanol (Table 4.7). The AID of TDF in DDG (0.7%)
was lower (P < 0.01) than the AID of TDF in DDGSethanol (18.5%). However, the ATTD of TDF
in DDG (43.8%) was not different from the ATTD of TDF in DDGSethanol (48.0%) and
DDGSbeverage (46.4%). Hindgut fermentation of TDF was greater (P = 0.05) in DDG (43.1%)
than in DDGSethanol (29.5%) and DDGSbeverage (33.2%), but there were no differences in the
hindgut fermentation of TDF among DDGSethanol sources.
Correlation among Methods to Measure Dietary Fiber
There was a good relationship between the ATTD of TDF and the ATTD of NDF (r2
=
0.90), IDF (r2
= 0.79), and ADF (r2
= 0.71; Figure 1). There was less relationship between the
ATTD of TDF and the ATTD of crude fiber (r2
= 0.42), and there was a poor relationship
between the ATTD of TDF and the ATTD of SDF (r2
= 0.24), and OR (r2
= 0.21).
DISCUSSION
Data from all 3 experiments indicate that dietary fiber in DDGS is composed of a fraction
that is fermented before the end of the ileum and a fraction that is fermented in the hindgut. The
fraction that is fermented before the end of the ileum may be considered a fast fermentable
fraction because the transit time from mouth to ileum averages 2.9 h (Wilfart et al., 2007a;
Wilfart et al., 2007b). In contrast, the fiber that is fermented in the large intestine may be
86
considered a slow fermentable fraction of fiber. The fast fermentable fraction of dietary fiber was
present in greater concentrations in sources of DDGS that had the greatest AID values, whereas
the slow fermentable fraction was present in greater concentrations in DDGS sources with
greater values for hindgut fermentation. This observation explains the average differences in the
AID of TDF among sources of C-DDGS in Exp. 1, 2, and 3 (21.5, 28.9, and 18.5%, respectively;
average = 23.0%). The average ATTD of TDF was relatively constant among sources of C-
DDGS in Exp. 1, 2, and 3 (44.5, 49.5, and 48.0 %, respectively; average = 47.3%). Therefore,
hindgut fermentation averaged 23.0, 20.6, and 29.5 with the average of 24.4% in the 3
experiments.
The differences in the ATTD of dietary fiber among sources of C-DDGS may be a result
of differences in the digestibility of nutrients in the corn grain that was used to produce DDGS
(Stein and Shurson, 2009). The digestibility of TDF may also be affected by post-harvest
processing of corn (Fahey et al., 1993), but the effect of the ethanol plant processing on fiber
digestibility in C-DDGS has yet to be determined. However, the greater ATTD of TDF in DDGS
compared with corn that was observed in Exp. 1 indicates that processing of the corn during
ethanol production (e. g., grinding, heating, and fermentation) may modify the structure of
dietary fiber, which may make it more digestible than corn fiber (Le Gall et al., 2009).
The average AID of TDF of the 24 sources of C-DDGS (23.0%) is close to the average
AID of TDF (24.0%) that was measured in diets containing a wide variety of feed ingredients
(Bach Knudsen and Jørgensen, 2001). The average ATTD of TDF in C-DDGS observed in the
present experiments (47.3%) is also comparable to values measured in growing pigs fed corn-
bran (48%), but less than values observed when growing pigs are fed sugar beet pulp (Graham et
al., 1986; Le Goff et al., 2002).
87
The differences in the AID and ATTD of TDF among sources of C-DDGS indicate that
the digestibility of energy may also vary among these sources. Guo et al. (2004) observed
differences in the ATTD of NDF, but no difference in the ATTD of GE among 4 sources of C-
DDGS. However, this observation is in contrast with Pedersen et al. (2007) and Stein et al.
(2009), who reported that the ATTD of GE in 14 sources of C-DDGS varied between 73.9 and
82.8%. The differences in the digestibility of TDF among sources of C-DDGS measured in the
present experiments may be the reason for the reported differences in energy digestibility.
The greater AID and ATTD of SDF compared with IDF indicates that the soluble fraction
of dietary fiber is much more fermentable than the insoluble fraction. This observation indicates
that ethanol processes that increase the concentration of SDF in DDGS may also increase the
AID and ATTD of TDF, which in turn is expected to increase the digestibility of energy.
Extrusion increases the soluble portion of TDF in wheat, oats, and rice bran (Gualberto et al.,
1997), which may explain why the ATTD of energy in DDGS increases after extrusion
(Beltranena et al., 2009).
The main difference between the detergent fiber procedures (ADF and NDF) and the
TDF procedure is that the detergent procedures do not include soluble fiber, while the TDF
procedure accounts for both the soluble and the insoluble fractions of dietary fiber (Campbell et
al., 1997). Therefore, it is expected that values for TDF represent more accurately the total fiber
fraction in a feed ingredient than values for ADF and NDF (Campbell et al., 1997; Cho et al.,
1997; Mertens, 2003).
The reason the AID of TDF in DDG is lower than the AID of TDF in DDGS may be that
most of the SDF is captured in the solubles fraction of the wet distillers’ grains, and because no
solubles are added to the DDG, the concentration of SDF in DDG is lower than in DDGS (Pahm
88
et al., 2008). This results in a lower AID of TDF in DDG because the AID of SDF is greater than
the AID of IDF.
The fact that there were no differences in the AID and ATTD of TDF between
DDGSethanol and DDGSbeverage is in agreement with observations showing that there is no
difference in the AID of AA between these 2 sources of DDGS (Pahm et al., 2008). This
indicates that the production processes used in beverage plants have no greater influence on the
digestibility of nutrients in DDGS than the processes used in fuel ethanol plants (Pahm et al.,
2008). These results also indicate that the digestibility of energy between these sources of DDGS
most likely is similar.
The high relationship between the ATTD of TDF and the ATTD of NDF, ADF, or IDF,
is most likely a result of the fact that most of the fiber in DDGS is insoluble (Bach Knudsen,
1997). The procedures used for fiber analysis that measure concentrations of insoluble fiber give
values that are close to the concentration of TDF (Mertens, 2003). The ATTD of SDF was much
greater than the ATTD of IDF, but the concentration of SDF is low in DDGS. As a result, the
relationship between the ATTD of TDF and the ATTD of SDF is low. A strong correlation
relationship between the ATTD of TDF and the ATTD of OR was expected because TDF and
OR represent the entire fraction of fiber in DDGS. However, results showed that there was no
relationship between the ATTD of TDF and the ATTD of OR, which indicates that the procedure
that was used to calculate OR did not give an accurate estimate of the concentration of fiber in
DDGS.
There are limitations when using ileal T-cannula for measuring digestibility of dietary
fiber in pigs because only a portion of the total digesta and fecal output are collected, which may
result in relatively large variations among pigs. However, use of a T-cannula is one of the few
89
methods available for collection of ileal digesta, and without the cannula, it would not be
possible to calculate ileal digestibility of fiber in the DDGS sources. In the present work, we
attempted to overcome the inherent limitations of use of T-cannulas by using a relatively large
number of replications and by allotting pigs to a Youden square design, which is believed to
reduce variability (Kuehl, 2000; Kim and Stein, 2009). We also standardized all feeding and
collection procedures among pigs.
In conclusion, the AID and ATTD of dietary fiber and OR varies among sources of C-
DDGS and this difference is believed to influence the digestibility of energy. The greater AID
and ATTD in DDGS than in corn indicates that fiber digestibility is improved by the processing
or fermentation in the ethanol plants. However, less than 50% of TDF in DDGS is digested over
the entire intestinal tract, which means that more than 50% of the TDF in DDGS passes through
the pig without being digested.
90
LITERATURE CITED
AACC. 2001. The definition of dietary fiber. AACC Report. Am. Assoc. Cereal Chemist.
46:112-126.
AOAC Int. 2007. Official Methods of Analysis of AOAC Int. 18th ed. AOAC Int., Gaithersburg,
MD.
Bach Knudsen, K. E., and H. Jørgensen. 2001. Intestinal degradation of dietary carbohydrates –
from birth to maturity. Pages 109-120 in Digestive Physiology of Pigs. J. E. Lindberg, and B.
Ogle ed. CABI Publishing, New York.
Bach Knudsen, K. E. 1997. Carbohydrate and lignin contents of plant materials used in animal
feeding. Anim. Feed Sci. and Technol. 67:319-338.
Beltranena, E., J. Sánchez-Torres, L. Goonewardene, X. Meng, and R. T. Zijlstra. 2009. Effect of
single-or twin-screw extrusion on energy and amino acid digestibility of wheat or corn
distillers dried grains with solubles (DDGS) for growing pigs. J. Anim. Sci. 87(Suppl.
3):166. (Abstr.)
Bindelle, J., P. Leterme, and A. Buldgen. 2008. Nutritional and environmental consequences of
dietary fibre in pig nutrition: A review. Biotechnol. Agron. Soc. Environ. 12:313–324.
Campbell J. M., E. A. Flickinger, and G. C. Fahey. 1997. A comparative study of dietary fiber
methologies using pulsed electrochemical detection of monosaccharide constituents. Sem.
Food Analysis 2:43-53.
Cho S., J. W. deVries, and L. Prosky. 1997. Dietary fiber analysis and applications. AOAC
International, Gaithersburg, MD.
91
de Lange, C. F. M. 2008. Efficiency of utilization of energy from protein and fiber in the pig-a
case for NE systems. Pages 58-72 in Proceeding of the Midwest Swine Nutrition Conference,
Indianapolis, IN.
Fahey, G. C. Jr., L. D. Bourquin, E. C. Titgemeyer, and D. G. Atwell. 1993. Postharvest
treatment of fibrous feedstuffs to improve their nutritive value. Pages 715-766 in: Forage
Cell Wall Structure and Digestibility. H. G. Jung, D. R. Buxton, D. R. Hatfield, and J. Ralph,
ed. American Society of Agronomy, Madison, WI.
Graham, H., K. Hesselman, and P. Åman. 1986. The influence of wheat bran and sugar-beet pulp
on the digestibility of dietary components in a cereal-based pig diet. J. Nutr. 116:242-251.
Gualberto, D. G., C. J. Bergman, M. Kazemzadeh, and C. W. Weber. 1997. Effect of extrusion
processing on the soluble and insoluble fiber and phytic acid contents of cereal brans. Plant
Foods Human Nutr. 51:187-198.
Guo, L., X. Piao, D. Li, and S. Li. 2004. The apparent digestibility of corn by-products for
growing-finishing pigs in vivo and in vitro. Asian Aust. J. Anim. Sci. 17:379-385.
Högberg, A., and J. E. Lindberg. 2004. Influence of cereal non-starch polysaccharides and
enzyme supplementation on digestion site and gut environment in weaned piglets. Anim.
Feed Sci. Technol. 116:113–128.
Holst, D. O. 1973. Holst filtration apparatus for Van Soest detergent fiber analysis. J. Assoc. Off.
Anal. Chem. 56:1352-1356.
IOM. 2006. Dietary, functional, and total dietary fiber. Pages 340-421 in Dietary Reference
Intakes for Energy, Carbohydrates, Fiber, Fat, Fatty acids, Cholesterol, Protein, and Amino
Acids. Natl. Acad. Press, Washington, DC.
92
Kim, B. G., and H. H. Stein. 2009. A spreadsheet program for making a balanced Latin square
design. J. Anim. Sci. 87(E-Suppl. 2): 207. (Abstr.)
Kuehl, R. O. 2000. Latin Square Designs use two blocking criteria. Pages 275-289 in Design of
Experiments: Statistical Principles of Research Design and Analysis. Second ed. R. O.
Kuehl, ed. Brooks/Cole, Pacific Grove, CA.
Le Gall, M., M. Warpechowski, Y. Jaguelin-Peyraud, and J. Noblet. 2009. Influence of dietary
fiber level and pelleting on the digestibility of energy and nutrients in growing pigs and adult
sows. Animal 3:352-359.
Le Goff, G., J. van Milgen, and J. Noblet. 2002. Influence of dietary fiber on digestive utilization
and rate of passage in growing pigs, finishing pigs, and adult sows. Anim. Sci. 74:503-515.
Littell, R. C., P. R. Henry, and C. B. Ammerman. 1998. Statistical analysis of repeated measures
data using SAS procedures. J. Anim. Sci. 76:1216–1231.
Mertens, D. R. 2003. Challenges in measuring insoluble dietary fiber. J. Anim. Sci. 81:3233-
3249.
Pahm A. A., C. Pedersen, D. Hoehler, and H. H. Stein. 2008. Factors affecting the variability in
ileal amino acid digestibility in corn distillers dried grains with solubles fed to growing pigs.
J. Anim. Sci. 86:2180-2189.
Pedersen C., M. G. Boersma, and H. H. Stein. 2007. Digestibility of energy and phosphorus in
ten samples of distillers dried grains with solubles fed to growing pigs. J. Anim. Sci.
85:1168-1176.
Prosky, L., G. N. Asp, T. F. Schweizer, J. W. de Vries, and I. Furda. 1992. Determination of
insoluble and soluble dietary fiber in foods and food products: collaborative study. J. Assoc.
Off. Anal. Chem. 75:360–367.
93
Stein H. H., and G. C. Shurson. 2009. BOARD-INVITED REVIEW: The use and application of
distillers dried grains with solubles (DDGS) in swine diets. J. Anim. Sci. 87:1292-1303.
Stein, H. H., S. P. Connot, and C. Pedersen. 2009. Energy and nutrient digestibility in four
sources of distillers dried grains with solubles produced from corn grown within a narrow
geographical area and fed to growing pigs. Asian-Aust. J. Anim. Sci. 22:1016-1025.
Stein, H. H., M. L. Gibson, C. Pedersen, and M. G. Boersma. 2006. Amino acid and energy
digestibility in ten samples of distillers dried grain with solubles fed to growing pigs. J.
Anim. Sci. 84: 853-860.
Stein, H. H., B. Seve, M. F. Fuller, P. J. Moughan, and C. F. M. de Lange. 2007. Invited review:
Amino acid bioavailability and digestibility in pig feed ingredients: Terminology and
application. J. Anim. Sci. 85: 172-180.
Urriola, P. E., C. Pedersen, H. H. Stein, and G. C. Shurson. 2009. Amino acid digestibility of
distillers dried grains with solubles, produced from sorghum, a sorghum-corn blend, and corn
fed to growing pigs. J. Anim. Sci. 87:2574-2580.
Van Soest, P. J. 1963. Use of detergents in the analysis of fibrous feeds. II. A rapid method for
the determination of fiber and lignin. J. Assoc. Offic. Agr. Chem. 46:829-35.
Wilfart A., L. Montagne, H. Simmins, J. Noblet, and J. van Milgen. 2007a. Digesta transit in
different segments of the gastrointestinal tract of pigs as affected by insoluble fiber supplied
by wheat bran. Br. J. Nutr. 98:54-62.
Wilfart A., L. Montagne, H. Simmins, J. van Milgen, and J. Noblet. 2007b. Sites of nutrient
digestion in growing pigs: Effects of dietary fiber. J. Anim. Sci. 85:976-983.
94
Table 4.1. Ingredient composition (%) of experimental diets, as-fed basis
Ingredient, % of diet DDGS1
DDG1
Corn
DDGS1
66.70 - -
DDG1
- 66.70 -
Corn - - 97.00
Cornstarch 27.00 27.00 -
Sucrose 3.00 3.00 -
Soybean oil 1.00 1.00 -
Limestone 1.35 1.35 0.80
Dicalcium phosphate - - 1.05
Chromic oxide 0.30 0.30 0.30
Salt 0.30 0.30 0.50
Vitamin premix2 0.10 0.10 0.10
Micromineral premix3 0.25 0.25 0.25
Total 100.00 100.00 100.00
1DDGS = distillers dried grains with solubles; DDG = distillers dried grain.
2Provided the following quantities of vitamins per kg of complete diet: vitamin A, 10,990
IU as vitamin A acetate; vitamin D3, 1,648 IU as D-activated animal sterol; vitamin E, 55 IU as
alpha tocopherol acetate; vitamin K3, 4.4 mg as menadione dimethylpyrimidinol bisulphite;
thiamin, 3.3 mg as thiamine mononitrate; riboflavin, 9.9 mg; pyridoxine, 3.3 mg as pyridoxine
hydrochloride; vitamin B12, 0.044 mg; D-pantothenic acid, 33 mg as calcium pantothenate;
niacin, 55 mg; folic acid, 1.1 mg; and biotin, 0.17 mg.
95
3Provided the following quantities of minerals per kg of complete diet: Cu, 26 mg as
copper sulfate; Fe, 125 mg as iron sulfate; I, 0.31 mg as potassium iodate; Mn, 26 mg as
manganese sulfate; Se, 0.3 mg as sodium selenite; and Zn, 130 mg as zinc oxide.
96
Table 4.2. Analyzed composition of corn and distillers dried grains with solubles (DDGS) and
diets containing each source of DDGS used in Exp. 1 (as-fed basis)1
Sources of distillers dried grains with solubles
Item Corn 1 2 3 4 5 6 7 8 9 10 Mean
DDGS
DM 85.4 89.2 88.7 86.8 88.9 89.2 87.1 88.6 90.8 90.0 89.4 88.9
CP 7.9 27.6 27.9 27.2 29.0 26.7 24.6 26.6 28.4 29.1 27.3 27.4
Starch - 7.0 7.9 5.2 5.6 7.0 6.9 6.4 5.4 7.4 6.1 6.5
TDF2
- 30.4 31.1 30.2 30.3 29.6 31.3 29.3 31.4 29.9 29.2 29.2
Diets
TDF2
8.0 19.9 18.8 21.5 21.8 18.4 21.2 19.7 20.0 20.3 19.6 20.1
1Samples from Stein et al. (2006).
2TDF = total dietary fiber.
97
Table 4.3. Analyzed composition of distillers dried grains with solubles (DDGS) produced from
corn, sorghum (S-DDGS), and from a blend of sorghum and corn (SC-DDGS) used in Exp. 2
(as-fed basis)1
Source of corn-DDGS
Item 1 2 3 4 5 6 7 8 Mean S-
DDGS
SC-
DDGS
DDGS
DM 90.5 90.6 90.5 90.5 89.7 89.6 89.0 87.5 89.7 91.6 92.7
CP 29.4 28.7 27.4 27.3 27.5 27.3 31.9 28.0 28.4 32.7 30.6
Starch 7.8 9.1 5.2 8.2 6.5 6.6 6.5 6.2 7.0 7.1 6.0
Crude
fiber
6.1 6.8 7.4 6.5 6.4 6.6 6.3 6.5 6.6 9.8 8.1
ADF 10.8 11.0 12.0 12.0 10.0 11.5 10.6 11.1 11.1 22.8 16.5
NDF 36.2 40.4 43.2 34.6 35.9 36.8 36.3 37.5 37.6 40.7 39.5
IDF2
28.7 32.5 33.8 30.0 31.0 31.1 28.3 30.5 30.7 34.1 35.4
SDF2
0.0 0.8 1.1 1.6 0.8 1.6 1.5 1.3 1.1 1.2 0.4
TDF2
28.7 33.3 34.9 31.6 31.8 32.7 29.8 31.8 31.8 32.2 35.8
OR 44.5 48.2 47.1 49.3 46.8 46.5 44.1 45.6 46.5 45.6 46.9
Diets
Crude
fiber
3.4 4.2 5.8 4.3 4.2 4.5 4.2 4.2 4.4 6.1 5.7
ADF 6.9 7.2 8.7 7.2 6.7 7.3 7.7 7.5 7.4 15.3 11.0
NDF 21.3 23.5 28.3 25.0 23.5 24.1 24.7 24.1 24.3 25.9 26.3
98
Table 4.3. (cont.)
Source of corn-DDGS
Item 1 2 3 4 5 6 7 8 Mean S-DDGS SC-DDGS
IDF 20.2 22.1 27.1 20.8 21.4 20.4 24.7 21.4 22.2 22.9 25.6
SDF 0.0 1.1 0.3 1.1 0.6 2.9 1.7 1.3 1.3 4.1 2.6
TDF 20.2 23.2 27.4 21.9 22.0 23.3 27.4 22.7 23.5 26.9 28.2
OR 33.6 33.8 34.5 35.7 33.6 33.5 32.3 31.7 33.6 32.6 33.5
1Samples from Urriola et al. (2009).
2IDF = insoluble dietary fiber; SDF = soluble dietary fiber; TDF = total dietary fiber.
99
Table 4.4. Analyzed composition of distillers dried grains with solubles (DDGS) used in Exp. 3
(as-fed basis)1
DDGSethanol source
Item 1 2 3 4 5 6 Mean DDGSbeverage DDG
DDGS
DM 88.9 87.0 88.4 88.7 86.9 87.8 88.0 89.7 88.5
CP 26.4 25.4 24.7 29.0 24.7 25.5 26.0 26.3 26.1
Starch 11.4 7.3 7.0 8.1 7.4 9.6 8.0 7.3 3.8
TDF2
31.7 29.5 31.5 32.4 28.6 30.6 30.7 38.5 43.9
Diets
TDF 21.7 21.9 23.3 21.3 21.2 22.7 22.0 28.3 28.1
1Samples from Pahm et al. (2008).
2TDF = total dietary fiber.
100
Table 4.5. Apparent ileal digestibility (AID), apparent total tract digestibility (ATTD), and hindgut fermentation (HGF) of total
dietary fiber in corn and 10 sources of distillers dried grains with solubles (DDGS) produced from corn and fed to growing pigs1, Exp.
1
Source of corn DDGS DDGS DDGS vs. corn2
Item Corn 1 2 3 4 5 6 7 8 9 10 Mean SEM P-value SEM P-value
AID, % 16.5 25.2 19.7 24.8 25.6 12.6 25.9 21.9 19.7 24.6 14.7 21.5 2.6 < 0.01 17.7 0.23
ATTD, % 23.1 45.1 46.1 52.4 50.0 43.9 49.0 44.2 47.1 36.8 30.5 44.5 4.8 < 0.01 7.8 0.05
HGF, % 6.6 19.9 26.4 27.6 24.4 31.3 23.1 22.3 27.5 12.2 15.8 23.0 5.8 0.22 16.3 0.03
1Least square means of 8 pigs per diet.
2Contrast of corn vs. all DDGS sources.
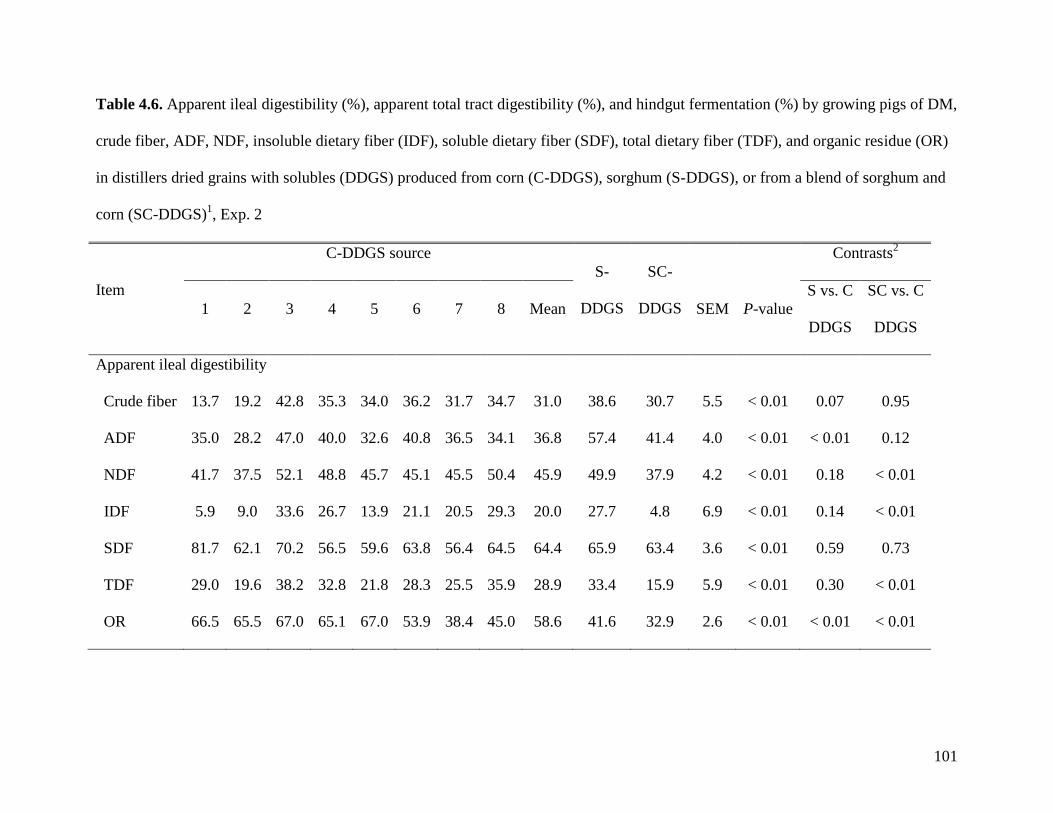
101
Table 4.6. Apparent ileal digestibility (%), apparent total tract digestibility (%), and hindgut fermentation (%) by growing pigs of DM,
crude fiber, ADF, NDF, insoluble dietary fiber (IDF), soluble dietary fiber (SDF), total dietary fiber (TDF), and organic residue (OR)
in distillers dried grains with solubles (DDGS) produced from corn (C-DDGS), sorghum (S-DDGS), or from a blend of sorghum and
corn (SC-DDGS)1, Exp. 2
Item
C-DDGS source
S-
DDGS
SC-
DDGS
Contrasts2
1 2 3 4 5 6 7 8 Mean SEM P-value
S vs. C
DDGS
SC vs. C
DDGS
Apparent ileal digestibility
Crude fiber 13.7 19.2 42.8 35.3 34.0 36.2 31.7 34.7 31.0 38.6 30.7 5.5 < 0.01 0.07 0.95
ADF 35.0 28.2 47.0 40.0 32.6 40.8 36.5 34.1 36.8 57.4 41.4 4.0 < 0.01 < 0.01 0.12
NDF 41.7 37.5 52.1 48.8 45.7 45.1 45.5 50.4 45.9 49.9 37.9 4.2 < 0.01 0.18 < 0.01
IDF 5.9 9.0 33.6 26.7 13.9 21.1 20.5 29.3 20.0 27.7 4.8 6.9 < 0.01 0.14 < 0.01
SDF 81.7 62.1 70.2 56.5 59.6 63.8 56.4 64.5 64.4 65.9 63.4 3.6 < 0.01 0.59 0.73
TDF 29.0 19.6 38.2 32.8 21.8 28.3 25.5 35.9 28.9 33.4 15.9 5.9 < 0.01 0.30 < 0.01
OR 66.5 65.5 67.0 65.1 67.0 53.9 38.4 45.0 58.6 41.6 32.9 2.6 < 0.01 < 0.01 < 0.01
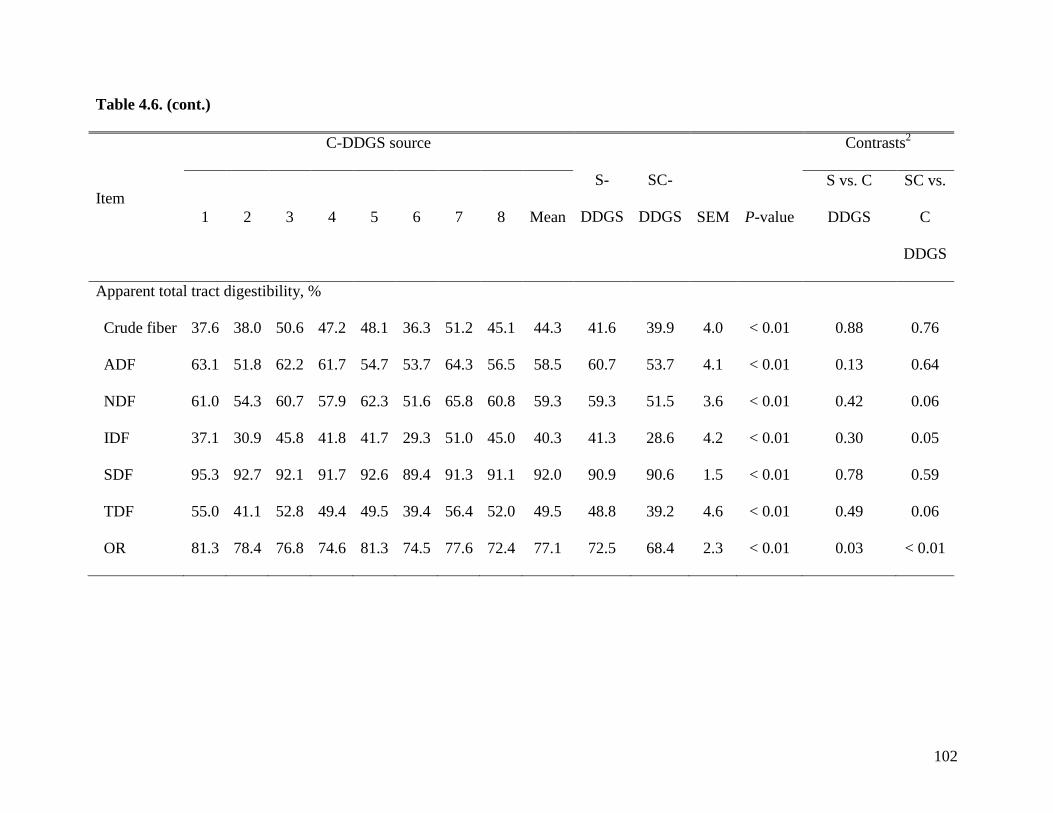
102
Table 4.6. (cont.)
Item
C-DDGS source
S-
DDGS
SC-
DDGS
Contrasts2
1 2 3 4 5 6 7 8 Mean SEM P-value
S vs. C
DDGS
SC vs.
C
DDGS
Apparent total tract digestibility, %
Crude fiber 37.6 38.0 50.6 47.2 48.1 36.3 51.2 45.1 44.3 41.6 39.9 4.0 < 0.01 0.88 0.76
ADF 63.1 51.8 62.2 61.7 54.7 53.7 64.3 56.5 58.5 60.7 53.7 4.1 < 0.01 0.13 0.64
NDF 61.0 54.3 60.7 57.9 62.3 51.6 65.8 60.8 59.3 59.3 51.5 3.6 < 0.01 0.42 0.06
IDF 37.1 30.9 45.8 41.8 41.7 29.3 51.0 45.0 40.3 41.3 28.6 4.2 < 0.01 0.30 0.05
SDF 95.3 92.7 92.1 91.7 92.6 89.4 91.3 91.1 92.0 90.9 90.6 1.5 < 0.01 0.78 0.59
TDF 55.0 41.1 52.8 49.4 49.5 39.4 56.4 52.0 49.5 48.8 39.2 4.6 < 0.01 0.49 0.06
OR 81.3 78.4 76.8 74.6 81.3 74.5 77.6 72.4 77.1 72.5 68.4 2.3 < 0.01 0.03 < 0.01
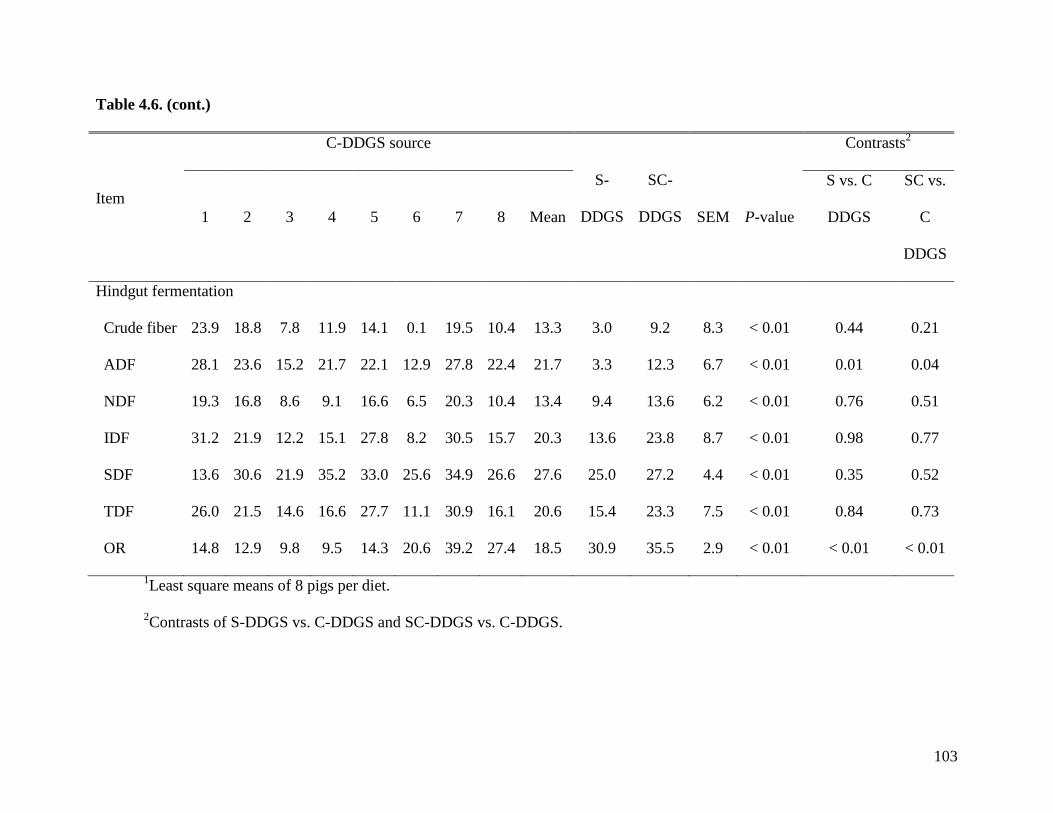
103
Table 4.6. (cont.)
Item
C-DDGS source
S-
DDGS
SC-
DDGS
Contrasts2
1 2 3 4 5 6 7 8 Mean SEM P-value
S vs. C
DDGS
SC vs.
C
DDGS
Hindgut fermentation
Crude fiber 23.9 18.8 7.8 11.9 14.1 0.1 19.5 10.4 13.3 3.0 9.2 8.3 < 0.01 0.44 0.21
ADF 28.1 23.6 15.2 21.7 22.1 12.9 27.8 22.4 21.7 3.3 12.3 6.7 < 0.01 0.01 0.04
NDF 19.3 16.8 8.6 9.1 16.6 6.5 20.3 10.4 13.4 9.4 13.6 6.2 < 0.01 0.76 0.51
IDF 31.2 21.9 12.2 15.1 27.8 8.2 30.5 15.7 20.3 13.6 23.8 8.7 < 0.01 0.98 0.77
SDF 13.6 30.6 21.9 35.2 33.0 25.6 34.9 26.6 27.6 25.0 27.2 4.4 < 0.01 0.35 0.52
TDF 26.0 21.5 14.6 16.6 27.7 11.1 30.9 16.1 20.6 15.4 23.3 7.5 < 0.01 0.84 0.73
OR 14.8 12.9 9.8 9.5 14.3 20.6 39.2 27.4 18.5 30.9 35.5 2.9 < 0.01 < 0.01 < 0.01
1Least square means of 8 pigs per diet.
2Contrasts of S-DDGS vs. C-DDGS and SC-DDGS vs. C-DDGS.
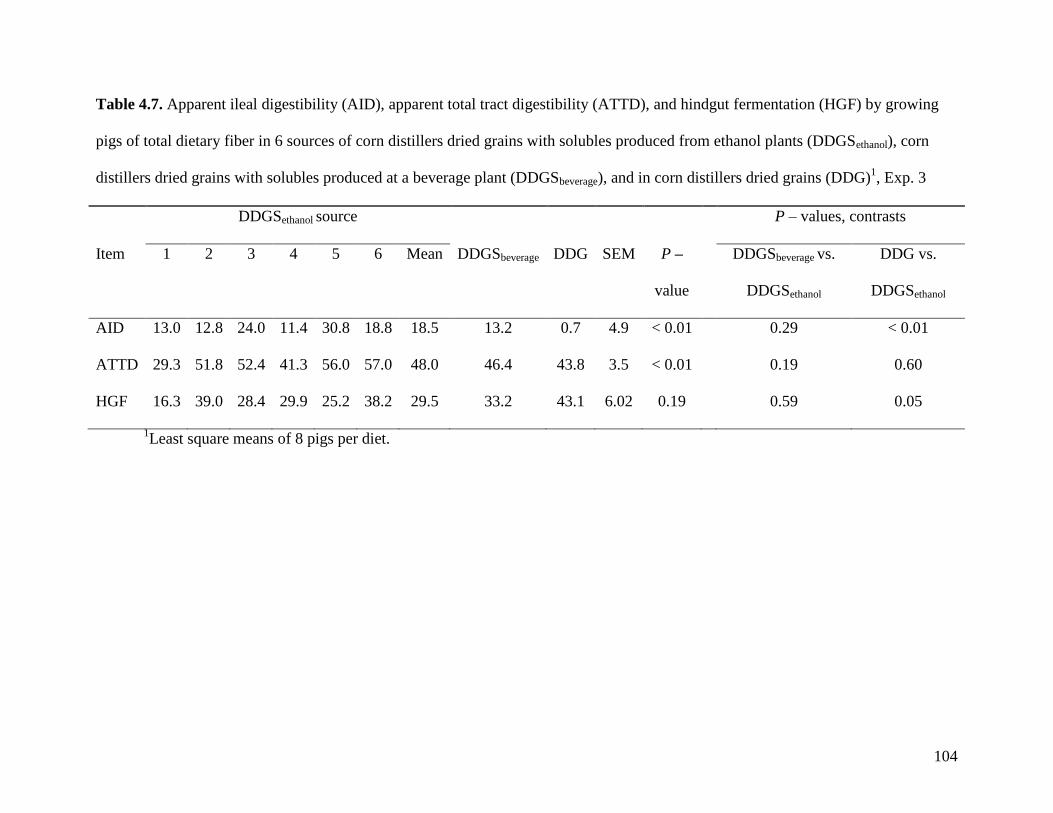
104
Table 4.7. Apparent ileal digestibility (AID), apparent total tract digestibility (ATTD), and hindgut fermentation (HGF) by growing
pigs of total dietary fiber in 6 sources of corn distillers dried grains with solubles produced from ethanol plants (DDGSethanol), corn
distillers dried grains with solubles produced at a beverage plant (DDGSbeverage), and in corn distillers dried grains (DDG)1, Exp. 3
DDGSethanol source P – values, contrasts
Item 1 2 3 4 5 6 Mean DDGSbeverage DDG SEM P –
value
DDGSbeverage vs.
DDGSethanol
DDG vs.
DDGSethanol
AID 13.0 12.8 24.0 11.4 30.8 18.8 18.5 13.2 0.7 4.9 < 0.01 0.29 < 0.01
ATTD 29.3 51.8 52.4 41.3 56.0 57.0 48.0 46.4 43.8 3.5 < 0.01 0.19 0.60
HGF 16.3 39.0 28.4 29.9 25.2 38.2 29.5 33.2 43.1 6.02 0.19 0.59 0.05
1Least square means of 8 pigs per diet.
105
Figure 4.1. Relationship between the apparent total tract digestibility (ATTD) of total dietary
fiber (TDF) and the ATTD of crude fiber (+), ADF(▲), NDF (●), insoluble dietary fiber (IDF;
◊), soluble dietary fiber (SDF; □), and organic residue (OR; ■) in distillers dried grains with
solubles fed to growing pigs.
ATTD of crude fiber = 0.5697x + 16.009
R² = 0.4178
ATTD of ADF = 0.6144x + 28.527
R² = 0.709
ATTD of NDF = 0.7031x + 24.519
R² = 0.8955
ATTD of IDF = 1.0629x - 12.152
R² = 0.7884
ATTD of SDF = 0.1229x + 85.828
R² = 0.2419
ATTD of OR = 0.2968x + 61.428
R² = 0.2095
20
30
40
50
60
70
80
90
100
20 30 40 50 60 70 80 90 100
AT
TD
of
die
tary
fib
er, %
ATTD of TDF, %
106
CHAPTER 5
Comparative digestibility of energy and nutrients in fibrous feed ingredients in Meishan
and Yorkshire pigs
ABSTRACT: The objective of this experiment was to test the hypothesis that differences in the
digestibility of total dietary fiber (TDF) among breeds of the pigs is influenced by the type of
fiber that is being fed (insoluble vs. soluble) and also by age of the pig. Five light Yorkshire pigs
(BW: 80.1 ± 11.2 kg; 4 months old), 5 heavy Yorkshire pigs (BW: 102.1 ± 3.5 kg), and 5
Meishan pigs (BW: 77.2 ±15.2 kg; 5 months old) were surgically prepared with a T-cannula in
the distal ileum. A corn-soybean meal diet (control) was formulated with 5 g∙kg-1
of titanium
dioxide as an indigestible marker. Three additional diets were formulated by replacing 30% of
the control diet with 30% of distillers dried grains with solubles (DDGS), soybean hulls (SBH),
or sugar beet pulp (SBP) and one diet was formulated by replacing 15% of the control diet with
15% pectin. Each group of pig was allotted to a 5 × 5 Latin square design and pigs were fed the 5
experimental diets during five 14-d periods. Fecal samples were collected on d 12 and ileal
digesta were collected on d 13 and 14 of each period. The apparent ileal digestibility (AID) and
apparent total tract digestibility (ATTD) of GE and nutrients in each ingredient were calculated
using the substitution method. Hindgut fermentation was calculated as the difference between
ATTD and AID. When fed the control diet, Meishan pigs, had a tendency (P < 0.10) for a greater
AID of GE and CP (78.6 and 80.3%) than light (77.0 and 78.9%) and heavy Yorkshire pigs (75.7
and 76.9%). and they had a greater (P < 0.05) ATTD of DM, GE, and carbohydrates (89.2, 89.5,
95.5%) than light (86.6, 86.4, and 92.4%) and heavy (87.0, 86.6, and 93.0%) Yorkshire pigs. The
ATTD of DM, GE, CP, carbohydrates, and TDF in DDGS (75.4, 76.3, 81.3, 78.0, and 75.3%;
107
respectively) was greater (P < 0.01) by Meishan pigs than by light (55.7, 58.5, 66.7, 49.2, and
39.0%) and heavy (59.8, 62.9, 70.0, 51.1, 55.7%) Yorkshire pigs. There were no differences
among the 3 groups of pigs in the ATTD of energy or nutrients in SH, SBP, and pectin. The
ATTD of CP, was, however, lower (P < 0.05) in Meishan pigs (-15.2%) than heavy (-4.9%) and
light (10.4%) Yorkshire pigs. There were no differences among the 3 groups of pigs in hindgut
fermentation of nutrients in diets or in ingredients. In conclusion, Meishan pigs have a greater
ATTD of DM, GE, and some nutrients in corn-soybean meal diets and in DDGS than Yorkshire
pigs.
Key words: breeds, digestibility, insoluble dietary fiber, pig, soluble dietary fiber
INTRODUCTION
Modern pigs have a relative poor capacity to digest dietary fiber and the apparent total
tract digestibility (ATTD) of fiber is less than 50% in some feed ingredients when fed to
growing pigs (Urriola et al., 2010). However, native breeds of pigs such as Meishan (Kemp et
al., 1991), Alentejano (Freire et al., 1998). Mong-Cai (Len et al., 2006), and Mukota (Ndindana
et al., 2002) may have a greater capacity to digest dietary fiber than modern crossbred pigs.
Meishan pigs fed a diet based on corn, wheat, and barley had greater ATTD of crude fiber and
energy than Dutch Landrace pigs (Kemp et al., 1991). This may be a result of a larger hindgut
and a more active microflora in Meishan pigs compared with Dutch Landrace pigs, which in turn
may increase the fermentation of fiber and subsequently the absorption of VFA. However, if
15% oats were added to the basal diet no differences between the 2 groups of pigs were observed
(Kemp et al., 1991).
108
Diets based on corn and 35% dehydrated alfalfa meal were, however, not digested better
by 20 kg Meishan pigs than by 20 kg white composite breeds (Yen et al., 2004). It is, therefore,
possible that the type of dietary fiber as well as the breed of the pig influences ATTD of dietary
fiber, but this hypothesis has only been investigated with pigs fed sugar beet pulp (von
Heimendahl et al., 2009). Sugar beet pulp, however, has a variable concentration of soluble
dietary fiber (SDF) and insoluble dietary fiber (IDF; Sunvold et al., 1995). Dietary fiber in
distillers dried grains with solubles (DDGS) is mostly IDF (Urriola et al., 2010). The objective of
this experiment, therefore, was to test the hypothesis that the source of dietary fiber (SDF vs.
IDF) and the breed of pigs (Meishan pigs vs. Yorkshire pigs) influence the ATTD of energy,
fiber, and other nutrients.
MATERIALS AND METHODS
Animals and Housing
The protocol for this experiment was reviewed and approved by the Institutional Animal
Care and Use Committee at the University of Illinois at Urbana-Champaign. Five Meishan pigs
(initial BW: 77.2 ± 15.2 kg; 5 months old) and 10 Yorkshire pigs were surgically prepared with a
T-cannula in the distal ileum following the technique by Stein et al. (1998). Five of the Yorkshire
pigs had the same age as the Meishan pigs (5 months) and weighed 102.1 ± 3.5 kg at time of
surgery (heavy Yorkshires). The other 5 Yorkshire pigs had an initial BW that was close to that
of the Meishan pigs (80.1 ± 11.2 kg), but these pigs were only 4 months old (light Yorkshires).
Following surgeries, pigs were allowed to recover for 10 d and a corn soybean meal diet was
provided on an ad libitum basis during this time. All pigs were housed in individual pens (1.8 ×
109
2.7 m) that had a nipple drinker and a feeder. The floors of the pens were half concrete and half
concrete slats. The room temperature was kept between 20 and 22°C throughout the experiment.
Four feed ingredients with different concentration of IDF and SDF were used (Table 5.1).
The 4 ingredients were distillers dried grains with solubles (DDGS; Lincolnland Agri-Energy,
Palestine, IL), soybean hulls (SBH; Archer Daniels Midland, Decatur), sugar beet pulp (SBP;
Siemer Milling Company, Teutopolis, IL), and fruit derived pectin (TIC Gums, Belcamp, MD).
Five diets were formulated (Table 5.2). The control diet was based on corn and soybean meal
and contained 5 g/kg of titanium dioxide (Chicago Sweeteners, Chicago, IL) as an indigestible
marker. Three additional diets were formulated by replacing 30% of the control diet with 30%
DDGS, SBH, or SBP. The last diet was formulated by replacing 15% of the control diet with
15% citrus pectin. Vitamins and minerals were included in all diets to meet or exceed the
nutrient requirements of growing pigs (NRC, 1998).
Experimental Design and Sample Collection
Pigs within each group (i. e., Meishans, light Yorkshire, and heavy Yorkshire) were
randomly allotted to a 5 × 5 Latin square design with 5 diets and five 14-d periods (Kim and
Stein, 2009). Feed was provided to each pig at a daily level of 2 times the maintenance
requirement for energy (i.e., 106 kcal ME per kg BW0.75
; NRC, 1998). The daily feed allotments
were divided into 2 equal meals that were provided at 0800 and 1700.
Fecal samples were collected on d 12 of each period via grab-sampling and stored at -
20ºC. Ileal digesta were collected on d 13 and 14 of each period following procedures described
by Cervantes-Pahm and Stein (2008). Pig BW was recorded at the beginning of the experiment
and at the end of each period to calculate feed allowance for the following period.
110
Chemical Analyses
At the end of each period, samples were thawed and mixed within animal and diet and a
sub-sample was collected for chemical analysis and stored at –20°C. Ileal and fecal samples were
dried to a constant weight in a forced air oven and ground through a 1mm screen in a Wiley mill
(model 4; Thomas Scientific, Swedesboro, NJ). Samples of corn, soybean meal, DDGS, SBH,
SBP, and pectin, and of all diets, ileal samples, and fecal samples were analyzed for DM (method
930.15, AOAC Int., 2007), CP (method 990.03; AOAC Int., 2007), acid hydrolyzed fat (AEE;
method 996.01, AOAC Int., 2007), ash (method 942.15; AOAC Int., 2007), and total dietary
fiber (TDF; method 985.29; AOAC Int., 2007). Diets and ingredients were also analyzed for
NDF (Holst, 1973), ADF (method 973.18; AOAC Int., 2007), ADL (method 973.18 (A-D),
AOAC Int., 2007), and IDF (method 985.29; AOAC Int., 2007). The concentration of GE in
ingredients and diets and in ileal and fecal samples was determined using an adiabatic bomb
calorimeter (model 6300, Parr Instruments, Moline, IL). Benzoic acid was used as the internal
standard. All diets, ileal samples, and fecal samples were also analyzed for titanium
concentration following the procedure by Myers et al. (2004).
Water binding capacity was measured by weighing 1 g of sample into a centrifuge tube
and mixing with 30 mL of distilled water (Robertson et al., 2000). After stirring, samples were
allowed to settle and were centrifuged (3,000 g; 20 min). The supernatant was removed and the
samples were weight. The WBC values are expressed as the amount of water retained by the
pellet (g/g).
Calculations
The concentration of SDF in diets and ingredients was calculated as the difference
between TDF and IDF. Hemicellulose in each sample was calculated as the difference between
111
NDF and ADF and cellulose was calculated as the difference between ADF and ADL (Van Soest
et al., 1991). The concentration of carbohydrates (CHO) in diets, ileal samples, and fecal
samples was calculated according to the following equation:
CHO = 100 – CP + AEE + ash + 100 − DM
Apparent ileal digestibility (AID) and ATTD of DM, energy, CP, AEE, ash, TDF, and
CHO were calculated in all diets (Equation 2; Stein et al., 2007). The AID and ATTD of DM,
energy, CP, AEE, ash, TDF, and CHO in DDGS, SBH, SBP, and pectin were subsequently
calculated by the difference procedure (Fan and Sauer, 1995) using the following equation:
ADnutrient = ADassay – ADcontrol × Nutrientcontrol
1 – Nutrientcontrol
where ADnutrient is the AID or ATTD of a nutrient in the ingredient (%), ADassay is the
AID or ATTD of the nutrient in the assay diet (%), ADcontrol is the AID or ATTD of the nutrient
in the control diet, and Nutrientcontrol is the contribution of the nutrient from the control diet to the
assay diet (decimal %).
The hindgut fermentation of nutrients, DM, and energy was calculated according to the
following equation (Urriola et al., 2010):
Hindgut fermentaionNu = ATTDNu − AIDNu
where ATTDNu is the amount of apparent total tract digestible nutrient (g), DM (g), or
energy (kcal/kg) and AIDNu is the amount of ileal digestible nutrient (g), DM (g), or energy
(kcal/kg).
Statistical Analysis
The UNIVARIATE procedure of SAS (SAS Inst. Inc., Cary, NC) was used to confirm
normal distribution of the data, equal variances, and to identify outliers. An observation was
considered an outlier if the value was more than 3 SD away from the mean. No other outliers
112
were identified, however, one observation was removed because the pig was sick during the
adaptation period. Data were analyzed within each diet by ANOVA using the MIXED procedure
of SAS. The group of pigs was the fixed effect and random effects were the period and the pig
nested within group of pigs. Least square means of the 3 groups of pigs within each diet were
calculated using the LSMEAN statement of SAS, the pdiff option was used to separate means,
and multiple comparisons were adjusted by Tukey. A similar model was used to calculate and
analyze the digestibility values of DM, energy, and nutrients in ingredients. The differences were
considered significant if P < 0.05 and a trend if P > 0.05 < 0.10. The pig was the experimental
unit for all analyses.
RESULTS
All pigs were successfully cannulated at the distal ileum and quickly recovered after
surgery. The BW at the beginning of period 1 was 90.0 ± 12.4 kg (light Yorkshires), 116.7 ± 6.2
kg (heavy Yorkshires), and 82.5 ± 11.6 kg (Meishans). All pigs gained BW during the
experiment and the initial BW of the last period was, 116.8 ± 12.0 kg (light Yorkshires), 131.0 ±
17.5 kg (heavy Yorkshires), and 92.2 ± 11.1 kg (Meishans).
The concentration of GE varied from 5,086 kcal/kg in DDGS to 3,140 kcal/kg in pectin, while
varied CP in soybean meal (47.6%) to SBH (8.1%). The concentration of AEE varied from
16.6% in DDGS to 0.9% in pectin (Table 5.1). The concentration of TDF varied from 67.0% in
SBP to 8.4% in corn, but the concentration of SDF was greatest in pectin (41.2%) and no SDF
was detectable in DDGS. The WBC varied from 17.3 g/g in pectin to 1.9 g/g in corn.
The concentration of SDF varied among diets (Table 5.2), and was increased with the addition of
high fiber feed ingredients from 0% in the control diet to 2.6% in the diet with DDGS, 1.8% in
the diet with SBH, 3.8% in the diet with SBP, and 9.7% in the diet with 15% pectin. All diets
113
contained IDF, the greatest level was in the diet with SBH (25.3%) and the least in the diet with
pectin (8.5%). The WBC of the SBP diet was greatest (4.0 g/g) while the control diet had the
least WBC (2.2 g/g).
Apparent Ileal Digestibility of DM, GE, and Nutrients in Diets
When pigs were fed the control diet, Meishan pigs had a tendency (P < 0.10) for a greater
AID of GE and CP (78.6 and 80.3%) than light (77.0 and 78.9%) and heavy (75.7 and 76.9%)
Yorkshire pigs (Table 5.3). There were, however, no differences in the AID of DM, AEE, ash,
CHO, and TDF among Meishan, light Yorkshire, and heavy Yorkshire pigs. When pigs were fed
the diet containing 30% DDGS, there were no differences in the AID of DM, GE, AEE, ash,
CHO, or TDF among Meishan, light Yorkshire, and heavy Yorkshire pigs. When pigs were fed
the diet containing 30% SBP, heavy Yorkshire pigs had lower (P < 0.05) AID of CP (64.3%)
than Meishan pigs (68.8%), whereas the AID of CP in light Yorkshire pigs (66.9%) was not
different from the other 2 groups, and there were no differences in the AID of DM, CP, GE, or
other nutrients. When pigs were fed the diet containing pectin, Meishan pigs tended (P < 0.10) to
have a greater AID of CP (74.9%) than light Yorkshire (71.3%) and heavy Yorkshire pigs
(72.0%), but there were no differences in the AID of DM, GE, or other nutrients among the 3
groups of pigs. There was also a tendency (P < 0.10) for a lesser AID of ash in Meishan pigs (-
18.2%) than in heavy Yorkshire pigs (-6.6%), whereas the AID of ash in light Yorkshire pigs (-
14.5) was not different from that of the other 2 groups.
Apparent Total Tract Digestibility of DM, Energy, and Nutrients in Diets
When pigs were fed the control diet Meishan pigs had a greater (P ≤ 0.05) ATTD of DM,
GE, and CHO (89.2, 89.5, 95.5%) than light (86.6, 86.4, 92.4%) and heavy (87.0, 86.6, and
93.0%) Yorkshire pigs (Table 5.4). When pigs were fed the diet containing 30% DDGS, Meishan
114
pigs also had a greater (P < 0.01) ATTD of DM, GE, CHO, and TDF (84.0, 83.5, 90.4, and 66.5)
than light (78.1, 77.3, 84.5, and 45.8%) and heavy (79.3, 78.8, 84.9, and 55.3%) Yorkshire pigs.
The ATTD of CP (83.7%) in Meishan pigs was greater (P < 0.01) than in light Yorkshire pigs
(76.9%), but not different from that of heavy Yorkshire pigs (78.4%). When pigs were fed the
SBP diet, Meishan pigs tended (P < 0.10) to have a greater ATTD of GE (84.7%) than heavy
Yorkshire pigs (81.4%), but no differences were observed for the ATTD of DM and nutrients.
There were also no differences among the 3 groups of pigs in the ATTD of DM, GE, or nutrients
in the diets containing SBH or pectin.
Hindgut Fermentation of DM, Energy, and Nutrients in Diets
When fed the DDGS diet, Meishan pigs, had a greater (P < 0.01) hindgut fermentation of
DM and CHO (15.1 and 20.2%) than light (10.1 and 14.0%) and heavy (10.7 and 13.5%)
Yorkshire pigs (Table 5.5). There was also a tendency (P < 0.10) for a greater hindgut
fermentation of GE for Meishan pigs (12.9%) than for light (8.3%) and heavy (9.3%) Yorkshire
pigs. There were no differences among the 3 groups of pigs in hindgut fermentation of DM, GE,
or nutrients when pigs were fed the control, SBH, SBP, or pectin diets. Values for the hindgut
fermentation of AEE were negative for all diets indicating that there was influx of AEE in the
hindgut of pigs regardless of the group of pigs or diet that was fed.
Apparent Ileal Digestibility of DM, GE, and Nutrients in Feed Ingredients
The AID of DM, GE, and nutrients in DDGS and SBH were not different among the 3
groups of pigs (Table 5.6). The AID of CP in SBP was greater (P < 0.05) in Meishan (37.9%)
and light (33.1%) than heavy (22.7%) Yorkshire pigs, but the AID of DM, GE, or other nutrients
were not different among the 3 groups of pigs. The AID of CP in pectin also tended to be greater
(P < 0.10) in Meishan pigs (60.7%) than in light Yorkshire (16.7%) and heavy Yorkshire pigs
115
(23.1%), but other differences among the 3 groups of pigs were not observed. The AID of ash in
SBH, SBP, and pectin was negative for all 3 groups of pigs.
Apparent Total Tract Digestibility of DM, Energy, and Nutrients in Ingredients
The ATTD of DM, GE, CP, and CHO in DDGS (Table 5.7) by Meishan pigs (75.4, 76.3,
81.3, and 78.0%) were greater (P < 0.01) than in light Yorkshire pigs (55.7, 58.5, 66.7, and
49.2%) and heavy Yorkshire pigs (59.8, 62.9, 70.0, and 51.1%). The ATTD of TDF in DDGS
was greater (P < 0.01) in Meishan pigs (75.3%) than in heavy (55.7%) and light Yorkshires pigs
(39.0%), and the ATTD of TDF was also greater (P < 0.05) in heavy than in light Yorkshire pigs.
There were no differences in the ATTD of AEE and ash in DDGS among the 3 groups of pigs.
The ATTD of CP in SBP by heavy Yorkshire pigs (-4.9%) was less (P < 0.05) than in light
Yorkshire pigs (10.4%) and Meishan pigs had an ATTD of CP (-15.2%) that was less than both
heavy and light Yorkshires pigs. There were no differences in ATTD of DM, energy, and
nutrients in SBH and in pectin among the 3 groups of pigs.
Hindgut fermentation of DM, Energy, and Nutrients in Ingredients
Regardless of the ingredient, no differences in hindgut fermentation of DM, GE, and
nutrients among Meishan, light Yorkshire, and heavy Yorkshire pigs were observed (Table 5.8).
Negative fermentation values were calculated for AEE in all 3 groups of pigs for DDGS and
SBH.
DISCUSSION
The ATTD of TDF in DDGS is only 46% (Urriola et al., 2010), which is the reason for
the relatively low ATTD of DM and GE in corn based co-products (Stein and Shurson, 2009). In
contrast, the ATTD of TDF in SBP and pectin are 71.8 and 90%, respectively (Graham et al.,
1986; Drochner et al., 2004), and the ATTD of hemicellulose and cellulose in SBH is 58.9 and
116
82.1%, respectively (Kornegay, 1981). The TDF in DDGS is mainly IDF, whereas, SBH, SBP,
and pectin contain greater concentrations of SDF, which is likely the reason for the less ATTD of
TDF in DDGS than in SBH, SBP, and pectin because the ATTD of IDF is much less than the
ATTD of SDF (Urriola et al., 2010).
The ATTD of crude fiber in 28 kg Meishan pigs (47.8%) is greater than in Dutch
Landrace pigs of similar BW (36.4%; Kemp et al., 1991), but 20 kg Meishan pigs had ATTD of
crude fiber that was not different from the ATTD of crude fiber by 20 kg White composite
crossbred pigs (Yen et al., 2004). Other native breeds of pigs such as Mong Cai (Vietman) and
Mukota (Zimbabwe) also have greater ATTD of NDF, ADF, and crude fiber than modern
crossbred pigs (Ndindana et al., 2002; Len et al., 2006; Len et al., 2009), but the ATTD of
dietary fiber in Kune-Kune and Haellisches Schwein or Bunte Bentheimer pigs is not different
from that of modern crossbred pigs (Morel et al., 2006; von Heimendahl et al., 2009). The reason
for these different results among experiments may be that the ATTD of fiber is influenced not
only by the breed of pigs, but also by the type of fiber and the age of the pigs.
In the present experiment, Meishan and Yorkshire pigs, had similar ATTD of GE and
nutrients when fed diets based on SBH, SBP, and pectins. This observation is consistent with the
fact that there are no differences in ATTD of NDF in SBP among Schwaebisch Haellisches
Schwein, Bunte Bentheimer, and modern crossbred pigs (von Heimendahl et al., 2009).
However, Meishan pigs had a greater ATTD of TDF than Yorkshire pigs when pigs were fed
diets with a greater proportion of IDF (control and DDGS diets). This observation indicates that
Meishan pigs have a greater capacity to digest IDF than Yorkshire pigs, whereas there is no
difference between the 2 breeds in the capacity to digest SDF. This is not a surprise because the
117
ATTD of SDF in modern breeds of pigs is close to 90% (Serena et al., 2008; Urriola et al., 2010)
as was also observed for the ATTD of TDF in pectin in this experiment.
The ATTD of TDF and energy is influenced by the age of the pig (Le Goff and Noblet,
2001). To separate the effects of BW and age we attempted to compare the ATTD of TDF in
Meishan pigs to Yorkshire pigs that had either a BW or an age that was similar to the Meishan
pigs. The fact that Meishan pigs and heavy Yorkshire pigs had a greater ATTD of TDF than light
Yorkshire pigs when fed DDGS, but not when fed SBH, SBP, or pectin, indicates that age related
differences in the ATTD of fiber are caused by differences in the ATTD of IDF, whereas age
does not influence the ATTD of SDF. This observation is in agreement with Le Goff and Noblet
(2001) and with Jørgensen et al. (2007) who reported that the ATTD of GE and dietary fiber
were not different among modern crossbred growing pigs, finishing pigs, or sows when fed diets
based on SBP. However, if diets that contained IDF from wheat bran or corn bran were fed, sows
had greater ATTD of GE and fiber than growing and finishing pigs and finishing pigs had a
grater ATTD of GE and fiber than growing pigs.
Greater ATTD of IDF by older pigs than by younger pigs may be explained by
differences in feed intake, differences in the size of the intestines, and differences in the capacity
of microbes to ferment IDF (Varel and Yen, 1988; Dierick et al., 1989; Varel et al., 1997). In the
current experiment, feed intake was equalized among the 3 groups of pigs so feed intake did not
contribute to the observed differences among pigs. However, Meishan pigs, have larger
intestines in proportion to BW than White composite crossbred pigs (Yen et al., 2004), which
may have contributed to the increased ATTD of IDF and GE. The greater ATTD of IDF in
Meishan pigs than in Yorkshire pigs may also have been due to a greater capacity of the
microflora in Meishan pigs to digest fiber. However, the concentrations of total viable bacteria
118
and cellulitic bacteria in the feces of Meishan pigs at 13, 17, and 19 wk of age were not different
from that of White composite crossbred pigs (Yen et al., 2004) and the capacity to ferment fiber
is not different between sows and growing pigs (Le Goff et al., 2003). Meishan pigs have greater
intestinal concentrations of Bacteroides and Firmicutes than Yorkshire pigs (Guo et al., 2008)
and these differences contribute to an increase in digestibility of dietary energy in mice
(Turnbaugh et al., 2006).
Hindgut fermentation was calculated as the difference between ATTD and AID and
differences in hindgut fermentability among breeds of pigs were not observed regardless of the
diets being fed. However, dietary fiber is defined as the CHO that are resistant to digestion by
mammalian enzymes (AACC, 2001). Therefore, any disappearance of fiber in the small intestine
may be considered a result of fermentation in the small intestine, but results of this experiment
showed that there were no differences among breeds in the AID of dietary fiber. We are not
aware of any previous data that compared the AID of TDF among different breeds of pigs.
The negative hindgut fermentation of AEE for all diets and for DDGS and SBH is most
likely a consequence of synthesis of fatty acids in the hindgut, because the presence of CHO in
the hindgut allows microbes to synthesize fatty acids. No synthesis of fat takes place in the
hindgut, in low fiber diet, but in high fiber diets, fat is synthesized in the hindgut, which results
in lower values for the ATTD than for the AID of AEE. This, in term, results in negative values
for hindgut fermentation of AEE (Kil, 2008).
The negative values for the AID of ash in SBH, SBP, and pectin, but not in DDGS,
indicate that ingredients that contain significant quantities of SDF may draw minerals into the
stomach and (or) small intestines. This observation is in agreement with data showing that AID
of ash in SBP (-116%) is much lower than in wheat bran (-3.9%; Graham et al., 1986).
119
The AID of TDF in DDGS that was measured in this experiment agrees with the value of
24% that has previously been reported (Urriola et al., 2010). The AID for TDF in all diets are
also within the range for AID of TDF (-10 to 62%) that has previously been reported (Bach
Knudsen and Jørgensen, 2001).
Because the small intestinal as well as the hindgut disappearance of TDF is a result of
fermentation, values for the ATTD of TDF represent the total fermentation of fiber. The energy
contribution from fermentation in the small intestine and in the hindgut is a result of absorption
of VFA and, therefore, the total energy contribution from fermentation of fiber can be calculated
from the ATTD of fiber. However, the energy value of dietary fiber depends not only on the
VFA produced after fermentation, but also on the effects of fiber on the digestibility of other
nutrients and on the endogenous losses of nutrients (Elia and Cummings, 2007; Bindelle et al.,
2009). Dietary fiber may increase endogenous losses of nutrients (Bindelle et al., 2009) and the
negative values for AID and ATTD of AEE in SBH and pectin indicate that the fiber in these
ingredients promote a net secretion of AEE into the gut in addition to the net synthesis of AEE in
the hindgut. Endogenous losses of AEE may increase with increasing levels of dietary fiber (Kil,
2008) and the digestibility of AEE, therefore, may decrease with addition of dietary fiber (Bach
Knudsen and Hansen, 1991; Dégen et al., 2009). The reason no negative AID and ATTD values
for AEE were observed for DDGS is most likely that the concentration of AEE in DDGS is
greater than in the other ingredients because the influence of the endogenous losses of AEE are
much greater in diets with low concentration of AEE than in diets with greater concentration of
AEE (Stein et al., 2007; Kil, 2008).
In conclusion, Meishan pigs had a greater ATTD of TDF than Yorkshire pigs when fed
the control or the DDGS diet, which have a high concentration of IDF. There were, however, no
120
differences among the 3 group of pigs when pigs where fed diets containing SBH, SBP, or
pectin, which contain more SDF. This indicates that Meishan pigs are more efficient in
fermenting IDF than Yorkshire pigs. It is possible that this difference is a result of differences in
the microbial population, but further research is needed to measure the influence of breed on
intestinal microbial populations.
121
LITERATURE CITED
AACC. 2001. The definition of Dietary Fiber. AACC Report. American Association of Cereal
Chemist. 46:112-126.
AOAC Int. 2007. Official Methods of Analysis. 18th
ed. Assoc. Off. Anal. Chem., Arlington,
VA.
Bach Knudsen, K. E., and I. Hansen. 1991. Gastrointestinal implications in pigs of wheat and oat
fractions. 1. Digestibility and bulking properties of polysaccharides and other major
nutrients. Br. J. Nutr. 65:217-232.
Bach Knudsen, K. E., and H. Jørgensen. 2001. Intestinal degradation of dietary carbohydrates –
from birth to maturity. Pages 109-120 in Digestive Physiology of Pigs. Proceedings of
the 8th
Symposium. J. E. Lindberg, and B. Ogle ed. CABI Publishing, Wallingford, UK.
Bindelle, J., A. Buldgen, M. Delacollette, J. Wavreille, R. Agneessens, J. P. Destain, and P.
Leterme. 2009. Influence of source and concentrations of dietary fiber on in vivo nitrogen
excretion pathways in pigs as reflected by in vitro fermentation and nitrogen
incorporation by fecal bacteria. J. Anim. Sci. 87: 583-593.
Cervantes-Pahm, S. K., and H. H. Stein. 2008. Effects of soybean oil and soybean protein
concentration on the concentration of digestible amino acids in soybean products fed to
growing pigs. J. Anim. Sci. 2008. 86:1841-1849.
Dégen, L., V. Halas, J Tossenberger, Cs. Szabó, and L. Babinszky. 2009. The impact of dietary
fiber and fat levels on total tract digestibility of energy and nutrients in growing pigs and
its consequence for diet formulation. Acta Agric. Scand. Section A. 59:150-160.
122
Dierick, N. A., I. J. Vervaeke, D. I. Demeyer, and J. A. Decuypere. 1989. Approach to the
energetic importance of fibre digestion in pigs. I. Importance of fermentation in the
overall energy supply. Anim. Feed Sci. Technol. 23:141-167.
Drochner, W., A. Kerler, and B. Zacharias. 2004. Pectin in pig nutrition, a comparative review. J.
Anim. Physiol. Anim. Nutr. 88:367-380.
Elia M., and J. H. Cummings. 2007. Physiological aspects of energy metabolism and
gastrointestinal effects of carbohydrates. Eur. J. Clin. Nutr. 61(Suppl 1):S40-74.
Fan, M. Z., and W. C. Sauer. 1995. Determination of apparent ileal amino acid digestibility in
barley and canola meal for pigs with the direct, difference, and regression methods. J.
Anim. Sci. 73:2364-2374.
Freire, J. P. B., J. Peiniau, L. F. Cunha, J. A. A. Almeida, and A. Aumaitre. 1998. Comparative
effects of dietary fat and fiber in Alentejano and Large White piglets: Digestibility, digestive
enzymes, and metabolic data. Livest. Prod. Sci. 53:37-47.
Graham, H., K. Hesselman, and P. Åman. 1986. The influence of wheat bran and sugar-beet pulp
on the digestibility of dietary components in a cereal-based pig diet. J. Nutr. 116:242-251.
Guo, X., X. Xia, R. Tang, J. Zhou, H. Zhao, and K. Wang. 2008. Development of real-time PCR
method for Firmicutes and Bacteroidetes in feces and its application to quantify intestinal
population of obese and lean pigs. Lett. Appl. Microbiol. 47:367-73.
Holst, D. O. 1973. Holst filtration apparatus for Van Soest detergent fiber analysis. J. AOAC.
56:1352-1356.
Jørgensen, H., A. Serena, M. S. Hedemann, and K. E. Bach Knudsen. 2007. The fermentative
capacity of growing pigs and adult sows fed diets with contrasting type and level of
dietary fiber. Livest. Sci. 109:111-114.
123
Kemp, B., L. A. Hartog, J. J. den Klok, and T. Zandstra. 1991. The digestibility of nutrients,
energy and nitrogen in the Meishan and Dutch Landrace pig. J. Anim. Physiol. Anim.
Nutr. 65:263–266.
Kil, D. Y. 2008. Digestibility and energetic utilization of lipids by pigs. PhD Diss. University of
Illinois, Urbana.
Kim, B. G., and H. H. Stein. 2009. A spreadsheet program for making a balanced Latin Square
design. Rev Colomb Cienc Pecuaria 22:591-596.
Kornegay, E. T. 1981. Soybean hull digestibility by sows and feeding value for growing
finishing swine. J. Anim. Sci. 53:138-145.
Le Goff, G., and J. Noblet. 2001. Comparative digestibility of dietary energy and nutrients in
growing pigs and adult sows. J. Anim. Sci. 79:2418–2427.
Le Goff, G., J. Noblet, and C. Cherbut. 2003. Intrinsic ability of the microbial flora to ferment
dietary fiber at different growth stages of pigs. Livest. Prod. Sci. 81:75-87.
Len, N. T., J. E. Lindberg, and B. Ogle. 2006. Digestibility and nitrogen retention of diets
containing different levels of fibre in local (Mong Cai), F1 (Mong Cai×Yorkshire) and
exotic (Landrace×Yorkshire) growing pigs in Vietnam. J. Anim. Physiol. Anim. Nutr.
91:297–303.
Len, N. T., T. B. Ngoc, B. Ogle, and J. E. Lindberg. 2009. Ileal and total tract digestibility in
local (Mong Cai) and exotic (Landrace×Yorkshire) piglets fed low and high-fibre diets,
with or without enzyme supplementation. Livest. Sci. 126:73-79.
Morel, P. C. H., T. S. Lee, and P. J. Moughan. 2006. Effect of feeding level, liveweight and
genotype on the apparent faecal digestibility of energy and organic matter in the growing
pig. Anim. Feed. Sci. Technol. 126:63–74.
124
Myers, W. D., P. A. Ludden, V. Nayigihugu, and B. W. Hess. 2004. Technical note: A procedure
for the preparation and quantitative analysis of samples for titanium dioxide. J. Anim.
Sci. 82:179-183.
Ndindana, W., K. Dzama, P N. B. Ndiweni, S. M. Maswaure, and M. Chimonyo. 2002.
Digestibility of high fibre diets and performance of growing Zimbabwean indigenous
Mukota pigs and exotic Large White pigs fed maize based diets with graded levels of
maize cobs. Anim. Feed Sci. Technol. 97:199-208.
NRC. 1998. Nutrient Requirements of Swine. 10th rev. ed. Natl. Acad. Press, Washington, DC.
Robertson, J. A., F. D. de Monredon, P. Dysseler, F. Guillon, R. Amado, and J. F. Thibault.
2000. Hydration properties of dietary fiber and resistant starch: a european collaborative
study. Lebensmittel-Wissenschaft und Technologie 33:72-79.
Serena A., H. Jørgensen, and K. E. Bach Knudsen. 2008. Absorption of carbohydrate derived
nutrients in sows as influenced by types and contents of dietary fiber. J. Anim. Sci.
86:2208-2216.
Stein, H. H., and G. C. Shurson. 2009. BOARD-INVITED REVIEW: The use and application of
distillers dried grains with solubles in swine diets. J. Anim. Sci. 87:1292-1303.
Stein, H. H., B. Sève, M. F. Fuller, P. J. Moughan, and C. F. M. de Lange. 2007. Invited review:
Amino acid bioavailability and digestibility in pig feed ingredients: Terminology and
application. J. Anim. Sci. 85:172-180.
Stein, H. H., C. F. Shipley, and R. A. Easter. 1998. Technical Note: A technique for inserting a
T-cannula into the distal ileum of pregnant sows. J. Anim. Sci. 76:1433-1436.
Sunvold, G. D., H. S. Hussein, G. C. Fahey, Jr, N. R. Merchen, and G. A. Reinhart. 1995. In
vitro fermentation of cellulose, beet pulp, citrus pulp, and citrus pectin using fecal
125
inoculum from cats, dogs, horses, humans, and pigs and ruminal fluid from cattle. J.
Anim. Sci. 73: 3639-3648.
Turnbaugh, P. J., R. E. Ley, M. A. Mahowald, V. Magrini, E. R. Mardis, and J. I. Gordon. 2006.
An obesity-associated gut microbiome with increased capacity for energy harvest.
Science 444:1027-1031.
Urriola, P. E., G. C. Shurson, and H. H. Stein. 2010. Digestibility of dietary fiber in distillers co-
products fed to growing pigs. J. Anim. Sci. 88 (accepted with revisions).
Varel, V. H., and J. T. Yen. 1997. Microbial Perspective of fiber utilization in swine. J. Anim.
Sci. 75:2715-2722.
Varel, V. H., H. G. Jung, and W. G. Pond. 1988. Effects of dietary fiber of young adult
genetically lean, obese, and contemporary pigs: rate of passage, digestibility, and
microbiological data. J. Anim. Sci. 66:707-712.
Van Soest, P. J., J. B. Robertson, and B. A. Lewis. 1991. Methods for dietary fiber, neutral
detergent fiber, and nonstarch polysaccharides in relation to animal nutrition. J. Dairy
Sci. 74:3583–3597.
Von Heimendahl, E., G. Breves, and Hj Abel. 2009. Fiber related digestive processes in three
different breeds of pigs. J. Anim. Sci. doi:10.2527/jas.2009-2370.
Yen, J. T., V. H. Varel, and J. A. Nienaber. 2004. Metabolic and microbial responses in western
crossbred and Meishan growing pigs fed a high fiber-diet. J. Anim. Sci. 82:1740-1755.
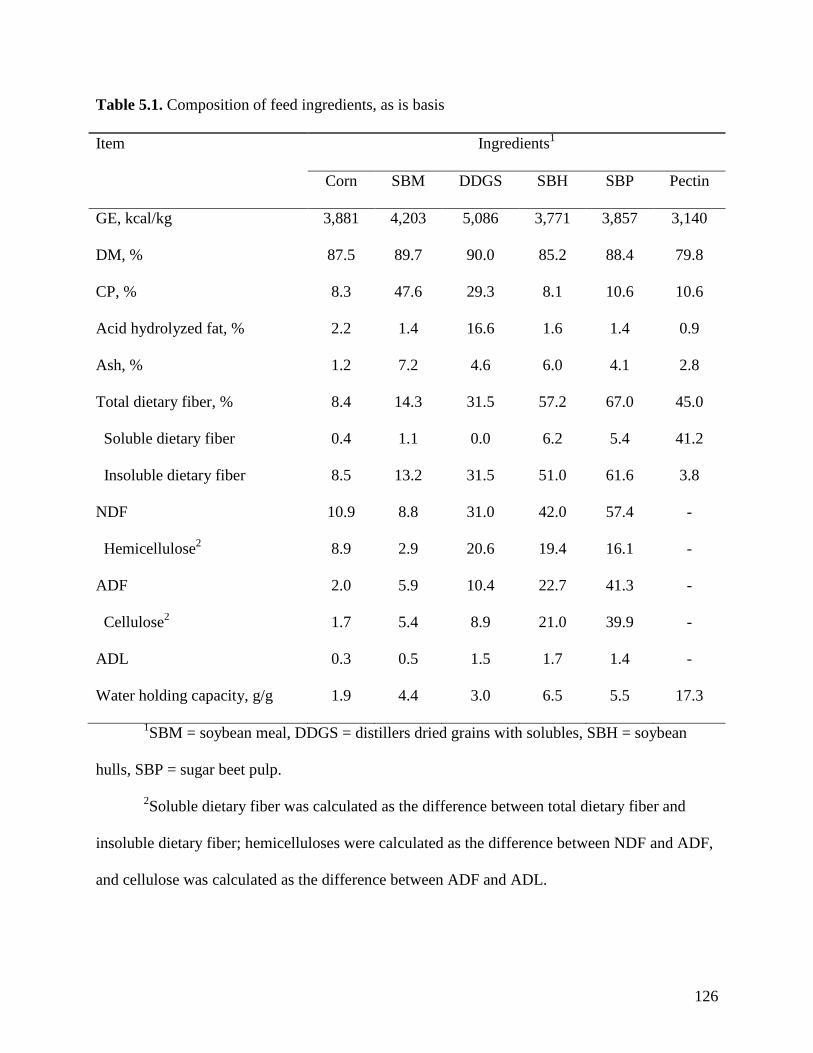
126
Table 5.1. Composition of feed ingredients, as is basis
Item Ingredients1
Corn SBM DDGS SBH SBP Pectin
GE, kcal/kg 3,881 4,203 5,086 3,771 3,857 3,140
DM, % 87.5 89.7 90.0 85.2 88.4 79.8
CP, % 8.3 47.6 29.3 8.1 10.6 10.6
Acid hydrolyzed fat, %
2.2 1.4 16.6 1.6 1.4 0.9
Ash, % 1.2 7.2 4.6 6.0 4.1 2.8
Total dietary fiber, % 8.4 14.3 31.5 57.2 67.0 45.0
Soluble dietary fiber 0.4 1.1 0.0 6.2 5.4 41.2
Insoluble dietary fiber 8.5 13.2 31.5 51.0 61.6 3.8
NDF 10.9 8.8 31.0 42.0 57.4 -
Hemicellulose2
8.9 2.9 20.6 19.4 16.1 -
ADF 2.0 5.9 10.4 22.7 41.3 -
Cellulose2
1.7 5.4 8.9 21.0 39.9 -
ADL 0.3 0.5 1.5 1.7 1.4 -
Water holding capacity, g/g 1.9 4.4 3.0 6.5 5.5 17.3
1SBM = soybean meal, DDGS = distillers dried grains with solubles, SBH = soybean
hulls, SBP = sugar beet pulp.
2Soluble dietary fiber was calculated as the difference between total dietary fiber and
insoluble dietary fiber; hemicelluloses were calculated as the difference between NDF and ADF,
and cellulose was calculated as the difference between ADF and ADL.
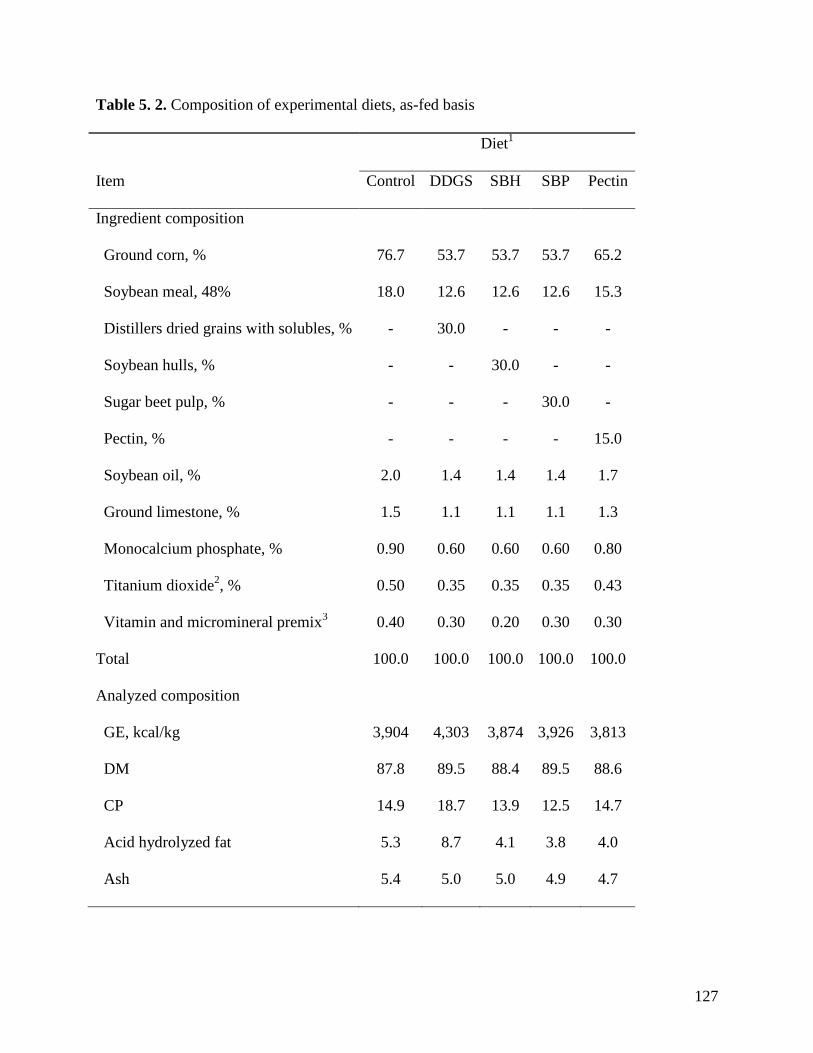
127
Table 5. 2. Composition of experimental diets, as-fed basis
Diet1
Item Control DDGS SBH SBP Pectin
Ingredient composition
Ground corn, % 76.7 53.7 53.7 53.7 65.2
Soybean meal, 48% 18.0 12.6 12.6 12.6 15.3
Distillers dried grains with solubles, % - 30.0 - - -
Soybean hulls, % - - 30.0 - -
Sugar beet pulp, % - - - 30.0 -
Pectin, % - - - - 15.0
Soybean oil, % 2.0 1.4 1.4 1.4 1.7
Ground limestone, % 1.5 1.1 1.1 1.1 1.3
Monocalcium phosphate, % 0.90 0.60 0.60 0.60 0.80
Titanium dioxide2, % 0.50 0.35 0.35 0.35 0.43
Vitamin and micromineral premix3
0.40 0.30 0.20 0.30 0.30
Total 100.0 100.0 100.0 100.0 100.0
Analyzed composition
GE, kcal/kg 3,904 4,303 3,874 3,926 3,813
DM 87.8 89.5 88.4 89.5 88.6
CP 14.9 18.7 13.9 12.5 14.7
Acid hydrolyzed fat
5.3 8.7 4.1 3.8 4.0
Ash 5.4 5.0 5.0 4.9 4.7
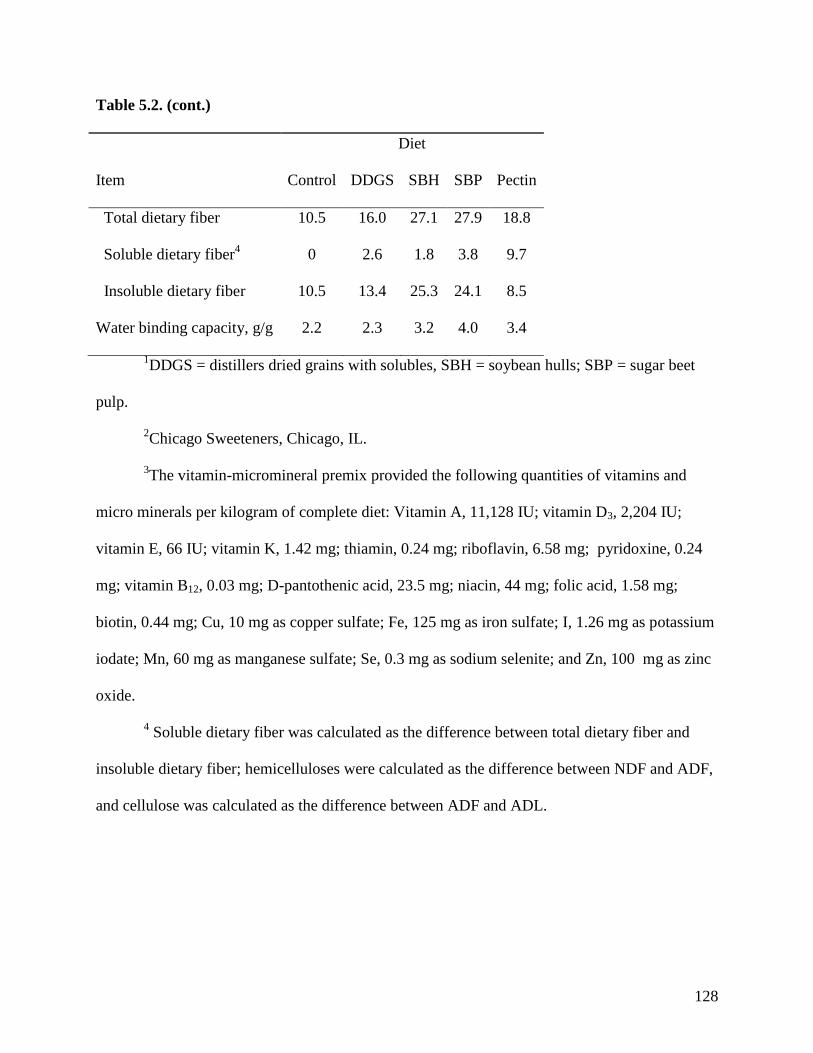
128
Table 5.2. (cont.)
Diet
Item Control DDGS SBH SBP Pectin
Total dietary fiber 10.5 16.0 27.1 27.9 18.8
Soluble dietary fiber4
0 2.6 1.8 3.8 9.7
Insoluble dietary fiber 10.5 13.4 25.3 24.1 8.5
Water binding capacity, g/g 2.2 2.3 3.2 4.0 3.4
1DDGS = distillers dried grains with solubles, SBH = soybean hulls; SBP = sugar beet
pulp.
2Chicago Sweeteners, Chicago, IL.
3The vitamin-micromineral premix provided the following quantities of vitamins and
micro minerals per kilogram of complete diet: Vitamin A, 11,128 IU; vitamin D3, 2,204 IU;
vitamin E, 66 IU; vitamin K, 1.42 mg; thiamin, 0.24 mg; riboflavin, 6.58 mg; pyridoxine, 0.24
mg; vitamin B12, 0.03 mg; D-pantothenic acid, 23.5 mg; niacin, 44 mg; folic acid, 1.58 mg;
biotin, 0.44 mg; Cu, 10 mg as copper sulfate; Fe, 125 mg as iron sulfate; I, 1.26 mg as potassium
iodate; Mn, 60 mg as manganese sulfate; Se, 0.3 mg as sodium selenite; and Zn, 100 mg as zinc
oxide.
4 Soluble dietary fiber was calculated as the difference between total dietary fiber and
insoluble dietary fiber; hemicelluloses were calculated as the difference between NDF and ADF,
and cellulose was calculated as the difference between ADF and ADL.
129
Table 5.3. Apparent ileal digestibility of DM, energy, and nutrients in experimental diets
Item DM GE CP AEE Ash CHO TDF
Control
Light Yorkshires 76.7 77.0 78.9 68.2 34.0 80.7 25.8
Heavy Yorkshires 77.1 75.7 76.9 68.6 39.4 81.3 23.8
Meishans 79.0 78.6 80.3 67.4 34.1 83.6 20.4
SEM 1.0 0.9 1.0 2.6 2.5 1.3 6.6
P-value 0.28 0.09 0.10 0.95 0.25 0.30 0.85
Distillers dried grains with solubles
Light Yorkshires 68.0 69.0 73.2 64.5 31.3 70.4 21.6
Heavy Yorkshires 68.6 70.0 71.8 70.0 27.8 71.4 33.8
Meishans 68.9 70.7 75.9 72.9 27.7 70.2 28.0
SEM 0.9 1.0 1.5 2.9 3.5 1.3 5.3
P-value 0.76 0.50 0.21 0.17 0.70 0.78 0.31
Soybean hulls
Light Yorkshires 58.3 59.2 66.0b
55.5 11.8 60.5 49.3
Heavy Yorkshires 58.2 59.5 66.7ab
55.5 18.0 59.7 50.6
Meishans 58.3 59.9 71.0a
59.8 10.5 59.4 44.6
SEM 1.6 1.5 1.3 3.1 3.6 1.6 5.6
P-value 0.99 0.94 0.04 0.56 0.32 0.88 0.73
130
Table 5.3. (cont.)
Item DM GE CP AEE Ash CHO TDF
Sugar beet pulp
Light Yorkshires 59.7 62.9 66.9ab
62.6 -47.8 65.9 46.1
Heavy Yorkshires 60.4 62.1 64.3b
61.7 -38.1 66.9 44.1
Meishans 61.7 64.4 68.8a
67.6 -54.8 68.5 37.4
SEM 1.7 1.6 1.2 3.6 9.1 1.8 5.4
P-value 0.68 0.60 0.02 0.47 0.45 0.62 0.52
Pectin
Light Yorkshires 65.7 67.8 71.3 53.0 -14.5 71.5 26.0
Heavy Yorkshires 66.8 68.5 72.0 57.0 -6.6 72.0 28.2
Meishans 67.7 69.2 74.9 66.1 -18.2 73.5 29.8
SEM 0.85 0.9 1.5 4.8 3.2 0.9 4.8
P-value 0.11 0.28 0.06 0.16 0.06 0.31 0.71
131
Table 5.4. Apparent total tract digestibility of DM, energy, and nutrients in experimental diets
Item DM GE CP AEE Ash CHO TDF
Control
Light Yorkshires 86.6b 86.4
b 85.2 63.1 47.6 92.4
b 54.4
Heavy Yorkshires 87.0ab
86.6b 85.0 62.1 50.9 93.0
b 52.0
Meishans 89.2a 89.5
a 87.4 64.9 47.2 95.5
a 58.0
SEM 0.6 0.8 1.1 2.0 1.9 0.4 1.8
P-value 0.02 0.03 0.24 0.62 0.36 < 0.01 0.11
Distillers dried grains with solubles
Light Yorkshires 78.1b 77.3
b 76.9
b 57.1 45.6 84.5
b 45.8
c
Heavy Yorkshires 79.3b 78.8
b 78.4
ab 62.8 48.3 84.9
b 55.3
b
Meishans 84.0a 83.5
a 83.7
a 63.8 47.2 90.4
a 66.5
a
SEM 1.0 1.0 1.1 2.4 3.2 1.0 2.2
P-value < 0.01 < 0.01 < 0.01 0.15 0.24 < 0.01 < 0.01
Soybean hulls
Light Yorkshires 81.3 79.5 70.7 43.3 49.8 87.9 78.6
Heavy Yorkshires 82.2 80.1 71.3 42.5 53.2 88.7 77.7
Meishans 85.4 84.1 76.2 45.7 52.0 92.0 84.1
SEM 1.7 1.8 2.0 4.5 1.3 2.0 2.6
P-value 0.25 0.19 0.13 0.88 0.23 0.36 0.20
132
Table 5.4. (cont.)
Item DM GE CP AEE Ash CHO TDF
Sugar beet pulp
Light Yorkshires 78.1 83.3 73.5 45.0 38.8 91.0 78.1
Heavy Yorkshires 75.6 81.4 70.1 40.3 39.6 91.1 76.8
Meishans 79.3 84.7 76.7 44.0 31.7 92.4 79.3
SEM 2.0 0.9 2.2 1.6 3.6 0.5 1.9
P-value 0.43 0.08 0.15 0.12 0.27 0.12 0.66
Pectins
Light Yorkshires 85.7 84.3 81.0 52.8 41.8 92.3 72.9
Heavy Yorkshires 86.5 85.4 81.0 53.9 44.4 93.1 73.5
Meishans 87.6 86.7 84.0 52.4 41.2 94.3 71.6
SEM 1.0 1.1 1.7 4.7 4.8 0.7 3.3
P-value 0.40 0.38 0.39 0.97 0.88 0.14 0.92
133
Table 5.5. Hindgut fermentation of DM, energy, and nutrients in experimental diets
Item DM GE CP AEE Ash CHO TDF
Control
Light Yorkshires 9.9 9.5 6.3 -5.2 13.6 11.8 28.7
Heavy Yorkshires 10.0 10.9 8.0 -6.5 11.5 11.7 28.2
Meishans 10.3 10.7 7.1 -2.6 13.1 12.0 37.5
SEM 1.2 1.2 1.6 3.0 3.0 1.3 6.6
P-value 1.2 0.66 0.75 0.66 0.87 0.99 0.54
Distillers dried grains with solubles
Light Yorkshires 10.1b
8.3
3.7 -7.4 14.2a 14.0
b 24.1
Heavy Yorkshires 10.7b
9.3
6.7 -6.9 20.5a 13.5
b 21.5
Meishans 15.1a
12.9
7.9 -9.1 19.5a 20.2
a 38.5
SEM 0.9 1.3 2.0 2.4 2.8 1.2 6.4
P-value < 0.01 0.06 0.35 0.78 0.27 < 0.01 0.17
Soybean hulls
Light Yorkshires 23.0 20.3 4.7 -12.2 38.0 27.4 29.2
Heavy Yorkshires 24.0 20.7 4.6 -13.1 35.2 29.0 27.0
Meishans 27.1 24.2 5.2 -14.1 41.4 32.5 39.5
SEM 2.2 2.4 2.3 5.2 3.0 2.3 6.4
P-value 0.41 0.48 0.98 0.97 0.37 0.31 0.37
134
Table 5.5. (cont.)
Item DM GE CP AEE Ash CHO TDF
Sugar beet pulp
Light Yorkshires 24.3 20.4 6.6 -17.7 86.6 25.0 32.0
Heavy Yorkshires 23.3 20.2 8.5 -21.5 77.7 24.2 32.8
Meishans 23.4 20.3 7.9 -23.6 86.5 23.9 41.9
SEM 2.0 1.9 2.5 4.5 9.6 2.0 6.1
P-value 0.92 1.00 0.86 0.65 0.75 0.91 0.46
Pectins
Light Yorkshires 20.0 16.5 9.7 -0.25 56.3 20.8 46.9
Heavy Yorkshires 19.7 16.9 8.9 -3.1 50.8 21.0 45.2
Meishans 19.2 16.7 7.4 -14.3 59.5 20.8 39.9
SEM 1.2 1.2 2.3 6.5 5.5 1.0 4.6
P-value 0.89 0.97 0.77 0.30 0.55 0.98 0.55
135
Table 5.6. Apparent ileal digestibility of DM, energy, and nutrients in ingredients
Item DM GE CP AEE Ash CHO TDF
Distillers dried grains with solubles
Light Yorkshires 45.7 54.0 66.9 62.4 17.2 26.4 20.4
Heavy Yorkshires 47.6 55.8 64.0 70.6 2.3 31.1 41.7
Meishans 48.6 58.9 72.6 75.6 2.0 25.1 31.4
SEM 2.8 2.9 4.5 4.6 11.4 6.2 9.3
P-value 0.76 0.50 0.39 0.17 0.47 0.78 0.31
Soybean hulls
Light Yorkshires 13.3 18.1 8.5 -14.3 -31.5 16.9 72.2
Heavy Yorkshires 12.8 19.0 12.3 -14.3 -14.1 14.3 74.7
Meishans 13.4 20.5 36.0 13.5 -35.1 13.5 63.3
SEM 5.2 5.0 7.0 20.5 10.0 4.9 10.6
P-value 0.99 0.94 0.40 0.56 0.32 0.88 0.73
Sugar beet pulp
Light Yorkshires 17.9 29.7 33.1a
27.5 -293.9 31.8 55.2
Heavy Yorkshires 20.3 27.0 22.7b
20.7 -255.5 34.3 52.4
Meishans 24.7 34.5 37.9a
64.6 -321.6 40.3 43.1
SEM 5.5 5.2 3.7 26.4 35.8 5.9 7.6
P-value 0.68 0.60 0.04 0.47 0.45 0.59 0.52
136
Table 5.6. (cont.)
Item DM GE CP AEE Ash CHO TDF
Pectins
Light Yorkshires -1.9 9.3 16.7 -327.4 -506.9 20.3 28.3
Heavy Yorkshires 5.8 14.3 23.1 -224.1 -419.5 23.5 32.5
Meishans 16.5 24.7 60.7 31.5 -546.7 32.3 38.9
SEM 5.7 6.6 12.4 126.6 33.9 5.5 9.0
P-value 0.11 0.28 0.06 0.16 0.06 0.31 0.71
137
Table 5.7. Apparent total tract digestibility of DM, energy, and nutrients in ingredients
Item DM GE CP AEE Ash CHO TDF
Distillers dried grains with solubles
Light Yorkshires 55.7b 58.5
b 66.7
b 53.6 36.2 49.2
b 39.0
c
Heavy Yorkshires 59.8b 62.9
b 70.0
b 62.5 47.2 51.1
b 55.7
b
Meishans 75.4a 76.3
a 81.3
a 64.0 42.8 78.0
a 75.3
a
SEM 3.3 2.9 2.4 3.8 8.3 0.1 2.0
P-value < 0.01 < 0.01 < 0.01 0.15 0.65 < 0.01 < 0.01
Soybean hulls
Light Yorkshires -2.8 61.1 2.1 -68.3 52.1 -2.3 99.5
Heavy Yorkshires -13.6 63.2 5.4 -73.9 61.4 -12.2 97.8
Meishans -10.8 76.4 33.0 52.9 58.1 -9.9 109.9
SEM 8.12 5.9 10.8 29.7 3.7 8.7 4.8
P-value 0.25 0.19 0.13 0.88 0.23 0.36 0.20
Sugar beet pulp
Light Yorkshires 17.9 29.7 10.4b
27.5 -293.9 31.8 55.2
Heavy Yorkshires 20.3 27.0 -4.9a
20.7 -255.5 34.3 52.4
Meishans 24.7 34.5 -15.2a
64.6 -321.6 40.3 43.1
SEM 5.5 5.2 3.7 26.4 35.8 5.9 7.6
P-value 0.68 0.60 0.04 0.47 0.45 0.59 0.52
138
Table 5.7. (cont.)
Item DM GE CP AEE Ash CHO TDF
Pectins
Light Yorkshires 74.7 64.2 45.3 -215.1 -24.9 85.6 88.5
Heavy Yorkshires 80.0 72.2 45.2 -185.7 5.6 90.3 89.6
Meishans 87.5 81.1 70.0 -225.4 34.4 97.6 86.1
SEM 6.5 8.3 14.1 124.3 73.0 4.0 6.1
P-value 0.41 0.38 0.39 0.97 0.88 0.14 0.92
139
Table 5.8. Hindgut fermentation of DM, energy, and nutrients in experimental feed ingredients
Item DM GE CP AEE Ash CHO TDF
Distillers dried grains with solubles
Light Yorkshires 16.8 19.5 9.0 -0.3 25.7 13.9 38.1
Heavy Yorkshires 14.2 9.2 7.3 -3.9 28.9 13.5 22.9
Meishans 21.0 16.6 7.8 -6.8 12.5 18.3 37.5
SEM 14.0 10.3 3.68 3.0 10.5 5.1 11.4
P-value 0.94 0.77 0.95 0.35 0.53 0.76 0.58
Soybean hulls
Light Yorkshires 53.3 43.0 -6.4 -54.0 83.7 59.4 27.3
Heavy Yorkshires 56.5 44.2 -6.9 -59.6 75.5 64.3 23.1
Meishans 66.8 55.9 -3.3 -66.4 93.2 75.1 46.6
SEM 7.2 8.0 12.4 34.2 8.5 7.1 12.0
P-value 0.41 0.48 0.98 0.97 0.37 0.31 0.37
Sugar beet pulp
Light Yorkshires 57.6 43.8 5.0 28.3 304.1 53.4 32.3
Heavy Yorkshires 54.3 43.3 8.2 44.1 268.9 51.5 33.3
Meishans 54.5 43.7 12.4 15.8 303.7 49.3 48.3
SEM 6.5 6.3 8.7 33.3 37.8 6.4 7.8
P-value 0.92 1.0 0.84 0.65 0.75 0.90 0.30
140
Table 5.8. (cont.)
Item DM GE CP AEE Ash CHO TDF
Pectins
Light Yorkshires 76.6 54.9 28.6 112.3 482.0 65.3 60.2
Heavy Yorkshires 74.1 57.9 22.1 38.4 423.4 66.9 57.1
Meishans 71.1 56.5 9.3 -256.9 516.2 65.2 47.2
SEM 8.2 8.8 18.9 169.6 58.8 5.8 8.5
P-value 0.89 0.97 0.77 0.30 0.55 0.98 0.55
141
CHAPTER 6
Evaluation of in vitro procedures to measure digestibility of fiber in distillers dried grains
with solubles
ABSTRACT: Four experiments were conducted to develop and evaluate an assay for measuring
in vitro digestibility of dietary fiber in distillers dried grains with solubles (DDGS). Exp. 1 was
conducted to validate the 3 step in vitro digestibility assay in our laboratory. In vitro apparent
ileal digestibility (AID) and in vitro apparent total tract (ATTD) digestibility of OM in 4 diets
and corn (83.7 and 93.1%) were not different from values analyzed at a reference laboratory
(82.4 and 92.4%) indicating that we were able to repeat the assay. Exp. 2 was conducted with the
objective of increasing the amount of sample that was used for the in vitro digestibility assay
from 0.5 g to 2.0 or 4.0 g. Results of this experiment showed that in vitro ATTD of DM was not
different among the 3 sample sizes (85.1, 83.7, 83.3% for 0.5, 2.0, and 4.0 g, respectively). Exp.
3 was conducted to measure in vitro AID and ATTD of DM and NDF in DDGS from the
production of ethanol (DDGSethanol), DDGS from beverage (DDGSbeverage), and distillers dried
grains (DDG). There were differences (P < 0.01) in the AID of DM (45.2 to 56.7%) among
sources of DDGSethanol, and the AID of DM in DDGSethanol was greater (P < 0.01) than values for
DDGSbeverage (37.7%). Likewise, the ATTD of DM (48.5 to 62.4%) and NDF (32.5 to 52.2%)
were different (P < 0.01) among sources of DDGSethanol, but all values were greater (P < 0.01)
than in DDGSbeverage (44.4 and 24.8%). In DDG, the AID and ATTD of DM (30.1 and 42.5%)
and NDF (-19.2 and 17.5%) were less (P < 0.01) than in any source of DDGSethanol. The
objective of Exp. 4, was to measure in vitro AID and ATTD of DM and NDF in 10 sources of
DDGS using purified enzymes or fecal inoculum. The DDGS samples were produced from corn
142
(n = 8; C-DDGS), 1 source of DDGS produced from sorghum (S-DDGS) and 1 source of DDGS
produced from a combination of sorghum and corn (SC-DDGS). The AID of DM (41.2 to
55.5%) was different (P < 0.01) among sources of DDGS. The ATTD of DM (47.0 to 58.7%)
and NDF (31.4 to 39.9%) were also different (P < 0.01) among sources of C-DDGS. Values for
hindgut disappearance of DM and NDF obtained after fecal inoculation (23.0 and 54.3%) were
greater (P < 0.05) than values obtained using purified enzymes (6.3 and 5.6%). In conclusion
modifications to the 3 step in vitro digestibility assay allowed us to measure the in vitro AID and
ATTD of DM and NDF in DDGS, but results obtained with the fecal inoculum indicate that the
procedure needs to be further improved.
Key words: digestibility, enzymes, inoculum, in vitro assay, NDF, pig
INTRODUCTION
The in vivo apparent ileal digestibility (AID) and apparent total tract digestibility
(ATTD) of energy, ADF, NDF, and total dietary fiber (TDF) in corn distillers dried grains with
solubles (DDGS) has been reported (Guo et al., 2004; Stein et al., 2009; Urriola et al., 2010).
Some of the energy that pigs obtain from DDGS is from fermentation of TDF, but on average,
only 46% of TDF disappears in the gastro intestinal tract of the pig (Urriola et al., 2010).
However, there are differences among sources of DDGS in the AID and ATTD of fiber and it is,
therefore, necessary to measure the digestibility of fiber in different sources of DDGS.
Procedures that measure in vitro digestibility were developed to overcome shortcomings
of measuring in vivo digestibility of DM and energy (Boisen and Fernandez, 1997). However, at
this point, no assay that measures in vitro AID or ATTD of fiber in monogastric animals have
been identified, but it is possible that assays that were developed for measuring in vitro
143
digestibility of OM can be modified to measure in vitro digestibility of fiber. Analysis for NDF
is less expensive and faster than analysis for TDF and the ATTD of TDF in DDGS is closely
correlated with the ATTD of NDF (Urriola et al., 2010). In vitro digestibility of NDF may,
therefore, be used to predict in vivo ATTD of TDF. However, this hypothesis has not been tested
and the objective of the present work was to measure in vitro digestibility of NDF.
The 3 step in vitro digestibility assay that was described by Boisen and Fernandez (1997)
used purified enzymes instead of microbial inoculum, because purified enzymes are more
convenient to use (Coles et al., 2005). However, microbial inoculum contains a diversity of
microbes that may be more efficient in fermenting fiber than purified enzymes (Moughan, 1999).
The second objective, therefore, was to compare values for in vitro digestibility of fiber by
growing pigs using fecal inoculum and purified enzymes.
MATERIALS AND METHODS
Exp. 1. Digestibility of OM
The objective of Exp. 1 was to measure in vitro AID and ATTD of OM in 4 samples of
corn-soybean meal diets and in one sample of corn using the 3 step in vitro digestibility assay
described by Boisen and Fernandez (1997) and to compare values measured at the Univ. of
Illinois to values measured at a reference laboratory (Eurofins Steins Laboratorium, Hjaltesvej 8,
7500, Holstebro, Denmark) that routinely measured in vitro digestibility of OM in ingredients
and diets.
The 5 samples consisted of ground corn, a basal diet containing corn and soybean meal, a
high lipid basal diet containing corn, soybean meal, and 8% corn oil, a diet that was formulated
144
with 25% corn and 75% of the basal diet, and a diet that was formulated with 25% corn and 75
% of the high lipid diet (Kil, 2008).
The in vitro assay of Boisen and Fernandez (1997) has 3 steps that aim at mimicking the
digestibility in the stomach, small intestine, and large intestine, respectively. All samples were
ground in a Wiley Mill Model 4 (Thomas Scientific; Swedesboro, NJ) to pass through a 5 mm
screen. Four replicates of each sample (0.5g ± 0.001) were then weighed into four 125 mL
conical flasks. Twenty five mL of phosphate buffer (0.1 M; pH 6.0) was added to each flask and
stirred continuously using a magnetic stirrer. Ten mL of 0.2 M HCl was added and the final pH
was adjusted to 2 with 1 M HCl or 1 M NaOH. One mL of freshly prepared pepsin solution that
contained 25 mg of pepsin (P7000, Sigma Aldrich, St. Louis, MO) was added to each flask and
samples were placed in a shaking water bath (Thermo Fisher Scientific, Rochester, NY) for 2 h
at 39°C.
In the second step, a combination of 10 mL of phosphate buffer (0.2 M, pH 6.8) and 5 mL
of NaOH (0.6 M) was added to each flask and the pH was adjusted to 6.8 using 1 M HCl or 1 M
NaOH. A solution with 100 mg of pancreatin (P1790, Sigma Aldrich) was added to each flask
and incubated in a shaking water bath at 39°C. After incubation for 4 h, the residues of 2 flasks
were filtered into coarse Gooch crucibles (d:3 cm; pore size: 40-90 μ; Thermo Fisher Scientific)
containing 0.4 g of celite 545 as filtration aid (Sigma Aldrich).
The other 2 flasks of each sample were used in the third step. Ten mL of 0.2 M EDTA
solution was added to each flask and pH was adjusted to 4.8 using 30% acetic acid. The slurry
was mixed with Viscozyme L (V2010, Sigma-Aldrich) and placed in a shaking water bath for 18
h at 39°C. The undigested residue in the flasks were collected in Gooch crucibles with celite 545
(Sigma Aldrich) at the end of the 18 h incubation period. The undigested material collected in
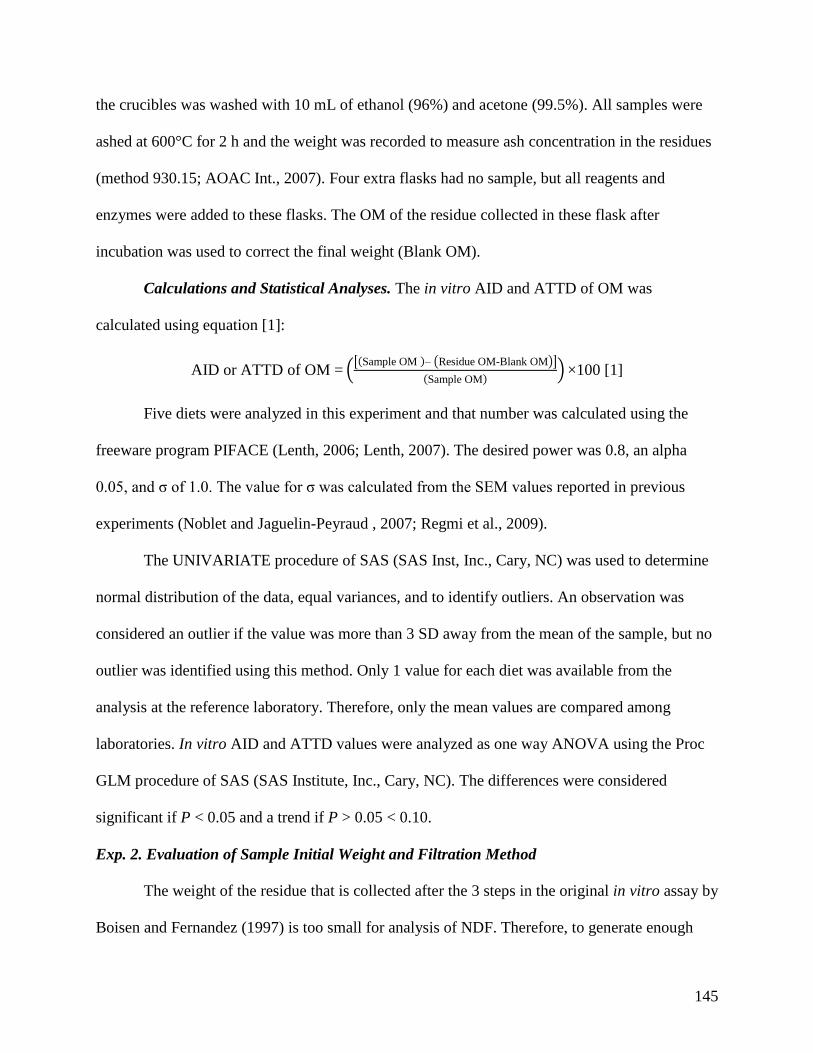
145
the crucibles was washed with 10 mL of ethanol (96%) and acetone (99.5%). All samples were
ashed at 600°C for 2 h and the weight was recorded to measure ash concentration in the residues
(method 930.15; AOAC Int., 2007). Four extra flasks had no sample, but all reagents and
enzymes were added to these flasks. The OM of the residue collected in these flask after
incubation was used to correct the final weight (Blank OM).
Calculations and Statistical Analyses. The in vitro AID and ATTD of OM was
calculated using equation [1]:
AID or ATTD of OM = Sample OM – Residue OM-Blank OM
Sample OM ×100 [1]
Five diets were analyzed in this experiment and that number was calculated using the
freeware program PIFACE (Lenth, 2006; Lenth, 2007). The desired power was 0.8, an alpha
0.05, and σ of 1.0. The value for σ was calculated from the SEM values reported in previous
experiments (Noblet and Jaguelin-Peyraud , 2007; Regmi et al., 2009).
The UNIVARIATE procedure of SAS (SAS Inst, Inc., Cary, NC) was used to determine
normal distribution of the data, equal variances, and to identify outliers. An observation was
considered an outlier if the value was more than 3 SD away from the mean of the sample, but no
outlier was identified using this method. Only 1 value for each diet was available from the
analysis at the reference laboratory. Therefore, only the mean values are compared among
laboratories. In vitro AID and ATTD values were analyzed as one way ANOVA using the Proc
GLM procedure of SAS (SAS Institute, Inc., Cary, NC). The differences were considered
significant if P < 0.05 and a trend if P > 0.05 < 0.10.
Exp. 2. Evaluation of Sample Initial Weight and Filtration Method
The weight of the residue that is collected after the 3 steps in the original in vitro assay by
Boisen and Fernandez (1997) is too small for analysis of NDF. Therefore, to generate enough
146
residue to measure NDF, it was necessary to either incubate multiple subsamples of each diet or
increase the amount of sample that was used in the assay. The objective of this experiment,
therefore, was to compare in vitro ATTD of DM for 0.5, 2.0, or 4.0 g of sample. The second
objective was to compare in vitro ATTD of DM of samples that were filtered in Gooch crucibles
or in filter paper.
The sample used for this experiment was a corn-soybean meal diet that contained 30%
DDGS. In step 1, 30 subsamples, were divided into 3 weight groups with 10 subsamples
containing 0.5 g, 10 subsamples containing 2.0 g and 10 subsamples containing 4.0 g. The
concentrations of buffers, acid, sodium hydroxide, EDTA, and enzymes were 4 and 8 times
greater for the samples containing 2.0 and 4.0 g, respectively than the samples containing 0.5 g
(Bindelle et al., 2007). Therefore, the analyses were performed in 500-mL plastic bottles
(Thermo Fisher Scientific). Five of the 10 samples for each weight group were filtered using
Gooch crucibles and the other 5 were filtered using hardened quantitative ash free filter paper
(Grade 541, Whatman Inc. Piscataway, NJ). The weight of each filter paper was recorded before
filtration. The paper was dried at 105°C for 2 h, transferred to a dessicator, and the weight was
recorded to the nearest 0.1 mg. Three blank samples were also used to correct for the weight of
reagents and enzymes. Filter papers and Gooch crucibles containing the residues were dried at
105°C until they reached a constant weight.
Calculations and Statistical Analyses. The weights of papers and Gooch crucibles were
recorded and used to calculate in vitro AID and ATTD using Eq. [1]. Outliers and normal
distribution of data were detected as described for Exp. 1. Data for IVDMD were analyzed by
one way ANOVA using the proc GLM procedure of SAS to calculate the effects of initial weight
and filtration method and the interaction of initial weight × filtration method was also introduced
147
in the initial model. However, the interaction was not significant and, therefore, removed from
the final model. The differences were considered significant if P < 0.05 and a trend if P > 0.05 <
0.10.
Exp 3. In vitro Ileal and Total Tract Digestibility of NDF in DDGS from Ethanol or Beverage
Production and in Distillers Dried Grains
The objective of this experiment was to measure in vitro AID and ATTD of DM and
NDF in DDGS from ethanol production (DDGSethanol), DDGS from beverage production
(DDGSbeverage), and in distillers dried grains (DDG). Six sources of DDGSethanol, 1 source of
DDGSbeverage, and 1 source of DDG were obtained from the experiment by Pahm et al. (2008).
Samples were analyzed for in vitro AID and ATTD of DM and NDF following the
modifications to the 3 step in vitro digestibility assay that were validated in Exp 2. Six replicates
of 4 g of each sample were incubated for 2 h in pepsin and 4 h in pancreatin. Three replicates of
each sample were filtered in Gooch crucibles and dried at 105°C. These replicates represented in
vitro AID and the other 3 replicates of each sample were incubated for 18 h with Viscozyme.
These replicates represented in vitro ATTD. Samples were analyzed for NDF after correction for
ash (Holst, 1973) at the Agricultural Experimental Station Chemical Laboratory (University of
Missouri, Colombia, MO). Six bottles had no sample (blank), but all reagents and enzymes were
added to these bottles. Three of these bottles were incubated with pepsin and pancreatin, filtered,
and dried and the final weight was subtracted from the weight of the residue plus filter paper
obtained for the bottles that contained DDGS or DDG for measurement of in vitro AID. The
other 3 bottles were also incubated with viscozyme and the weights of those samples were used
to correct the weight of the residue and filter paper in the bottles that contained DDGS and DDG
for measurement of in vitro ATTD.
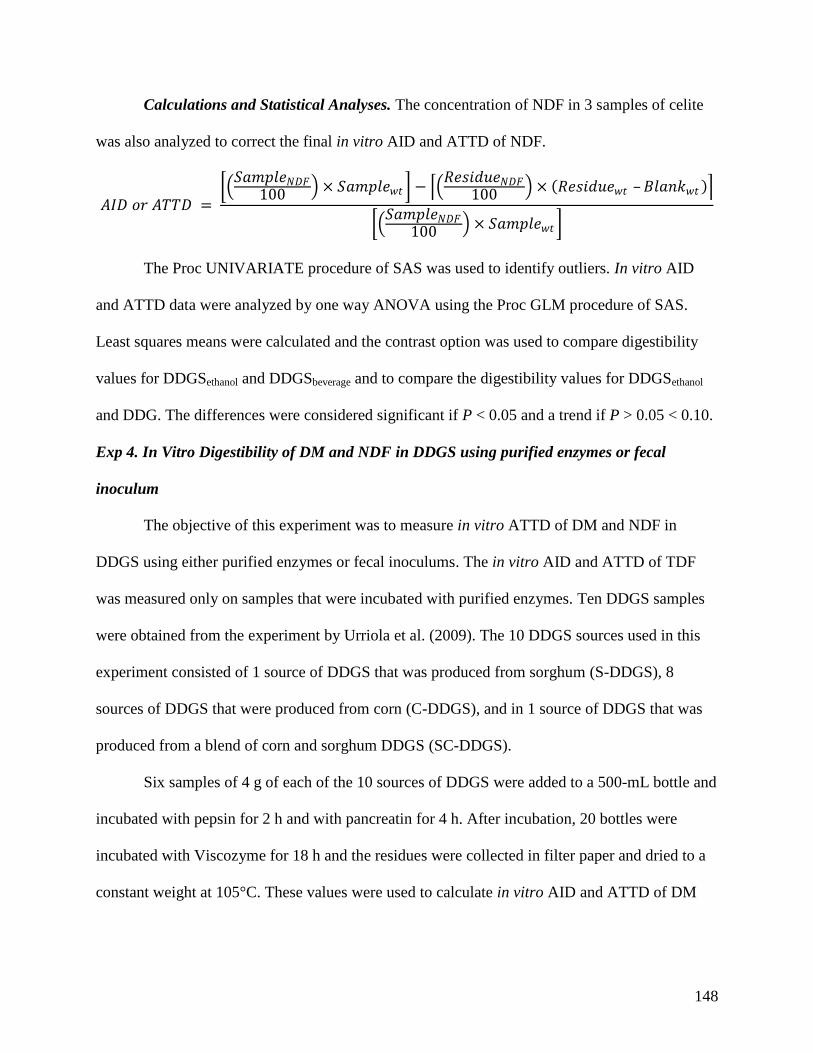
148
Calculations and Statistical Analyses. The concentration of NDF in 3 samples of celite
was also analyzed to correct the final in vitro AID and ATTD of NDF.
𝐴𝐼𝐷 𝑜𝑟 𝐴𝑇𝑇𝐷 =
𝑆𝑎𝑚𝑝𝑙𝑒𝑁𝐷𝐹
100 × 𝑆𝑎𝑚𝑝𝑙𝑒𝑤𝑡 − 𝑅𝑒𝑠𝑖𝑑𝑢𝑒𝑁𝐷𝐹
100 × 𝑅𝑒𝑠𝑖𝑑𝑢𝑒𝑤𝑡 –𝐵𝑙𝑎𝑛𝑘𝑤𝑡
𝑆𝑎𝑚𝑝𝑙𝑒𝑁𝐷𝐹
100 × 𝑆𝑎𝑚𝑝𝑙𝑒𝑤𝑡
The Proc UNIVARIATE procedure of SAS was used to identify outliers. In vitro AID
and ATTD data were analyzed by one way ANOVA using the Proc GLM procedure of SAS.
Least squares means were calculated and the contrast option was used to compare digestibility
values for DDGSethanol and DDGSbeverage and to compare the digestibility values for DDGSethanol
and DDG. The differences were considered significant if P < 0.05 and a trend if P > 0.05 < 0.10.
Exp 4. In Vitro Digestibility of DM and NDF in DDGS using purified enzymes or fecal
inoculum
The objective of this experiment was to measure in vitro ATTD of DM and NDF in
DDGS using either purified enzymes or fecal inoculums. The in vitro AID and ATTD of TDF
was measured only on samples that were incubated with purified enzymes. Ten DDGS samples
were obtained from the experiment by Urriola et al. (2009). The 10 DDGS sources used in this
experiment consisted of 1 source of DDGS that was produced from sorghum (S-DDGS), 8
sources of DDGS that were produced from corn (C-DDGS), and in 1 source of DDGS that was
produced from a blend of corn and sorghum DDGS (SC-DDGS).
Six samples of 4 g of each of the 10 sources of DDGS were added to a 500-mL bottle and
incubated with pepsin for 2 h and with pancreatin for 4 h. After incubation, 20 bottles were
incubated with Viscozyme for 18 h and the residues were collected in filter paper and dried to a
constant weight at 105°C. These values were used to calculate in vitro AID and ATTD of DM
149
and NDF using purified enzymes following modifications to the 3 step in vitro digestibility assay
that was used in Exp. 2 and 3.
The residue of the other 40 bottles was collected in filter paper, dried to a constant
weight, and pooled within source of DDGS and used for in vitro ATTD using fecal inoculum.
One gram of substrate from the pooled residues was added to thirty 100-mL serum bottles
(Wheaton Industries, Inc., Millville, NJ) for the fecal inoculums. Three replicates of 1 g of Pectin
(TIC Gums, Belcamp, MD) and Solka-floc (International Fiber Corporation, St. Louis, MO)
were added to 6 serum bottles and another 3 bottles had no substrate and were used as blank.
Bottles were placed overnight in a chamber filled with CO2 (Coy Laboratory Products, Grass
Lake, MI) to ensure that all O2 was removed from the substrate and the head space of the bottles.
Fecal inoculum was prepared by pooling feces from 3 growing pigs that were consuming
a corn-soybean meal diet. Pigs had not been fed diets containing antibiotic growth promoters for
10 wk before the start of the experiment. Fecal samples were collected within 30 min of the
preparation of the inoculum by grab sampling of fresh feces and samples were immediately
placed in plastic bags that were sealed after all air was excluded. Fecal samples were kept under
anaerobic conditions under a stream of CO2 that was reduced in a heated cupper column. Equal
parts of each fecal sample were pooled and diluted 1:10 (wt/vol) in a warmed (39°C) anaerobic
diluting solution (Bryant and Burkey, 1953). Feces and diluting solution were blended in a 500-
mL blender (Waring Laboratory Products; Torrington, CT) in an anaerobic chamber. The
mixture was then filtered in 4 layers of cheesecloth and transferred to CO2 purged 100-mL serum
bottles that were sealed. Bottles with fecal inoculum were removed from the anaerobic chamber
and kept in a water bath at 39°C until used for inoculation.
150
An enriched media was prepared using the procedure by Bourquin et al. (1993). All
components of the enriched media, except vitamins and VFA solutions, were mixed and
autoclaved. The vitamins and VFA solutions were added to the autoclaved media by injection
and sterilized with syringe 22 µm filters (Thermo Fisher Scientific). Fifty two milliliters of
media were dispensed to each bottle containing the residue from the enzymatic incubation inside
the anaerobic chamber. The bottles were sealed and removed from the anaerobic chamber and
were injected with 8 mL of fecal inoculum and allowed to ferment for 18 h at 39°C in a shaking
water bath. Samples were then quantitatively transferred to 500-mL bottles, mixed with 240 mL
of 95% ethanol and allowed to precipitate. Samples were filtered through Whatman 541 paper
and washed sequentially with 78% ethanol, 95% ethanol, and acetone. The residues recovered in
the filter papers were dried at 105°C to a constant weight.
Calculations and Statistical Analyses. The disappearances of DM and NDF after in vitro
fermentation were calculated using Eq. 1 and data were analyzed by one way ANOVA using the
Proc GLM procedure of SAS. The contrast option of the GLM procedure was used to compare
the digestibility values for S-DDGS and C-DDGS and to compare the digestibility values for SC-
DDGS and C-DDGS. The values for ATTD of DM and NDF using purified enzymes and values
for ATTD of DM and NDF using fecal inoculum were compared using a t-test. The Proc
UNIVARIATE procedure of SAS was used to identify the normal distribution of residuals and
outliers in the final model. The differences were considered significant if P < 0.05 and a trend if
P > 0.05 < 0.10.
151
RESULTS
Exp. 1. Digestibility of OM
The average AID of OM in the 5 complete diets that were analyzed at the reference
laboratory (82.4%) was not different from the value analyzed in the laboratory at the University
of Illinois (83.7%; Table 6.1). The average ATTD of OM in the 5 complete diets (92.4%) was
also not different from the values analyzed in our laboratory (93.1%). There was, however,
greater variation in in vitro AID (SEM = 1.5) than in vitro ATTD (SEM = 0.6).
Exp. 2. Evaluation of Sample Initial Weight and Filtration Method
In vitro ATTD of DM was not different when 0.5 g of sample was used (85.1%) than if
2.0 g (83.7%) or 4.0 g (83.3%) were used (Table 6.2). The in vitro ATTD of DM that was
measured using the Gooch crucibles (84.2%) was not different from the value that was observed
when the residue was filtered in filter paper (83.9%). There was no interaction between filtration
method and the initial amount of sample.
Exp 3. In vitro Ileal and Total Tract Digestibility of NDF in DDGS from Ethanol or Beverage
Production and in Distillers Dried Grains
The concentration of NDF among sources of DDGSethanol varied from 39.2 to 56.5%, and
the concentration of NDF in DDGSbeverage (43.2%) was within this range (Table 6.3). The
concentration of NDF in DDG (39.0%) was close to the lowest value for DDGSethanol. The in
vitro AID of DM (45.2 to 56.7%) and NDF (21.9 to 40.4%) were different (P < 0.01) among
sources of DDGSethanol. Likewise, the ATTD of DM (48.5 to 62.4%) and NDF (32.5 to 52.2%)
were different (P < 0.01) among the 6 sources of DDGSethanol. These variations among sources of
DDGSethanol were also observed in the calculation of hindgut disappearance of DM (2.9 to 5.9%)
and NDF (7.4 to 16.3%). The in vitro AID of DM (37.7%) and NDF (12.3%) were less (P <
152
0.01) for DDGSbeverage than the mean for DDGSethanol (49.3 and 27.0%, respectively). Likewise,
the ATTD of DM and NDF (44.4 and 24.8%) were less (P < 0.01) in DDGSbeverage than the mean
for DDGSethanol (53.8 and 39.9%). The hindgut disappearance of DM and NDF were not different
in DDGSbeverage and DDGSethanol.
The in vitro AID and ATTD of DM in DDG (30.1 and 42.5%) were less (P < 0.01) than
the mean AID and ATTD for DDGSethanol. Likewise, the AID and ATTD of NDF in DDG (-19.2
and 17.5%) were less (P < 0.01) than in any source of DDGSethanol. However, hindgut
disappearance of DM and NDF in DDG (12.4 and 36.7%) were greater (P < 0.01) than in all
sources of DDGSethanol.
Exp 4. In Vitro Digestibility of DM and NDF in DDGS using Enzymes or Inoculum
In vitro digestibility after incubation with enzymes. The in vitro AID of DM (41.2 to
55.5%), NDF (25.3 to 34.5%), and TDF (24.3 to 29.5%) were different (P < 0.01) among sources
of C-DDGS (Table 6.4). Likewise, the ATTD of DM (47.0 to 58.7%), NDF (31.4 to 39.9%), and
TDF (32.0 to 38.4%) were different (P < 0.01) among sources of C-DDGS. The in vitro AID of
DM (34.8%) and NDF (23.3%) were less (P < 0.01) in S-DDGS compared with the mean for C-
DDGS (46.4 and 29.9%, respectively), but it was not different for in vitro AID of TDF. The in
vitro ATTD of DM (41.1%), NDF (29.0%), and TDF (29.8%) were less (P < 0.01) in S-DDGS
than the mean for C-DDGS (57.2, 35.0, and 34.8; %, respectively).
The in vitro AID and ATTD of DM in SC-DDGS (39.5 and 47.4%) were less (P < 0.01)
than the mean value in C- DDGS and they were not different for TDF. The in vitro AID and
ATTD of NDF in SC-DDGS (27.8 and 33.7%) were less (P < 0.01) than in any source of C-
DDGS. However, hindgut disappearance of DM and NDF in SC-DDGS were not different from
that of C-DDGS.
153
In vitro digestibility after incubation with inoculum. The ATTD of DM using fecal
inoculum (67.4 to 78.6%) was different (P < 0.01) among sources of C-DDGS. The ATTD of
NDF was also different (P < 0.01) among sources of C-DDGS. The ATTD of DM was less (P <
0.01) in S-DDGS (55.7%) than in C-DDGS, but there were no differences in ATTD of NDF. The
ATTD of DM in SC-DDGS (62.5%) was less (P < 0.01) than in C-DDGS, but the ATTD of
NDF (82.1%) was greater (P < 0.01) than in C-DDGS.
The in vitro hindgut disappearance of DM varied among sources of C-DDGS from 21.1
to 32.6%. The mean in vitro hindgut disappearance of DM in C-DDGS was greater (P < 0.05)
than values for S-DDGS (21.3%), but not different from the value for SC-DDGS (23.0%).
Values of in vitro hindgut disappearance of DM in C-DDGS using fecal inocula (25.3%) were
greater (P < 0.05) than values that were obtained using purified enzymes (6.3%). The in vitro
hindgut disappearance of DM of Solka-floc and pectin was 18.3 and 84.8%, respectively.
Because disappearance of DM in pectin samples was 84.8% the residue that remained after in
vitro fermentation was too small for analysis of NDF.
DISCUSSION
The 3 step in vitro digestibility assay is used to measure AID and ATTD of OM (Boisen
and Fernandez, 1997). Samples are analyzed in a batch system allowing for more consistent
results across diets and the consistent results obtained with this procedure allow for routine
measurement of ATTD of OM in swine diets (Boisen, 2007). The 3 step in vitro digestibility
assay was modified to measure in vitro digestibility of energy in barley and wheat (Regmi et al.,
2008; Regmi et al., 2009), but the assay has not been used to measure in vitro digestibility of
fiber.
154
The in vitro digestibility of OM is routinely analyzed at the reference laboratory that was
used in Exp. 1. Results of the experiment showed that the in vitro digestibility of OM that was
measured in our laboratory did not differ from the values reported by the reference laboratory.
This observation is in agreement with Noblet and Jaguelin-Peyraud (2007) who observed a high
repeatability of the procedure. The reason that the 3 step in vitro assay is repeatable may be that
it is a batch digestibility system, which has the advantage of analyzing multiple samples at the
same time reducing the variation among samples (Coles et al., 2005).
One of the disadvantages of the 3-step in vitro assay is that the amount of sample left in
the residue after the 3 steps is too small for analysis of undigested NDF or TDF. Analysis of
NDF requires 0.5 g of sample and analysis of TDF requires 1.0 g of sample (AOAC Int., 2007).
It is, therefore, necessary to modify the procedure to obtain a quantity of residue that is large
enough for analysis of NDF and TDF.
The fact that there was no difference among 0.5, 2.0, and 4.0 g in the ATTD of DM
indicates that a sample size up to at least 4 g can be used in this assay provided that the
concentration of reagents and enzymes are kept proportional to the concentration of substrate.
This observation makes it possible to generate residue samples that are sufficiently large to
analyze NDF. The procedure has also been modified to use 2.0 g of sample for analysis of in
vitro gas production (Bindelle et al., 2007).
The values for ileal and total tract in vitro digestibility varied among sources of DDGS.
This observation is in agreement with in vivo data from Guo et al. (2004), Stein et al. (2009), and
Urriola et al. (2010) suggesting that digestibility of fiber in corn varies among samples or that
ethanol production affects the digestibility of fiber. The in vivo ATTD of TDF in DDGSbeverage
was not different from the ATTD in DDGSethanol (Urriola et al. 2010). However, in vitro AID and
155
ATTD of NDF in DDGSbeverage was lower than in DDGSethanol. We do not have an explanation
for this discrepancy. There is agreement, however, between in vivo and in vitro digestibility of
fiber in DDG. The in vivo AID of NDF is low (0.7%) and the in vitro digestibility of NDF is also
very low (-19.2%) and in both cases, calculated hindgut disappearance of NDF or TDF in DDG
is greater than in DDGSethanol.
The advantage of the batch in vitro digestibility assay is that data obtained with this
system are more repeatable than data obtained in continuous digestibility assays. However, in
continuous digestibility assays, the conditions of pH, concentration of substrate and enzymes
may be modified to mimic conditions in the gut that may be affected by fiber such as rate of
passage of digesta (Coles et al., 2005; Meunier et al., 2008). In the last step of the procedure,
purified enzymes are used in the last step of in vitro digestibility of fiber. Purified enzymes are
used rather than fecal inoculums for convenience of easy access, availability, and consistency of
the products (Coles et al., 2005). Also, a large proportion of fecal microbes require anaerobic
environment for proper growth during incubation (White, 2000). Despite these difficulties, we
observed that disappearance of DM and NDF were greater when using the fecal inoculums than
the values obtained using purified enzymes. Greater disappearance of DM and NDF suggests that
inoculums are more effective in degrading dietary fiber than purified enzymes.
In conclusion the 3 step in vitro digestibility assay does not predict in vivo digestibility of
dietary fiber and it requires modifications before the procedure can be used to measure fiber
digestibility in DDGS. Fecal inoculums are a better option than purified enzymes to study
disappearance of DM during in vitro hindgut digestibility.
156
LITERATURE CITED
AOAC Int. 2007. Official Methods of Analysis of AOAC Int. 18th Ed. AOAC Int., Gaithersburg,
MD.
Bindelle, J., A. Buldgen, J. Wavreille, R. Agneessens, J. P. Destain, B. Wathelet, and P. Leterme.
2007. The source of fermentable carbohydrates influences the in vitro protein sysntesis
by colonic bacteria isolated from pigs. Animal 1:1126-1133.
Boisen, S. 2007. In vitro analyses for predicting standardized ileal digestibility of protein and
amino acids in actual batches of feedstuffs and diets for pigs. Livest. Sci. 109:182-185.
Boisen, S., and J. A. Fernández. 1997. Prediction of the total tract digestibility of energy in
feedstuffs and pig diets by in vitro analyses. Anim. Feed Sci. Technol. 68:277–286.
Bourquin, L. D., E. C. Tigemeyer, and G. C. Fahey Jr. 1993. Vegetable fiber fermentation by
human fecal bacteria: cell wall polysaccharide disappearance and short-chain fatty acid
production during in vitro fermentation and water-holding capacity of unfermented
residues. J. Nutr. 123:860-869.
Byant, M. P., and L. A. Burkey. 1953. Cultural methods and some characteristics of some of the
more numerous groups of bacteria in bovine rumen. J. Dairy Sci. 36:205-217.
Coles, L. T., P. J. Moughan, A. J. Darragh. 2005. In vitro digestion and fermentation methods,
including gas production techniques, as applied to nutritive evaluation of food in the
hindgut of humans and other simple-stomached animals. Anim. Feed Sci. Technol. 123-
124:421-4444.
Guo, L., X. Piao, D. Li, and S. Li. 2004. The apparent digestibility of corn by-products for
growing-finishing pigs in vivo and in vitro. Asian Aust. J. Anim. Sci. 17:379-385.
157
Holst, D. O. 1973. Holst filtration apparatus for Van Soest detergent fiber analysis. J. AOAC.
56:1352-1356.
Kil, D. Y. 2008. Digestibility and energetic utilization of lipids by pigs. PhD Diss. University of
Illinois, Urbana.
Lenth, R. V. 2006. Java applets for power and sample size.
http://www.stat.uiowa.edu/~rlenth/Power/. Accessed Jan 2010.
Lenth, R. V. 2007. Statistical power calculations. J. Anim. Sci. 85:E24-E29.
Meunier, J. P., E. G. Manzanilla, M. Anguita, S. Denis, J. F. Perez, J. Gasa, J.-M. Cardot, F.
Garcia, X. Moll, and M. Alric. 2008. Evaluation of a dynamic in vitro model to simulate
porcine ileal digestion of diets differing in carbohydrate composition. J. Anim. Sci.
86:1156:1163.
Moughan, P. J. 1999. In vitro techniques for the assessment of the nutritive value of feed grains:
a review. Aust. J. Agric. Res. 50:871-879.
Noblet, J., and Y. Jaguelin-Peyraud. 2007. Prediction of digestibility of organic matter and
energy in the growing pig from an in vitro method. Anim. Feed Sci. Technol. 134:211–
222
Pahm A. A., C. Pedersen, D. Hoehler, and H. H. Stein. 2008. Factors affecting the variability in
ileal amino acid digestibility in corn distillers dried grains with solubles fed to growing
pigs. J. Anim. Sci. 86:2180-2189.
Regmi, P. R., N. S. Ferguson, and R. T. Zijlstra. 2009. In vitro digestibility techniques to predict
apparent total tract energy digestibility of wheat in growing pigs. J. Anim. Sci. 87:3620-
3629.
158
Regmi, P. R., W. C. Sauer, and R. T. Zijlstra. 2008. Prediction of in vivo apparent total tract
energy digestibility of barley in grower pigs using an in vitro digestibility technique. J
Anim. Sci. 86:2619-2626.
Stein, H. H., S. P. Connot, and C. Pedersen. 2009. Energy and nutrient digestibility in four
sources of distillers dried grains with solubles produced from corn grown within a narrow
geographical area and fed to growing pigs. Asian-Aust. J. Anim. Sci. 22:1016-1025.
Stein, H. H., M. L. Gibson, C. Pedersen, and M. G. Boersma. 2006. Amino acid and energy
digestibility in ten samples of distillers dried grain with solubles fed to growing pigs. J
Anim. Sci. 84: 853-860.
Urriola, P. E., G. C. Shurson, H. H. Stein. 2010. Digestibility of dietary fiber in distillers co-
products fed to growing pigs. J. Anim. Sci. 88(In press).
Urriola, P. E., D. Hoehler, C. Pedersen, H. H. Stein, and G. C. Shurson. 2009. Amino acid
digestibility of distillers dried grains with solubles produced from sorghum, a sorghum-
corn blend, and corn fed to growing pigs. J. Anim. Sci. 87:2574-2580.
White, D. 2000. The physiology and biochemistry of prokaryotes. 2nd
Ed Oxford University
Press. New York, NY.
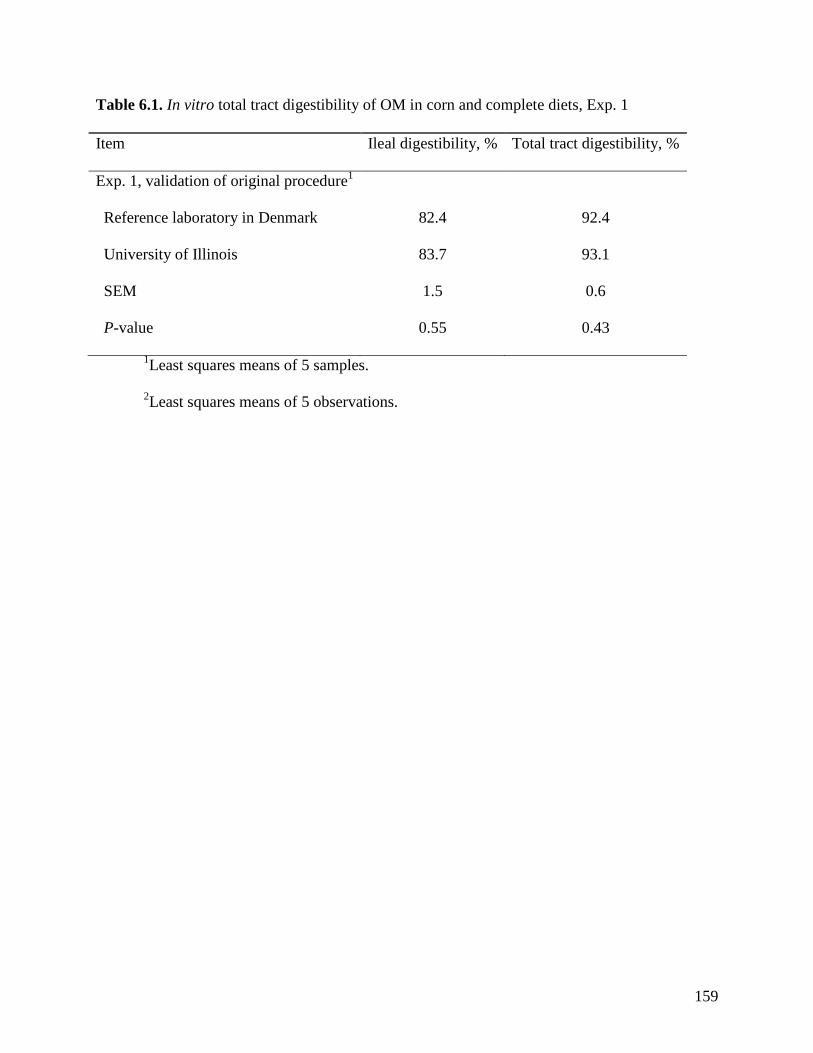
159
Table 6.1. In vitro total tract digestibility of OM in corn and complete diets, Exp. 1
Item Ileal digestibility, % Total tract digestibility, %
Exp. 1, validation of original procedure1
Reference laboratory in Denmark 82.4 92.4
University of Illinois 83.7 93.1
SEM 1.5 0.6
P-value 0.55 0.43
1Least squares means of 5 samples.
2Least squares means of 5 observations.
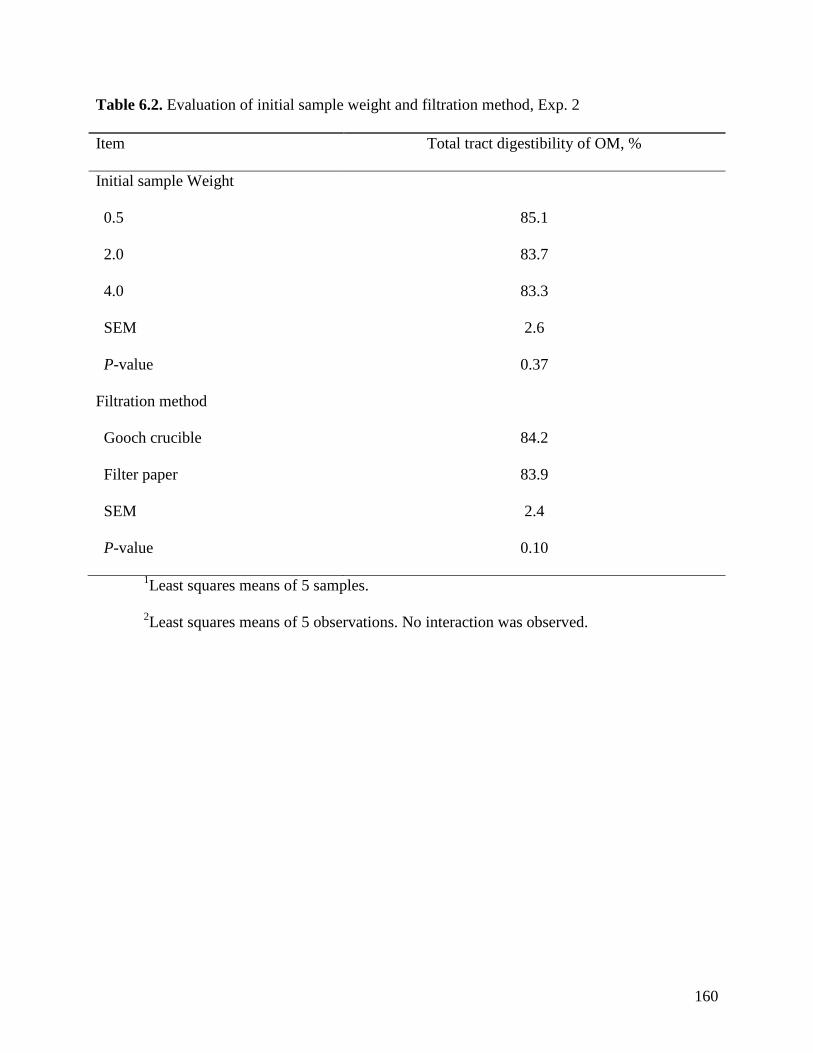
160
Table 6.2. Evaluation of initial sample weight and filtration method, Exp. 2
Item
Total tract digestibility of OM, %
Initial sample Weight
0.5 85.1
2.0 83.7
4.0 83.3
SEM 2.6
P-value 0.37
Filtration method
Gooch crucible 84.2
Filter paper 83.9
SEM 2.4
P-value 0.10
1Least squares means of 5 samples.
2Least squares means of 5 observations. No interaction was observed.
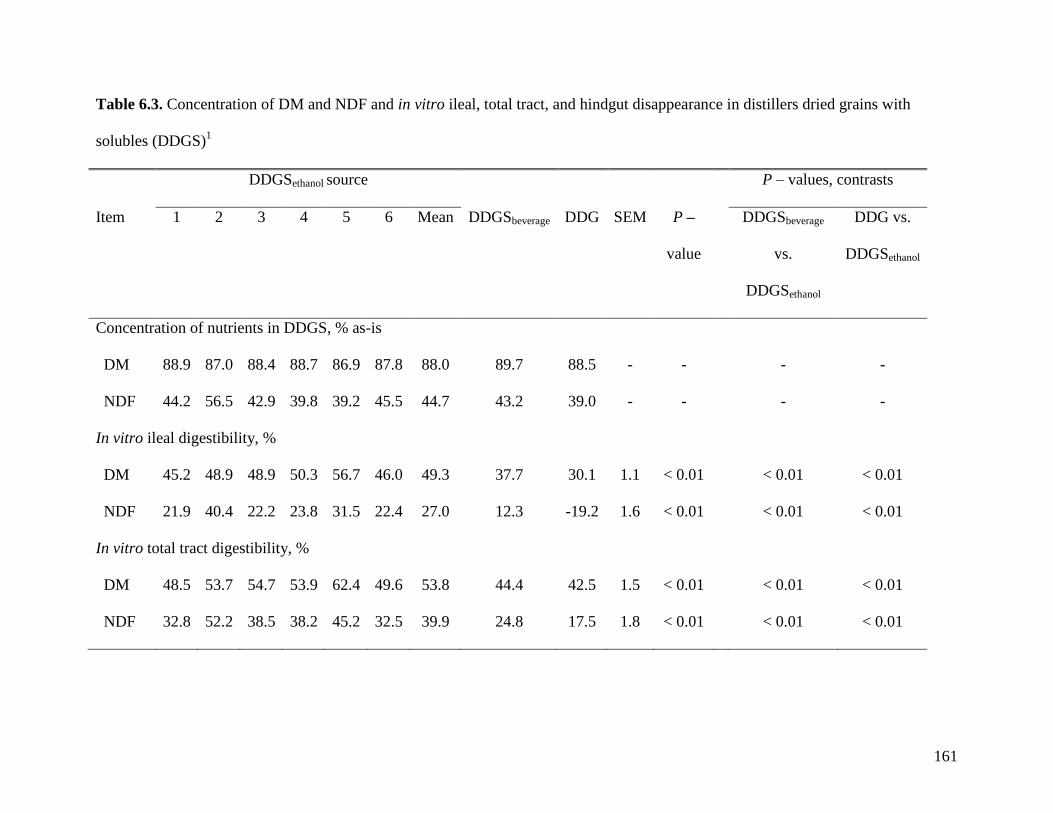
161
Table 6.3. Concentration of DM and NDF and in vitro ileal, total tract, and hindgut disappearance in distillers dried grains with
solubles (DDGS)1
DDGSethanol source P – values, contrasts
Item 1 2 3 4 5 6 Mean DDGSbeverage DDG SEM P –
value
DDGSbeverage
vs.
DDGSethanol
DDG vs.
DDGSethanol
Concentration of nutrients in DDGS, % as-is
DM 88.9 87.0 88.4 88.7 86.9 87.8 88.0 89.7 88.5 - - - -
NDF 44.2 56.5 42.9 39.8 39.2 45.5 44.7 43.2 39.0 - - - -
In vitro ileal digestibility, %
DM 45.2 48.9 48.9 50.3 56.7 46.0 49.3 37.7 30.1 1.1 < 0.01 < 0.01 < 0.01
NDF 21.9 40.4 22.2 23.8 31.5 22.4 27.0 12.3 -19.2 1.6 < 0.01 < 0.01 < 0.01
In vitro total tract digestibility, %
DM 48.5 53.7 54.7 53.9 62.4 49.6 53.8 44.4 42.5 1.5 < 0.01 < 0.01 < 0.01
NDF 32.8 52.2 38.5 38.2 45.2 32.5 39.9 24.8 17.5 1.8 < 0.01 < 0.01 < 0.01
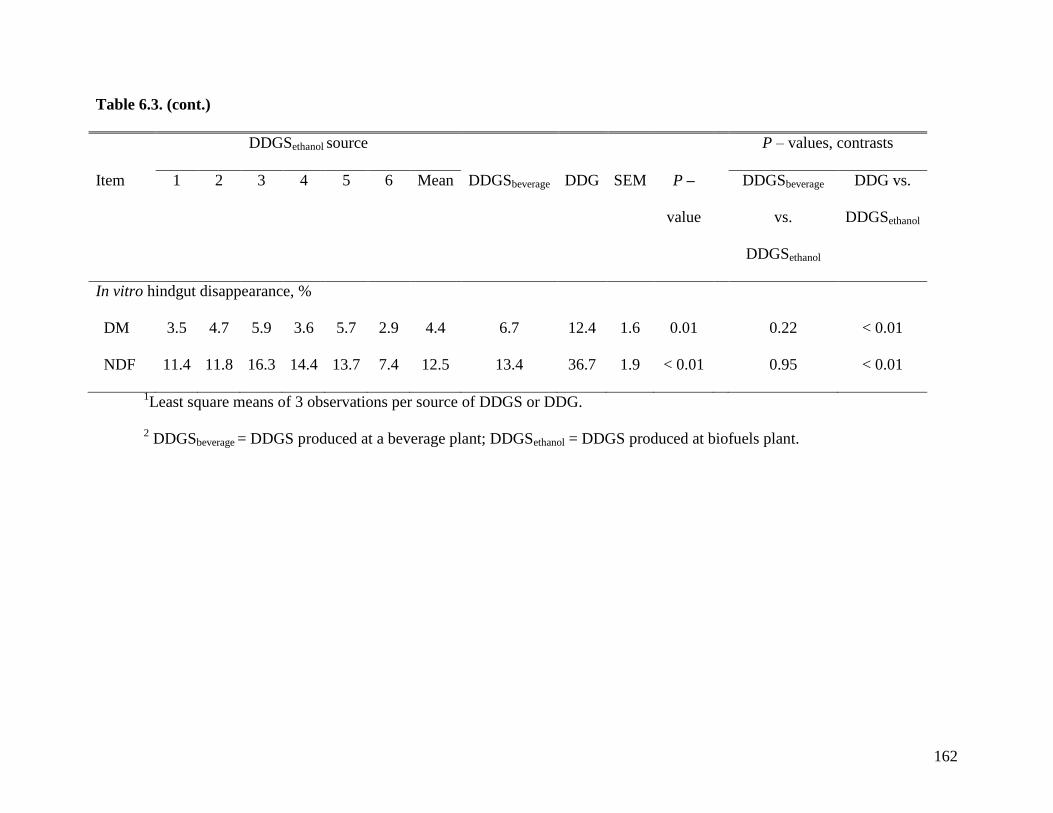
162
Table 6.3. (cont.)
DDGSethanol source P – values, contrasts
Item 1 2 3 4 5 6 Mean DDGSbeverage DDG SEM P –
value
DDGSbeverage
vs.
DDGSethanol
DDG vs.
DDGSethanol
In vitro hindgut disappearance, %
DM 3.5 4.7 5.9 3.6 5.7 2.9 4.4 6.7 12.4 1.6 0.01 0.22 < 0.01
NDF 11.4 11.8 16.3 14.4 13.7 7.4 12.5 13.4 36.7 1.9 < 0.01 0.95 < 0.01
1Least square means of 3 observations per source of DDGS or DDG.
2 DDGSbeverage = DDGS produced at a beverage plant; DDGSethanol = DDGS produced at biofuels plant.
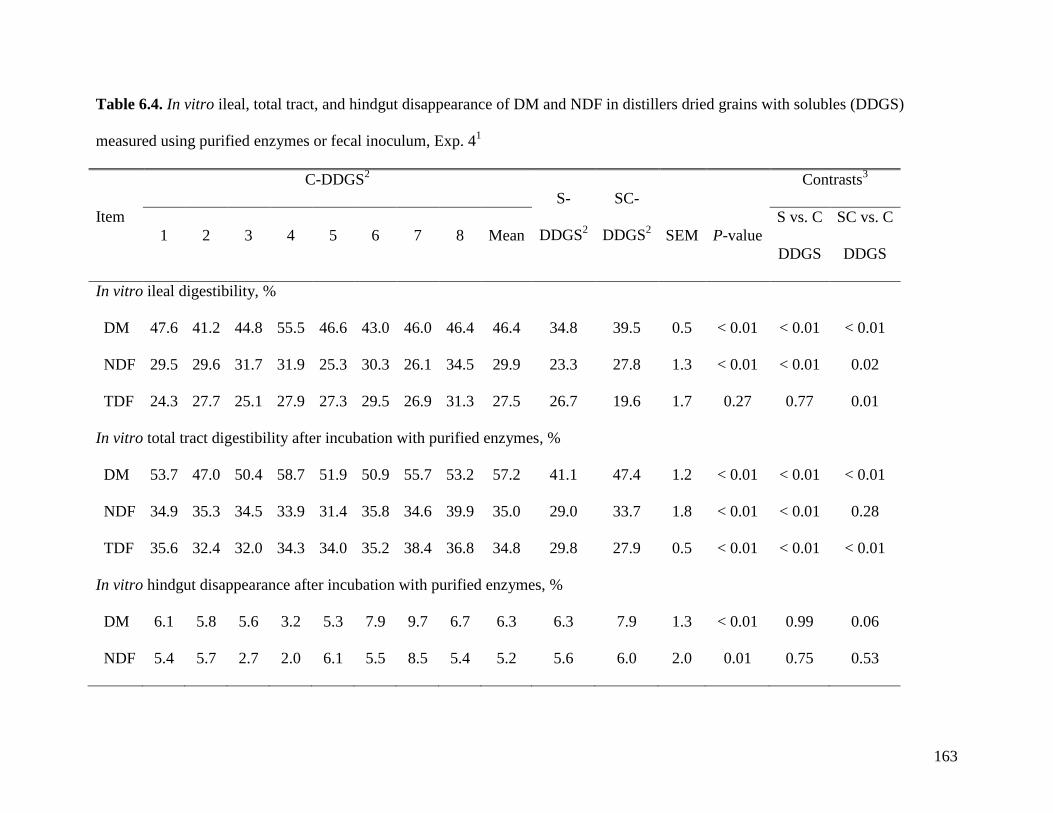
163
Table 6.4. In vitro ileal, total tract, and hindgut disappearance of DM and NDF in distillers dried grains with solubles (DDGS)
measured using purified enzymes or fecal inoculum, Exp. 41
Item
C-DDGS2
S-
DDGS2
SC-
DDGS2
Contrasts3
1 2 3 4 5 6 7 8 Mean SEM P-value
S vs. C
DDGS
SC vs. C
DDGS
In vitro ileal digestibility, %
DM 47.6 41.2 44.8 55.5 46.6 43.0 46.0 46.4 46.4 34.8 39.5 0.5 < 0.01 < 0.01 < 0.01
NDF 29.5 29.6 31.7 31.9 25.3 30.3 26.1 34.5 29.9 23.3 27.8 1.3 < 0.01 < 0.01 0.02
TDF 24.3 27.7 25.1 27.9 27.3 29.5 26.9 31.3 27.5 26.7 19.6 1.7 0.27 0.77 0.01
In vitro total tract digestibility after incubation with purified enzymes, %
DM 53.7 47.0 50.4 58.7 51.9 50.9 55.7 53.2 57.2 41.1 47.4 1.2 < 0.01 < 0.01 < 0.01
NDF 34.9 35.3 34.5 33.9 31.4 35.8 34.6 39.9 35.0 29.0 33.7 1.8 < 0.01 < 0.01 0.28
TDF 35.6 32.4 32.0 34.3 34.0 35.2 38.4 36.8 34.8 29.8 27.9 0.5 < 0.01 < 0.01 < 0.01
In vitro hindgut disappearance after incubation with purified enzymes, %
DM 6.1 5.8 5.6 3.2 5.3 7.9 9.7 6.7 6.3 6.3 7.9 1.3 < 0.01 0.99 0.06
NDF 5.4 5.7 2.7 2.0 6.1 5.5 8.5 5.4 5.2 5.6 6.0 2.0 0.01 0.75 0.53
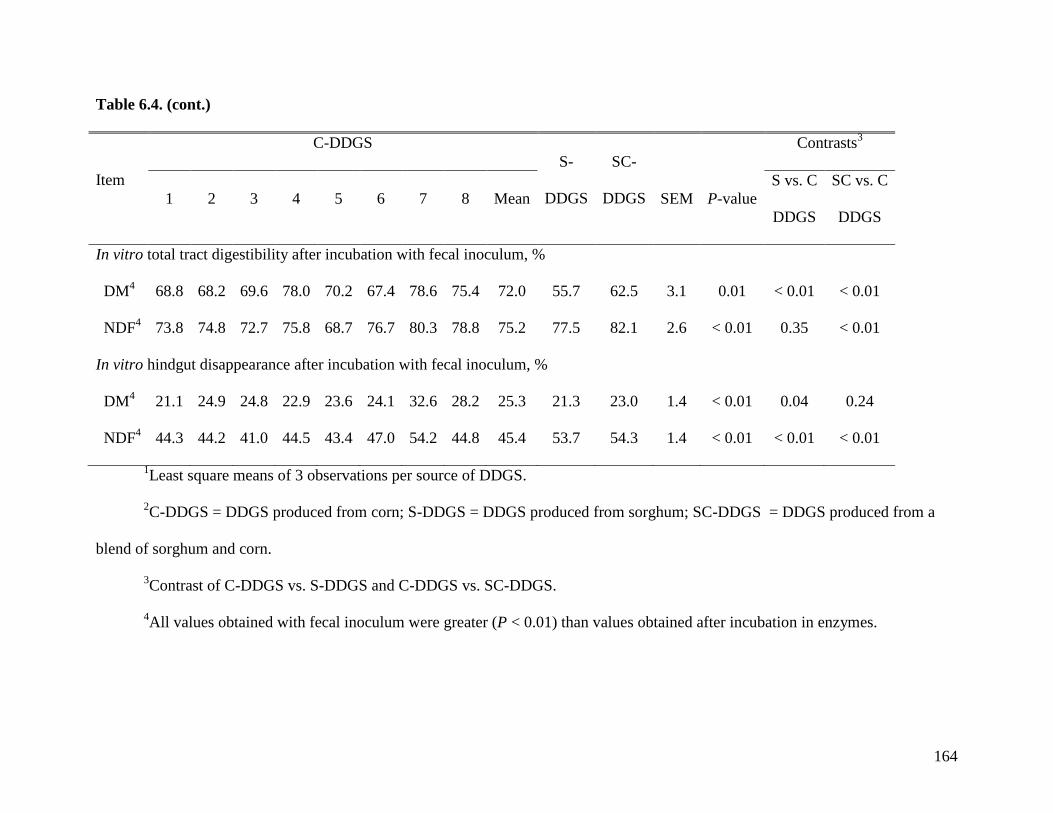
164
Table 6.4. (cont.)
Item
C-DDGS
S-
DDGS
SC-
DDGS
Contrasts3
1 2 3 4 5 6 7 8 Mean SEM P-value
S vs. C
DDGS
SC vs. C
DDGS
In vitro total tract digestibility after incubation with fecal inoculum, %
DM4
68.8 68.2 69.6 78.0 70.2 67.4 78.6 75.4 72.0 55.7 62.5 3.1 0.01 < 0.01 < 0.01
NDF4
73.8 74.8 72.7 75.8 68.7 76.7 80.3 78.8 75.2 77.5 82.1 2.6 < 0.01 0.35 < 0.01
In vitro hindgut disappearance after incubation with fecal inoculum, %
DM4
21.1 24.9 24.8 22.9 23.6 24.1 32.6 28.2 25.3 21.3 23.0 1.4 < 0.01 0.04 0.24
NDF4
44.3 44.2 41.0 44.5 43.4 47.0 54.2 44.8 45.4 53.7 54.3 1.4 < 0.01 < 0.01 < 0.01
1Least square means of 3 observations per source of DDGS.
2C-DDGS = DDGS produced from corn; S-DDGS = DDGS produced from sorghum; SC-DDGS = DDGS produced from a
blend of sorghum and corn.
3Contrast of C-DDGS vs. S-DDGS and C-DDGS vs. SC-DDGS.
4All values obtained with fecal inoculum were greater (P < 0.01) than values obtained after incubation in enzymes.
165
GENERAL CONCLUSIONS
Swine feeding programs may take advantage of alternative feed ingredients. These feed
ingredients are high in dietary fiber which consists of plant derived carbohydrates and lignin that
are undigested by mammalian enzymes. The most important characteristics of dietary fiber from
the perspective of energy utilization are the amount of VFA absorbed by the pig and the effect of
dietary fiber on digestibility of nutrients.
Lysine was the only AA which AID was reduced with addition of DDGS to a corn
soybean meal diet. The AID of other AA and the AID of energy did not change with addition
DDGS. The concentration of both, dietary fiber and dietary fat, in corn soybean meal diets
increase with addition DDGS. In DDGS, fiber and fat may interact affecting AID of AA. One of
the mechanism that dietary fiber reduces AID of nutrients in by reducing the time nutrients stay
in contact with enzymes and the absorptive mucosa. Addition of DDGS did not changed the time
the marker is excreted in ileal digesta, cecal digesta, and feces, suggesting that reduction in AID
of Lys may be not due to reduction of contact with digestive enzymes or absorptive mucosa.
Therefore, these results suggest that the effect of Maillard reaction on AID of Lys is greater than
the effect of dietary fiber.
The energy that the pig will obtain from dietary fiber in DDGS is as VFA that are
produced from fermentation of fiber. In DDGS, ATTD of TDF is the main factor affecting the
energy value of dietary fiber from DDGS. Therefore, it is necessary to measure ATTD of TDF
among a wide variety of sources of DDGS. The AID of TDF among 24 sources of DDGS was
23.0% while the ATTD was 47.3% and there is a wide range of digestibility values (29.3 to
57.0%). These data, along with data of the first experiment, demonstrate that almost half of TDF
in DDGS is excreted in feces and it is, therefore, necessary to increase ATTD of TDF in DDGS.
166
There are two ways that ATTD of TDF may be increased in DDGS. The ability of the
pigs to digest fiber may be increased or the fiber in DDGS may be modified to be more
accessible to fermentation in the pig intestine.
In the third experiment, the ATTD of TDF of Meishan pigs was compared with the
ATTD of TDF in Yorkshire pig that had similar BW than Meishan pigs (Light Yorkshires) or
with Yorkshire pigs that were the same age as the Meishan pigs (Heavy Yorkshires). Data show
that there is an interaction between the groups of pigs and the type of dietary fiber on ATTD of
TDF. The ATTD of TDF is greater in Meishan pigs fed DDGS than in light and in heavy
Yorkshire pigs. These data demonstrate that ATTD of IDF, but not SDF, is affected by the breed
of pigs. Also, ATTD of IDF is influenced by age of pigs. Heavy pigs have a greater capacity to
digest IDF than light pigs. This observation suggests that IDF may be fed to finishing pigs and
sows, but not for nursery and young growing pigs.
The results of Exp. 3, suggest that if dietary fiber from DDGS is the main fiber that will
be fed by pig farmers in the future, then Meishan pigs may be used in farm breeding programs to
increase ATTD of fiber. However, to improve digestibility of fiber by means of breeding
programs may be more time consuming than to modify the type of fiber in DDGS.
There are numerous chemical and physical methods to increase ATTD of TDF. Sorting
through all these methods will require the use of in vivo digestibility procedures. There are
several shortcoming of measuring in vivo ATTD of TDF. Therefore, the last experiment
measured in vitro ATTD fiber in DDGS. The ATTD of NDF and the ATTD of TDF were
correlated (R2 = 0.90) among sources of DDGS. There are advantages of measuring NDF rather
than TDF. Therefore, the in vitro assay was designed to measure in vitro ATTD of NDF. The
results of the last set of experiments suggest, that the 3 step in vitro digestibility assay is very
167
repeatable and that the sample size can be increased up to at least 4 g. These modifications allow
measuring in vitro ATTD of NDF. Fecal inoculum is, however, a better option than using
purified enzymes to study in vitro ATTD of fiber. Future modifications to the 3 step in vitro
digestibility assay are needed be to measure in vitro ATTD of TDF. These modifications may
include measuring in vitro AID and ATTD of TDF, and comparing in vitro data with in vivo
data.
In conclusion, the present work suggests that fiber from DDGS can be fed to swine
without deleterious effects on digestibility of AA. However, digestibility of dietary fiber DDGS
need to be improved to maximize the energy digestibility. The digestibility of fiber can be
measured and improved using a variety of methods.
168
AUTHOR’S BIOGRAPHY
Pedro E. Urriola is a native of Venezuela where he got a Veterinary degree. In September
2004, he came to Minnesota to study MS in Animal Sciences with Dr. Gerald Shurson. Courses
in Minnesota included Statistical Analysis of Experiments and Experimental Design. His MS
Thesis title was ―In vivo digestibility of amino acids and in vitro prediction‖. One manuscript
was published and the second manuscript of the MS thesis is in the process of licensing from the
University of Minnesota to VAST, a company that buys distillers dried grains with solubles for
farmers in the US.
Pedro E. Urriola worked at Cargill Animal Nutrition in Elk River, MN, after completion
of his MS. He was assigned to conduct digestibility experiments, summarize data, and present
reviews of literature to the group at the Innovation Center. He started the PhD program in Illinois
in spring 2007 and took 26 course credits including Microbial Biochemistry and Regulation of
Metabolism. At Illinois has conducted a total of 12 experiments and 4 of these experiments are
included in his dissertation.
Professional affiliations include: American Society of Animal Sciences, International Pig
Veterinarian Society. Honors and awards include: ASAS Midwest Meeting Graduate Student
Competition (1st place) and Gamma Sigma Delta Honor Society.
Pedro E. Urriola married to Maria G. Pieters in 2005. On August 16, 2009 Pedro and
Maria welcomed Abigail P. Urriola.


![Vigencia escalonada de las normas aduaneras 79/PUB_ICDT_AR_PEREZ SARMIENTO Pedro...« Pedro Enrique Sarmiento Pérez» [ 270 ] Revista Instituto Colombiano de Derecho Tributario -](https://img.pdfslide.us/doc/110x75/5e2cb705fb087b690f5325a5/vigencia-escalonada-de-las-normas-aduaneras-79pubicdtarperez-sarmiento-pedro.jpg)