Embed Size (px)
Citation preview
ies
Copyright © 2015 International Market Analysis Research & Consulting (IMARC). All Rights Reserved
imarcwww.imarcgroup.com
Dairy Industry in India : Market Size, Growth, Prices, Segments, Cooperatives, Privates Dairies, Procurement and Distribution
2015 Edition

About IMARC Group
The International Market Analysis Research and Consulting Group is a leading advisor on management strategy andmarket research worldwide. We partner with clients in all sectors and regions to identify their highest-valueopportunities, address their most critical challenges, and transform their businesses.
IMARC’s information products include major market, scientific, economic and technological developments for businessleaders in pharmaceutical, industrial, and high technology organizations. Market forecasts and industry analysis forbiotechnology, advanced materials, pharmaceuticals, food and beverage, travel and tourism, nanotechnology and novelprocessing methods are at the top of the company’s expertise.
IMARC’s tailored approach combines unfathomable insight into the dynamics of companies and markets with closecooperation at all levels of the client organization. This ensures that our clients achieve unmatchable competitiveadvantage, build more proficient organizations, and secure lasting results.
2
Report Description and Highlights
Dairy Industry in India: Market Size, Growth, Prices, Segments, Cooperatives, Private Dairies, Procurement and Distribution
The report which is based on both desk based and multiple waves of qualitative primary researchcontains all the prerequisites for stakeholders who want to enter the Indian Dairy Industry.Aspects such as value trends, volume trends, price trends, key players, trade, procurement,distribution, manufacturing requirements, etc. for milk and various other dairy products havebeen comprehensively analyzed in this report.
Dairy activities have traditionally been integral to India’s rural economy. The country is the world’s largestproducer of dairy products and also their largest consumer. Almost its entire produce is consumed in thedomestic market and the country is neither an importer nor an exporter, except in a marginal sense.
Despite being the world’s largest producer, the dairy sector is by and large in the primitive stage of developmentand modernization. Though India may boast of a 200 million cattle population, the average output of an Indiancow is only one seventh of its American counterpart. Indian breeds of cows are considered inferior in terms ofproductivity. Moreover, the sector is plagued with various other impediments like shortage of fodder, its poorquality, dismal transportation facilities and a poorly developed cold chain infrastructure. As a result, the supplyside lacks in elasticity that is expected of it
3
Report Description and Highlights
On the demand side, the situation is buoyant. With the sustained growth of the Indian economy and aconsequent rise in the purchasing power during the last two decades, more and more people today are able toafford milk and various other dairy products. This trend is expected to continue with the sector experiencing arobust growth in demand in the short and medium run. If the impediments in the way of growth anddevelopment are left unaddressed, India is likely to face a serious supply - demand mismatch and it may graduallyturn into a substantial importer of milk and milk products.
Fortunately, the government and other stakeholders seem to be alive to the situation and efforts to increase milkproduction have been intensified. Transformations in the sector are being induced by factors like newfoundinterest on the part of the organized sector, new markets, easy credit facilities, dairy friendly policies by thegovernment, etc. Dairy farming is now evolving from just an agrarian way of life to a professionally managedindustry – the Indian dairy industry. With these positive signals, there is hope that the sector may eventuallymarch towards another white revolution.
IMARC Group, one of the world’s leading research and advisory firms, has come up with its new report entitled“Dairy Industry in India: 2016-2020”, which is the fourth edition of our highly acclaimed publication. The study isan outcome of an intensive research of the Indian dairy industry that draws upon a comprehensive analysis ofevery major dairy segment in India. The study, which is based both on desk research and four waves ofqualitative primary research, has delved deeply into the following aspects of the Indian dairy market:
4
Report Description and Highlights
Comprehensive situation analysis of the Indian dairy market and its dynamics: Segments covered: Milk, UHT Milk, Flavoured Milk, Curd, Flavoured & Frozen Yoghurts, Probiotic Products, Lassi, Buttermilk, Butter, Ghee, Paneer, Cheese, Khoya, Skimmed Milk Powder, Dairy Whiteners, Ice Cream and Dairy SweetsFocus of the analysis in each segment:Drivers and challenges in each marketHistorical, current and future sales trends Historical, current and future volume trends Historical, current and future price trends Size and analysis of the organized and unorganized marketsStructure of the marketKey players and products available in these markets
Understanding India’s Foreign Trade in the Dairy IndustrySegments covered: All major dairy segmentsFocus of the analysis in each segment:Import volumes Import values Export volumes Export values
5
Report Description and Highlights
Understanding Milk Procurement and Distribution in IndiaFocus of the analysisMilk procurement models of private dairies and cooperativesMilk procurement prices in IndiaMilk distribution models of private dairies and cooperativesChallenges of milk procurement and distribution in India
Understanding the Technical and Financial Requirements for Setting up a Dairy PlantFocus of the analysisCost of setting up a dairy plant in IndiaLoans and financingTechno - economic parametersExpected income and expenditures
6
Report Description and Highlights
Understanding the Government Policies in the Dairy SectorFocus of the analysis:Regulatory frameworkGovernment initiativesDuty structure
Evaluation of all Major Cooperatives and Private Dairies in IndiaFocus of the analysis:Organization OverviewFinancials and Processing CapacityProduct Portfolio
7
Report Description and Highlights
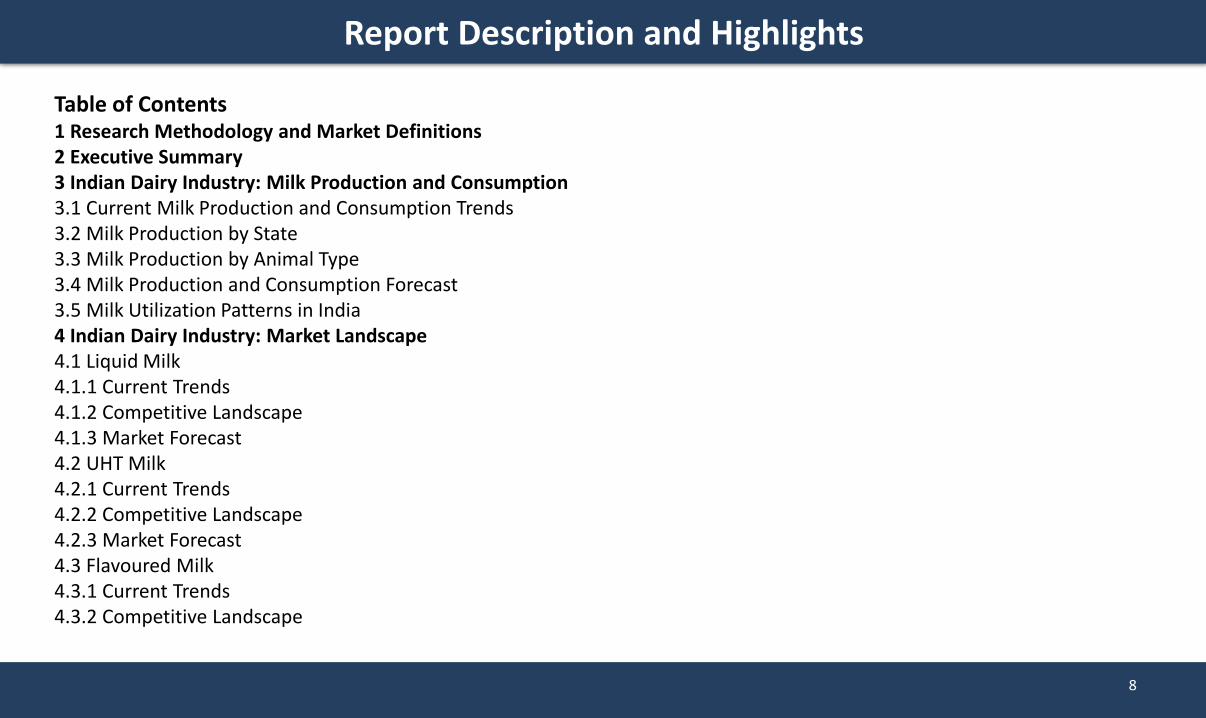
Table of Contents1 Research Methodology and Market Definitions2 Executive Summary3 Indian Dairy Industry: Milk Production and Consumption3.1 Current Milk Production and Consumption Trends3.2 Milk Production by State3.3 Milk Production by Animal Type3.4 Milk Production and Consumption Forecast3.5 Milk Utilization Patterns in India4 Indian Dairy Industry: Market Landscape4.1 Liquid Milk4.1.1 Current Trends4.1.2 Competitive Landscape4.1.3 Market Forecast4.2 UHT Milk4.2.1 Current Trends4.2.2 Competitive Landscape4.2.3 Market Forecast4.3 Flavoured Milk4.3.1 Current Trends4.3.2 Competitive Landscape
8
Report Description and Highlights
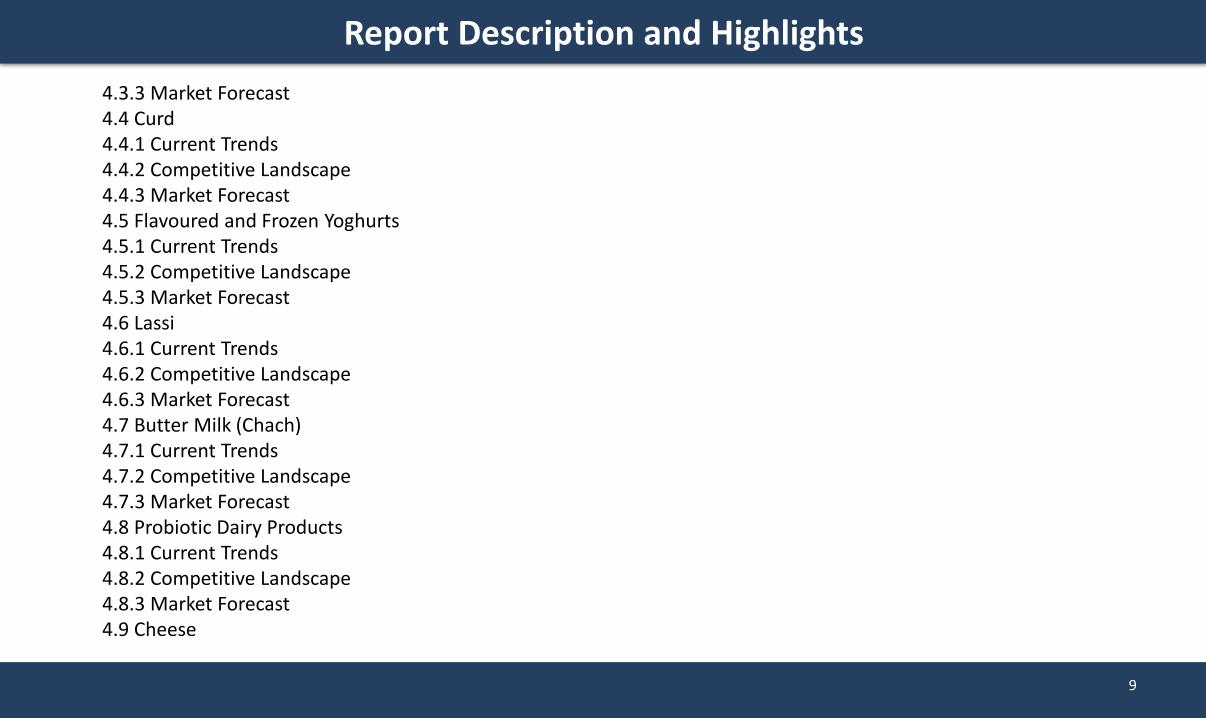
4.3.3 Market Forecast4.4 Curd4.4.1 Current Trends4.4.2 Competitive Landscape4.4.3 Market Forecast4.5 Flavoured and Frozen Yoghurts4.5.1 Current Trends4.5.2 Competitive Landscape4.5.3 Market Forecast4.6 Lassi4.6.1 Current Trends4.6.2 Competitive Landscape4.6.3 Market Forecast4.7 Butter Milk (Chach)4.7.1 Current Trends4.7.2 Competitive Landscape4.7.3 Market Forecast4.8 Probiotic Dairy Products4.8.1 Current Trends4.8.2 Competitive Landscape4.8.3 Market Forecast4.9 Cheese
9
Report Description and Highlights
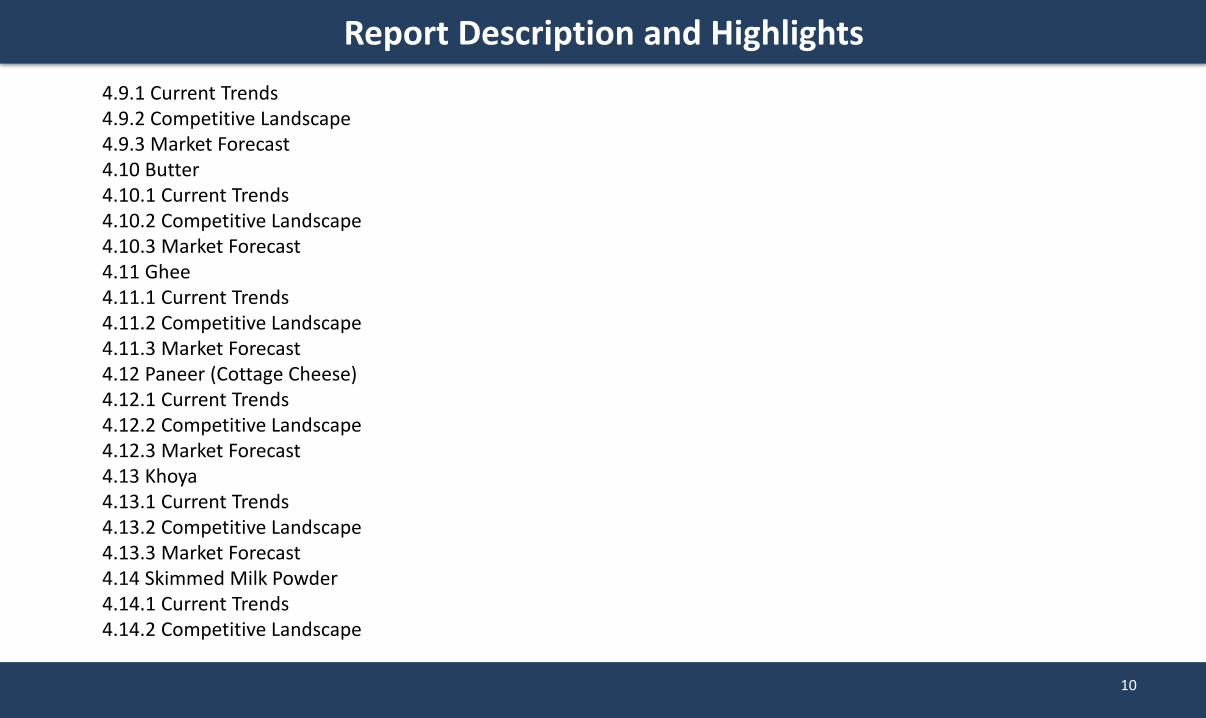
4.9.1 Current Trends4.9.2 Competitive Landscape4.9.3 Market Forecast4.10 Butter4.10.1 Current Trends4.10.2 Competitive Landscape4.10.3 Market Forecast4.11 Ghee4.11.1 Current Trends4.11.2 Competitive Landscape4.11.3 Market Forecast4.12 Paneer (Cottage Cheese)4.12.1 Current Trends4.12.2 Competitive Landscape4.12.3 Market Forecast4.13 Khoya4.13.1 Current Trends4.13.2 Competitive Landscape4.13.3 Market Forecast4.14 Skimmed Milk Powder4.14.1 Current Trends4.14.2 Competitive Landscape
10
Report Description and Highlights
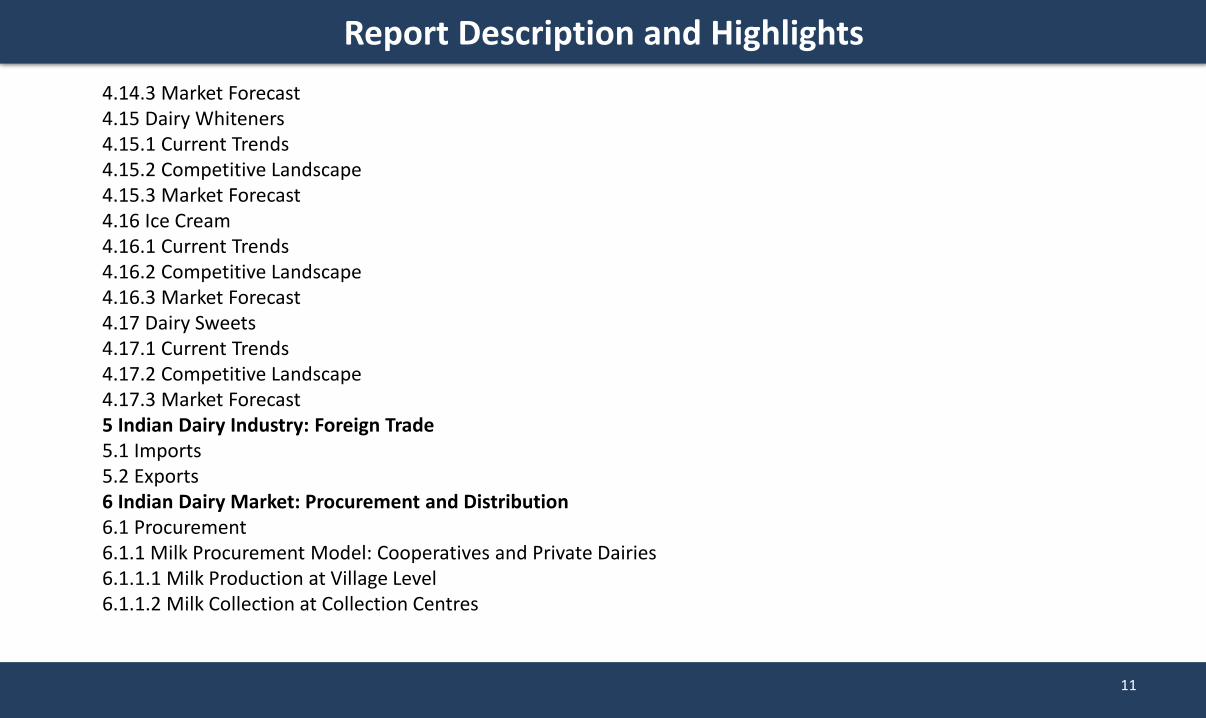
4.14.3 Market Forecast4.15 Dairy Whiteners4.15.1 Current Trends4.15.2 Competitive Landscape4.15.3 Market Forecast4.16 Ice Cream4.16.1 Current Trends4.16.2 Competitive Landscape4.16.3 Market Forecast4.17 Dairy Sweets4.17.1 Current Trends4.17.2 Competitive Landscape4.17.3 Market Forecast5 Indian Dairy Industry: Foreign Trade5.1 Imports5.2 Exports6 Indian Dairy Market: Procurement and Distribution6.1 Procurement6.1.1 Milk Procurement Model: Cooperatives and Private Dairies6.1.1.1 Milk Production at Village Level6.1.1.2 Milk Collection at Collection Centres
11
Report Description and Highlights
6.1.2.3 Insurance6.1.2.4 Loans6.1.2.5 Health Checkups and Medical Facilities6.1.2.6 Subsidized Cattle Feed and Seeds6.1.2.7 Other Incentives6.1.3 Procurement Prices of Milk in India6.1.4 Challenges of Milk Procurement in India6.2 Distribution6.2.1 Milk and Milk Products Distribution Model: Cooperatives and Private Dairies6.2.1.1 Manufacturing Plant: Product Processing, Packaging and Delivery6.2.1.2 Distributors6.2.1.3 Retailers6.2.1.4 Retail Parlors6.2.1.5 Door Delivery Systems6.2.1.6 Cash and Carry6.2.2 Selling Prices of Milk in India6.2.3 Distributor and Retailer Margins6.2.4 Challenges of Milk Distribution in India7 Setting up a Dairy Plant7.1 Land, Location and Site Development7.2 Infrastructure Requirements
12

Report Description and Highlights
7.3 Manpower Requirements7.4 Loans and Financing7.5 Plant Machinery7.6 Other Capital Investments7.7 Techno-Economic Parameters7.8 Income Projections7.9 Expenditure Projections7.10 Financial Analysis8 Indian Dairy Industry: Government Regulations8.1 Regulatory Framework8.2 Government Initiatives8.3 Trade Policy8.4 Strategies for Market Entry9 Indian Dairy Industry: Key Drivers and Challenges9.1 Drivers9.2 Challenges10 Indian Dairy Industry: Key Player Profiles10.1 Dairy Cooperatives10.1.1 Gujarat Co-operative Milk Marketing Federation Ltd10.1.1.1 Company Overview10.1.1.2 Financials and Milk Processing Capacity
13
Report Description and Highlights
10.1.2.1 Company Overview10.1.2.2 Financials and Milk Processing Capacity10.1.2.3 Product Portfolio10.1.3 Karnataka Co-operative Milk Producers Federation Limited10.1.3.1 Company Overview10.1.3.2 Financials and Milk Processing Capacity10.1.3.3 Product Portfolio10.1.4 Rajasthan Cooperative Dairy Federation Ltd (RCDF)10.1.4.1 Company Overview10.1.4.2 Financials and Milk Processing Capacity10.1.4.3 Product Portfolio10.1.5 Tamilnadu Cooperative Milk Producers Federation Ltd (TCMPF)10.1.5.1 Company Overview10.1.5.2 Financials and Milk Processing Capacity10.1.5.3 Product Portfolio10.1.6 Punjab State Cooperative Milk Producers Federation Ltd (MILKFED)10.1.6.1 Company overview10.1.6.2 Financials and Milk Processing Capacity10.1.6.3 Product Portfolio10.1.7 Orissa State Cooperative Milk Producers Federation Ltd (OMFED)10.1.7.1 Company Overview
14
Report Description and Highlights
10.1.7.2 Financials and Milk Processing Capacity10.1.7.3 Product Portfolio10.1.8 Maharashtra Rajya Sahakari Dudh Mahasangh Maraydit (Mahasangh)10.1.8.1 Company Overview10.1.8.2 Financials and Milk Processing Capacity10.1.8.3 Product Portfolio10.1.9 Bihar State Co-operative Milk Producers Federation Ltd (COMFED)10.1.9.1 Company Overview10.1.9.2 Financials and Milk Processing Capacity10.1.9.3 Product Portfolio10.1.10 Haryana Dairy Development Cooperative Federation Ltd. (HDDCF)10.1.10.1 Company Overview10.1.10.2 Financials and Milk Processing Capacity10.1.10.3 Product Portfolio10.1.11 Madhya Pradesh State Cooperative Dairy Federation Ltd (MPCDF)10.1.11.1 Company Overview10.1.11.2 Financials and Milk Processing Capacity10.1.11.3 Product Portfolio10.1.12 Pradeshik Cooperative Dairy Federation Ltd (PCDF)10.1.12.1 Company Overview10.1.12.2 Financials and Milk Processing Capacity10.1.12.3 Product Portfolio
15
Report Description and Highlights
10.2 Private Dairies10.2.1 Nestle India Limited10.2.1.1 Company Overview10.2.1.2 Financials and Milk Processing Capacity10.2.1.3 Product Portfolio10.2.2 Hatsun Agro Product Limited10.2.2.1 Company Overview10.2.2.2 Financials and Milk Processing Capacity10.2.2.3 Product Portfolio10.2.3 Tirumala Milk Products Pvt Ltd10.2.3.1 Company overview10.2.3.2 Financials and Milk Processing Capacity10.2.3.3 Product Portfolio10.2.4 Milk Food Limited10.2.4.1 Company Overview10.2.4.2 Financials and Milk Processing Capacity10.2.4.3 Product Portfolio10.2.5 Heritage Foods Limited10.2.5.1 Company overview10.2.5.2 Financials and Milk Processing Capacity10.2.5.3 Product Portfolio
16
Report Description and Highlights
10.2.6 VRS Foods Limited10.2.6.1 Company Overview10.2.6.2 Financials and Milk Processing Capacity10.2.6.3 Product Portfolio10.2.7 Vadilal Industries Limited10.2.7.1 Company Overview10.2.7.2 Financials and Milk Processing Capacity10.2.7.3 Product Portfolio10.2.8 Sterling Agro Industries Ltd.10.2.8.1 Company Overview10.2.8.2 Financials and Milk Processing Capacity10.2.8.3 Product Portfolio10.2.9 Bhole Baba Dairy Industries10.2.9.1 Company Overview10.2.9.2 Financials and Milk Processing Capacity10.2.9.3 Product Portfolio10.2.10 Kwality Ltd.10.2.10.1 Company Overview10.2.10.2 Financials and Milk Processing Capacity10.2.10.3 Product Portfolio
17
Report Description and Highlights
List of Figures
Figure 3 1: India - Total Milk Production (in Million Metric Tons), 2010-11 – 2014-15Figure 3 2: India - Total Milk Consumption (in Million Metric Tons), 2010-11 – 2014-15Figure 3 3: India - Total Milk Production Forecast (in Million Metric Tons), 2014-15 - 2020-21Figure 3 4: India - Total Milk Consumption Forecast (in Million Metric Tons), 2014-15 - 2020-21Figure 3 5: India - Utilization Patterns of Milk and Milk Products, (in %), 2014Figure 3 6: India - Milk Production Volume Breakup by MarketabilityFigure 4 1: India - Dairy Market (in Billion INR), 2010 - 2014Figure 4 2: India - Breakup of Organized and Unorganized Dairy Market (in %), 2010 - 2014Figure 4 3: India - Dairy Market Forecast (in Billion INR), 2015 - 2020Figure 4 4: India - Breakup of Organized and Unorganized Dairy Market (in %), 2015 - 2020Figure 4 5: India - Liquid Milk Market - Sales Value (in Billion INR), 2007 - 2014Figure 4 6: India - Liquid Milk Market - Sales Volume (in Billion Litres), 2007 - 2014Figure 4 7: India - Liquid Milk Market - Price Trends (in INR per Litre), 2007 - 2014Figure 4 8: India - Liquid Milk Market - Breakup of Organized and Unorganized Sales (in %), 2007 - 2014Figure 4 9: India - Liquid Milk Market Forecast - Sales Value (in Billion INR), 2015 - 2020Figure 4 10: India - Liquid Milk Market Forecast - Sales Volume (in Billion Litres), 2015 - 2020Figure 4 11: India - Liquid Milk Market Forecast - Price Trends (in INR per Litre), 2015 - 2020Figure 4 12: India - Liquid Milk Market Forecast - Breakup of Organized and Unorganized Sales (in %), 2015 - 2020Figure 4 13: India - UHT Milk Market - Sales Volume (in Million Litres), 2009 - 2014
18
Report Description and Highlights
Figure 4 14: India - UHT Milk Market - Sales Value (in Billion INR), 2009 - 2014Figure 4 15: India - UHT Milk Market - Price Trends (in INR per Litre), 2009 - 2014Figure 4 16: India - UHT Milk Market Forecast - Sales Volume (in Million Litres), 2015 - 2020Figure 4 17: India - UHT Milk Market Forecast - Sales Value (in Billion INR), 2015 - 2020Figure 4 18: India - UHT Milk Market Forecast - Price Trends (in INR per Litre), 2015 - 2020Figure 4 19: India - Flavoured Milk Market - Consumption Volume (in Million Litres), 2007 - 2014Figure 4 20: India - Flavoured Milk Market - Consumption Value (in Billion INR), 2007 - 2014Figure 4 21: India - Flavoured Milk Market - Price Trends (in INR per Litre), 2007 - 2014Figure 4 22: India - Flavoured Milk Market Forecast - Consumption Volume (in Million Litres), 2015 - 2020Figure 4 23: India - Flavoured Milk Market Forecast - Consumption Value (in Billion INR), 2015 - 2020Figure 4 24: India - Flavoured Milk Market Forecast - Price Trends (in INR per Litre), 2015 - 2020Figure 4 25: India - Curd Market - Sales Value (in Billion INR), 2007 - 2014Figure 4 26: India - Curd Market - Sales Volume (in 000’ Metric Tons), 2007 - 2014Figure 4 27: India - Curd Market - Price Trends (in INR per Kilogram), 2007 - 2014Figure 4 28: India - Curd Market - Breakup of Organized and Unorganized Sales (in %), 2007 – 2014Figure 4 29: India - Curd Market Forecast - Sales Value (in Billion INR), 2015 - 2020Figure 4 30: India - Curd Market Forecast - Sales Volume (in 000’ Metric Tons), 2015 - 2020Figure 4 31: India - Curd Market Forecast - Price Trends (in INR per Kilogram), 2015 - 2020Figure 4 32: India - Curd Market Forecast - Breakup of Organized and Unorganized Sales (in %), 2015 - 2020Figure 4 33: India - Flavoured and Frozen Yoghurts Market - Sales Value (in Billion INR), 2011 - 2014Figure 4 34: India - Flavoured and Frozen Yoghurts Market - Sales Volume (in 000’ Metric Tons), 2011 - 2014
19
Report Description and Highlights
Figure 4 35: India - Flavoured and Frozen Yoghurts Market - Price Trends (in INR per Kilogram), 2011 - 2014Figure 4 36: India - Flavoured and Frozen Yoghurts Market Forecast - Sales Value (in Billion INR), 2015 - 2020Figure 4 37: India - Flavoured and Frozen Yoghurts Market Forecast - Sales Volume (in 000’ Metric Tons), 2015 - 2020Figure 4 38: India - Flavoured and Frozen Yoghurts Market - Price Trends (in INR per Litre), 2015 - 2020Figure 4 39: India - Lassi Market - Sales Value (in Billion INR), 2007 - 2014Figure 4 40: India - Lassi Market - Sales Volume (in Million Litres), 2007 - 2014Figure 4 41: India - Lassi Market - Price Trends (in INR per Litre), 2007 - 2014Figure 4 42: India - Lassi Market Forecast - Sales Value (in Billion INR), 2015 - 2020Figure 4 43: India - Lassi Market Forecast - Sales Volume (in Million Litres), 2015 - 2020Figure 4 44: India - Lassi Market - Price Trends (in INR per Litre), 2015 - 2020Figure 4 45: India - Butter Milk Market - Sales Value (in Billion INR), 2007 - 2014Figure 4 46: India - Butter Milk Market - Sales Volume (in Million Litres), 2007 - 2014Figure 4 47: India - Butter Milk Market - Price Trends (in INR per Litre), 2007 - 2014Figure 4 48: India - Butter Milk Market Forecast - Sales Value (in Billion INR), 2015 - 2020Figure 4 49: India - Butter Milk Market Forecast - Sales Volume (in Million Litres), 2015 - 2020Figure 4 50: India - Butter Milk Market - Price Trends (in INR per Litre), 2015 - 2020Figure 4 51: India - Probiotic Products Market - Sales Value (in Billion INR), 2010 - 2014Figure 4 52: India - Probiotic Products Market - Sales Volume (in Million Litres), 2010 - 2014Figure 4 53: India - Probiotic Products Market - Price Trends (in INR per Litre), 2010 - 2014Figure 4 54: India - Probiotic Products Market - Breakup by Category (in %)
20
Report Description and Highlights
Figure 4 55: India - Probiotic Products Market Forecast - Sales Value (in Billion INR), 2015 - 2020Figure 4 56: India - Probiotic Products Market Forecast - Sales Volume (in Million Liters), 2015 - 2020Figure 4 57: India - Probiotic Products Market Forecast - Price Trends (in INR per Litre), 2015 - 2020Figure 4 58: India - Cheese Market - Sales Value (in Billion INR), 2007 - 2014Figure 4 59: India - Cheese Market - Sales Volume (in 000’ Metric Tons), 2007 - 2014Figure 4 60: India - Cheese Market - Price Trends (in INR per Kilogram), 2007 - 2014Figure 4 61: India - Cheese Market - Value Share of Key Brands (in %)Figure 4 62: India - Cheese Market Forecast - Sales Value (in Billion INR), 2015 - 2020Figure 4 63: India - Cheese Market Forecast - Sales Volume (in 000’ Metric Tons), 2015 - 2020Figure 4 64: India - Cheese Market Forecast - Price Trends (in INR per Kilogram), 2015 - 2020Figure 4 65: India - Butter Market - Sales Value (in Billion INR), 2007 - 2014Figure 4 66: India - Butter Market - Sales Volume (in 000’ Metric Tons), 2007 - 2014Figure 4 67: India - Butter Market - Breakup of Organized and Unorganized Sales (in %), 2007 - 2014Figure 4 68: India - Butter Market - Price Trends (in INR per Kilogram), 2007 - 2014Figure 4 69: India - Butter Market Forecast - Sales Value (in Billion INR), 2015 - 2020Figure 4 70: India - Butter Market Forecast - Sales Volume (in 000’ Metric Tons), 2015 - 2020Figure 4 71: India - Butter Market Forecast - Breakup of Organized and Unorganized Sales (in %), 2015 - 2020Figure 4 72: India - Butter Market Forecast - Price Trends (in INR per Kilogram), 2015 - 2020Figure 4 73: India - Ghee Market - Sales Value (in Billion INR), 2007 - 2014Figure 4 74: India - Ghee Market - Sales Volume (in 000’ Metric Tons), 2007 - 2014
21
Report Description and Highlights
Figure 4 75: India - Ghee Market - Breakup of Organized and Unorganized Sales (in %), 2007 - 2014Figure 4 76: India - Ghee Market - Price Trends (in INR per Kilogram), 2007 - 2014Figure 4 77: India - Ghee Market Forecast - Sales Value (in Billion INR), 2015 - 2020Figure 4 78: India - Ghee Market Forecast - Sales Volume (in 000’ Metric Tons), 2015 - 2020Figure 4 79: India - Ghee Market Forecast - Breakup of Organized & Unorganized Sales (in %), 2015 - 2020Figure 4 80: India - Ghee Market Forecast - Price Trends (in INR per Kilogram), 2015 - 2020Figure 4 81: India - Paneer Market - Sales Value (in Billion INR), 2007 - 2014Figure 4 82: India - Paneer Market - Sales Volume (in 000’ Metric Tons), 2007 - 2014Figure 4 83: India - Paneer Market - Breakup of Organized and Unorganized Sales (in %), 2007 - 2014Figure 4 84: India - Paneer Market - Price Trends (in INR per Kilogram), 2007 - 2014Figure 4 85: India - Paneer Market Forecast - Sales Value (in Billion INR), 2015 - 2020Figure 4 86: India - Paneer Market Forecast - Sales Volume (in 000’ Metric Tons), 2015 - 2020Figure 4 87: India - Paneer Market Forecast - Breakup of Organized and Unorganized Sales (in %), 2015 - 2020Figure 4 88: India - Paneer Market Forecast - Price Trends (in INR per Kilogram), 2015 - 2020Figure 4 89: India - Khoya Market - Sales Value (in Billion INR), 2007 - 2014Figure 4 90: India - Khoya Market - Sales Volume (in 000’ Metric Tons), 2007 - 2014Figure 4 91: India - Khoya Market - Price Trends (in INR per Kilogram), 2007 - 2014Figure 4 92: India - Khoya Market Forecast - Sales Value (in Billion INR), 2015 - 2020Figure 4 93: India - Khoya Market Forecast - Sales Volume (in 000’ Metric Tons), 2015 - 2020Figure 4 94: India - Khoya Market Forecast - Price Trends (in INR per Kilogram), 2015 - 2020
22
Report Description and Highlights
Figure 4 95: India - Skimmed Milk Powder Market - Consumption Volume (in 000’ Metric Tons), 2007 - 2014Figure 4 96: India - Skimmed Milk Powder Market - Consumption Value (in Billion INR), 2007 - 2014Figure 4 97: India - Skimmed Milk Powder Market - Price Trends (in INR per Kilogram), 2007 - 2014Figure 4 98: India - Skimmed Milk Powder Market - Value Share of Various Segments (in %)Figure 4 99: India - Skimmed Milk Powder Market Forecast - Consumption Volume (in 000’ Metric Tons), 2015 - 2020Figure 4 100: India - Skimmed Milk Powder Market Forecast - Consumption Value (in Billion INR), 2015 - 2020Figure 4 101: India - Skimmed Milk Powder Market Forecast - Price Trends (in INR per Kilogram), 2015 - 2020Figure 4 102: India - Dairy Whitener Market - Sales Volume (in 000’ Metric Tons), 2007 - 2014Figure 4 103: India - Dairy Whitener Market - Sales Value (in Billion INR), 2007 - 2014Figure 4 104: India - Dairy Whitener Market - Price Trends (in INR per Kilogram), 2007 - 2014Figure 4 105: India - Dairy Whitener Market - Value Share of Key Brands (in %)Figure 4 106: India - Dairy Whitener Market Forecast - Sales Volume (in 000’ Metric Tons), 2015 - 2020Figure 4 107: India - Dairy Whitener Market Forecast - Sales Value (in Billion INR), 2015 - 2020Figure 4 108: India - Dairy Whitener Market Forecast - Price Trends (in INR per Kilogram), 2015 - 2020Figure 4 109: India - Ice Cream Market - Sales Value (in Billion INR), 2007 - 2014Figure 4 110: India - Ice Cream Market - Sales Volume (in Million Litres), 2007 - 2014Figure 4 111: India - Ice Cream Market - Breakup of Organized and Unorganized Sales (in %), 2007 - 2014Figure 4 112: India - Ice Cream Market - Price Trends (in INR per Litre), 2007 - 2014Figure 4 113: India - Ice Cream Market - Value Share of Key Players (in %)Figure 4 114: India - Ice Cream Market Forecast - Sales Value (in Billion INR), 2015 - 2020
23
Report Description and Highlights
Figure 4 115: India - Ice Cream Market - Sales Volume (in Million Litres), 2015 - 2020Figure 4 116: India - Ice Cream Market Forecast - Breakup of Organized and Unorganized Sales (in %), 2015 - 2020Figure 4 117: India - Ice Cream Market - Price Trends (in INR per Litre), 2015 - 2020Figure 4 118: India - Dairy Sweets Market - Sales Value (in Billion INR), 2007 - 2014Figure 4 119: India - Dairy Sweets Market - Sales Volume (in Million Litres), 2007 - 2014Figure 4 120: India - Dairy Sweets Market - Breakup of Organized and Unorganized Sales (in %), 2007 - 2014Figure 4 121: India - Dairy Sweets Market - Price Trends (in INR per Litre), 2007 - 2014Figure 4 122: India - Dairy Sweets Market Forecast - Sales Value (in Billion INR), 2015 - 2020Figure 4 123: India - Dairy Sweets Market - Sales Volume (in Million Litres), 2015 - 2020Figure 4 124: India - Dairy Sweets Market Forecast - Breakup of Organized and Unorganized Sales (in %), 2015 - 2020Figure 4 125: India - Dairy Sweets Market - Price Trends (in INR per Litre), 2015 - 2020Figure 6 1: India - Milk Procurement Model - AP CooperativeFigure 6 2: India - Milk Procurement Model - Creamline DairyFigure 6 3: India - Milk Distribution Model of CooperativesFigure 6 4: India - Milk Distribution Model of Private Dairy CompaniesFigure 9 1: India - Population (in Billion), 2012 and 2019Figure 9 2: Rising Incomes in India, 2005 and 2013Figure 9 3: India - Dairy Market - Value Penetration of the Organized Sector in Key Dairy Categories, (In %), 2012 and 2019Figure 10 1: GCMMF – Annual Turnover (in INR Billion), 2006 - 2013Figure 10 2: Mother Dairy – Annual Turnover (in INR Billion), 2010 - 2013
24
Report Description and Highlights
Figure 10 3: KMF – Annual Turnover (in INR Billion), 2011 - 2013Figure 10 4: RCDF – Annual Turnover (in INR Billion), 2006 - 2011Figure 10 5: TCMPF – Annual Turnover (in INR Billion), 2010 - 2013Figure 10 6: MILKFED – Annual Turnover (in INR Billion), 2006 - 2013Figure 10 7: OMFED – Annual Turnover (in INR Billion), 2006 - 2013Figure 10 8: MRSDMM – Annual Turnover (in INR Billion), 2007 and 2013Figure 10 9: COMFED – Annual Turnover (in INR Billion), 2006 - 2012Figure 10 10: HDDCF – Annual Turnover (in INR Billion), 2006 - 2012Figure 10 11: MPCDF – Annual Turnover (in INR Billion), 2007 - 2013
List of Tables
Table 1 1: India - Dairy Market DefinitionTable 2 1: India - Executive Summary - Dairy Market, 2014 and 2020Table 3 1: India - Milk Production - Volume Breakup by State (in 000’ Metric Tons), 2007-08 - 2013-14Table 3 2: India - Milk Production - Volume Breakup by Animal Type (in 000’ Metric Tons), 2007-08 – 2013-14Table 4 1: India - Dairy Market, 2014 and 2020Table 4 2: India - Liquid Milk Market - Key Players and BrandsTable 4 3: India - UHT Milk Market - Key Players and BrandsTable 4 4: India - Flavoured Milk Market - Key Players and BrandsTable 4 5: India - Curd Market - Key Players and Brands
25
Report Description and Highlights
Table 4 6: India - Flavoured and Frozen Yoghurts Market - Key Players and BrandsTable 4 7: India - Lassi Market - Key Players and BrandsTable 4 8 India - Butter Milk Market - Key Players and BrandsTable 4 9: India - Probiotic Products Market - Key Players and BrandsTable 4 10: India - Cheese Market - Key Players and BrandsTable 4 11: India - Butter Market - Key Players and BrandsTable 4 12: India - Ghee Market - Key Players and BrandsTable 4 13: India - Paneer Market - Key Players and BrandsTable 4 14: India - Ice Cream Market - Sales by Region (in %)Table 4 15: India - Dairy Sweets Market - Key Players and BrandsTable 5 1: India - Dairy Market - Import Value Breakup by Product (in INR Million), 2009-10 - 2014-15Table 5 2: India - Dairy Market - Import Volume Breakup by Product (in Tons), 2009-10 - 2014-15Table 5 3: India - Dairy Market - Export Value Breakup by Product (in INR Million), 2009-10 - 2014-15Table 5 4: India - Dairy Market - Export Volume Breakup by Product (in Tons), 2009-10 - 2014-15Table 6 1: Andhra Pradesh - Procurement Prices of Milk Private Dairies Vs. Cooperatives (in INR/Litre), 2013Table 6 2: Andhra Pradesh - Selling Prices of Milk by Different Manufacturers, (In INR/Litre), 2013Table 6 3: Tamil Nadu - Selling Prices of Milk by Different Manufacturers, (In INR/Litre), 2013Table 6 4: Karnataka - Selling Prices of Milk by Different Manufacturers, (In INR/Litre), 2013Table 6 5: Karnataka - Distributer’s Margins in Bangalore (in INR/Litre and %), 2013Table 6 6: Andhra Pradesh - Distributer’s Margins in Hyderabad (in %), 2013
26
Report Description and Highlights
Table 7 1: India - Dairy Processing Plant - Costs Related to Land and Site Development (in INR)Table 7 2: India - Dairy Processing Plant - Costs Related to Civil Works (in INR)Table 7 3: India - Dairy Processing Plant - Costs Related to Salaries and Wages (in INR)Table 7 4: India - Dairy Processing Plant - Components Funded Under the Dairy Venture Capital FundTable 7 5: India - Dairy Processing Plant - Costs Related to Plant & Machinery (in INR)Table 7 6: India - Dairy Processing Plant - Costs Related to Other Capital Investments (in INR)Table 7 7: India - Dairy Processing Plant - Techno-Economic Parameters (in INR)Table 7 8: India - Dairy Processing Plant - Income Projections (in INR)Table 7 9: India - Dairy Processing Plant - Expenditure Projections (in INR)Table 7 10: India - Dairy Processing Plant - Cash Flow Analysis Without Considering the Income Tax LiabilityTable 7 11: India - Dairy Processing Plant - Cash Flow Analysis on Considering the Income Tax LiabilityTable 8 1: India - Dairy Market, Duties on Various Dairy ProductsTable 10 1: GCMMF: Product PortfolioTable 10 2: Mother Dairy: Product PortfolioTable 10 3: KMF Milk Unions - Milk Procurement, 2013Table 10 4: KMF - Product PortfolioTable 10 5: RCDF Milk Unions - Milk Procurement, 2013Table 10 6: RCDF - Product PortfolioTable 10 7: TCMPF Dairy Plants - Milk Processing Capacity, 2013Table 10 8: TCMPF Milk Unions - Milk Procurement, 2013Table 10 9: TCMPF - Product PortfolioTable 10 10: MILKFED - Product Portfolio
27
Report Description and Highlights
Table 10 11: OMFED - Dairy Processing Plant Capacities, 2013Table 10 12: OMFED - Product PortfolioTable 10 13: MRSDMM - Product PortfolioTable 10 14: COMFED Milk Unions - Milk Handling Capacity, 2013Table 10 15: COMFED - Product PortfolioTable 10 16: HDDCF - Product PortfolioTable 10 17: MPCDF Milk Unions - Milk Procurement, 2013Table 10 18: MPCDF - Product PortfolioTable 10 19: PCDF Milk Unions - Milk Processing Capacity, 2013Table 10 20: PCDF - Product PortfolioTable 10 21: Nestle - Product PortfolioFigure 10 10: HDDCF – Annual Turnover (in INR Billion), 2006 - 2012Table 10 22: Hatsun - Product PortfolioTable 10 23: Tirumala - Product PortfolioTable 10 24: Milk Food - Product PortfolioTable 10 25: Heritage Foods India Limited - Product PortfolioTable 10 26: VRS Food Limited - Product PortfolioTable 10 27: Vadilal Industries Limited - Product PortfolioTable 10 28: Sterling Agro Industries Ltd - Product PortfolioTable 10 29: Bhole Baba Dairy Industries - Product PortfolioTable 10 30: Kwality Ltd - Product Portfolio
28
To buy the complete report or to get a free sample, please contact:
IMARC Group Asia:
Email: [email protected]: +91-120-415-5099
IMARC Group North America:
Email: [email protected]: +1-631-791-1145
IMARC Group Europe, Middle East & Africa:
Email: [email protected]: +44-702-409-7331
To know more please visit: http://www.imarcgroup.com/dairy-industry-in-india/
Contacts
7
© 2014 IMARC All Rights Reserved
This Publication and all it’s contents unless otherwise mentioned are copyrighted in the name ofInternational Market Analysis Research and Consulting (IMARC). No part of this publication may bereproduced, repackaged, redistributed or resold in whole or in any part. The publication may also not beused in any form or by and means graphic electronic or mechanical, including photocopying, recording,taping or by information storage or retrieval, or by any other form, without the express consent ofInternational Market Analysis Research and Consulting (IMARC).
Disclaimer: All contents and data of this publication, including forecasts, data analysis and opinion have beenbased on information and sources believed to be accurate and reliable at the time of publishing.International Market Analysis Research and Consulting makes no representation of warranty of any kind as tothe accuracy or completeness of any Information provided. IMARC accepts no liability whatsoever for anyloss or damage resulting from opinion, errors or inaccuracies if any found this publication.
IMARC, IMARC Group and Global Therapy Insight Series are registered trademarks of International MarketAnalysis Research and Consulting. All other trademarks used in this publication are registered trademarks oftheir respective companies.
30