Embed Size (px)
Citation preview

Corporate PresentationNovember 2015
Cautionary statements
2
CAUTIONARY NOTE REGARDING FORWARD-LOOKING STATEMENTS
Certain information contained in this presentation, including any information relating to New Gold’s future financial or operating performance are “forward looking”. All statements in this presentation, other than
statements of historical fact, which address events, results, outcomes or developments that New Gold expects to occur are “forward-looking statements”. Forward-looking statements are statements that are not
historical facts and are generally, but not always, identified by the use of forward-looking terminology such as “plans”, “expects”, “is expected”, “budget”, “scheduled”, “targeted”, “estimates”, “forecasts”, “intends”,
“anticipates”, “projects”, “potential”, “believes” or variations of such words and phrases or statements that certain actions, events or results “may”, “could”, “would”, “should”, “might” or “will be taken”, “occur” or “be
achieved” or the negative connotation of such terms. Forward-looking statements in this presentation include, among others, the statements under the headings “Consolidated Year-To-Date Operational Results
and 2015 Guidance” and “Financial Update” and statements with respect to: guidance for production; total cash costs and all-in sustaining costs, and the factors contributing to those expected results, as well as
expected capital expenditures; mineral reserve and mineral resource estimates; grades expected to be mined at the Company’s operations; the expected production, costs, economics and operating parameters of
the Rainy River project; planned activities for 2015 and beyond at the Company’s operations and projects, as well as planned exploration activities; expected production for the Blackwater project; targeting timing
for commissioning and full production (and other activities) related to Rainy River and the sequencing of Blackwater; statements with respect to the ability of the parties to satisfy the conditions of and complete the
sale of New Gold’s interest in the El Morro property to Goldcorp Inc. (“El Morro sale”); the ability of Teck Resources Limited and Goldcorp Inc. to satisfy the conditions of and complete the El Morro – Relincho joint
venture (“Project Corridor”); and statements with respect to the payment of the remaining $75 million from Royal Gold.
All forward-looking statements in this presentation are based on the opinions and estimates of management as of the date such statements are made and are subject to important risk factors and uncertainties,
many of which are beyond New Gold’s ability to control or predict. Certain material assumptions regarding such forward-looking statements are discussed in this presentation, New Gold’s annual and quarterly
management’s discussion and analysis (“MD&A”), its Annual Information Form and its Technical Reports filed at www.sedar.com. In addition to, and subject to, such assumptions discussed in more detail
elsewhere, the forward-looking statements in this presentation are also subject to the following assumptions: (1) there being no significant disruptions affecting New Gold’s operations; (2) political and legal
developments in jurisdictions where New Gold operates, or may in the future operate, being consistent with New Gold’s current expectations; (3) the accuracy of New Gold’s current mineral reserve and resource
estimates; (4) the exchange rate between the Canadian dollar, Australian dollar, Mexican peso and U.S. dollar being approximately consistent with current levels; (5) prices for diesel, natural gas, fuel oil, electricity
and other key supplies being approximately consistent with current levels; (6) equipment, labour and materials costs increasing on a basis consistent with New Gold’s current expectations; (7) arrangements with
First Nations and other Aboriginal groups in respect of Rainy River and Blackwater being consistent with New Gold’s current expectations; (8) all required permits, licenses and authorizations being obtained from
the relevant governments and other relevant stakeholders within the expected timelines; (9) the results of the feasibility studies for the Rainy River and Blackwater projects being realized; (10) commodity prices
and exchange rates being consistent with those estimated for purposes of 2015 guidance; (11) conditions of the El Morro sale, and the conditions to closing of Project Corridor, being satisfied in a timely manner;
and (12) conditions to the payment of the remaining $75 million from Royal Gold being satisfied mid-2016.
Forward-looking statements are necessarily based on estimates and assumptions that are inherently subject to known and unknown risks, uncertainties and other factors that may cause actual results, level of
activity, performance or achievements to be materially different from those expressed or implied by such forward-looking statements. Such factors include, without limitation: significant capital requirements and the
availability and management of capital resources; additional funding requirements; price volatility in the spot and forward markets for metals and other commodities; fluctuations in the international currency
markets and in the rates of exchange of the currencies of Canada, the United States, Australia, Mexico and Chile; discrepancies between actual and estimated production, between actual and estimated reserves
and resources and between actual and estimated metallurgical recoveries; changes in national and local government legislation in Canada, the United States, Australia, Mexico and Chile or any other country in
which New Gold currently or may in the future carry on business; taxation; controls, regulations and political or economic developments in the countries in which New Gold does or may carry on business; the
speculative nature of mineral exploration and development, including the risks of obtaining and maintaining the validity and enforceability of the necessary licenses and permits and complying with the permitting
requirements of each jurisdiction in which New Gold operates, including, but not limited to: in Canada, obtaining the necessary permits for the Rainy River and Blackwater projects; delay or failure to receive
regulatory approvals or the failure to satisfy other closing conditions to the El Morro sale or Project Corridor; in Mexico, where Cerro San Pedro has a history of ongoing legal challenges related to our
environmental authorization; and in Chile, where certain activities at El Morro have been delayed due to litigation relating to its environmental permit; the lack of certainty with respect to foreign legal systems, which
may not be immune from the influence of political pressure, corruption or other factors that are inconsistent with the rule of law; the uncertainties inherent to current and future legal challenges New Gold is or may
become a party to; diminishing quantities or grades of reserves and resources; competition; loss of key employees; rising costs of labour, supplies, fuel and equipment; actual results of current exploration or
reclamation activities; uncertainties inherent to mining economic studies including the feasibility studies for Rainy River and Blackwater; the uncertainty with respect to prevailing market conditions necessary for a
positive development decision at Blackwater; changes in project parameters as plans continue to be refined; accidents; labour disputes; defective title to mineral claims or property or contests over claims to
mineral properties; unexpected delays and costs inherent to consulting and accommodating rights of First Nations and other Aboriginal groups; risks, uncertainties and unanticipated delays associated with
obtaining and maintaining necessary licenses, permits and authorizations and complying with permitting requirements, including those associated with the environmental assessment process for Blackwater. In
addition, there are risks and hazards associated with the business of mineral exploration, development and mining, including environmental events and hazards, industrial accidents, unusual or unexpected
formations, pressures, cave-ins, flooding and gold bullion losses (and the risk of inadequate insurance or inability to obtain insurance to cover these risks) as well as “Risk Factors” included in New Gold’s
disclosure documents filed on and available at www.sedar.com.
Forward-looking statements are not guarantees of future performance, and actual results and future events could materially differ from those anticipated in such statements. All of the forward-looking statements
contained in this presentation are qualified by these cautionary statements. New Gold expressly disclaims any intention or obligation to update or revise any forward-looking statements whether as a result of new
information, events or otherwise, except in accordance with applicable securities laws.
The footnotes, endnotes and appendices to this presentation contain important information. The endnotes and appendices are found at the end of the presentation.
ALL AMOUNTS IN U.S. DOLLARS UNLESS OTHERWISE STATED
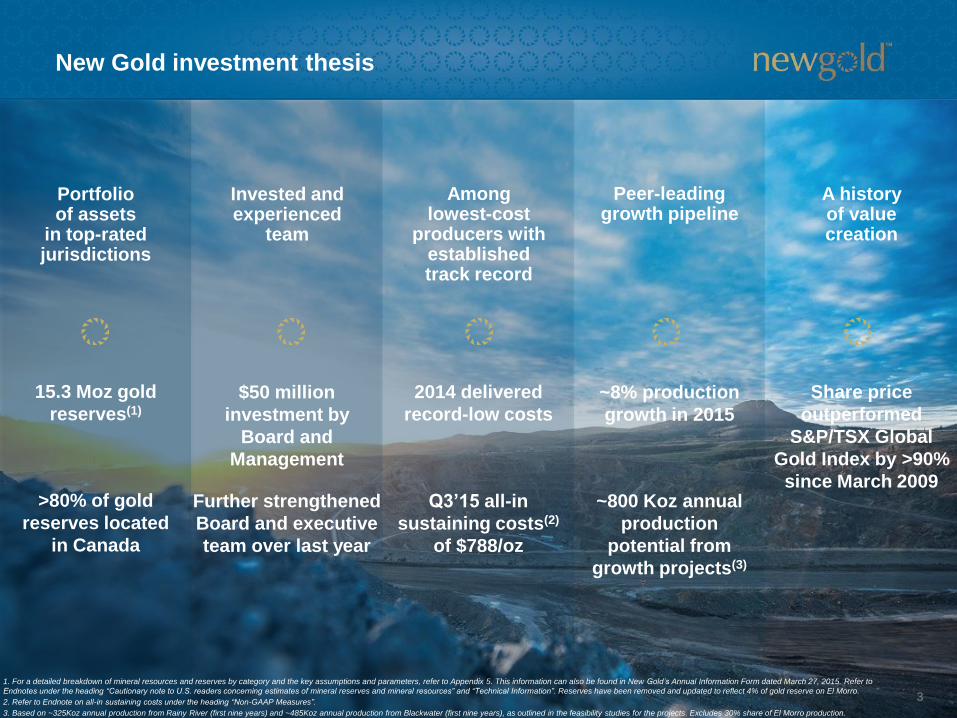
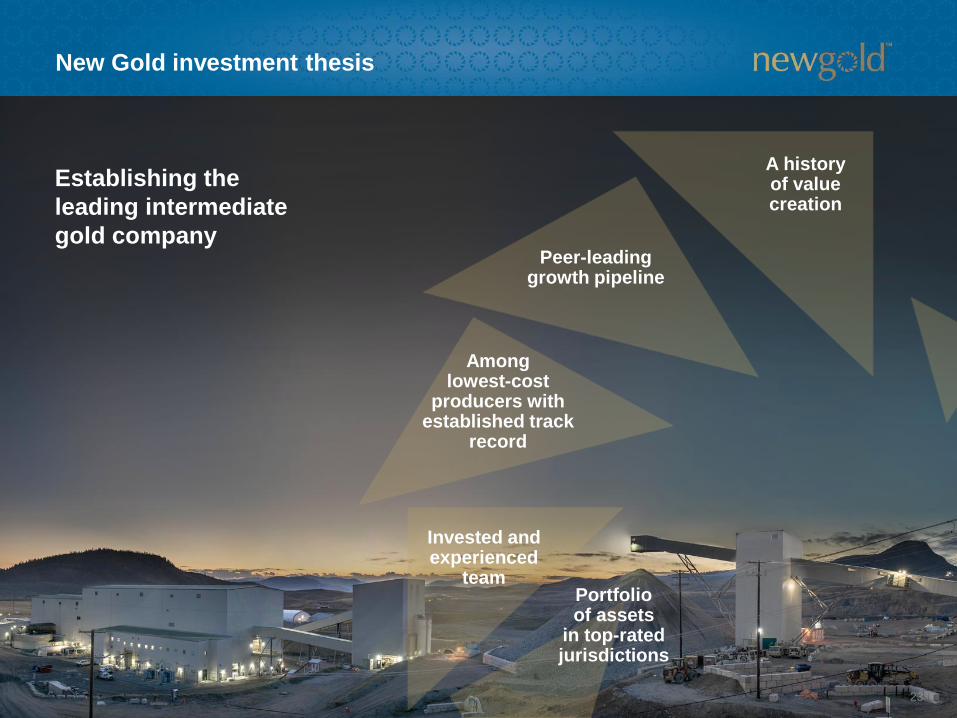
Portfolio of assets
in top-ratedjurisdictions
Invested and experienced
team
Amonglowest-cost
producers with established track record
Peer-leading growth pipeline
A history of value creation
New Gold investment thesis
3
15.3 Moz gold
reserves(1)
$50 million
investment by
Board and
Management
2014 delivered
record-low costs
~8% production
growth in 2015
Share price
outperformed
S&P/TSX Global
Gold Index by >90%
since March 2009
1. For a detailed breakdown of mineral resources and reserves by category and the key assumptions and parameters, refer to Appendix 5. This information can also be found in New Gold’s Annual Information Form dated March 27, 2015. Refer to
Endnotes under the heading “Cautionary note to U.S. readers concerning estimates of mineral reserves and mineral resources” and “Technical Information”. Reserves have been removed and updated to reflect 4% of gold reserve on El Morro.
2. Refer to Endnote on all-in sustaining costs under the heading “Non-GAAP Measures”.
3. Based on ~325Koz annual production from Rainy River (first nine years) and ~485Koz annual production from Blackwater (first nine years), as outlined in the feasibility studies for the projects. Excludes 30% share of El Morro production.
>80% of gold
reserves located
in Canada
Further strengthened
Board and executive
team over last year
~800 Koz annual
production
potential from
growth projects(3)
Q3’15 all-in
sustaining costs(2)
of $788/oz
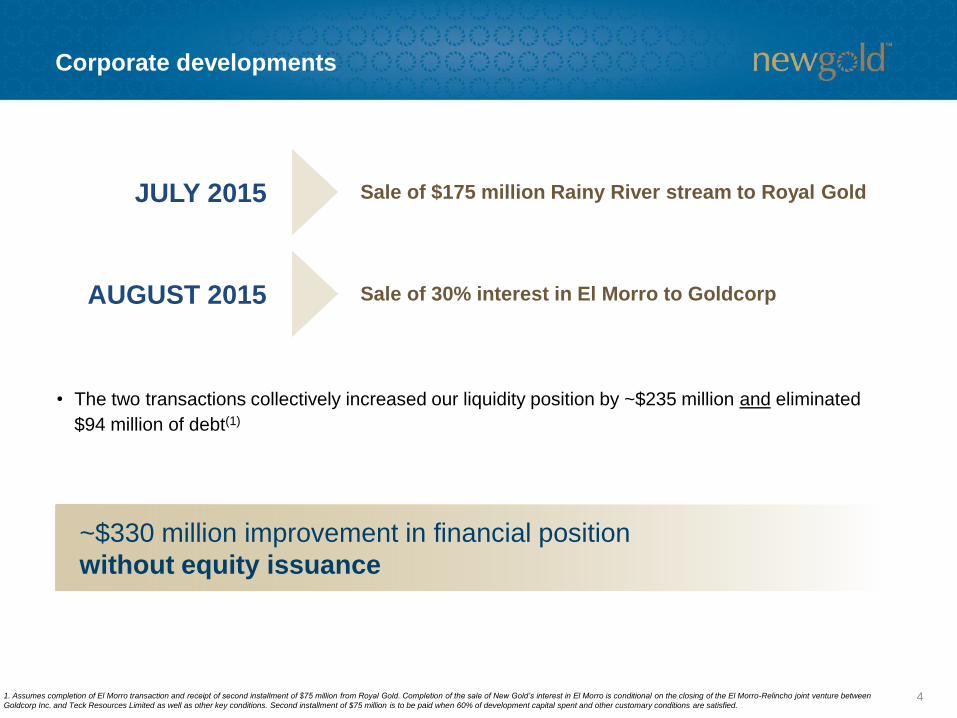
Corporate developments
41. Assumes completion of El Morro transaction and receipt of second installment of $75 million from Royal Gold. Completion of the sale of New Gold’s interest in El Morro is conditional on the closing of the El Morro-Relincho joint venture between
Goldcorp Inc. and Teck Resources Limited as well as other key conditions. Second installment of $75 million is to be paid when 60% of development capital spent and other customary conditions are satisfied.
• The two transactions collectively increased our liquidity position by ~$235 million and eliminated
$94 million of debt(1)
~$330 million improvement in financial position
without equity issuance
Sale of $175 million Rainy River stream to Royal Gold
Sale of 30% interest in El Morro to Goldcorp
JULY 2015
AUGUST 2015
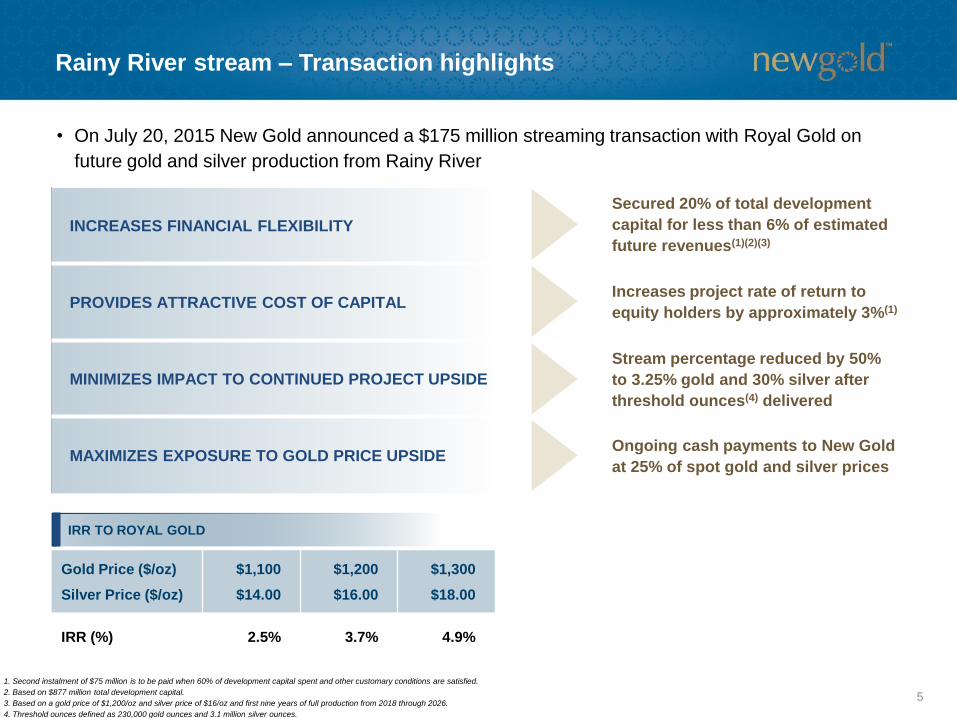
Rainy River stream – Transaction highlights
5
INCREASES FINANCIAL FLEXIBILITY
PROVIDES ATTRACTIVE COST OF CAPITAL
MINIMIZES IMPACT TO CONTINUED PROJECT UPSIDE
MAXIMIZES EXPOSURE TO GOLD PRICE UPSIDE
Secured 20% of total development
capital for less than 6% of estimated
future revenues(1)(2)(3)
Increases project rate of return to
equity holders by approximately 3%(1)
Stream percentage reduced by 50%
to 3.25% gold and 30% silver after
threshold ounces(4) delivered
Ongoing cash payments to New Gold
at 25% of spot gold and silver prices
1. Second instalment of $75 million is to be paid when 60% of development capital spent and other customary conditions are satisfied.
2. Based on $877 million total development capital.
3. Based on a gold price of $1,200/oz and silver price of $16/oz and first nine years of full production from 2018 through 2026.
4. Threshold ounces defined as 230,000 gold ounces and 3.1 million silver ounces.
• On July 20, 2015 New Gold announced a $175 million streaming transaction with Royal Gold on
future gold and silver production from Rainy River
IRR TO ROYAL GOLD
Gold Price ($/oz)
Silver Price ($/oz)
$1,100
$14.00
$1,200
$16.00
$1,300
$18.00
IRR (%) 2.5% 3.7% 4.9%
6
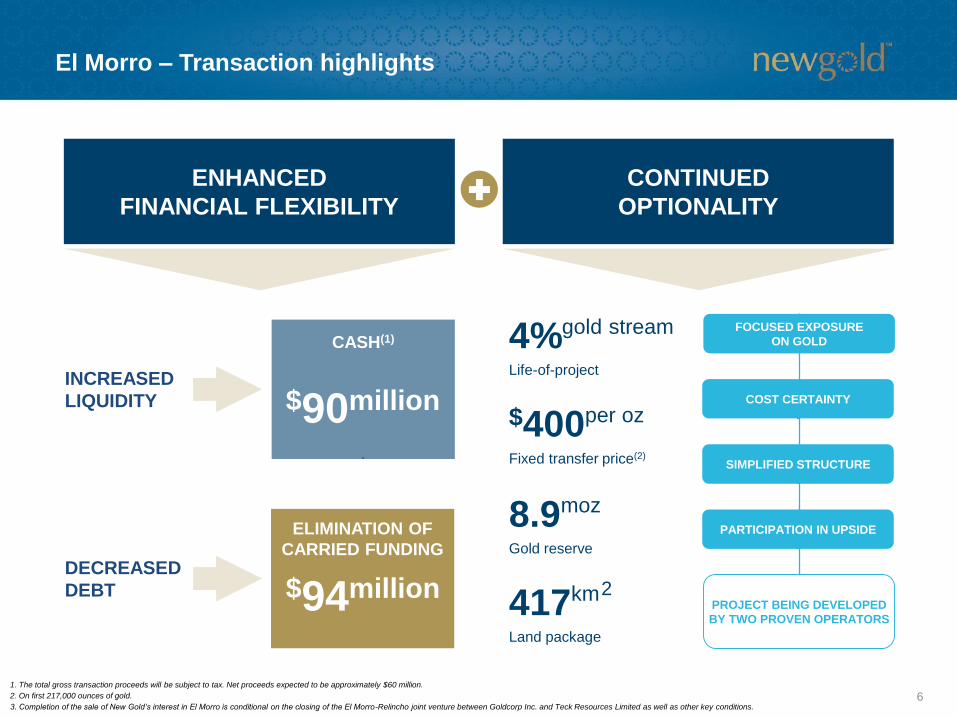
El Morro – Transaction highlights
ENHANCED
FINANCIAL FLEXIBILITY
CONTINUED
OPTIONALITY
INCREASED
LIQUIDITY
CASH(1)
$90million
ELIMINATION OF
CARRIED FUNDING
$94millionDECREASED
DEBT
SIMPLIFIED STRUCTURE
PARTICIPATION IN UPSIDE
COST CERTAINTY
FOCUSED EXPOSURE
ON GOLD
$400per oz
Fixed transfer price(2)
4%gold stream
Life-of-project
8.9moz
Gold reserve
PROJECT BEING DEVELOPED
BY TWO PROVEN OPERATORS417km
Land package
2
1. The total gross transaction proceeds will be subject to tax. Net proceeds expected to be approximately $60 million.
2. On first 217,000 ounces of gold.
3. Completion of the sale of New Gold’s interest in El Morro is conditional on the closing of the El Morro-Relincho joint venture between Goldcorp Inc. and Teck Resources Limited as well as other key conditions.
7
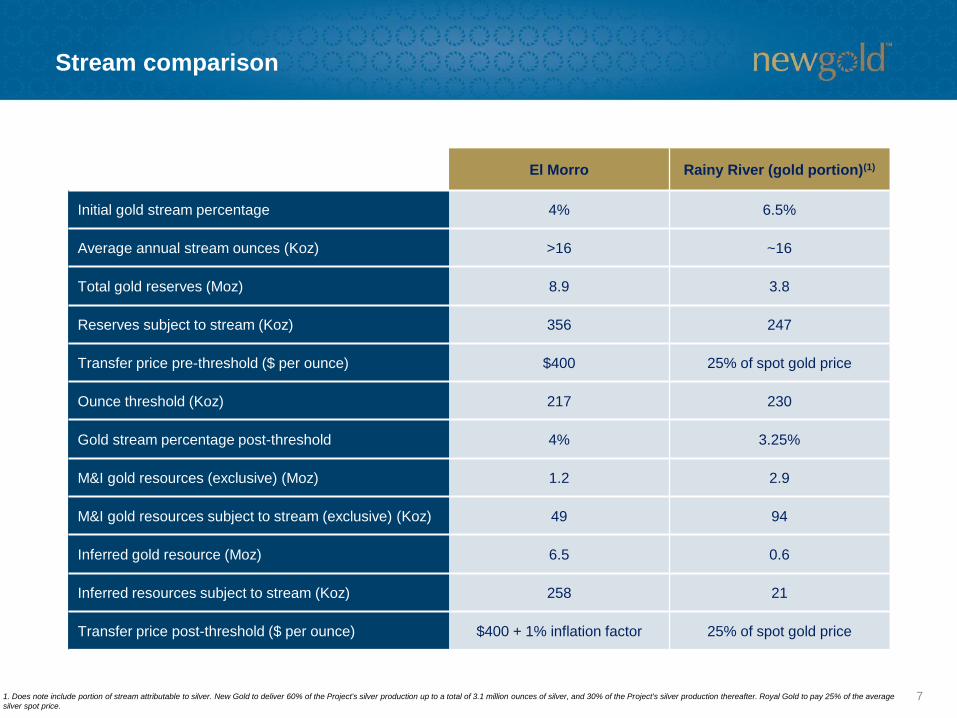
Stream comparison
El Morro Rainy River (gold portion)(1)
Initial gold stream percentage 4% 6.5%
Average annual stream ounces (Koz) >16 ~16
Total gold reserves (Moz) 8.9 3.8
Reserves subject to stream (Koz) 356 247
Transfer price pre-threshold ($ per ounce) $400 25% of spot gold price
Ounce threshold (Koz) 217 230
Gold stream percentage post-threshold 4% 3.25%
M&I gold resources (exclusive) (Moz) 1.2 2.9
M&I gold resources subject to stream (exclusive) (Koz) 49 94
Inferred gold resource (Moz) 6.5 0.6
Inferred resources subject to stream (Koz) 258 21
Transfer price post-threshold ($ per ounce) $400 + 1% inflation factor 25% of spot gold price
1. Does note include portion of stream attributable to silver. New Gold to deliver 60% of the Project's silver production up to a total of 3.1 million ounces of silver, and 30% of the Project's silver production thereafter. Royal Gold to pay 25% of the average
silver spot price.
8
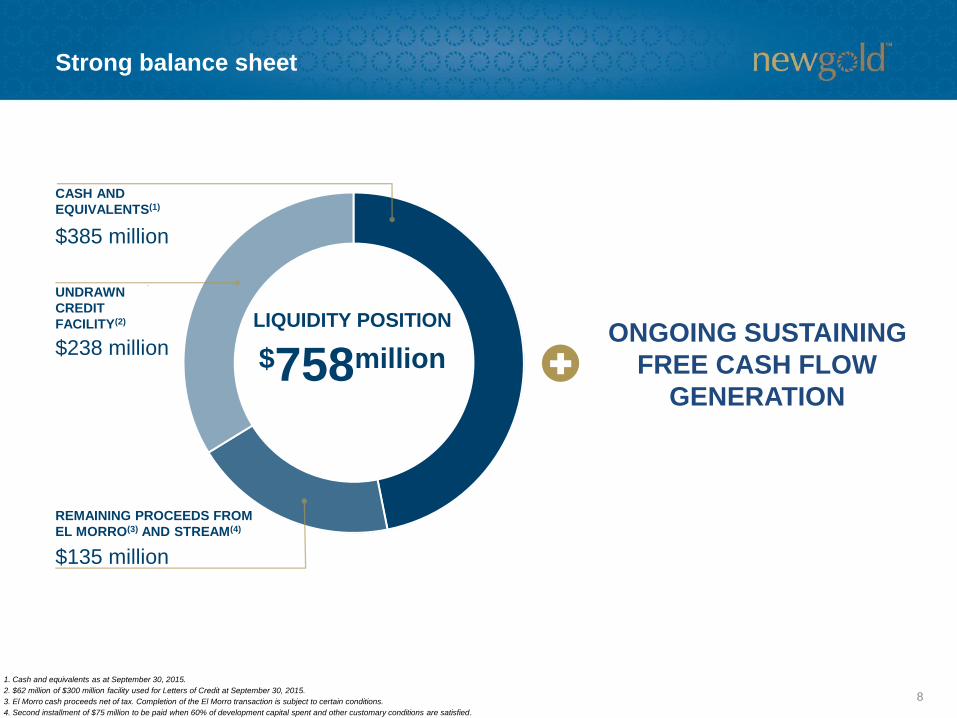
Strong balance sheet
1. Cash and equivalents as at September 30, 2015.
2. $62 million of $300 million facility used for Letters of Credit at September 30, 2015.
3. El Morro cash proceeds net of tax. Completion of the El Morro transaction is subject to certain conditions.
4. Second installment of $75 million to be paid when 60% of development capital spent and other customary conditions are satisfied.
$758million
LIQUIDITY POSITION
$238 million
UNDRAWN
CREDIT
FACILITY(2)
CASH AND
EQUIVALENTS(1)
$385 million
ONGOING SUSTAINING
FREE CASH FLOW
GENERATION
$135 million
REMAINING PROCEEDS FROM
EL MORRO(3) AND STREAM(4)
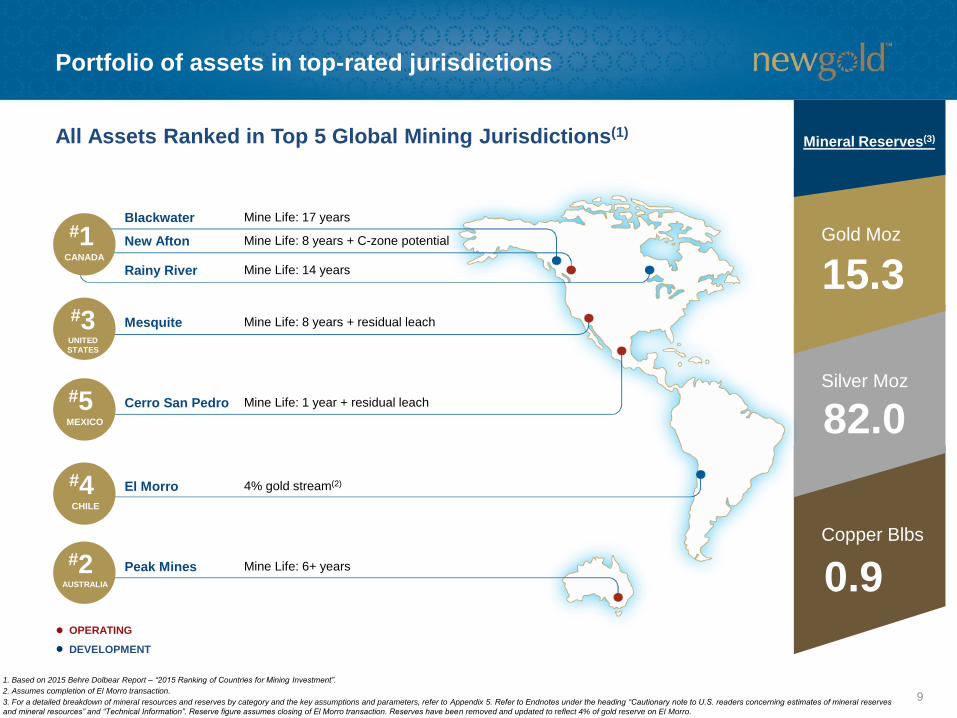
Portfolio of assets in top-rated jurisdictions
Blackwater
New Afton
Rainy River
Mesquite
Cerro San Pedro
El Morro
Peak Mines
Mine Life: 17 years
Mine Life: 8 years + C-zone potential
Mine Life: 14 years
Mine Life: 8 years + residual leach
Mine Life: 1 year + residual leach
4% gold stream(2)
Mine Life: 6+ years
#1CANADA
#3UNITED
STATES
#5MEXICO
#4CHILE
#2AUSTRALIA
OPERATING
DEVELOPMENT
9
All Assets Ranked in Top 5 Global Mining Jurisdictions(1)
1. Based on 2015 Behre Dolbear Report – “2015 Ranking of Countries for Mining Investment”.
2. Assumes completion of El Morro transaction.
3. For a detailed breakdown of mineral resources and reserves by category and the key assumptions and parameters, refer to Appendix 5. Refer to Endnotes under the heading “Cautionary note to U.S. readers concerning estimates of mineral reserves
and mineral resources” and “Technical Information”. Reserve figure assumes closing of El Morro transaction. Reserves have been removed and updated to reflect 4% of gold reserve on El Morro.
Gold Moz
Silver Moz
Copper Blbs
Mineral Reserves(3)
15.3
82.0
0.9
10
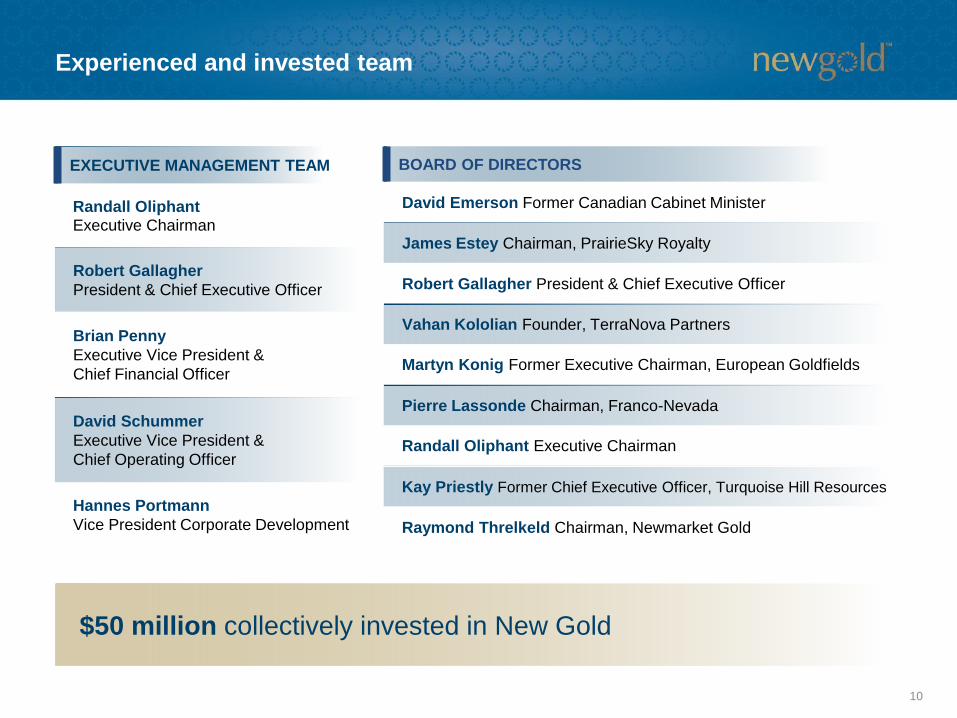
Experienced and invested team
BOARD OF DIRECTORS
David Emerson Former Canadian Cabinet Minister
James Estey Chairman, PrairieSky Royalty
Robert Gallagher President & Chief Executive Officer
Vahan Kololian Founder, TerraNova Partners
Martyn Konig Former Executive Chairman, European Goldfields
Pierre Lassonde Chairman, Franco-Nevada
Randall Oliphant Executive Chairman
Kay Priestly Former Chief Executive Officer, Turquoise Hill Resources
Raymond Threlkeld Chairman, Newmarket Gold
EXECUTIVE MANAGEMENT TEAM
Randall OliphantExecutive Chairman
Robert Gallagher
President & Chief Executive Officer
Brian Penny
Executive Vice President &
Chief Financial Officer
David Schummer
Executive Vice President &
Chief Operating Officer
Hannes Portmann
Vice President Corporate Development
$50 million collectively invested in New Gold
11
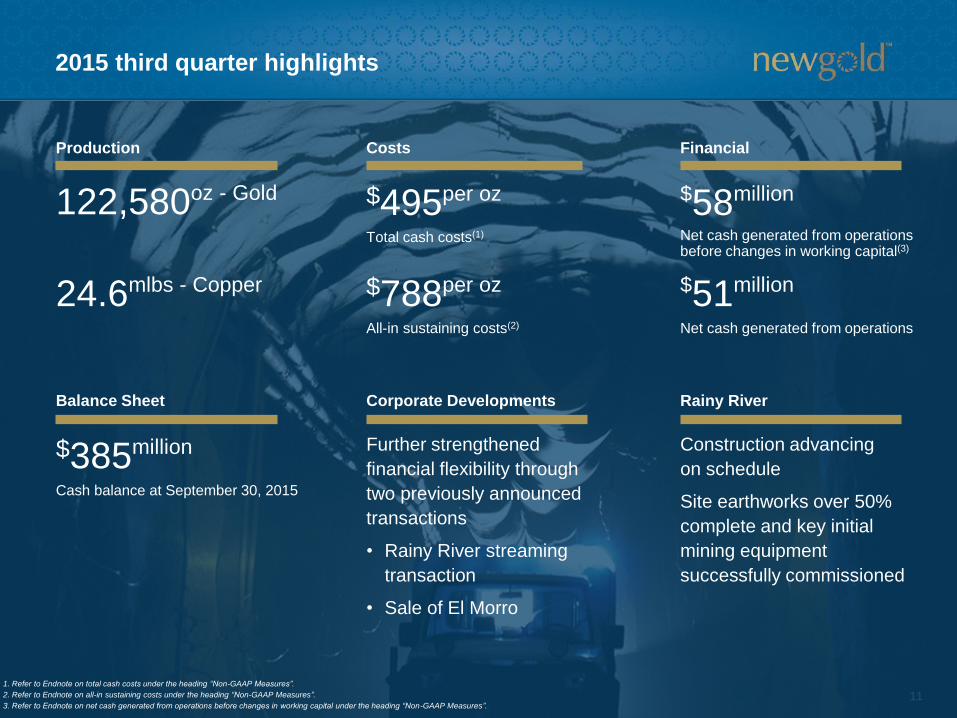
2015 third quarter highlights
Production
122,580oz - Gold
24.6mlbs - Copper
Balance Sheet
$385million
Cash balance at September 30, 2015
Costs
$495per oz
Total cash costs(1)
$788per oz
All-in sustaining costs(2)
Corporate Developments
Further strengthened
financial flexibility through
two previously announced
transactions
• Rainy River streaming
transaction
• Sale of El Morro
Financial
$58million
Net cash generated from operations before changes in working capital(3)
$51million
Net cash generated from operations
Rainy River
Construction advancing
on schedule
Site earthworks over 50%
complete and key initial
mining equipment
successfully commissioned
1. Refer to Endnote on total cash costs under the heading “Non-GAAP Measures”.
2. Refer to Endnote on all-in sustaining costs under the heading “Non-GAAP Measures”.
3. Refer to Endnote on net cash generated from operations before changes in working capital under the heading “Non-GAAP Measures”.
12
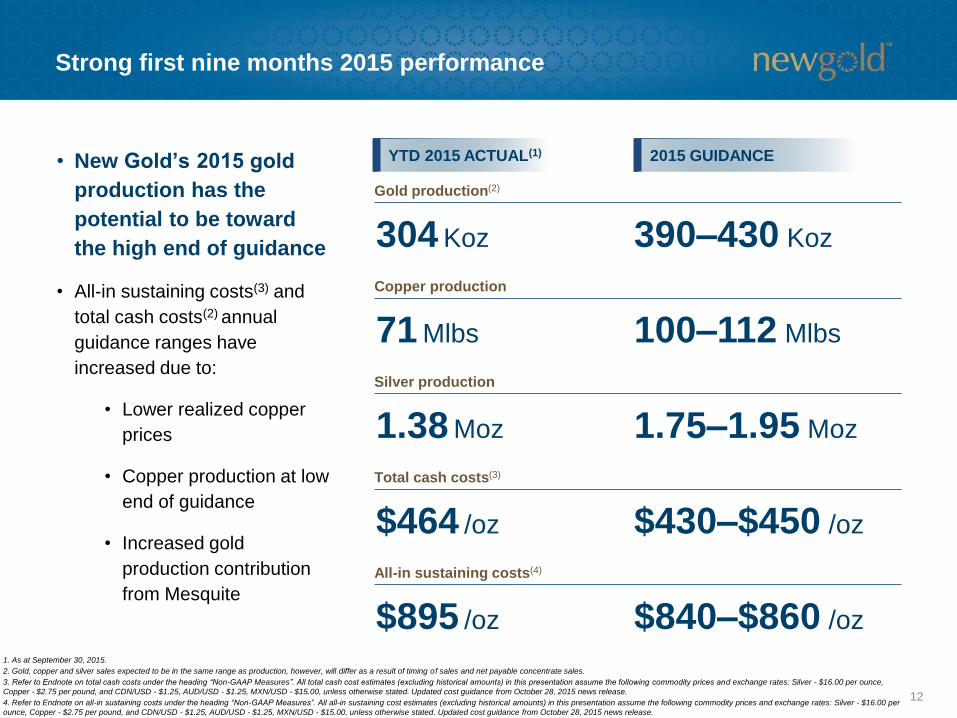
• New Gold’s 2015 gold
production has the
potential to be toward
the high end of guidance
• All-in sustaining costs(3) and
total cash costs(2) annual
guidance ranges have
increased due to:
• Lower realized copper
prices
• Copper production at low
end of guidance
• Increased gold
production contribution
from Mesquite
Strong first nine months 2015 performance
YTD 2015 ACTUAL(1)
304 Koz
2015 GUIDANCE
Gold production(2)
390–430 Koz
$464 /oz
Total cash costs(3)
$430–$450 /oz
$895 /oz
All-in sustaining costs(4)
$840–$860 /oz
1. As at September 30, 2015.
2. Gold, copper and silver sales expected to be in the same range as production, however, will differ as a result of timing of sales and net payable concentrate sales.
3. Refer to Endnote on total cash costs under the heading “Non-GAAP Measures”. All total cash cost estimates (excluding historical amounts) in this presentation assume the following commodity prices and exchange rates: Silver - $16.00 per ounce,
Copper - $2.75 per pound, and CDN/USD - $1.25, AUD/USD - $1.25, MXN/USD - $15.00, unless otherwise stated. Updated cost guidance from October 28, 2015 news release.
4. Refer to Endnote on all-in sustaining costs under the heading “Non-GAAP Measures”. All all-in sustaining cost estimates (excluding historical amounts) in this presentation assume the following commodity prices and exchange rates: Silver - $16.00 per
ounce, Copper - $2.75 per pound, and CDN/USD - $1.25, AUD/USD - $1.25, MXN/USD - $15.00, unless otherwise stated. Updated cost guidance from October 28, 2015 news release.
71 Mlbs
Copper production
100–112 Mlbs
1.38 Moz
Silver production
1.75–1.95 Moz
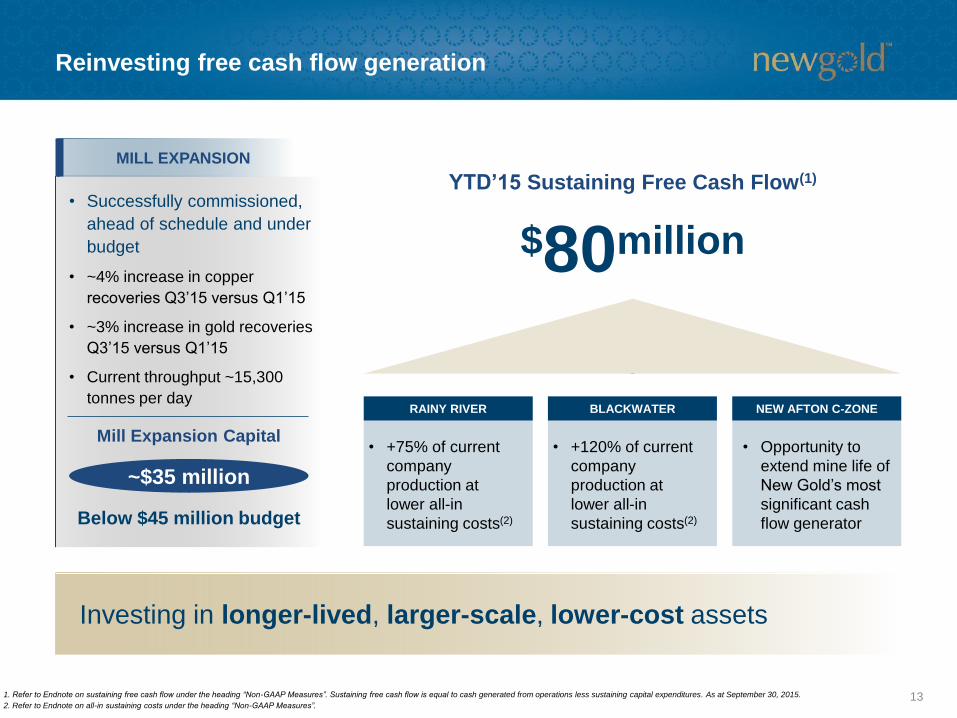
Reinvesting free cash flow generation
131. Refer to Endnote on sustaining free cash flow under the heading “Non-GAAP Measures”. Sustaining free cash flow is equal to cash generated from operations less sustaining capital expenditures. As at September 30, 2015.
2. Refer to Endnote on all-in sustaining costs under the heading “Non-GAAP Measures”.
YTD’15 Sustaining Free Cash Flow(1)
• +75% of current
company
production at
lower all-in
sustaining costs(2)
RAINY RIVER
• +120% of current
company
production at
lower all-in
sustaining costs(2)
BLACKWATER
• Opportunity to
extend mine life of
New Gold’s most
significant cash
flow generator
NEW AFTON C-ZONE
Investing in longer-lived, larger-scale, lower-cost assets
Mill Expansion Capital
Below $45 million budget
• Successfully commissioned,
ahead of schedule and under
budget
• ~4% increase in copper
recoveries Q3’15 versus Q1’15
• ~3% increase in gold recoveries
Q3’15 versus Q1’15
• Current throughput ~15,300
tonnes per day
MILL EXPANSION
~$35 million
$80million
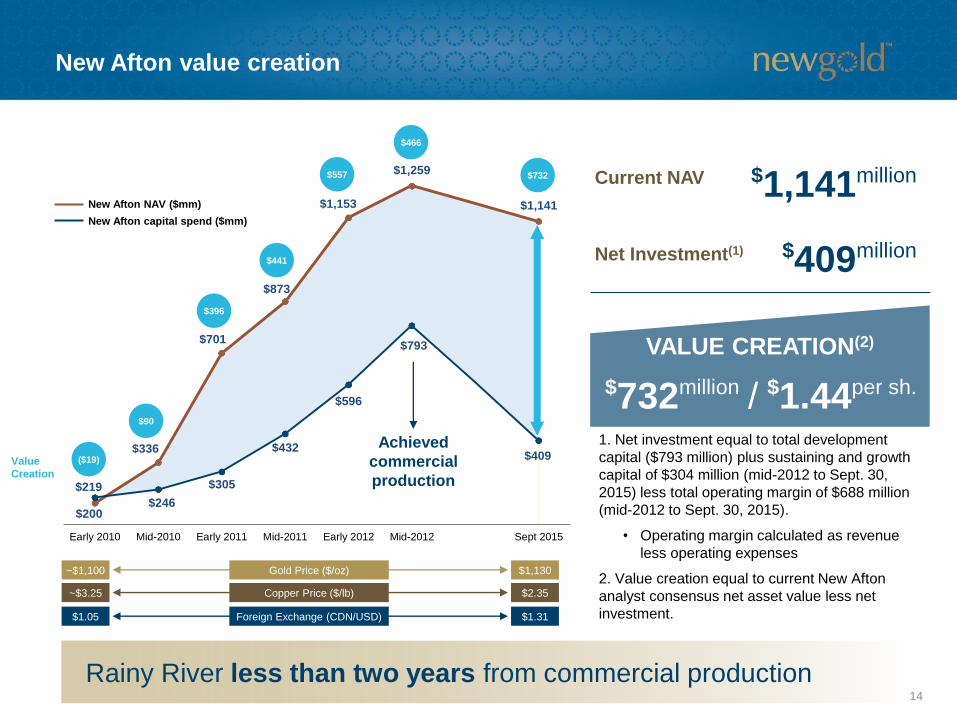
$200
$336
$701
$873
$1,153
$1,259
$1,141
$219
$246
$305
$432
$596
$793
$409
Early 2010 Mid-2010 Early 2011 Mid-2011 Early 2012 Mid-2012 Sept 2015
14
New Afton value creation
Value
Creation
($19)
$90
$396
$441
$557
$466
New Afton NAV ($mm)
New Afton capital spend ($mm)
~$1,100
~$3.25
$1,130
$2.35
$11million
VALUE CREATION(2)
1. Net investment equal to total development
capital ($793 million) plus sustaining and growth
capital of $304 million (mid-2012 to Sept. 30,
2015) less total operating margin of $688 million
(mid-2012 to Sept. 30, 2015).
• Operating margin calculated as revenue
less operating expenses
2. Value creation equal to current New Afton
analyst consensus net asset value less net
investment.
Gold Price ($/oz)
Copper Price ($/lb)
$732 $1,141millionCurrent NAV
Net Investment(1)
$732million /
$409million
Achieved
commercial
production
$1.05 $1.31Foreign Exchange (CDN/USD)
Rainy River less than two years from commercial production
$1.44per sh.
15
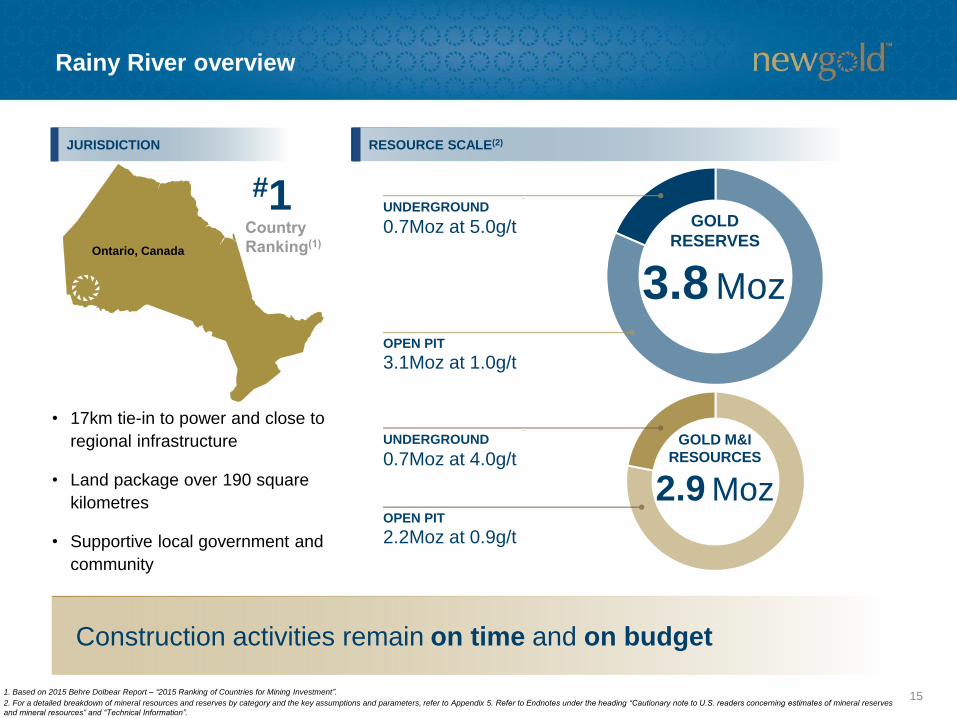
Rainy River overview
1. Based on 2015 Behre Dolbear Report – “2015 Ranking of Countries for Mining Investment”.
2. For a detailed breakdown of mineral resources and reserves by category and the key assumptions and parameters, refer to Appendix 5. Refer to Endnotes under the heading “Cautionary note to U.S. readers concerning estimates of mineral reserves
and mineral resources” and “Technical Information”.
• 17km tie-in to power and close to
regional infrastructure
• Land package over 190 square
kilometres
• Supportive local government and
community
JURISDICTION RESOURCE SCALE(2)
Ontario, Canada
GOLD
RESERVES
3.1Moz at 1.0g/tOPEN PIT
UNDERGROUND
0.7Moz at 5.0g/t
3.8 Moz
#1
GOLD M&I
RESOURCES
2.2Moz at 0.9g/tOPEN PIT
UNDERGROUND
0.7Moz at 4.0g/t
2.9 Moz
Construction activities remain on time and on budget
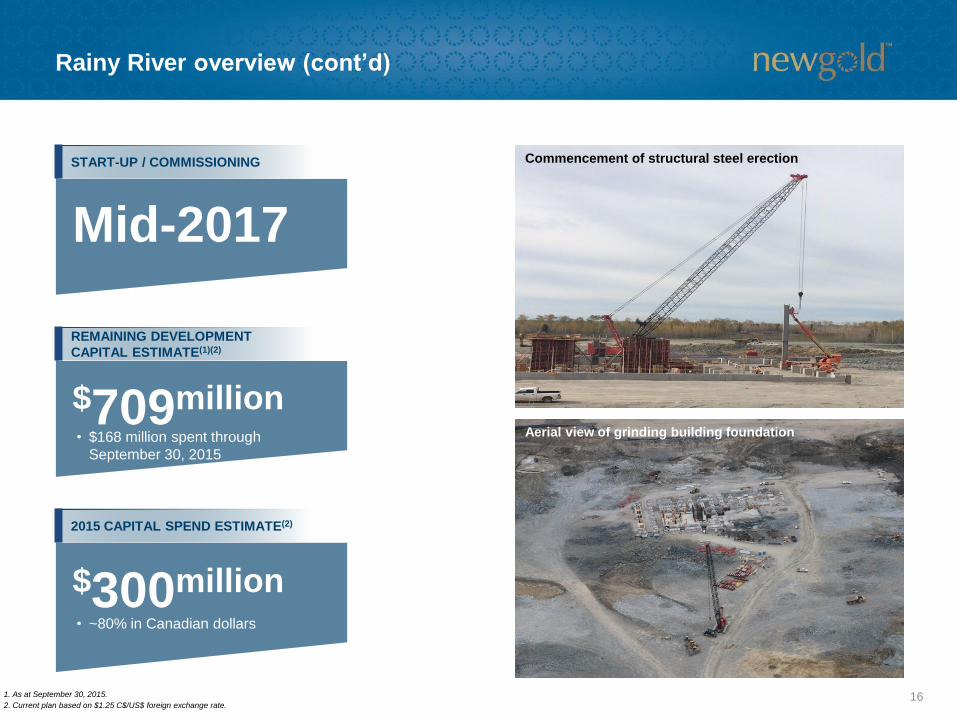
Rainy River overview (cont’d)
16
Concrete batch plant
Concrete foundation for processing facility
1. As at September 30, 2015.
2. Current plan based on $1.25 C$/US$ foreign exchange rate.
START-UP / COMMISSIONING
REMAINING DEVELOPMENT
CAPITAL ESTIMATE(1)(2)
2015 CAPITAL SPEND ESTIMATE(2)
Mid-2017
• $168 million spent through
September 30, 2015
$709million
• ~80% in Canadian dollars
$300million
Commencement of structural steel erection
Aerial view of grinding building foundation
17
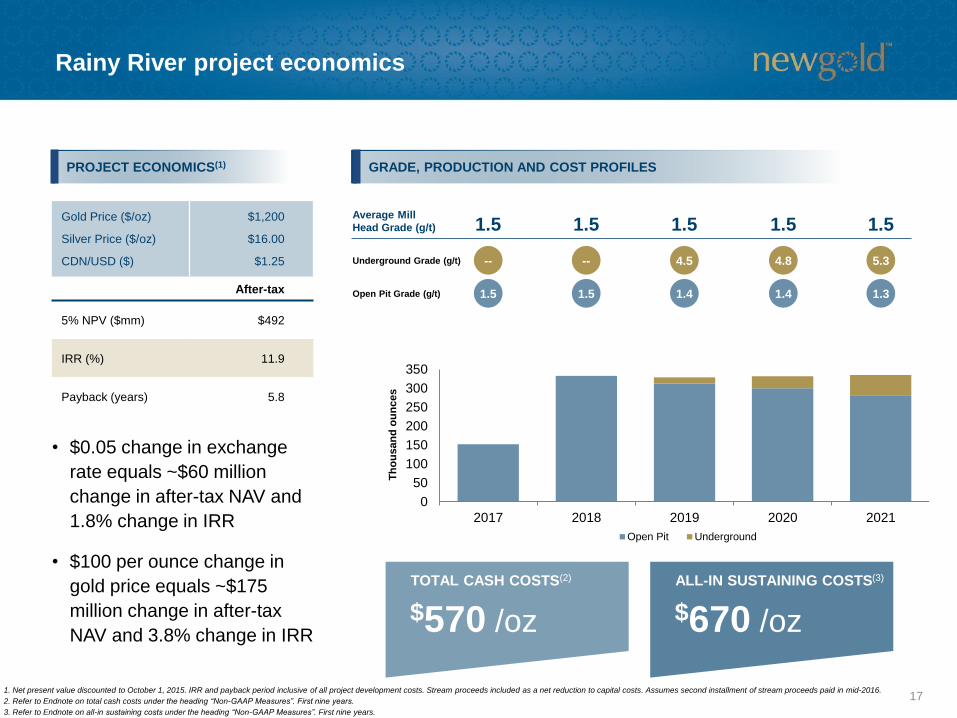
Rainy River project economics
1. Net present value discounted to October 1, 2015. IRR and payback period inclusive of all project development costs. Stream proceeds included as a net reduction to capital costs. Assumes second installment of stream proceeds paid in mid-2016.
2. Refer to Endnote on total cash costs under the heading “Non-GAAP Measures”. First nine years.
3. Refer to Endnote on all-in sustaining costs under the heading “Non-GAAP Measures”. First nine years.
• $0.05 change in exchange
rate equals ~$60 million
change in after-tax NAV and
1.8% change in IRR
• $100 per ounce change in
gold price equals ~$175
million change in after-tax
NAV and 3.8% change in IRR
Average Mill
Head Grade (g/t)
Underground Grade (g/t)
Open Pit Grade (g/t)
0
50
100
150
200
250
300
350
2017 2018 2019 2020 2021
Open Pit Underground
1.5 1.5 1.5 1.5 1.5
Th
ou
sa
nd
ou
nc
es
1.5
--
1.5
--
1.4
4.5
1.4
4.8
1.3
5.3
PROJECT ECONOMICS(1) GRADE, PRODUCTION AND COST PROFILES
$670 /oz
ALL-IN SUSTAINING COSTS(3)
Gold Price ($/oz)
Silver Price ($/oz)
CDN/USD ($)
$1,200
$16.00
$1.25
After-tax
5% NPV ($mm) $492
IRR (%) 11.9
Payback (years) 5.8
$570 /oz
TOTAL CASH COSTS(2)
Rainy River funding
18
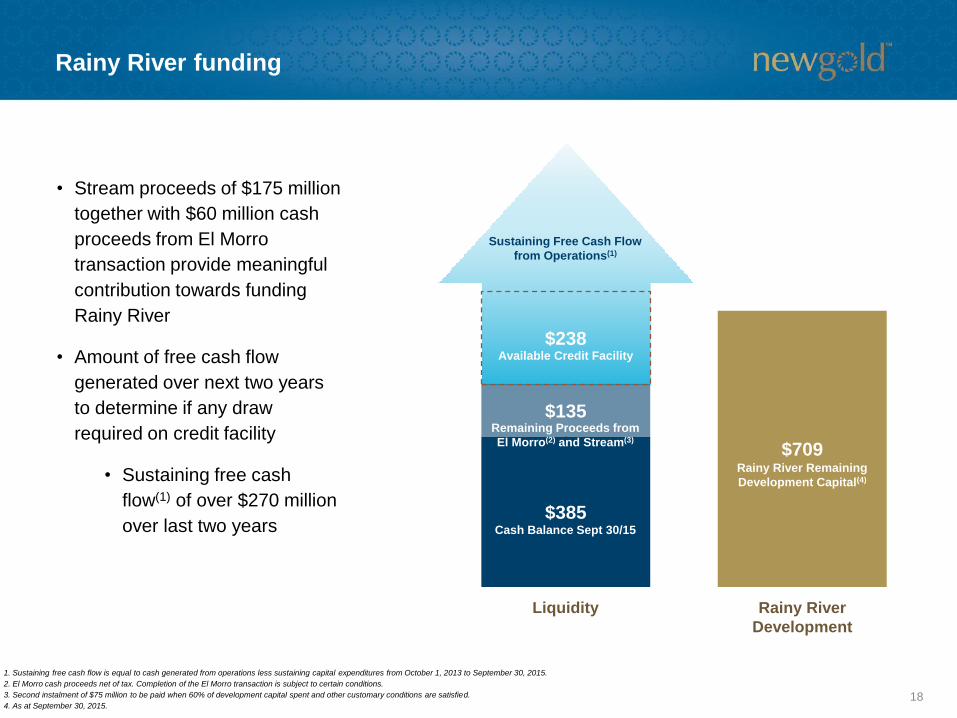
• Stream proceeds of $175 million
together with $60 million cash
proceeds from El Morro
transaction provide meaningful
contribution towards funding
Rainy River
• Amount of free cash flow
generated over next two years
to determine if any draw
required on credit facility
• Sustaining free cash
flow(1) of over $270 million
over last two years$385
$709
$135
$238
Liquidity Rainy River
Development
Cash Balance Sept 30/15
Remaining Proceeds from
El Morro(2) and Stream(3)
Rainy River Remaining
Development Capital(4)
Available Credit Facility
Sustaining Free Cash Flow
from Operations(1)
1. Sustaining free cash flow is equal to cash generated from operations less sustaining capital expenditures from October 1, 2013 to September 30, 2015.
2. El Morro cash proceeds net of tax. Completion of the El Morro transaction is subject to certain conditions.
3. Second instalment of $75 million to be paid when 60% of development capital spent and other customary conditions are satisfied.
4. As at September 30, 2015.
REGIONAL UPSIDESIGNIFICANT GOLD AND SILVER RESOURCE
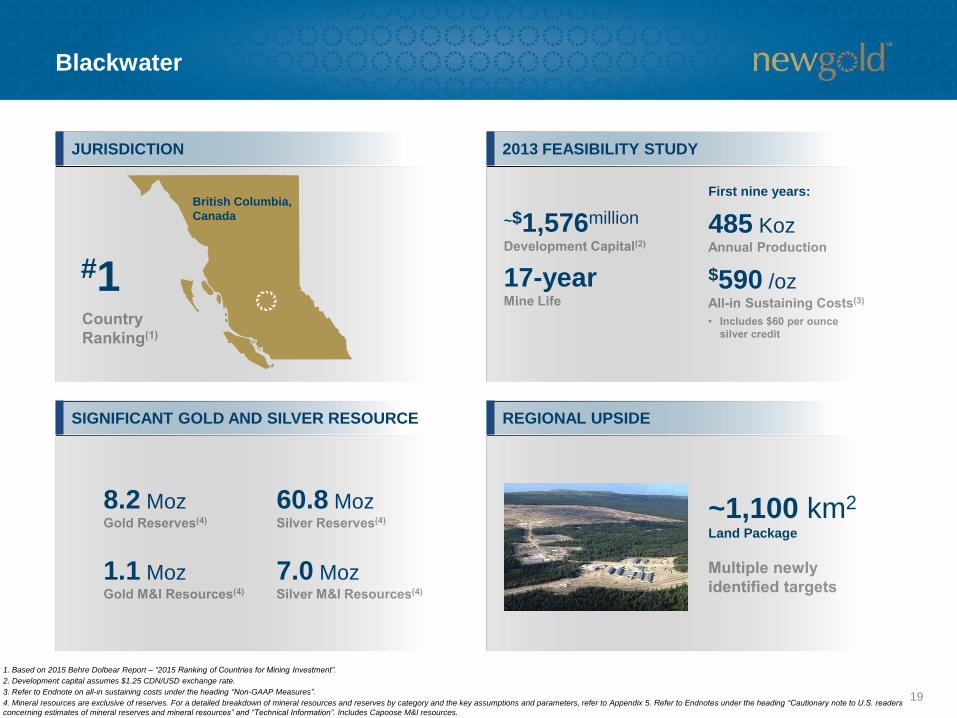
Blackwater
19
British Columbia,
Canada
#1
8.2 Moz
1.1 Moz
~1,100 km2
Land Package
First nine years:
485 Koz
$590 /oz17-year
JURISDICTION 2013 FEASIBILITY STUDY
1. Based on 2015 Behre Dolbear Report – “2015 Ranking of Countries for Mining Investment”.
2. Development capital assumes $1.25 CDN/USD exchange rate.
3. Refer to Endnote on all-in sustaining costs under the heading “Non-GAAP Measures”.
4. Mineral resources are exclusive of reserves. For a detailed breakdown of mineral resources and reserves by category and the key assumptions and parameters, refer to Appendix 5. Refer to Endnotes under the heading “Cautionary note to U.S. readers
concerning estimates of mineral reserves and mineral resources” and “Technical Information”. Includes Capoose M&I resources.
~$1,576million
60.8 Moz
7.0 Moz
20
New Afton – C-zone opportunity
1. For a detailed breakdown of mineral resources and reserves by category and the key assumptions and parameters, refer to Appendix 5. Refer to Endnotes under the heading “Cautionary note to U.S. readers concerning estimates of mineral reserves
and mineral resources” and “Technical Information”.
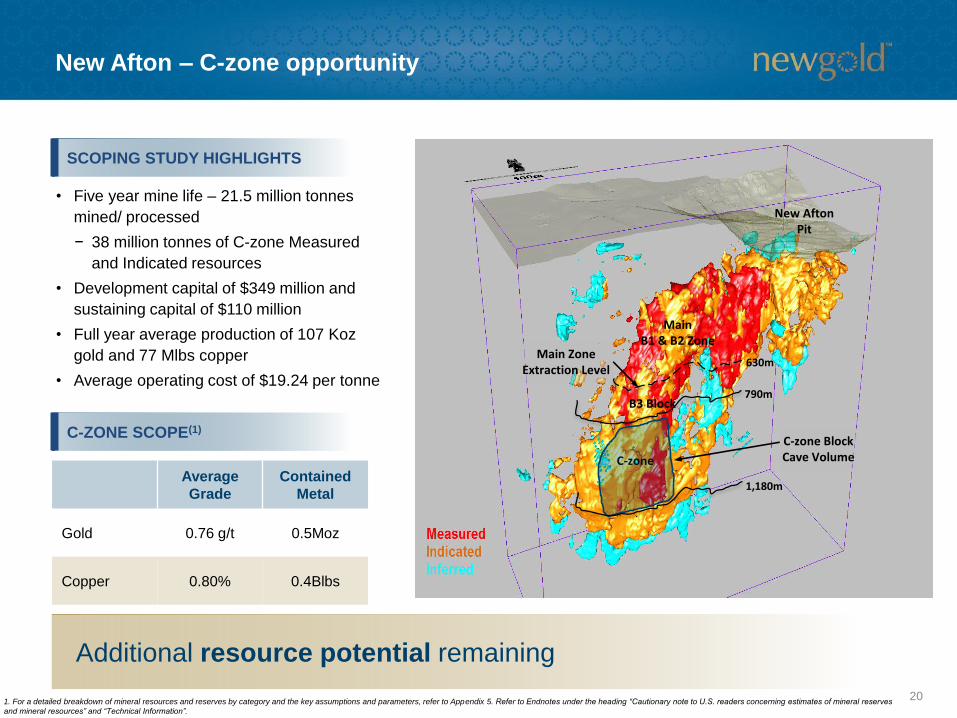
Average
Grade
Contained
Metal
Gold 0.76 g/t 0.5Moz
Copper 0.80% 0.4Blbs
SCOPING STUDY HIGHLIGHTS
• Five year mine life – 21.5 million tonnes
mined/ processed
− 38 million tonnes of C-zone Measured
and Indicated resources
• Development capital of $349 million and
sustaining capital of $110 million
• Full year average production of 107 Koz
gold and 77 Mlbs copper
• Average operating cost of $19.24 per tonne
Additional resource potential remaining
C-ZONE SCOPE(1)
New AftonPit
MainB1 & B2 Zone
B3 Block
C-zone
Main ZoneExtraction Level
790m
630m
1,180m
C-zone Block Cave Volume
Multiple growth initiatives(1)
211. Based on ~325Koz annual production from Rainy River (first nine years) and ~485Koz annual production from Blackwater (first nine years) as outlined in the feasibility studies for the projects.
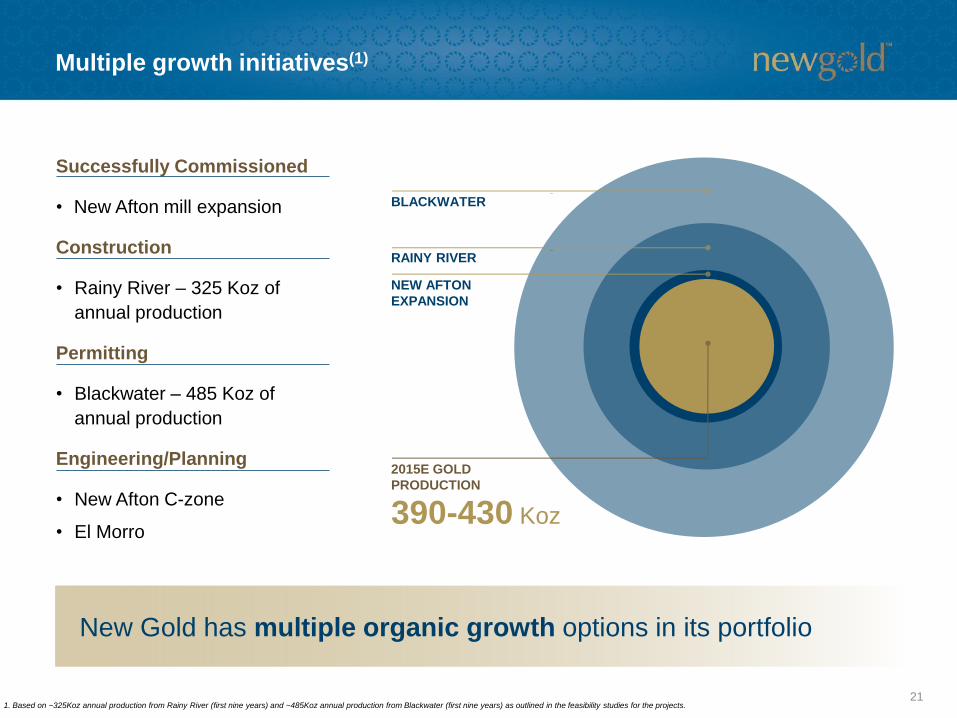
Successfully Commissioned
• New Afton mill expansion
Construction
• Rainy River – 325 Koz of
annual production
Permitting
• Blackwater – 485 Koz of
annual production
Engineering/Planning
• New Afton C-zone
• El Morro
New Gold has multiple organic growth options in its portfolio
2015E GOLD
PRODUCTION
BLACKWATER
RAINY RIVER
NEW AFTON
EXPANSION
390-430 Koz
22
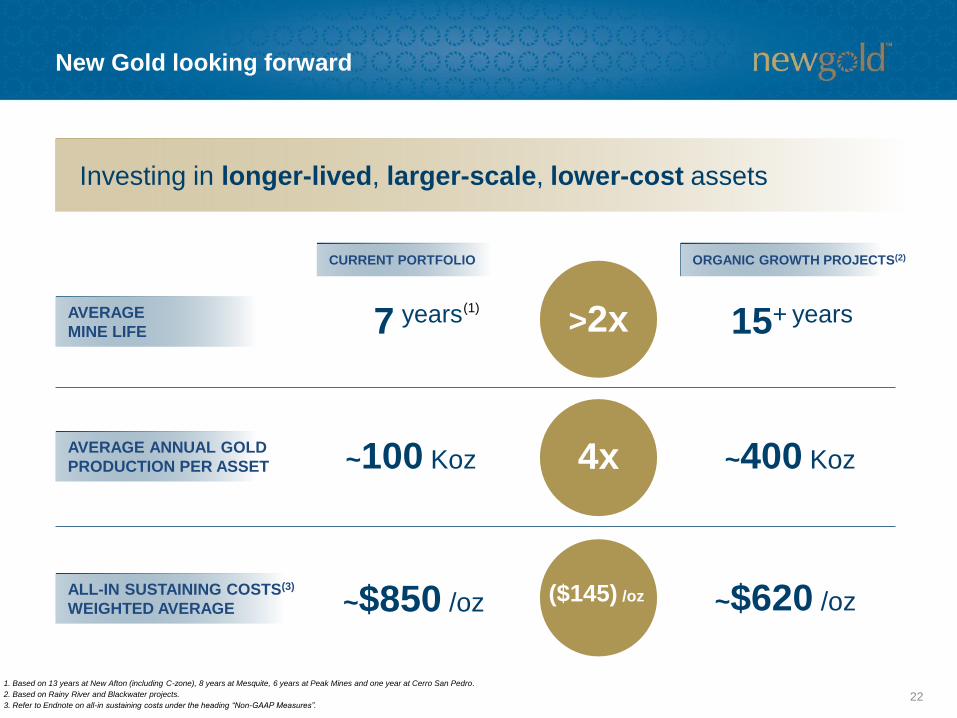
New Gold looking forward
15+ years
~$620 /oz
AVERAGE ANNUAL GOLD
PRODUCTION PER ASSET
ALL-IN SUSTAINING COSTS(3)
WEIGHTED AVERAGE
7 years
~100 Koz
~$850 /oz
CURRENT PORTFOLIO
>2x
4x
($145) /oz
ORGANIC GROWTH PROJECTS(2)
AVERAGE
MINE LIFE
Investing in longer-lived, larger-scale, lower-cost assets
1. Based on 13 years at New Afton (including C-zone), 8 years at Mesquite, 6 years at Peak Mines and one year at Cerro San Pedro.
2. Based on Rainy River and Blackwater projects.
3. Refer to Endnote on all-in sustaining costs under the heading “Non-GAAP Measures”.
~400 Koz
(1)
New Gold investment thesis
23
A history of value creation
Peer-leading growth pipeline
Amonglowest-cost
producers with established track
record
Invested and experienced
teamPortfolio of assets
in top-ratedjurisdictions
Establishing the
leading intermediate
gold company
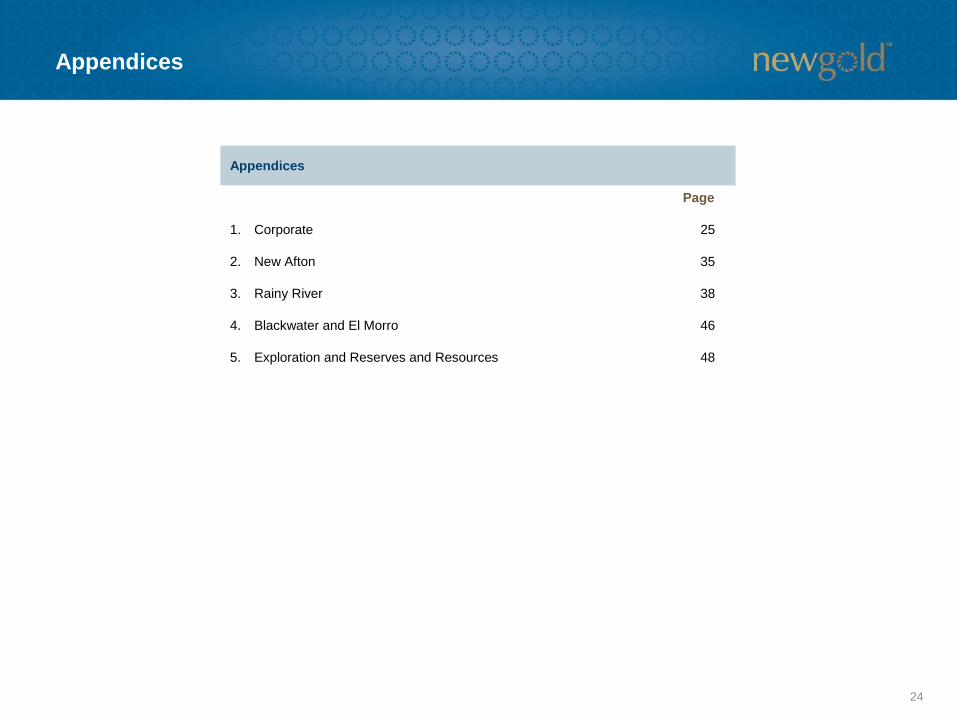
Appendices
24
Appendices
Page
1. Corporate 25
2. New Afton 35
3. Rainy River 38
4. Blackwater and El Morro 46
5. Exploration and Reserves and Resources 48
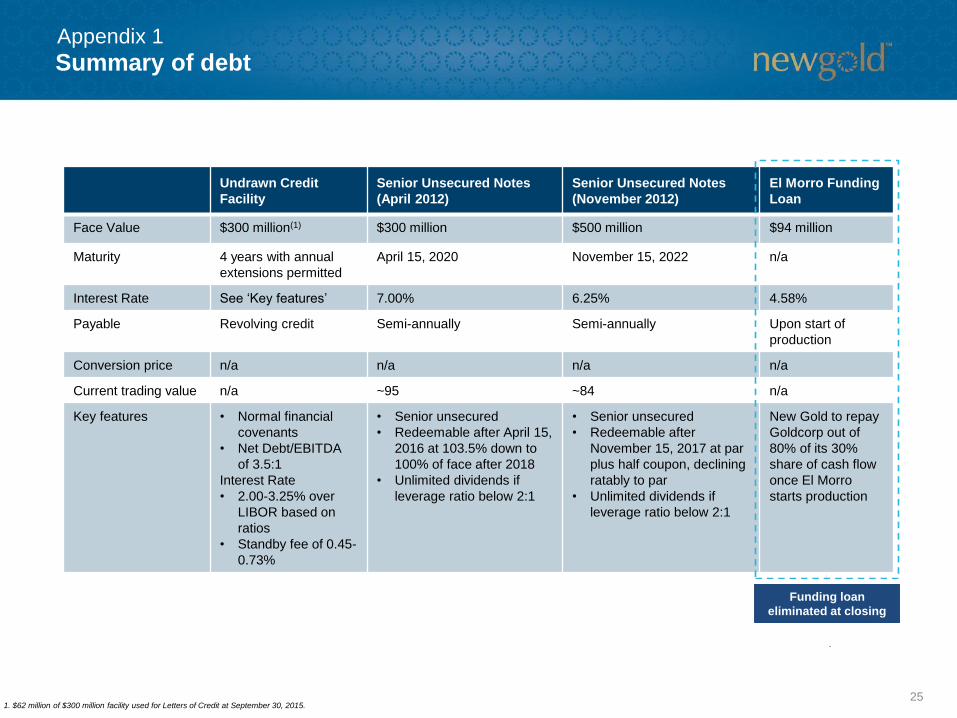
Summary of debt
25
Undrawn Credit
Facility
Senior Unsecured Notes
(April 2012)
Senior Unsecured Notes
(November 2012)
El Morro Funding
Loan
Face Value $300 million(1) $300 million $500 million $94 million
Maturity 4 years with annual
extensions permitted
April 15, 2020 November 15, 2022 n/a
Interest Rate See ‘Key features’ 7.00% 6.25% 4.58%
Payable Revolving credit Semi-annually Semi-annually Upon start of
production
Conversion price n/a n/a n/a n/a
Current trading value n/a ~95 ~84 n/a
Key features • Normal financial
covenants
• Net Debt/EBITDA
of 3.5:1
Interest Rate
• 2.00-3.25% over
LIBOR based on
ratios
• Standby fee of 0.45-
0.73%
• Senior unsecured
• Redeemable after April 15,
2016 at 103.5% down to
100% of face after 2018
• Unlimited dividends if
leverage ratio below 2:1
• Senior unsecured
• Redeemable after
November 15, 2017 at par
plus half coupon, declining
ratably to par
• Unlimited dividends if
leverage ratio below 2:1
New Gold to repay
Goldcorp out of
80% of its 30%
share of cash flow
once El Morro
starts production
1. $62 million of $300 million facility used for Letters of Credit at September 30, 2015.
Appendix 1
Funding loan
eliminated at closing
26
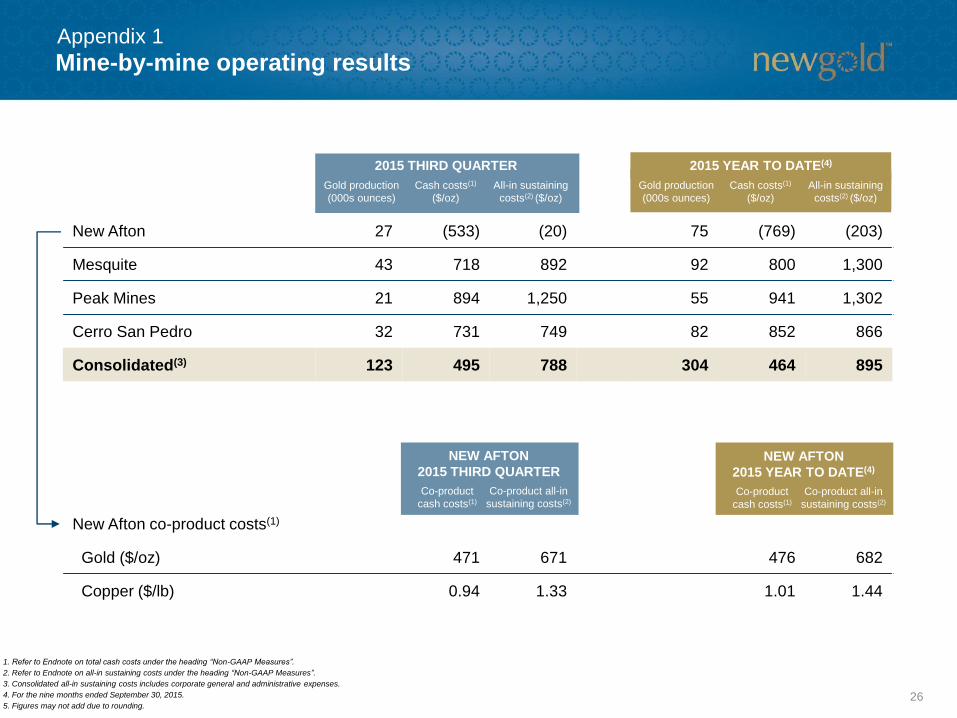
Appendix 1
New Afton 27 (533) (20) 75 (769) (203)
Mesquite 43 718 892 92 800 1,300
Peak Mines 21 894 1,250 55 941 1,302
Cerro San Pedro 32 731 749 82 852 866
Consolidated(3) 123 495 788 304 464 895
New Afton co-product costs(1)
Gold ($/oz) 471 671 476 682
Copper ($/lb) 0.94 1.33 1.01 1.44
2015 THIRD QUARTER
Gold production
(000s ounces)
Cash costs(1)
($/oz)
All-in sustaining
costs(2) ($/oz)
2015 YEAR TO DATE(4)
Gold production
(000s ounces)
Cash costs(1)
($/oz)
All-in sustaining
costs(2) ($/oz)
NEW AFTON
2015 THIRD QUARTER
Co-product
cash costs(1)
Co-product all-in
sustaining costs(2)
NEW AFTON
2015 YEAR TO DATE(4)
Co-product
cash costs(1)
Co-product all-in
sustaining costs(2)
Mine-by-mine operating results
1. Refer to Endnote on total cash costs under the heading “Non-GAAP Measures”.
2. Refer to Endnote on all-in sustaining costs under the heading “Non-GAAP Measures”.
3. Consolidated all-in sustaining costs includes corporate general and administrative expenses.
4. For the nine months ended September 30, 2015.
5. Figures may not add due to rounding.
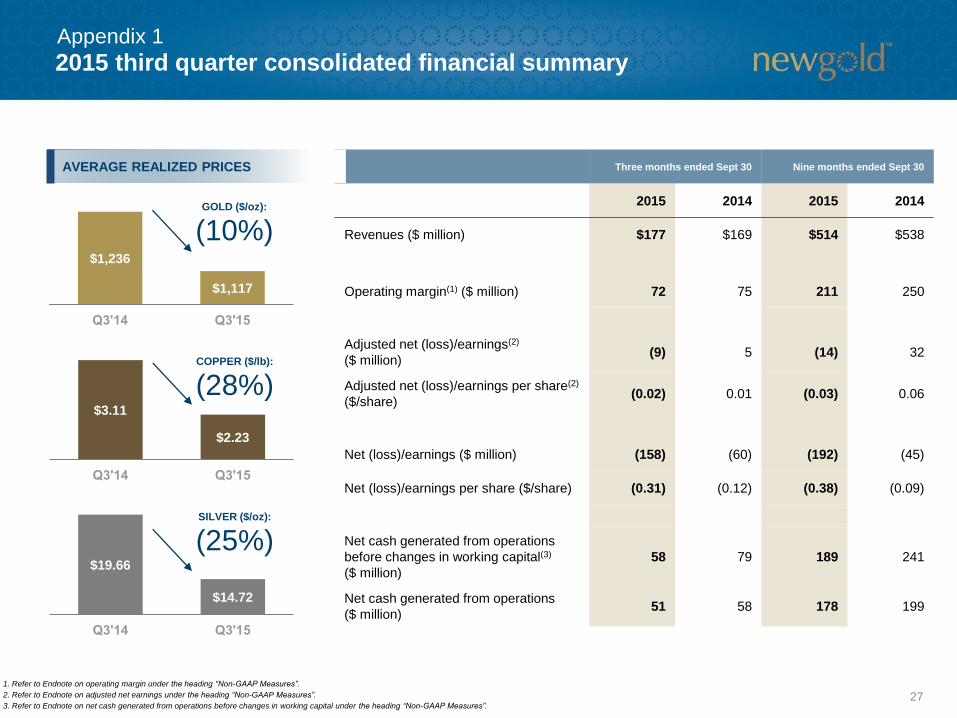
2015 third quarter consolidated financial summary
27
Appendix 1
Three months ended Sept 30 Nine months ended Sept 30
2015 2014 2015 2014
Revenues ($ million) $177 $169 $514 $538
Operating margin(1) ($ million) 72 75 211 250
Adjusted net (loss)/earnings(2)
($ million)(9) 5 (14) 32
Adjusted net (loss)/earnings per share(2)
($/share)(0.02) 0.01 (0.03) 0.06
Net (loss)/earnings ($ million) (158) (60) (192) (45)
Net (loss)/earnings per share ($/share) (0.31) (0.12) (0.38) (0.09)
Net cash generated from operations
before changes in working capital(3)
($ million)
58 79 189 241
Net cash generated from operations
($ million)51 58 178 199
AVERAGE REALIZED PRICES
$1,236
$1,117
GOLD ($/oz):
(10%)
$3.11
$2.23
COPPER ($/lb):
(28%)
$19.66
$14.72
SILVER ($/oz):
(25%)
1. Refer to Endnote on operating margin under the heading “Non-GAAP Measures”.
2. Refer to Endnote on adjusted net earnings under the heading “Non-GAAP Measures”.
3. Refer to Endnote on net cash generated from operations before changes in working capital under the heading “Non-GAAP Measures”.
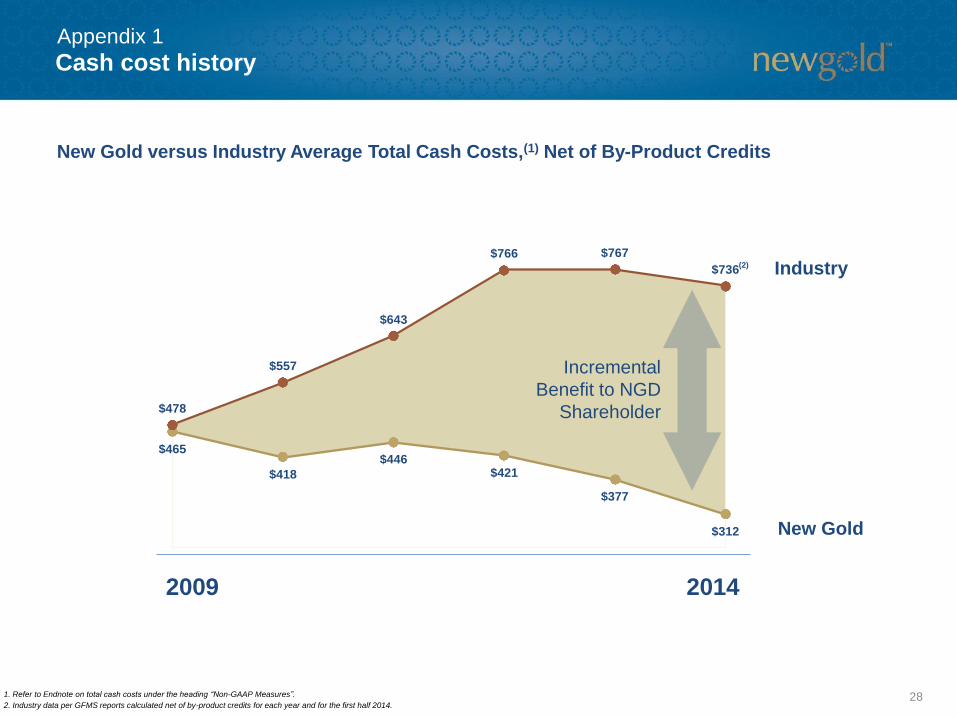
$465
$418
$446 $421
$377
$312
$478
$557
$643
$766 $767
$736
28
Cash cost history
Industry
New Gold
2014
Incremental
Benefit to NGD
Shareholder
2009
(2)
New Gold versus Industry Average Total Cash Costs,(1) Net of By-Product Credits
1. Refer to Endnote on total cash costs under the heading “Non-GAAP Measures”.
2. Industry data per GFMS reports calculated net of by-product credits for each year and for the first half 2014.
Appendix 1
29
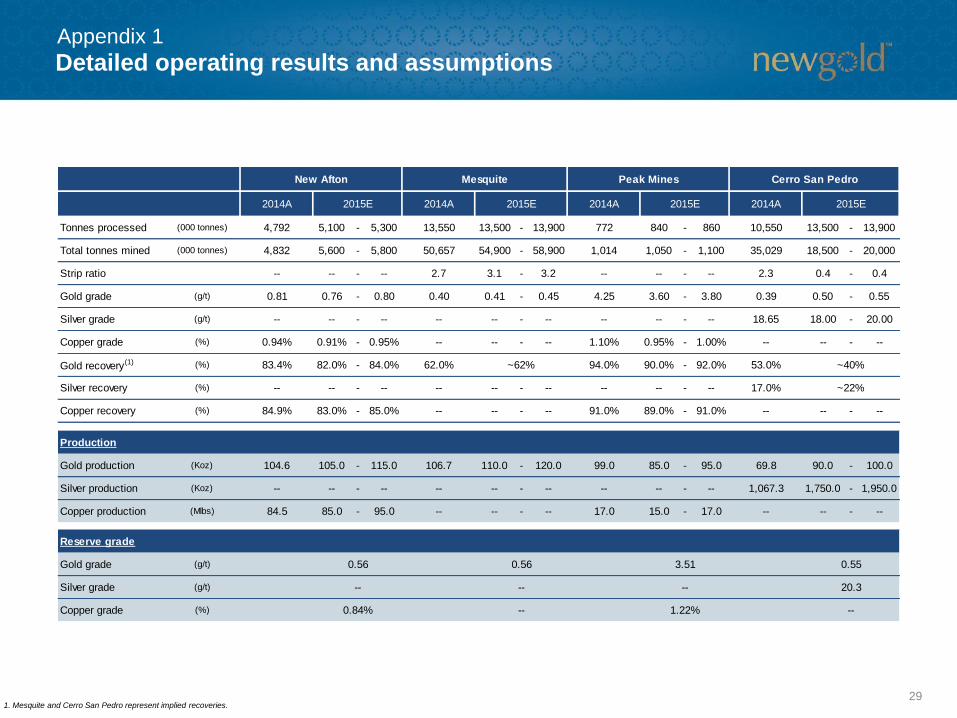
Detailed operating results and assumptionsAppendix 1
2014A 2014A 2014A 2014A
Tonnes processed (000 tonnes) 4,792 5,100 - 5,300 13,550 13,500 - 13,900 772 840 - 860 10,550 13,500 - 13,900
Total tonnes mined (000 tonnes) 4,832 5,600 - 5,800 50,657 54,900 - 58,900 1,014 1,050 - 1,100 35,029 18,500 - 20,000
Strip ratio -- -- - -- 2.7 3.1 - 3.2 -- -- - -- 2.3 0.4 - 0.4
Gold grade (g/t) 0.81 0.76 - 0.80 0.40 0.41 - 0.45 4.25 3.60 - 3.80 0.39 0.50 - 0.55
Silver grade (g/t) -- -- - -- -- -- - -- -- -- - -- 18.65 18.00 - 20.00
Copper grade (%) 0.94% 0.91% - 0.95% -- -- - -- 1.10% 0.95% - 1.00% -- -- - --
Gold recovery(1) (%) 83.4% 82.0% - 84.0% 62.0% 94.0% 90.0% - 92.0% 53.0%
Silver recovery (%) -- -- - -- -- -- - -- -- -- - -- 17.0%
Copper recovery (%) 84.9% 83.0% - 85.0% -- -- - -- 91.0% 89.0% - 91.0% -- -- - --
Production
Gold production (Koz) 104.6 105.0 - 115.0 106.7 110.0 - 120.0 99.0 85.0 - 95.0 69.8 90.0 - 100.0
Silver production (Koz) -- -- - -- -- -- - -- -- -- - -- 1,067.3 1,750.0 - 1,950.0
Copper production (Mlbs) 84.5 85.0 - 95.0 -- -- - -- 17.0 15.0 - 17.0 -- -- - --
Reserve grade
Gold grade (g/t)
Silver grade (g/t)
Copper grade (%)
0.56
--
0.84%
0.56
--
--
Mesquite
2015E 2015E
New Afton Cerro San Pedro
2015E
Peak Mines
2015E
~40%
~22%
~62%
0.55
20.3
--
3.51
--
1.22%
1. Mesquite and Cerro San Pedro represent implied recoveries.
30
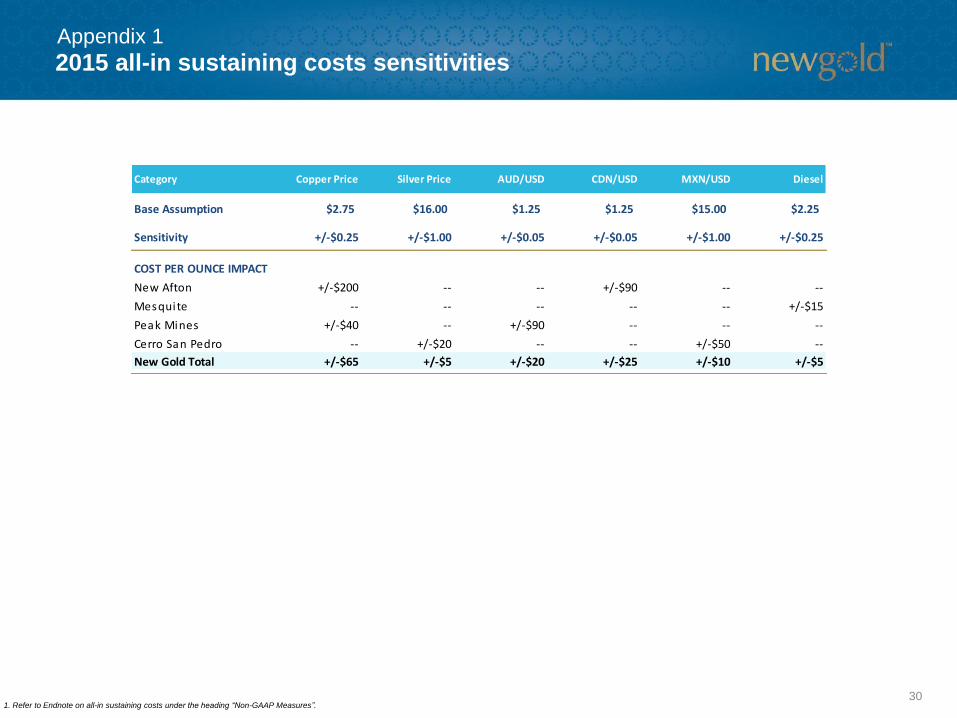
2015 all-in sustaining costs sensitivities
1. Refer to Endnote on all-in sustaining costs under the heading “Non-GAAP Measures”.
Appendix 1
Category Copper Price Silver Price AUD/USD CDN/USD MXN/USD Diesel
Base Assumption $2.75 $16.00 $1.25 $1.25 $15.00 $2.25
Sensitivity +/-$0.25 +/-$1.00 +/-$0.05 +/-$0.05 +/-$1.00 +/-$0.25
COST PER OUNCE IMPACT
New Afton +/-$200 -- -- +/-$90 -- --
Mesquite -- -- -- -- -- +/-$15
Peak Mines +/-$40 -- +/-$90 -- -- --
Cerro San Pedro -- +/-$20 -- -- +/-$50 --
New Gold Total +/-$65 +/-$5 +/-$20 +/-$25 +/-$10 +/-$5
31
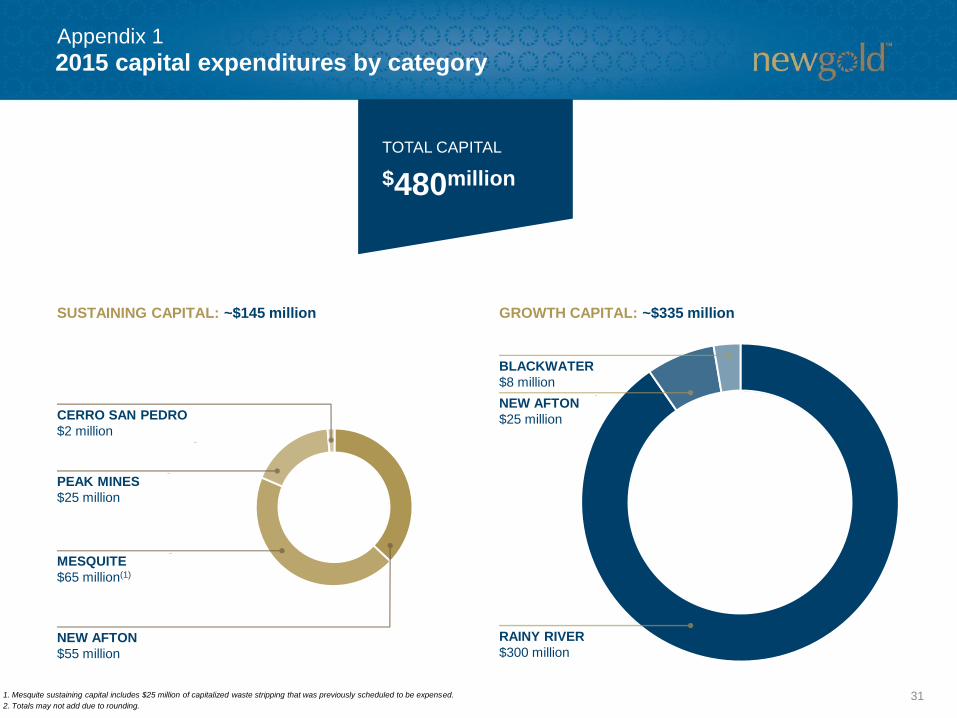
2015 capital expenditures by category
TOTAL CAPITAL
$480million
SUSTAINING CAPITAL: ~$145 million GROWTH CAPITAL: ~$335 million
NEW AFTON
$55 million
MESQUITE
$65 million(1)
PEAK MINES
$25 million
CERRO SAN PEDRO
$2 million
RAINY RIVER
$300 million
NEW AFTON
$25 million
BLACKWATER
$8 million
1. Mesquite sustaining capital includes $25 million of capitalized waste stripping that was previously scheduled to be expensed.
2. Totals may not add due to rounding.
Appendix 1
32
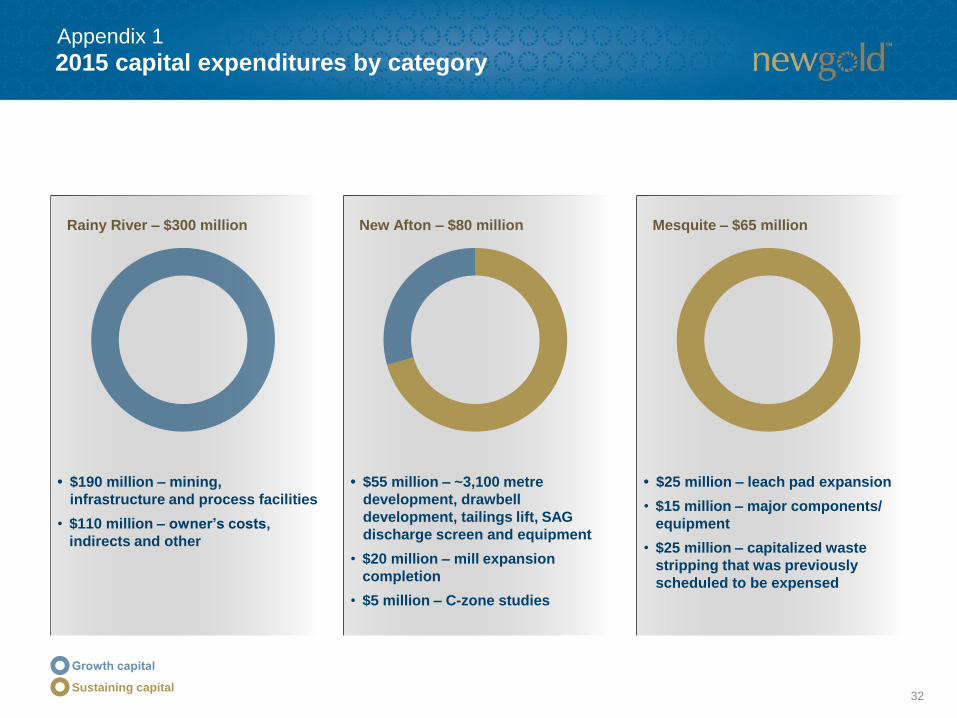
2015 capital expenditures by category
Rainy River – $300 million New Afton – $80 million Mesquite – $65 million
• $190 million – mining,
infrastructure and process facilities
• $110 million – owner’s costs,
indirects and other
• $55 million – ~3,100 metre
development, drawbell
development, tailings lift, SAG
discharge screen and equipment
• $20 million – mill expansion
completion
• $5 million – C-zone studies
• $25 million – leach pad expansion
• $15 million – major components/
equipment
• $25 million – capitalized waste
stripping that was previously
scheduled to be expensed
Sustaining capital
Appendix 1
33
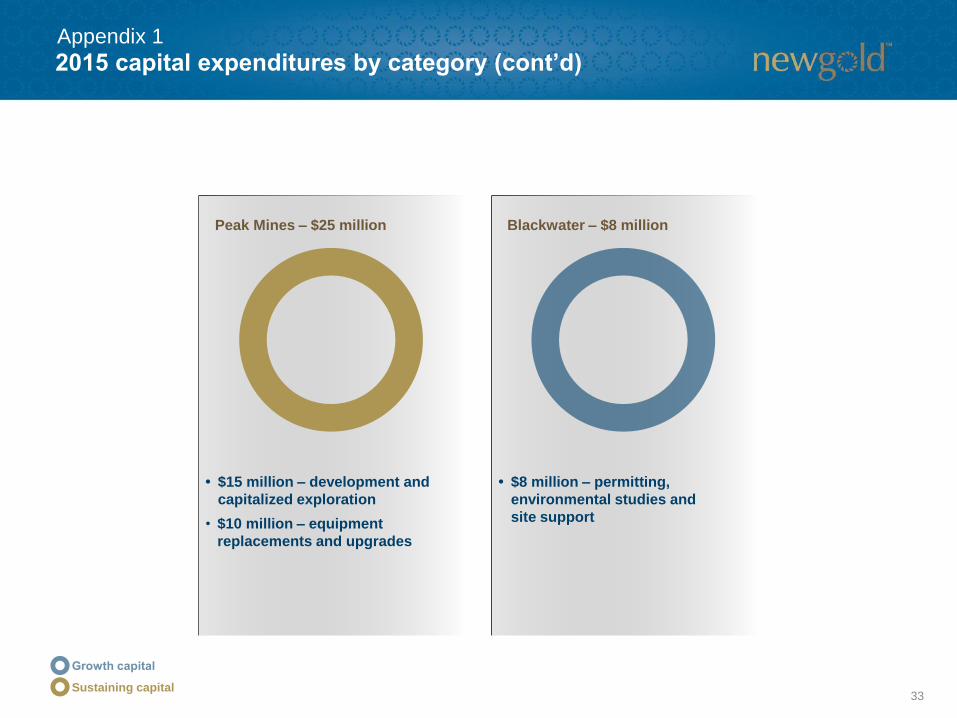
2015 capital expenditures by category (cont’d)
Peak Mines – $25 million Blackwater – $8 million
• $15 million – development and
capitalized exploration
• $10 million – equipment
replacements and upgrades
• $8 million – permitting,
environmental studies and
site support
Sustaining capital
Appendix 1
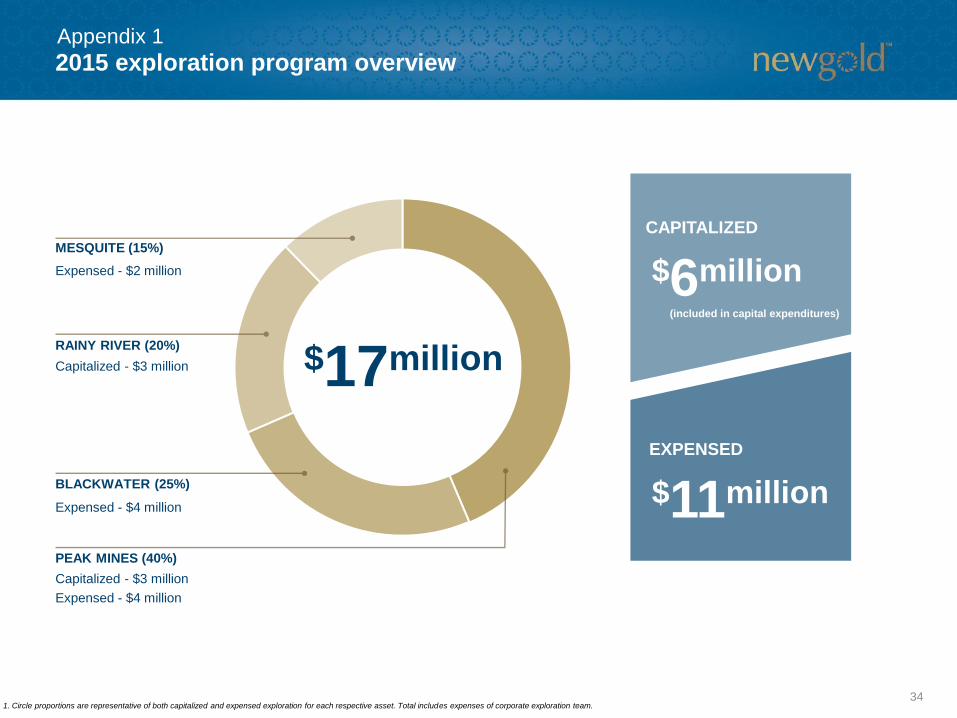
2015 exploration program overview
34
MESQUITE (15%)
PEAK MINES (40%)
RAINY RIVER (20%)
BLACKWATER (25%)
1. Circle proportions are representative of both capitalized and expensed exploration for each respective asset. Total includes expenses of corporate exploration team.
$17million
EXPENSED
CAPITALIZED
$6million
$11million
(included in capital expenditures)
Expensed - $2 million
Capitalized - $3 million
Expensed - $4 million
Capitalized - $3 million
Expensed - $4 million
Appendix 1
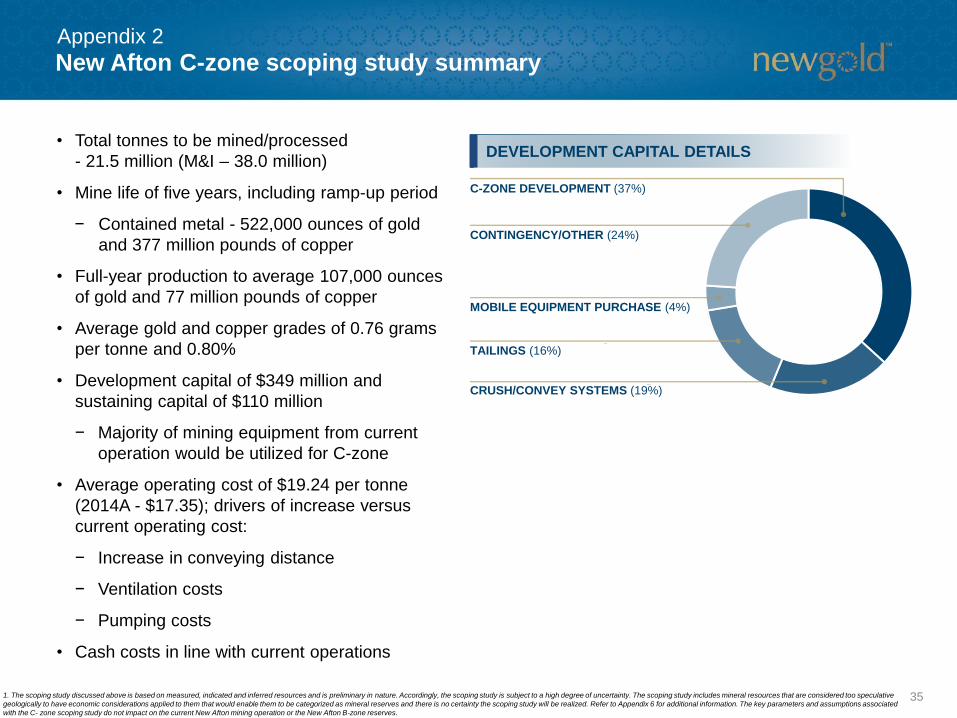
New Afton C-zone scoping study summary
35
• Total tonnes to be mined/processed
- 21.5 million (M&I – 38.0 million)
• Mine life of five years, including ramp-up period
− Contained metal - 522,000 ounces of gold
and 377 million pounds of copper
• Full-year production to average 107,000 ounces
of gold and 77 million pounds of copper
• Average gold and copper grades of 0.76 grams
per tonne and 0.80%
• Development capital of $349 million and
sustaining capital of $110 million
− Majority of mining equipment from current
operation would be utilized for C-zone
• Average operating cost of $19.24 per tonne
(2014A - $17.35); drivers of increase versus
current operating cost:
− Increase in conveying distance
− Ventilation costs
− Pumping costs
• Cash costs in line with current operations
DEVELOPMENT CAPITAL DETAILS
1. The scoping study discussed above is based on measured, indicated and inferred resources and is preliminary in nature. Accordingly, the scoping study is subject to a high degree of uncertainty. The scoping study includes mineral resources that are considered too speculative
geologically to have economic considerations applied to them that would enable them to be categorized as mineral reserves and there is no certainty the scoping study will be realized. Refer to Appendix 6 for additional information. The key parameters and assumptions associated
with the C- zone scoping study do not impact on the current New Afton mining operation or the New Afton B-zone reserves.
CRUSH/CONVEY SYSTEMS (19%)
TAILINGS (16%)
CONTINGENCY/OTHER (24%)
C-ZONE DEVELOPMENT (37%)
MOBILE EQUIPMENT PURCHASE (4%)
Appendix 2
New Afton C-zone opportunities and ongoing analysis
36
• Additional exploration drilling to expand and
increase resources
− Assess potential of increasing tonnes
mined from current 21.5 million tonnes
• Further test work to optimize flowsheet
ONGOING EVALUATIONOPPORTUNITIES
• Test work to confirm stabilization of tailings
within the existing facility through a
dewatering and consolidation program
• Ongoing monitoring, modelling and analysis
for mining subsidence impacts
• Optimize underground mine designs and
development schedule
• Baseline data collection to support
permitting
Appendix 2
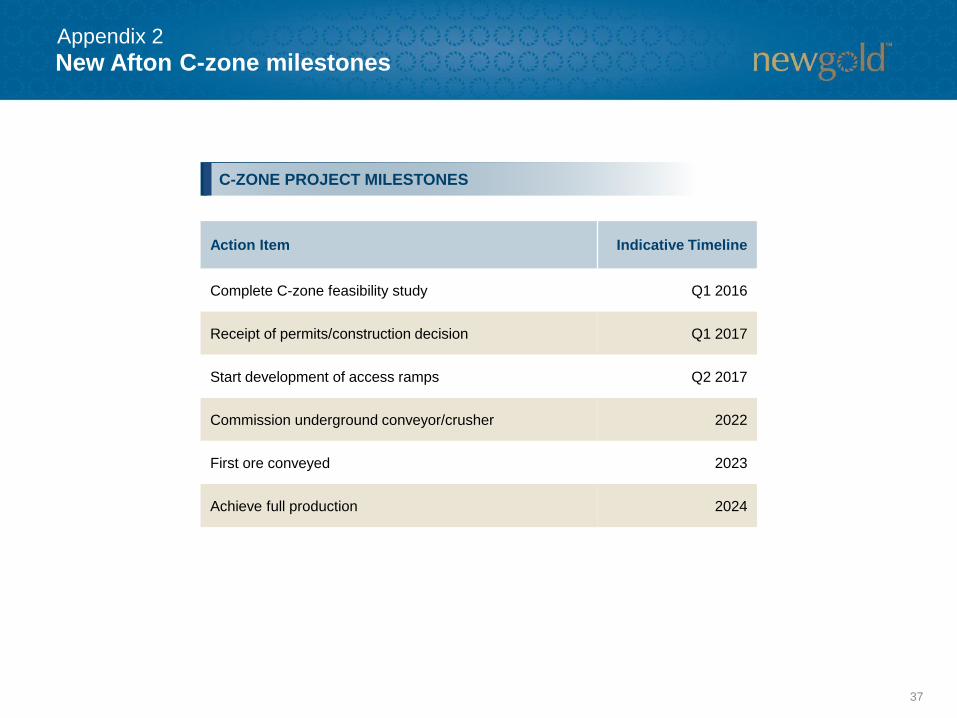
New Afton C-zone milestones
37
C-ZONE PROJECT MILESTONES
Action Item Indicative Timeline
Complete C-zone feasibility study Q1 2016
Receipt of permits/construction decision Q1 2017
Start development of access ramps Q2 2017
Commission underground conveyor/crusher 2022
First ore conveyed 2023
Achieve full production 2024
Appendix 2
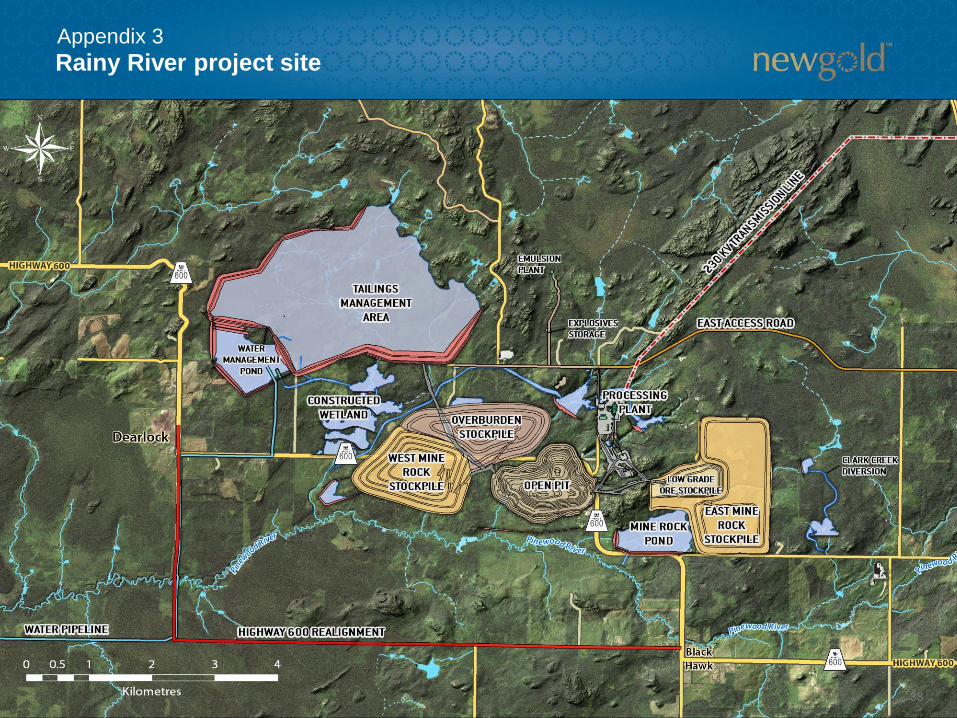
Rainy River project site
38
Appendix 3
39
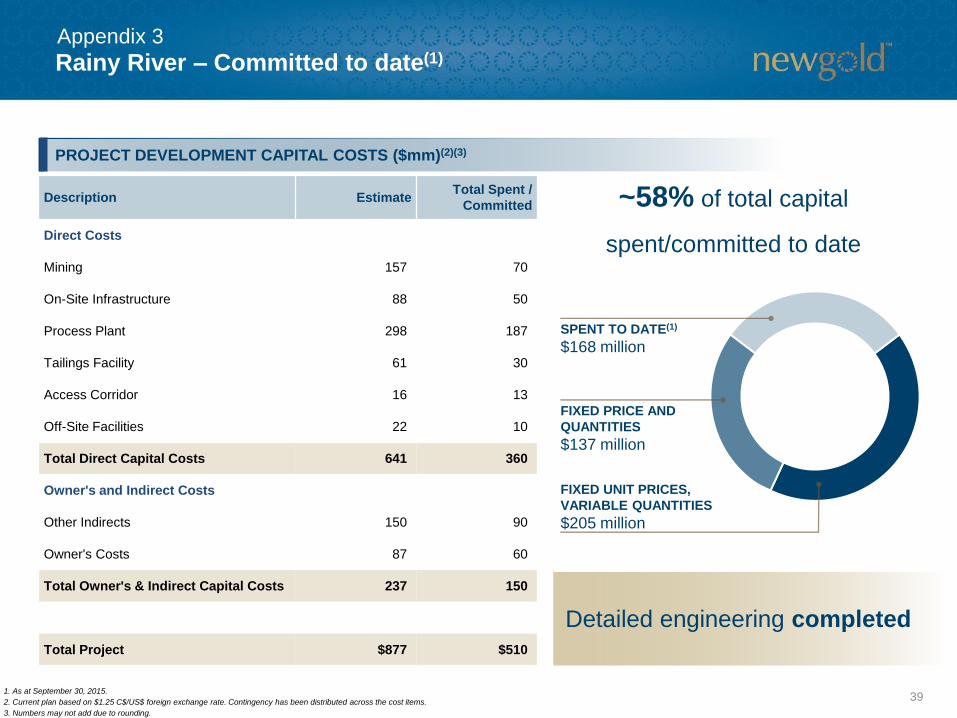
Rainy River – Committed to date(1)
Appendix 3
Description EstimateTotal Spent /
Committed
Direct Costs
Mining 157 70
On-Site Infrastructure 88 50
Process Plant 298 187
Tailings Facility 61 30
Access Corridor 16 13
Off-Site Facilities 22 10
Total Direct Capital Costs 641 360
Owner's and Indirect Costs
Other Indirects 150 90
Owner's Costs 87 60
Total Owner's & Indirect Capital Costs 237 150
Total Project $877 $510
PROJECT DEVELOPMENT CAPITAL COSTS ($mm)(2)(3)
~58% of total capital
spent/committed to date
SPENT TO DATE(1)
$168 million
FIXED PRICE AND
QUANTITIES
$137 million
FIXED UNIT PRICES,
VARIABLE QUANTITIES
$205 million
Detailed engineering completed
1. As at September 30, 2015.
2. Current plan based on $1.25 C$/US$ foreign exchange rate. Contingency has been distributed across the cost items.
3. Numbers may not add due to rounding.
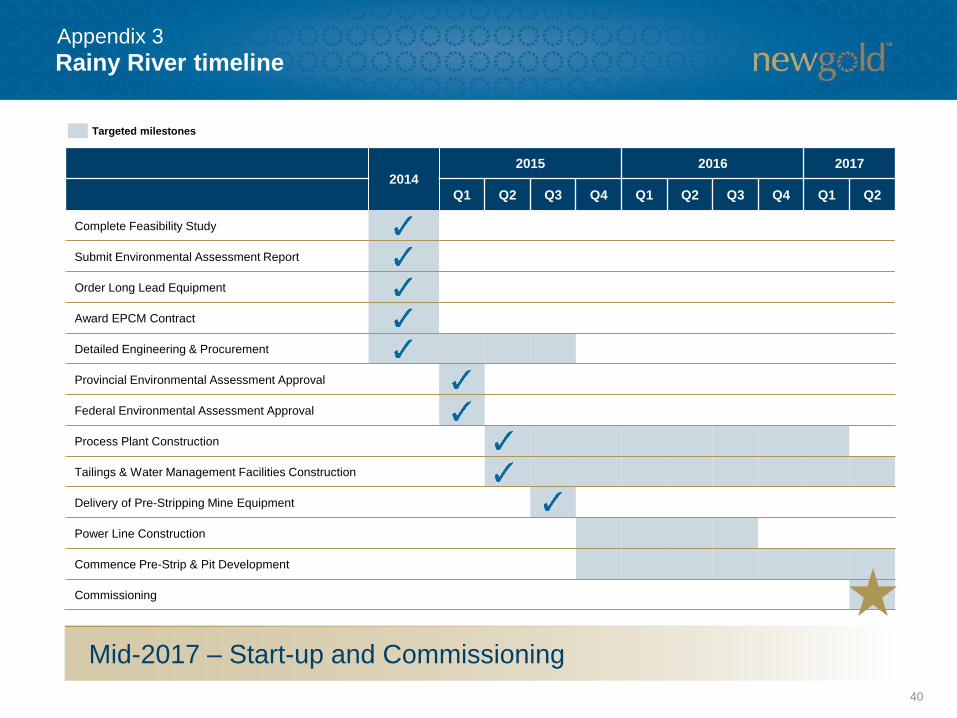
Rainy River timeline
40
Appendix 3
2014
2015 2016 2017
Q1 Q2 Q3 Q4 Q1 Q2 Q3 Q4 Q1 Q2
Complete Feasibility Study
Submit Environmental Assessment Report
Order Long Lead Equipment
Award EPCM Contract
Detailed Engineering & Procurement
Provincial Environmental Assessment Approval
Federal Environmental Assessment Approval
Process Plant Construction
Tailings & Water Management Facilities Construction
Delivery of Pre-Stripping Mine Equipment
Power Line Construction
Commence Pre-Strip & Pit Development
Commissioning
Targeted milestones
Mid-2017 – Start-up and Commissioning
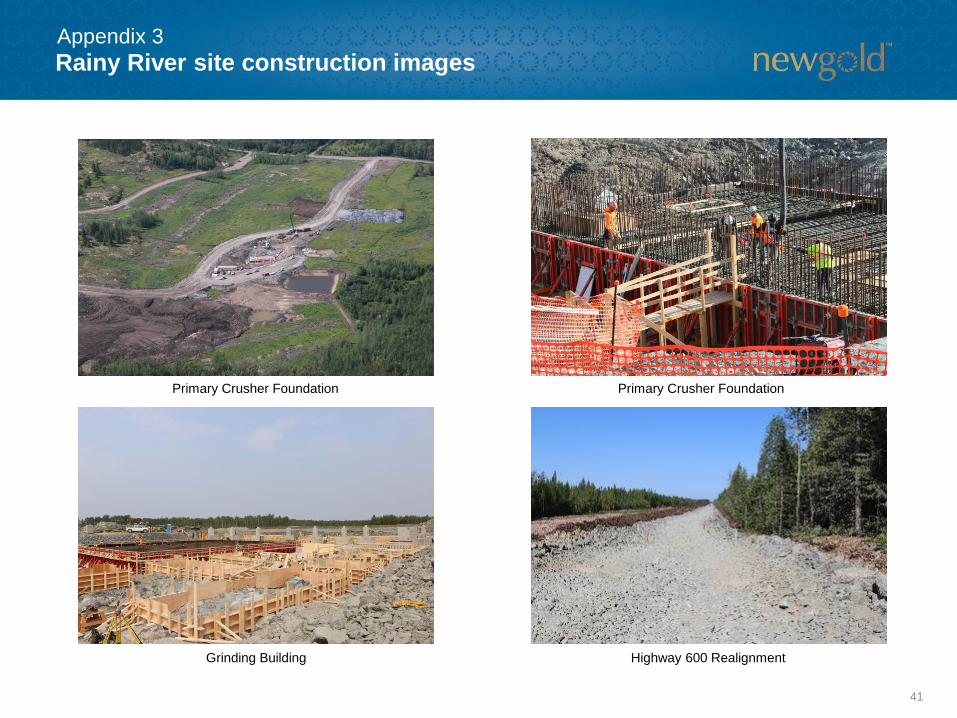
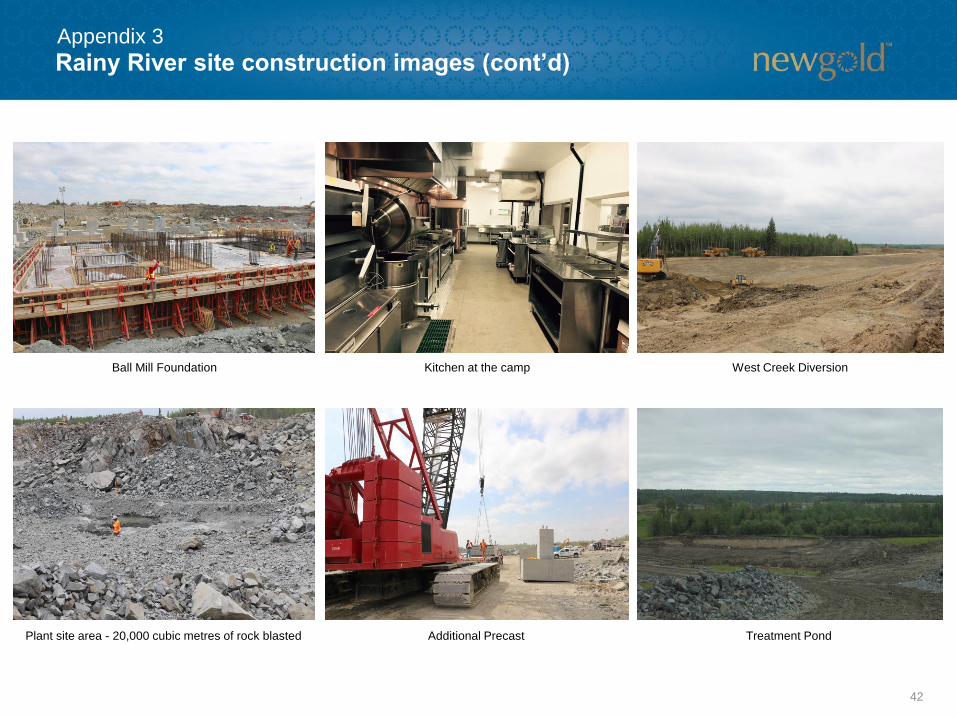
Rainy River site construction images
41
Appendix 3
Grinding Building
Primary Crusher Foundation
Highway 600 Realignment
Primary Crusher Foundation
Rainy River site construction images (cont’d)
42
Appendix 3
Ball Mill Foundation West Creek Diversion
Treatment PondPlant site area - 20,000 cubic metres of rock blasted
Kitchen at the camp
Additional Precast
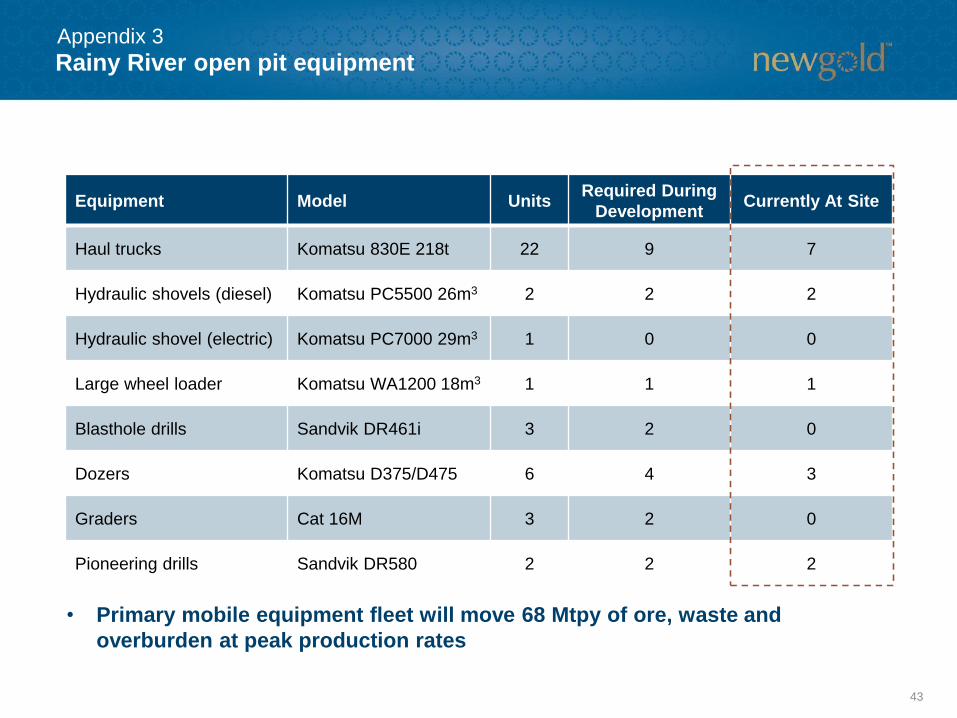
Rainy River open pit equipment
43
Appendix 3
• Primary mobile equipment fleet will move 68 Mtpy of ore, waste and
overburden at peak production rates
Equipment Model UnitsRequired During
DevelopmentCurrently At Site
Haul trucks Komatsu 830E 218t 22 9 7
Hydraulic shovels (diesel) Komatsu PC5500 26m3 2 2 2
Hydraulic shovel (electric) Komatsu PC7000 29m3 1 0 0
Large wheel loader Komatsu WA1200 18m3 1 1 1
Blasthole drills Sandvik DR461i 3 2 0
Dozers Komatsu D375/D475 6 4 3
Graders Cat 16M 3 2 0
Pioneering drills Sandvik DR580 2 2 2
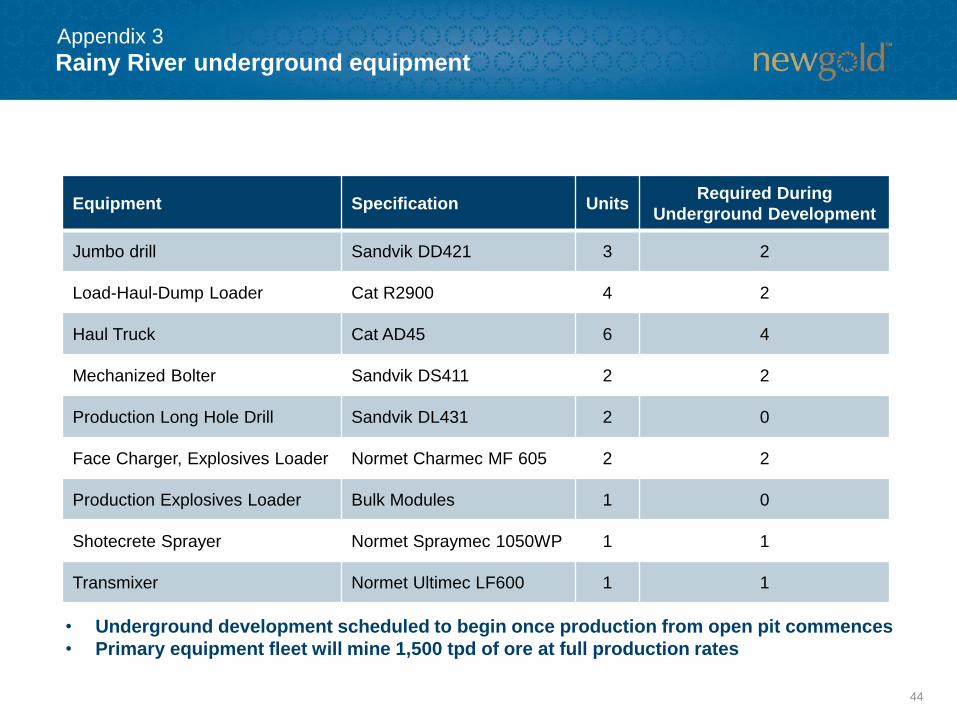
Rainy River underground equipment
44
Appendix 3
• Underground development scheduled to begin once production from open pit commences
• Primary equipment fleet will mine 1,500 tpd of ore at full production rates
Equipment Specification UnitsRequired During
Underground Development
Jumbo drill Sandvik DD421 3 2
Load-Haul-Dump Loader Cat R2900 4 2
Haul Truck Cat AD45 6 4
Mechanized Bolter Sandvik DS411 2 2
Production Long Hole Drill Sandvik DL431 2 0
Face Charger, Explosives Loader Normet Charmec MF 605 2 2
Production Explosives Loader Bulk Modules 1 0
Shotecrete Sprayer Normet Spraymec 1050WP 1 1
Transmixer Normet Ultimec LF600 1 1
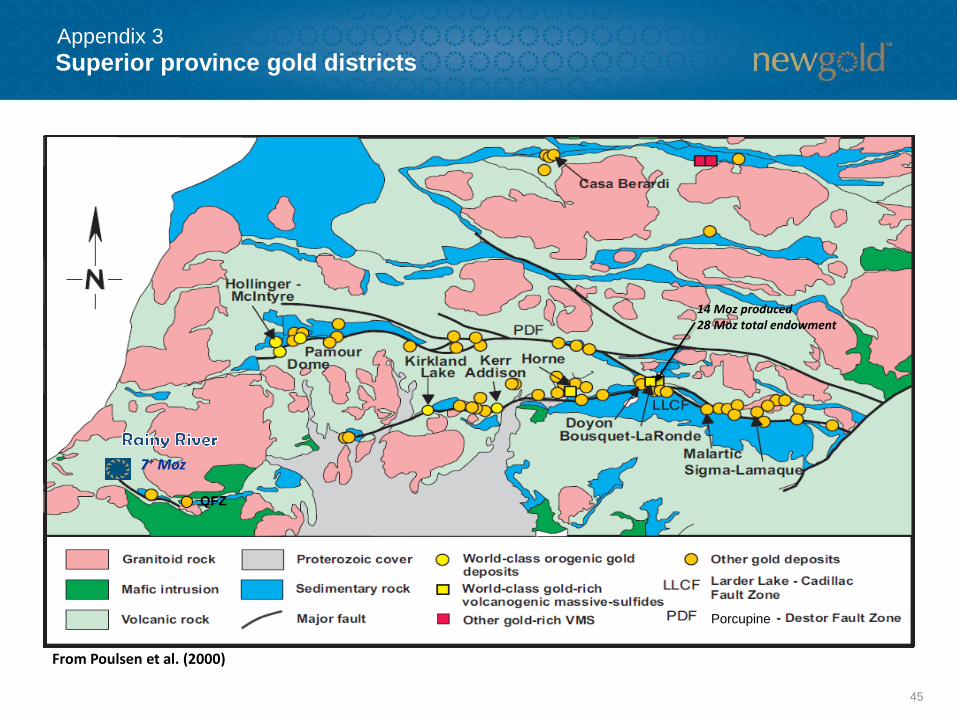
Superior province gold districts
45
Appendix 3
From Poulsen et al. (2000)
14 Moz produced28 Moz total endowment
7+ Moz
QFZ
Porcupine
46
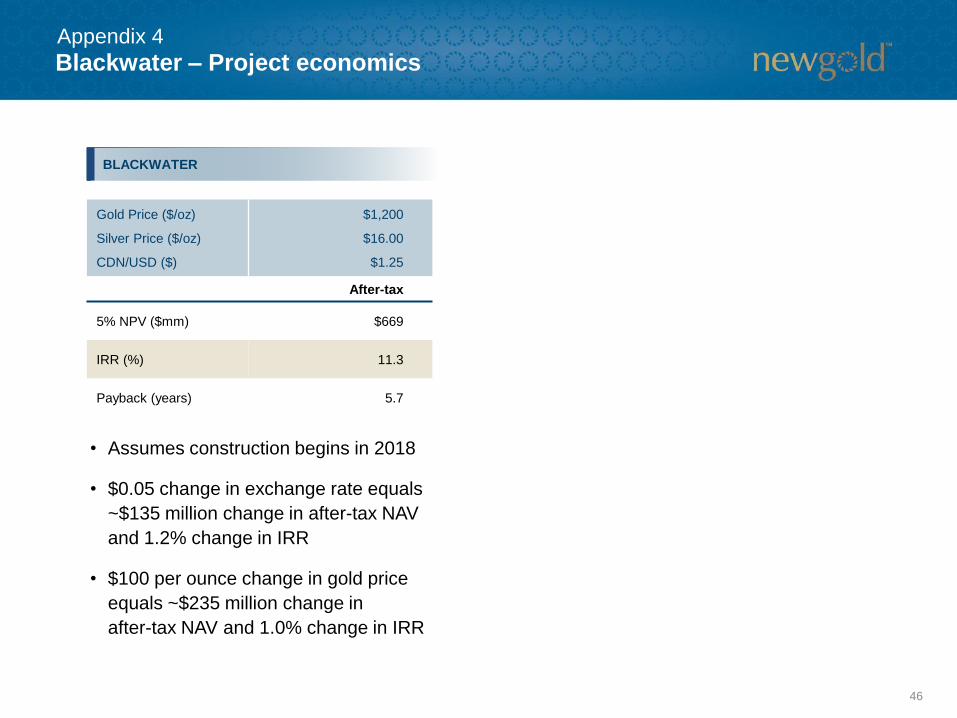
Blackwater – Project economics
BLACKWATER
• Assumes construction begins in 2018
• $0.05 change in exchange rate equals
~$135 million change in after-tax NAV
and 1.2% change in IRR
• $100 per ounce change in gold price
equals ~$235 million change in
after-tax NAV and 1.0% change in IRR
Gold Price ($/oz)
Silver Price ($/oz)
CDN/USD ($)
$1,200
$16.00
$1.25
After-tax
5% NPV ($mm) $669
IRR (%) 11.3
Payback (years) 5.7
Appendix 4
TRANSACTION HIGHLIGHTS
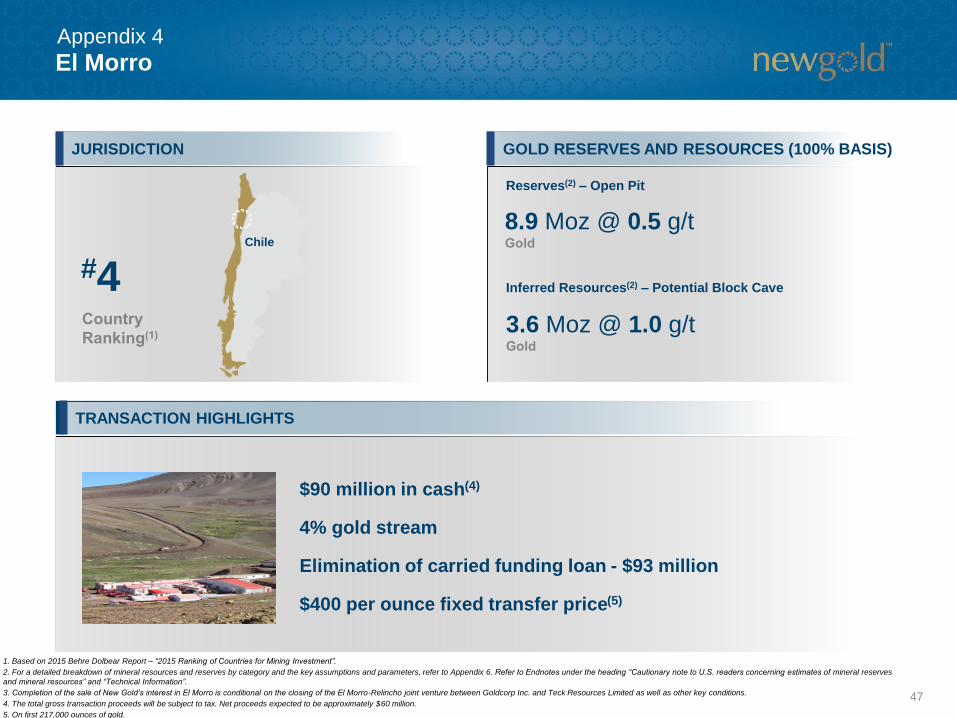
El Morro
47
#4
$90 million in cash(4)
4% gold stream
Elimination of carried funding loan - $93 million
$400 per ounce fixed transfer price(5)
JURISDICTION
1. Based on 2015 Behre Dolbear Report – “2015 Ranking of Countries for Mining Investment”.
2. For a detailed breakdown of mineral resources and reserves by category and the key assumptions and parameters, refer to Appendix 6. Refer to Endnotes under the heading “Cautionary note to U.S. readers concerning estimates of mineral reserves
and mineral resources” and “Technical Information”.
3. Completion of the sale of New Gold’s interest in El Morro is conditional on the closing of the El Morro-Relincho joint venture between Goldcorp Inc. and Teck Resources Limited as well as other key conditions.
4. The total gross transaction proceeds will be subject to tax. Net proceeds expected to be approximately $60 million.
5. On first 217,000 ounces of gold.
Chile
GOLD RESERVES AND RESOURCES (100% BASIS)
8.9 Moz @ 0.5 g/t
Reserves(2) – Open Pit
Inferred Resources(2) – Potential Block Cave
3.6 Moz @ 1.0 g/t
Appendix 4
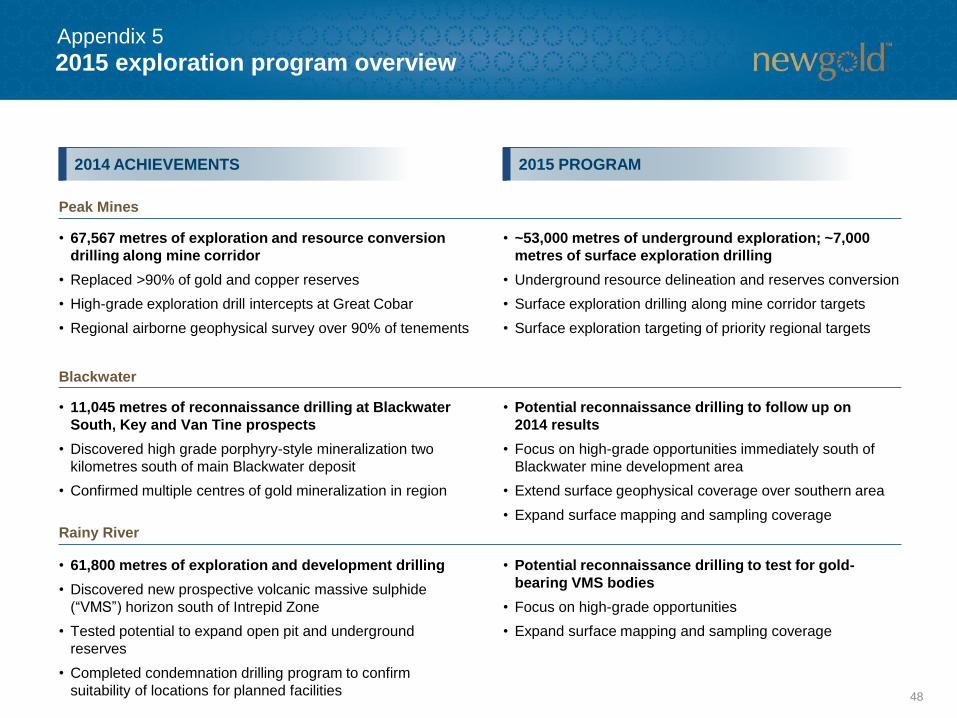
2015 exploration program overview
48
2015 PROGRAM2014 ACHIEVEMENTS
Peak Mines
Blackwater
Rainy River
• 67,567 metres of exploration and resource conversion
drilling along mine corridor
• Replaced >90% of gold and copper reserves
• High-grade exploration drill intercepts at Great Cobar
• Regional airborne geophysical survey over 90% of tenements
• ~53,000 metres of underground exploration; ~7,000
metres of surface exploration drilling
• Underground resource delineation and reserves conversion
• Surface exploration drilling along mine corridor targets
• Surface exploration targeting of priority regional targets
• 11,045 metres of reconnaissance drilling at Blackwater
South, Key and Van Tine prospects
• Discovered high grade porphyry-style mineralization two
kilometres south of main Blackwater deposit
• Confirmed multiple centres of gold mineralization in region
• Potential reconnaissance drilling to follow up on
2014 results
• Focus on high-grade opportunities immediately south of
Blackwater mine development area
• Extend surface geophysical coverage over southern area
• Expand surface mapping and sampling coverage
• 61,800 metres of exploration and development drilling
• Discovered new prospective volcanic massive sulphide
(“VMS”) horizon south of Intrepid Zone
• Tested potential to expand open pit and underground
reserves
• Completed condemnation drilling program to confirm
suitability of locations for planned facilities
• Potential reconnaissance drilling to test for gold-
bearing VMS bodies
• Focus on high-grade opportunities
• Expand surface mapping and sampling coverage
Appendix 5
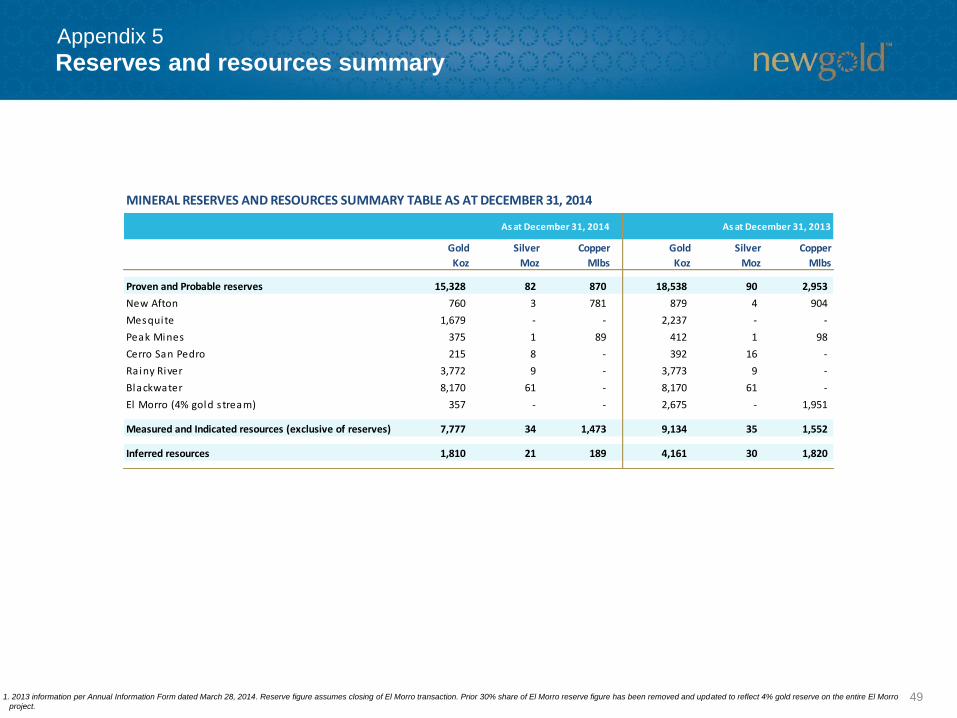
491. 2013 information per Annual Information Form dated March 28, 2014. Reserve figure assumes closing of El Morro transaction. Prior 30% share of El Morro reserve figure has been removed and updated to reflect 4% gold reserve on the entire El Morro
project.
Reserves and resources summaryAppendix 5
Gold
Koz
Silver
Moz
Copper
Mlbs
Gold
Koz
Silver
Moz
Copper
Mlbs
Proven and Probable reserves 15,328 82 870 18,538 90 2,953
New Afton 760 3 781 879 4 904
Mesquite 1,679 - - 2,237 - -
Peak Mines 375 1 89 412 1 98
Cerro San Pedro 215 8 - 392 16 -
Ra iny River 3,772 9 - 3,773 9 -
Blackwater 8,170 61 - 8,170 61 -
El Morro (4% gold s tream) 357 - - 2,675 - 1,951
Measured and Indicated resources (exclusive of reserves) 7,777 34 1,473 9,134 35 1,552
Inferred resources 1,810 21 189 4,161 30 1,820
MINERAL RESERVES AND RESOURCES SUMMARY TABLE AS AT DECEMBER 31, 2014
As at December 31, 2014 As at December 31, 2013
50
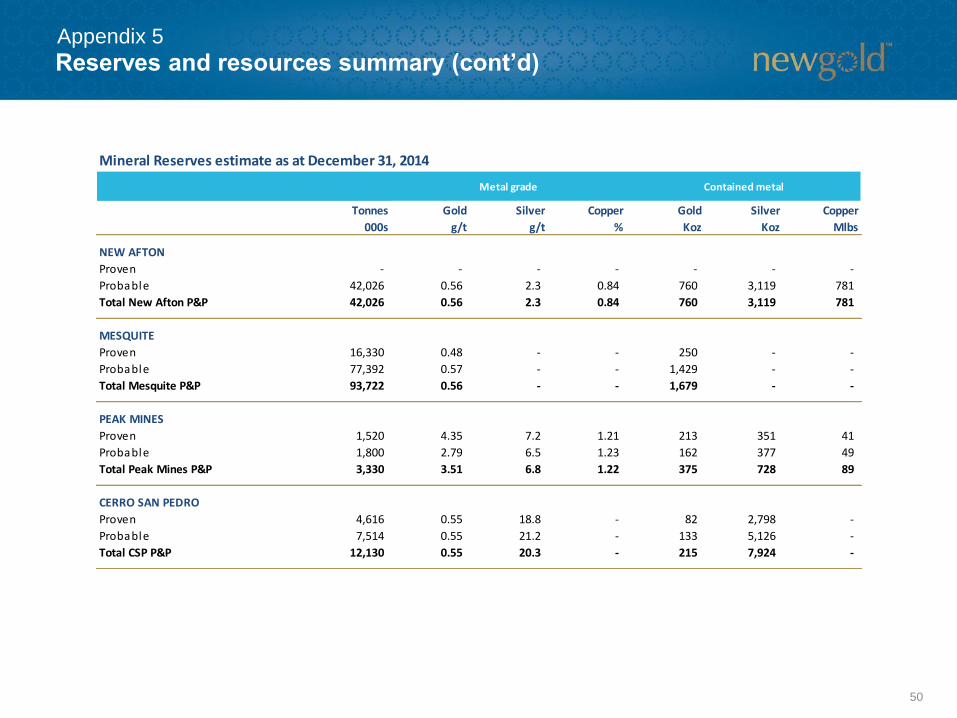
Reserves and resources summary (cont’d)Appendix 5
Mineral Reserves estimate as at December 31, 2014
Tonnes
000s
Gold
g/t
Silver
g/t
Copper
%
Gold
Koz
Silver
Koz
Copper
Mlbs
NEW AFTON
Proven - - - - - - -
Probable 42,026 0.56 2.3 0.84 760 3,119 781
Total New Afton P&P 42,026 0.56 2.3 0.84 760 3,119 781
MESQUITE
Proven 16,330 0.48 - - 250 - -
Probable 77,392 0.57 - - 1,429 - -
Total Mesquite P&P 93,722 0.56 - - 1,679 - -
PEAK MINES
Proven 1,520 4.35 7.2 1.21 213 351 41
Probable 1,800 2.79 6.5 1.23 162 377 49
Total Peak Mines P&P 3,330 3.51 6.8 1.22 375 728 89
CERRO SAN PEDRO
Proven 4,616 0.55 18.8 - 82 2,798 -
Probable 7,514 0.55 21.2 - 133 5,126 -
Total CSP P&P 12,130 0.55 20.3 - 215 7,924 -
Metal grade Contained metal
51
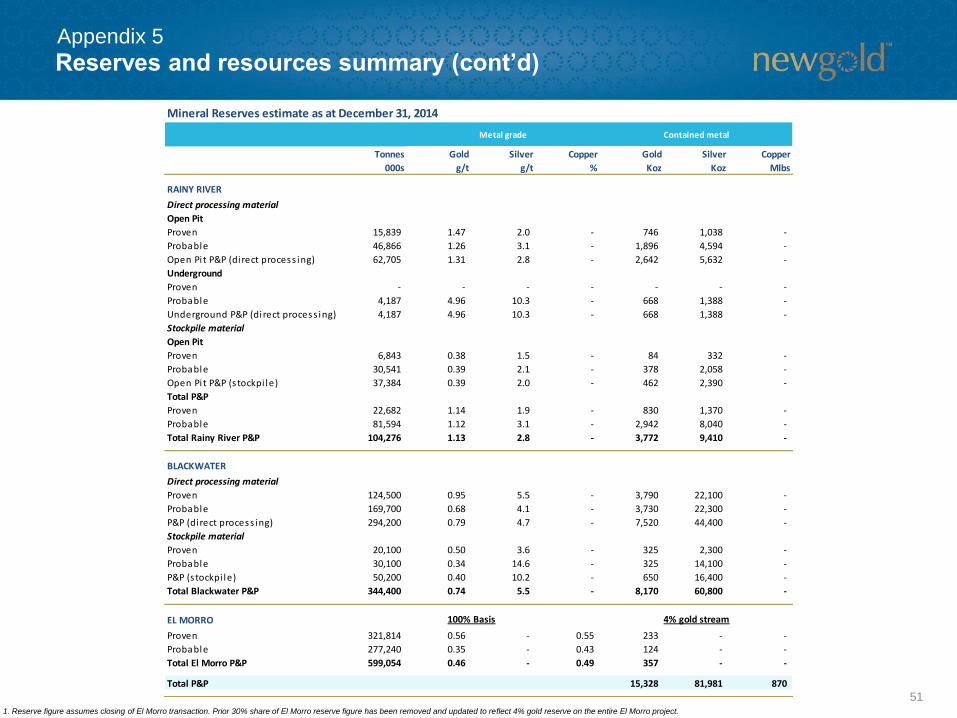
Reserves and resources summary (cont’d)Appendix 5
Mineral Reserves estimate as at December 31, 2014
Tonnes
000s
Gold
g/t
Silver
g/t
Copper
%
Gold
Koz
Silver
Koz
Copper
Mlbs
RAINY RIVER
Direct processing material
Open Pit
Proven 15,839 1.47 2.0 - 746 1,038 -
Probable 46,866 1.26 3.1 - 1,896 4,594 -
Open Pi t P&P (direct process ing) 62,705 1.31 2.8 - 2,642 5,632 -
Underground
Proven - - - - - - -
Probable 4,187 4.96 10.3 - 668 1,388 -
Underground P&P (direct process ing) 4,187 4.96 10.3 - 668 1,388 -
Stockpile material
Open Pit
Proven 6,843 0.38 1.5 - 84 332 -
Probable 30,541 0.39 2.1 - 378 2,058 -
Open Pi t P&P (s tockpi le) 37,384 0.39 2.0 - 462 2,390 -
Total P&P
Proven 22,682 1.14 1.9 - 830 1,370 -
Probable 81,594 1.12 3.1 - 2,942 8,040 -
Total Rainy River P&P 104,276 1.13 2.8 - 3,772 9,410 -
BLACKWATER
Direct processing material
Proven 124,500 0.95 5.5 - 3,790 22,100 -
Probable 169,700 0.68 4.1 - 3,730 22,300 -
P&P (direct process ing) 294,200 0.79 4.7 - 7,520 44,400 -
Stockpile material
Proven 20,100 0.50 3.6 - 325 2,300 -
Probable 30,100 0.34 14.6 - 325 14,100 -
P&P (s tockpi le) 50,200 0.40 10.2 - 650 16,400 -
Total Blackwater P&P 344,400 0.74 5.5 - 8,170 60,800 -
EL MORRO
Proven 321,814 0.56 - 0.55 233 - -
Probable 277,240 0.35 - 0.43 124 - -
Total El Morro P&P 599,054 0.46 - 0.49 357 - -
Total P&P 15,328 81,981 870
Metal grade Contained metal
100% Basis 4% gold stream
1. Reserve figure assumes closing of El Morro transaction. Prior 30% share of El Morro reserve figure has been removed and updated to reflect 4% gold reserve on the entire El Morro project.
52
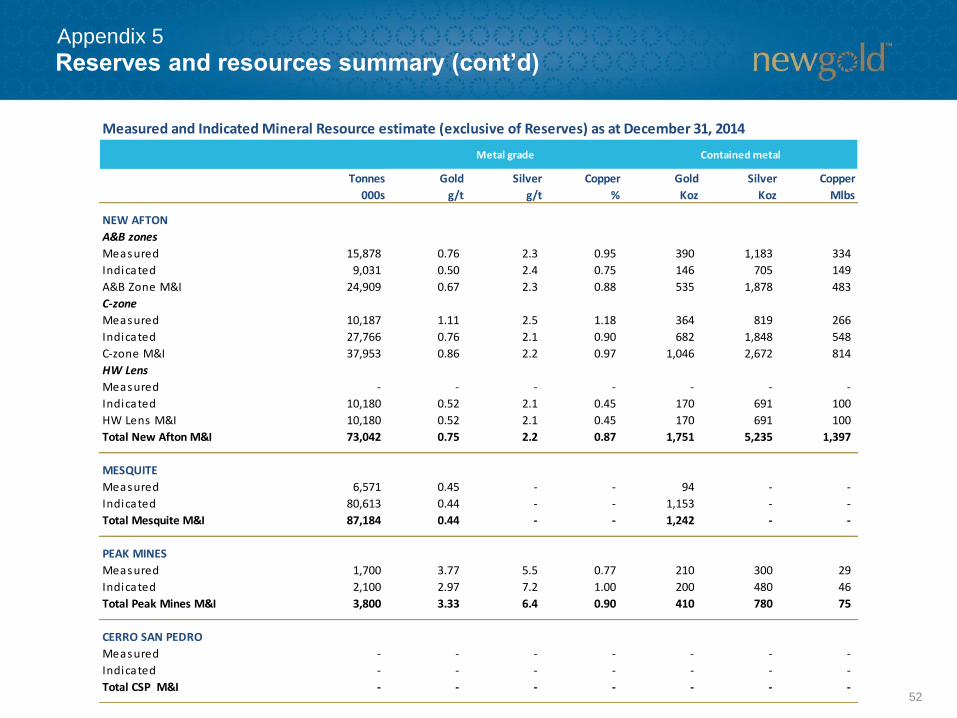
Reserves and resources summary (cont’d)Appendix 5
Measured and Indicated Mineral Resource estimate (exclusive of Reserves) as at December 31, 2014
Tonnes
000s
Gold
g/t
Silver
g/t
Copper
%
Gold
Koz
Silver
Koz
Copper
Mlbs
NEW AFTON
A&B zones
Measured 15,878 0.76 2.3 0.95 390 1,183 334
Indicated 9,031 0.50 2.4 0.75 146 705 149
A&B Zone M&I 24,909 0.67 2.3 0.88 535 1,878 483
C-zone
Measured 10,187 1.11 2.5 1.18 364 819 266
Indicated 27,766 0.76 2.1 0.90 682 1,848 548
C-zone M&I 37,953 0.86 2.2 0.97 1,046 2,672 814
HW Lens
Measured - - - - - - -
Indicated 10,180 0.52 2.1 0.45 170 691 100
HW Lens M&I 10,180 0.52 2.1 0.45 170 691 100
Total New Afton M&I 73,042 0.75 2.2 0.87 1,751 5,235 1,397
MESQUITE
Measured 6,571 0.45 - - 94 - -
Indicated 80,613 0.44 - - 1,153 - -
Total Mesquite M&I 87,184 0.44 - - 1,242 - -
PEAK MINES
Measured 1,700 3.77 5.5 0.77 210 300 29
Indicated 2,100 2.97 7.2 1.00 200 480 46
Total Peak Mines M&I 3,800 3.33 6.4 0.90 410 780 75
CERRO SAN PEDRO
Measured - - - - - - -
Indicated - - - - - - -
Total CSP M&I - - - - - - -
Metal grade Contained metal
53
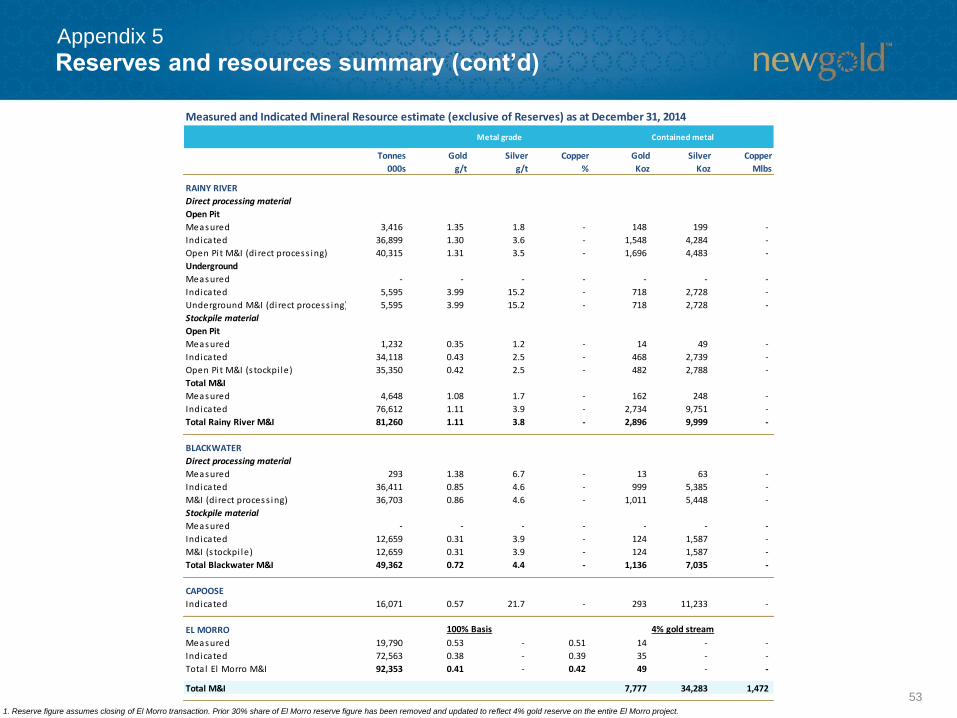
Reserves and resources summary (cont’d)Appendix 5
Measured and Indicated Mineral Resource estimate (exclusive of Reserves) as at December 31, 2014
Tonnes
000s
Gold
g/t
Silver
g/t
Copper
%
Gold
Koz
Silver
Koz
Copper
Mlbs
RAINY RIVER
Direct processing material
Open Pit
Measured 3,416 1.35 1.8 - 148 199 -
Indicated 36,899 1.30 3.6 - 1,548 4,284 -
Open Pi t M&I (direct process ing) 40,315 1.31 3.5 - 1,696 4,483 -
Underground
Measured - - - - - - -
Indicated 5,595 3.99 15.2 - 718 2,728 -
Underground M&I (direct process ing) 5,595 3.99 15.2 - 718 2,728 -
Stockpile material
Open Pit
Measured 1,232 0.35 1.2 - 14 49 -
Indicated 34,118 0.43 2.5 - 468 2,739 -
Open Pi t M&I (s tockpi le) 35,350 0.42 2.5 - 482 2,788 -
Total M&I
Measured 4,648 1.08 1.7 - 162 248 -
Indicated 76,612 1.11 3.9 - 2,734 9,751 -
Total Rainy River M&I 81,260 1.11 3.8 - 2,896 9,999 -
BLACKWATER
Direct processing material
Measured 293 1.38 6.7 - 13 63 -
Indicated 36,411 0.85 4.6 - 999 5,385 -
M&I (direct process ing) 36,703 0.86 4.6 - 1,011 5,448 -
Stockpile material
Measured - - - - - - -
Indicated 12,659 0.31 3.9 - 124 1,587 -
M&I (s tockpi le) 12,659 0.31 3.9 - 124 1,587 -
Total Blackwater M&I 49,362 0.72 4.4 - 1,136 7,035 -
CAPOOSE
Indicated 16,071 0.57 21.7 - 293 11,233 -
EL MORRO
Measured 19,790 0.53 - 0.51 14 - -
Indicated 72,563 0.38 - 0.39 35 - -
Total El Morro M&I 92,353 0.41 - 0.42 49 - -
Total M&I 7,777 34,283 1,472
Metal grade Contained metal
100% Basis 4% gold stream
1. Reserve figure assumes closing of El Morro transaction. Prior 30% share of El Morro reserve figure has been removed and updated to reflect 4% gold reserve on the entire El Morro project.
54
Reserves and resources summary (cont’d)Appendix 5
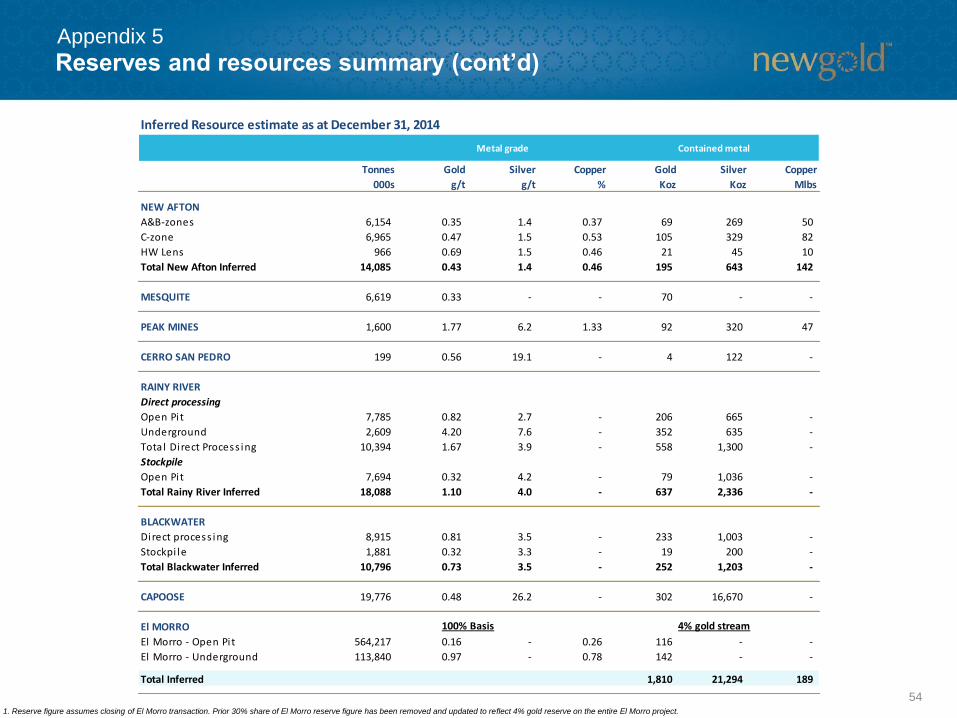
1. Reserve figure assumes closing of El Morro transaction. Prior 30% share of El Morro reserve figure has been removed and updated to reflect 4% gold reserve on the entire El Morro project.
Inferred Resource estimate as at December 31, 2014
Tonnes
000s
Gold
g/t
Silver
g/t
Copper
%
Gold
Koz
Silver
Koz
Copper
Mlbs
NEW AFTON
A&B-zones 6,154 0.35 1.4 0.37 69 269 50
C-zone 6,965 0.47 1.5 0.53 105 329 82
HW Lens 966 0.69 1.5 0.46 21 45 10
Total New Afton Inferred 14,085 0.43 1.4 0.46 195 643 142
MESQUITE 6,619 0.33 - - 70 - -
PEAK MINES 1,600 1.77 6.2 1.33 92 320 47
CERRO SAN PEDRO 199 0.56 19.1 - 4 122 -
RAINY RIVER
Direct processing
Open Pit 7,785 0.82 2.7 - 206 665 -
Underground 2,609 4.20 7.6 - 352 635 -
Total Direct Process ing 10,394 1.67 3.9 - 558 1,300 -
Stockpile
Open Pit 7,694 0.32 4.2 - 79 1,036 -
Total Rainy River Inferred 18,088 1.10 4.0 - 637 2,336 -
BLACKWATER
Direct process ing 8,915 0.81 3.5 - 233 1,003 -
Stockpi le 1,881 0.32 3.3 - 19 200 -
Total Blackwater Inferred 10,796 0.73 3.5 - 252 1,203 -
CAPOOSE 19,776 0.48 26.2 - 302 16,670 -
El MORRO
El Morro - Open Pi t 564,217 0.16 - 0.26 116 - -
El Morro - Underground 113,840 0.97 - 0.78 142 - -
Total Inferred 1,810 21,294 189
Metal grade Contained metal
100% Basis 4% gold stream
55
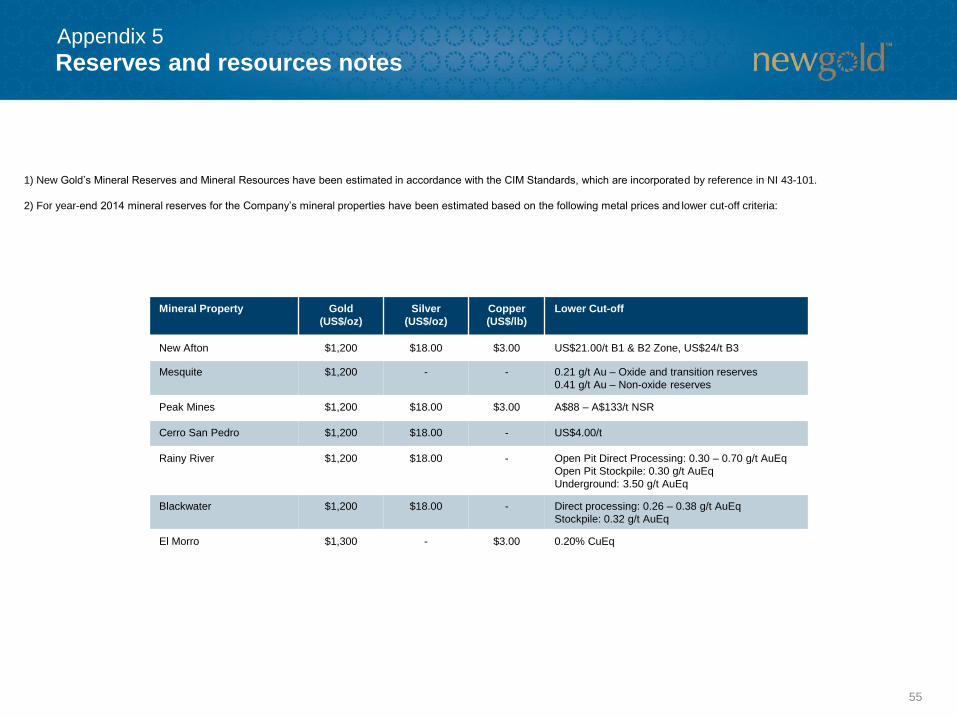
1) New Gold’s Mineral Reserves and Mineral Resources have been estimated in accordance with the CIM Standards, which are incorporated by reference in NI 43-101.
2) For year-end 2014 mineral reserves for the Company’s mineral properties have been estimated based on the following metal prices and lower cut-off criteria:
Mineral Property Gold
(US$/oz)
Silver
(US$/oz)
Copper
(US$/lb)
Lower Cut-off
New Afton $1,200 $18.00 $3.00 US$21.00/t B1 & B2 Zone, US$24/t B3
Mesquite $1,200 - - 0.21 g/t Au – Oxide and transition reserves
0.41 g/t Au – Non-oxide reserves
Peak Mines $1,200 $18.00 $3.00 A$88 – A$133/t NSR
Cerro San Pedro $1,200 $18.00 - US$4.00/t
Rainy River $1,200 $18.00 - Open Pit Direct Processing: 0.30 – 0.70 g/t AuEq
Open Pit Stockpile: 0.30 g/t AuEq
Underground: 3.50 g/t AuEq
Blackwater $1,200 $18.00 - Direct processing: 0.26 – 0.38 g/t AuEq
Stockpile: 0.32 g/t AuEq
El Morro $1,300 - $3.00 0.20% CuEq
Reserves and resources notesAppendix 5
56
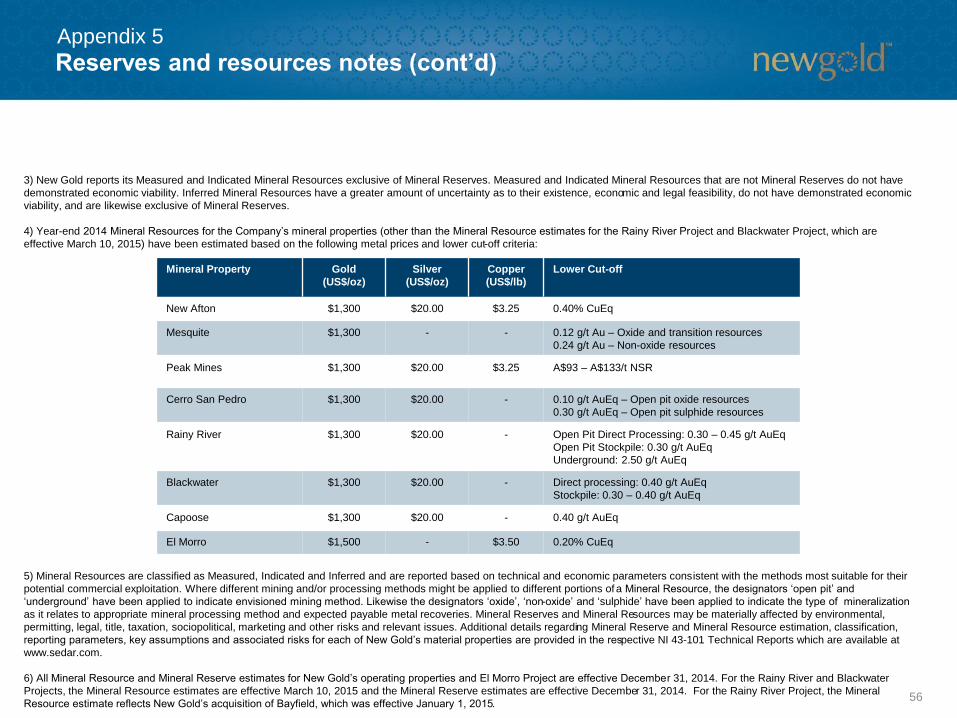
3) New Gold reports its Measured and Indicated Mineral Resources exclusive of Mineral Reserves. Measured and Indicated Mineral Resources that are not Mineral Reserves do not have
demonstrated economic viability. Inferred Mineral Resources have a greater amount of uncertainty as to their existence, economic and legal feasibility, do not have demonstrated economic
viability, and are likewise exclusive of Mineral Reserves.
4) Year-end 2014 Mineral Resources for the Company’s mineral properties (other than the Mineral Resource estimates for the Rainy River Project and Blackwater Project, which are
effective March 10, 2015) have been estimated based on the following metal prices and lower cut-off criteria:
5) Mineral Resources are classified as Measured, Indicated and Inferred and are reported based on technical and economic parameters consistent with the methods most suitable for their
potential commercial exploitation. Where different mining and/or processing methods might be applied to different portions of a Mineral Resource, the designators ‘open pit’ and
‘underground’ have been applied to indicate envisioned mining method. Likewise the designators ‘oxide’, ‘non-oxide’ and ‘sulphide’ have been applied to indicate the type of mineralization
as it relates to appropriate mineral processing method and expected payable metal recoveries. Mineral Reserves and Mineral Resources may be materially affected by environmental,
permitting, legal, title, taxation, sociopolitical, marketing and other risks and relevant issues. Additional details regarding Mineral Reserve and Mineral Resource estimation, classification,
reporting parameters, key assumptions and associated risks for each of New Gold’s material properties are provided in the respective NI 43-101 Technical Reports which are available at
www.sedar.com.
6) All Mineral Resource and Mineral Reserve estimates for New Gold’s operating properties and El Morro Project are effective December 31, 2014. For the Rainy River and Blackwater
Projects, the Mineral Resource estimates are effective March 10, 2015 and the Mineral Reserve estimates are effective December 31, 2014. For the Rainy River Project, the Mineral
Resource estimate reflects New Gold’s acquisition of Bayfield, which was effective January 1, 2015.
Mineral Property Gold
(US$/oz)
Silver
(US$/oz)
Copper
(US$/lb)
Lower Cut-off
New Afton $1,300 $20.00 $3.25 0.40% CuEq
Mesquite $1,300 - - 0.12 g/t Au – Oxide and transition resources
0.24 g/t Au – Non-oxide resources
Peak Mines $1,300 $20.00 $3.25 A$93 – A$133/t NSR
Cerro San Pedro $1,300 $20.00 - 0.10 g/t AuEq – Open pit oxide resources
0.30 g/t AuEq – Open pit sulphide resources
Rainy River $1,300 $20.00 - Open Pit Direct Processing: 0.30 – 0.45 g/t AuEq
Open Pit Stockpile: 0.30 g/t AuEq
Underground: 2.50 g/t AuEq
Blackwater $1,300 $20.00 - Direct processing: 0.40 g/t AuEq
Stockpile: 0.30 – 0.40 g/t AuEq
Capoose $1,300 $20.00 - 0.40 g/t AuEq
El Morro $1,500 - $3.50 0.20% CuEq
Reserves and resources notes (cont’d)Appendix 5
57
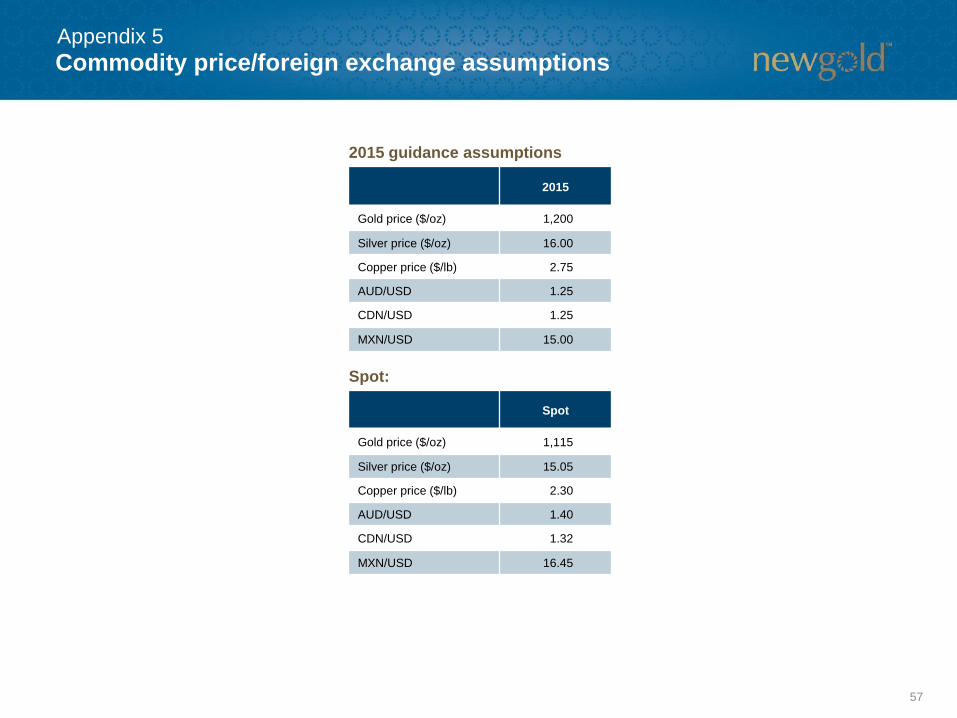
2015 guidance assumptions
Spot:
2015
Gold price ($/oz) 1,200
Silver price ($/oz) 16.00
Copper price ($/lb) 2.75
AUD/USD 1.25
CDN/USD 1.25
MXN/USD 15.00
Spot
Gold price ($/oz) 1,115
Silver price ($/oz) 15.05
Copper price ($/lb) 2.30
AUD/USD 1.40
CDN/USD 1.32
MXN/USD 16.45
Commodity price/foreign exchange assumptionsAppendix 5
Endnotes
58
CAUTIONARY NOTE TO U.S. READERS CONCERNING ESTIMATES OF MINERAL RESERVES AND MINERAL RESOURCES
Information concerning the properties and operations of New Gold has been prepared in accordance with Canadian standards under applicable Canadian securities laws, and may not be
comparable to similar information for United States companies. The terms “Mineral Resource”, “Measured Mineral Resource”, “Indicated Mineral Resource” and “Inferred Mineral Resource”
used in this presentation are Canadian mining terms as defined in the Canadian Institute of Mining, Metallurgy and Petroleum (“CIM”) Definition Standards for Mineral Resources and Mineral
Reserves adopted by CIM Council on May 10, 2014 and incorporated by reference in National Instrument 43-101 (“NI 43-101”). While the terms “Mineral Resource”, “Measured Mineral
Resource”, “Indicated Mineral Resource” and “Inferred Mineral Resource” are recognized and required by Canadian securities regulations, they are not defined terms under standards of the
United States Securities and Exchange Commission. As such, certain information contained in this presentation concerning descriptions of mineralization and resources under Canadian
standards is not comparable to similar information made public by United States companies subject to the reporting and disclosure requirements of the United States Securities and Exchange
Commission.
An “Inferred Mineral Resource” has a great amount of uncertainty as to its existence and as to its economic and legal feasibility. Under Canadian rules, estimates of inferred mineral resources
may not form the basis of feasibility of pre-feasibility studies. It cannot be assumed that all or any part of an “Inferred Mineral Resource” will ever be upgraded to a higher confidence category.
Readers are cautioned not to assume that all or any part of an “Inferred Mineral Resource” exists or is economically or legally mineable.
Under United States standards, mineralization may not be classified as a “Reserve” unless the determination has been made that the mineralization could be economically and legally
produced or extracted at the time the reserve estimation is made. Readers are cautioned not to assume that all or any part of the measured or indicated mineral resources will ever be
converted into mineral reserves. In addition, the definitions of “Proven Mineral Reserves” and “Probable Mineral Reserves” under CIM standards differ in certain respects from the standards of
the United States Securities and Exchange Commission.
TECHNICAL INFORMATION
The scientific and technical information in this presentation has been reviewed and approved by Mark A. Petersen, Vice President, Exploration of New Gold. Mr. Petersen is an AIPG Certified
Professional Geologist and a “Qualified Person” under National Instrument 43-101.
Endnotes (cont’d)
59
NON-GAAP MEASURES
(1) ALL-IN SUSTAINING COSTS
Consistent with guidance announced in 2013 by the World Gold Council, an association of various gold mining companies from around the world of which New Gold is a member, New Gold
defines “all-in sustaining costs” per ounce as the sum of total cash costs, capital expenditures that are sustaining in nature, corporate general and administrative costs, capitalized and
expensed exploration that is sustaining in nature and environmental reclamation costs, all divided by the ounces of gold sold to arrive at a per ounce figure. New Gold believes this non-GAAP
financial measure provides further transparency into costs associated with producing gold and will assist analysts, investors and other stakeholders of the company in assessing the company’s
operating performance, its ability to generate free cash flow from current operations and its overall value. This data is furnished to provide additional information and is a non-GAAP financial
measure. All-in sustaining costs presented do not have a standardized meaning under IFRS and may not be comparable to similar measures presented by other mining companies. It should
not be considered in isolation or as a substitute for measures of performance prepared in accordance with IFRS and is not necessarily indicative of cash flow from operations under IFRS or
operating costs presented under IFRS. Further details regarding historical all-in sustaining costs and a reconciliation to the nearest IFRS measures are provided in the MD&A accompanying
New Gold’s financial statements filed from time to time on www.sedar.com.
(2) TOTAL CASH COSTS
“Total cash costs” per ounce figures are non-GAAP measures which are calculated in accordance with a standard developed by The Gold Institute, a worldwide association of suppliers of gold
and gold products that ceased operations in 2002. Adoption of the standard is voluntary and the cost measures presented may not be comparable to other similarly titled measures of other
companies. New Gold reports total cash costs on a sales basis. The company believes that certain investors use this information to evaluate the company’s performance and ability to
generate liquidity through operating cash flow to fund future capital expenditures and working capital needs. This measure, along with sales, is considered to be a key indicator of the
company’s ability to generate operating earnings and cash flow from its mining operations. Total cash costs include mine site operating costs such as mining, processing and administration
costs, royalties, production taxes, and realized gains and losses on fuel contracts, but are exclusive of amortization, reclamation, capital and exploration costs and net of by-product sales.
Total cash costs are then divided by ounces of gold sold to arrive at a per ounce figure. Co-product cash costs remove the impact of other metal sales that are produced as a by-product of
gold production and apportion the cash costs to each metal produced on a percentage of revenue basis, and subsequently divides the amount by the total ounces of gold or silver or pounds of
copper sold, as the case may be, to arrive at per ounce or per pound figures. Unless otherwise indicated, all total cash cost information in this presentation is net of by-product sales. This data
is furnished to provide additional information and is a non-GAAP financial measure. Total cash costs and co-product cash costs presented do not have a standardized meaning under IFRS
and may not be comparable to similar measures presented by other mining companies. It should not be considered in isolation or as a substitute for measures of performance prepared in
accordance with IFRS and is not necessarily indicative of cash flow from operations under IFRS or operating costs presented under GAAP. Further details regarding historical total cash costs
and a reconciliation to the nearest IFRS measures are provided in the MD&A accompanying New Gold’s financial statements filed from time to time on www.sedar.com.
(3) AVERAGE REALIZED PRICE
“Average realized price per ounce or pound sold” is a non-GAAP financial measure with no standard meaning under IFRS. Management uses this measure to better understand the price
realized in each reporting period for gold, silver, and copper sales. Average realized price includes realized gains and losses from gold hedge settlements up until May 15, 2013 but excludes
from revenues unrealized gains and losses on non-hedged derivative contracts and the revenue reduction related to the non-cash accounting charge as the loss incurred on the monetization
of the company’s legacy hedge position is realized into income over the original term of the hedge contract. Average realized price is intended to provide additional information only and does
not have any standardized definition under IFRS; it should not be considered in isolation or as a substitute for measures of performance prepared in accordance with IFRS. Other companies
may calculate this measure differently and this measure is unlikely to be comparable to similar measures presented by other companies.
Endnotes (cont’d)
60
(4) ADJUSTED NET EARNINGS
“Adjusted net earnings” and “adjusted net earnings per share” are non-GAAP financial measures. Net earnings have been adjusted and tax affected for the group of costs in “Other gains and
losses” on the condensed consolidated income statement. The adjusted entries are also impacted for tax to the extent that the underlying entries are impacted for tax in the unadjusted net
earnings from continuing operations. The company uses this measure for its own internal purposes. Management’s internal budgets and forecasts and public guidance do not reflect fair value
changes on senior notes and non-hedged derivatives, foreign currency translation and fair value through profit or loss and financial asset gains/losses. Consequently, the presentation of
adjusted net earnings and adjusted net earnings per share enables investors and analysts to better understand the underlying operating performance of our core mining business through the
eyes of management. Management periodically evaluates the components of adjusted net earnings and adjusted net earnings per share based on an internal assessment of performance
measures that are useful for evaluating the operating performance of our business and a review of the non-GAAP measures used by mining industry analysts and other mining companies.
Adjusted net earnings and adjusted net earnings per share are intended to provide additional information only and do not have any standardized meaning under IFRS and may not be
comparable to similar measures presented by other companies. They should not be considered in isolation or as a substitute for measures of performance prepared in accordance with IFRS.
The measures are not necessarily indicative of operating profit or cash flows from operations as determined under IFRS.
(5) SUSTANING FREE CASH FLOW
“Sustaining free cash flow” is a non-GAAP financial measure with no standard meaning under IFRS, which management uses to further evaluate the company’s results of operations in each
reporting period. Sustaining free cash flow is calculated as cash generated from operations less sustaining capital expenditures. Sustaining free cash flow is intended to provide additional
information only and does not have any standardized meaning under IFRS; it should not be considered in isolation or as a substitute for measures of performance prepared in accordance with
IFRS. Other companies may calculate this measure differently and this measure is unlikely to be comparable to similar measures presented by other companies.
(6) NET CASH GENERATED FROM OPERATIONS BEFORE CHANGES IN NON-CASH OPERATING WORKING CAPITAL
“Adjusted net cash generated from operations before changes in working capital” is a non-GAAP financial measure. Net cash generated from operations has been adjusted for one-time
charges incurred in 2013 related to the settlement of the company’s legacy gold hedge position, the company’s acquisition of the Rainy River project and a one-time tax refund related to the
filing of amended tax returns for prior periods at the Peak Mines. There is also an adjustment to remove the impact of the change in working capital. The company believes the presentation of
adjusted net cash generated from operations before changes in working capital enables investors and analysts to better understand the underlying operating performance of our core mining
business. Adjusted net cash generated from operations before changes in working capital is intended to provide additional information only and does not have any standardized meaning
under IFRS. It should not be considered in isolation or as a substitute for measures of performance prepared in accordance with IFRS.
Contact information
61
Investor Relations
Hannes Portmann
Vice President, Corporate Development
416-324-6014