Embed Size (px)
Citation preview

Emad Saif Entrepreneurship Educator


• Income Statement • Cash Flow • Breakeven Analysis


ASPIRE Lemonade Stand: Refreshing Lemonade

VALUE
PROPOSITION
CHANNELS
RELATIONSHIPS CUSTOMER
SEGMENT
REVENUE STREAMS COST STRUCTURE
KEY
PARTNERS
KEY
RESOURCES
KEY
ACTIVITIES
ASPIRE Lemonade Stand Business Model Canvas
6

VALUE
PROPOSITION
CHANNELS
RELATIONSHIPS CUSTOMER
SEGMENT
REVENUE STREAMS COST STRUCTURE
KEY
PARTNERS
KEY
RESOURCES
KEY
ACTIVITIES
7
Revenues Costs <

VALUE
PROPOSITION
CHANNELS
RELATIONSHIPS CUSTOMER
SEGMENT
REVENUE STREAMS COST STRUCTURE
KEY
PARTNERS
KEY
RESOURCES
KEY
ACTIVITIES
8
Operational Costs
CAPEX Cost CAPEX: Capital expenditures, investment

VALUE
PROPOSITION
CHANNELS
RELATIONSHIPS CUSTOMER
SEGMENT
REVENUE STREAMS COST STRUCTURE
KEY
PARTNERS
KEY
RESOURCES
KEY
ACTIVITIES
9
Variable Costs
Fixed Costs
Fixed Costs: stay the same regardless of output (i.e. rent, insurance,
marketing, labor) Variable Costs: changes as level of output changes
Total Operational Costs = Fixed costs + Variable Costs

How do we come up with the cost to make one lemonade cup? What costs do we include?

Lemonade Quantity Cost (QR) / Jug
Cost (QR) / Cup
Lemon 4 lemons 8 0.8 Sugar 10 spoons 3 0.3 Ice 40 cubes 2 0.2 Water 3 L 2 0.2 Cup 10 cups 3 0.3 Straws 10 straws 2 0.2 Total Cost 20 QR 2 QR
= 10x

VALUE
PROPOSITION
CHANNELS
RELATIONSHIPS CUSTOMER
SEGMENT
REVENUE STREAMS COST STRUCTURE
KEY
PARTNERS
KEY
RESOURCES
KEY
ACTIVITIES
12
2 QR/cup

One Time Costs
Cost (QR)
Icebox 500 Spoons 50 Knives 50 Lemon Juicer 50 Lemon jug 50 Lemon stand 500 Other 50 Total 1,250

VALUE
PROPOSITION
CHANNELS
RELATIONSHIPS CUSTOMER
SEGMENT
REVENUE STREAMS COST STRUCTURE
KEY
PARTNERS
KEY
RESOURCES
KEY
ACTIVITIES
14
2 QR/cup
1,250 QR CAPEX
cost

SALARIES Employees Cost (QR) / month Cost (QR) / year Sales person 1 4,000 48,000 Sales Person 2 4,000 48,000 Total 8,000 96,000
RENT Rent Cost (QR) / month Cost (QR) / year Amount 2,000 24,000
MISC. Misc. Cost (QR) / month Cost (QR) / year Misc. Costs 500 6,000
MARKETING Marketing Cost (QR) / month Cost (QR) / year Flyers 1,500 18,000 Online/SM 500 6,000 Total 2,000 24,000
Total Fixed Costs (QR) 150,000

VALUE
PROPOSITION
CHANNELS
RELATIONSHIPS CUSTOMER
SEGMENT
REVENUE STREAMS COST STRUCTURE
KEY
PARTNERS
KEY
RESOURCES
KEY
ACTIVITIES
16
2 QR/cup
1,250 QR CAPEX
cost
2,000 QR/month
2x sales people 8,000 QR/month
2,000 QR/month

1. How can we come up with the sale price of 1 lemonade cup?
2. How can we come up with
# of buying customers?

VALUE
PROPOSITION
CHANNELS
RELATIONSHIPS CUSTOMER
SEGMENT
REVENUE STREAMS COST STRUCTURE
KEY
PARTNERS
KEY
RESOURCES
KEY
ACTIVITIES
18
Sales Revenues
Lemonade Sales (Cup Price) x # customers
Tips (% of sales)
A
ds
Ads (% of sales)
Assume 10 QR/cup Assume 5% Assume 3%

Assume Assume (B x C) D x 4 E x 2QR F x 12 E x 10QR K x 12
A B C D E F J K L Day Visitors %
Buying Customers/
cups sold Cups
Sold/month Cost/month Cost/year Sales/month Sales/Year
Sunday 150 15%
23
90
180
2,160
900
10,800
Monday 150 15%
23
90
180
2,160
900
10,800
Tuesday 150 15%
23
90
180
2,160
900
10,800
Wednesday 150 15%
23
90
180
2,160
900
10,800
Thursday 1,000 15%
150
600
1,200
14,400
6,000
72,000
Friday 1,500 15%
225
900
1,800
21,600
9,000
108,000
Saturday 800 15%
120
480
960
11,520
4,800
57,600
Total 3,900
585
2,340
4,680
56,160 23,400
280,800
Yearly Lemonade Sales & Costs
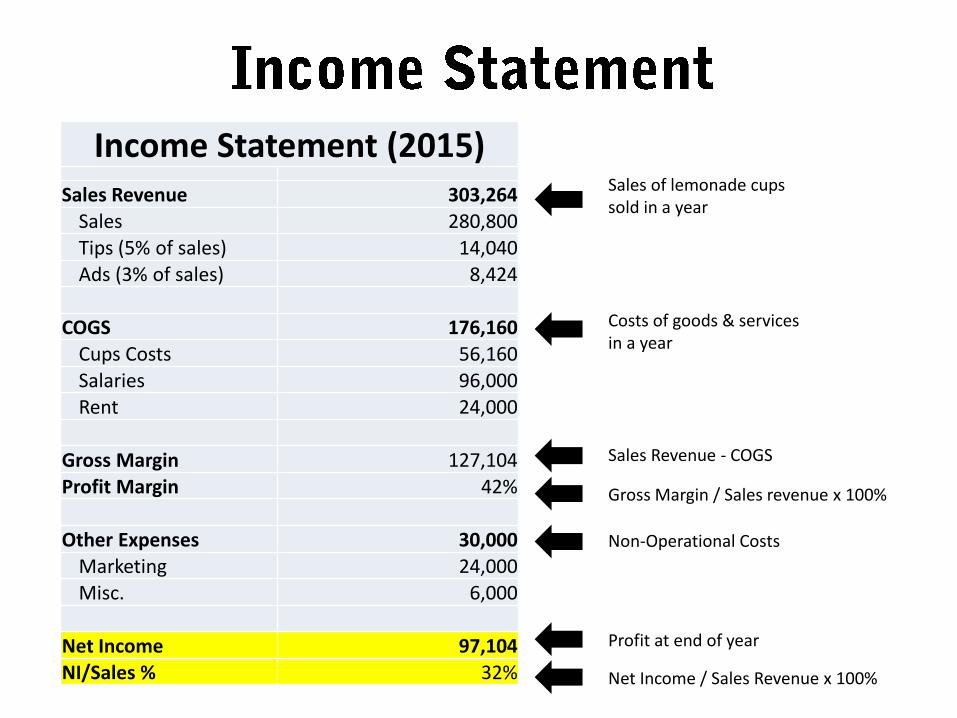
Income Statement (2015) Sales Revenue 303,264
Sales 280,800
Tips (5% of sales) 14,040
Ads (3% of sales) 8,424
COGS 176,160
Cups Costs 56,160 Salaries 96,000 Rent 24,000
Gross Margin 127,104
Profit Margin 42%
Other Expenses 30,000 Marketing 24,000 Misc. 6,000
Net Income 97,104
NI/Sales % 32%
Costs of goods & services in a year
Sales of lemonade cups sold in a year
Profit at end of year
Net Income / Sales Revenue x 100%
Non-Operational Costs
Sales Revenue - COGS
Gross Margin / Sales revenue x 100%

Operating
Cash Flow
• (i.e. cash from COGS, salaries, marketing, etc.)
Investing
Cash Flow
• (i.e. equipment, assets)
Financing
Cash Flow
• (i.e. loans)
How companies spend and receive cash …

Cash Flow in (QAR) YEAR 1 Time Period M1 M2 M3 M4 M5 M6 M7 M8 M9 M10 M11 M12 Y1
Cash from Operations Sales Revenue 25,272 25,272 25,272 25,272 25,272 25,272 25,272 25,272 25,272 25,272 25,272 25,272 303,264
Cups costs
(4,680)
(4,680)
(4,680)
(4,680)
(4,680)
(4,680)
(4,680)
(4,680)
(4,680)
(4,680)
(4,680)
(4,680) (56,160)
Salaries
(8,000)
(8,000)
(8,000)
(8,000)
(8,000)
(8,000)
(8,000)
(8,000)
(8,000)
(8,000)
(8,000)
(8,000) (96,000)
Rent
(2,000)
(2,000)
(2,000)
(2,000)
(2,000)
(2,000)
(2,000)
(2,000)
(2,000)
(2,000)
(2,000)
(2,000) (24,000)
Marketing
(2,000)
(2,000)
(2,000)
(2,000)
(2,000)
(2,000)
(2,000)
(2,000)
(2,000)
(2,000)
(2,000)
(2,000) (24,000) Insurance - - - - - - - - - - - - - Misc. (500) (500) (500) (500) (500) (500) (500) (500) (500) (500) (500) (500) (6,000) Taxes (0%) - - - - - - - - - - - - - Subtotal Cash from Operations 8,092 8,092 8,092 8,092 8,092 8,092 8,092 8,092 8,092 8,092 8,092 8,092 97,104
Cash from Investment
Equipment
(1,250) - - - - - - - - - - - (1,250)
Subtotal Cash from Investment
(1,250) - - - - - - - - - - - (1,250)
Cash from Finance Investors - - - - - - - - - - - - - Founders 1,500 - - - - - - - - - - - 1,500 Bank Loan - - - - - - - - - - - - - Interest - - - - - - - - - - - - - Subtotal Cash from Finance 1,500 - - - - - - - - - - - 1,500 Net change in cash 8,342 8,092 8,092 8,092 8,092 8,092 8,092 8,092 8,092 8,092 8,092 8,092 97,354 Cash at beginning of period - 8,342 16,434 24,526 32,618 40,710 48,802 56,894 64,986 73,078 81,170 89,262 - Net Cash Flow 8,342 16,434 24,526 32,618 40,710 48,802 56,894 64,986 73,078 81,170 89,262 97,354 97,354

-
20,000
40,000
60,000
80,000
100,000
120,000
M1 M2 M3 M4 M5 M6 M7 M8 M9 M10 M11 M12
Net change in cash
Net Cash Flow

Fixed Costs: stay the same regardless of output (i.e. rent, insurance, marketing, labor) Variable Costs: changes as level of output changes Total Costs = Fixed costs
+ Variable Costs Q: How do we reduce break-even level?
Profit = ZERO
B = (Fixed Costs) / (Price – Variable)

Price: 10 QR/cup Variable Cost: 2 QR Fixed Cost: 150,000 QR
B = (Fixed Costs) / (Price – Variable)
B = (150,000) / (10 – 2) =18,750 Lemonade Cups
18,750
187,500 QR
Profit Loss

•
•
•
•