Embed Size (px)
DESCRIPTION
Averga gross wages in Baltic states. Source: Statistics Offices. September 2013
Citation preview
The wages and salaries in Baltic states
September 2013
Source: Statistics Estonia
Compiled by Kadri Seeder
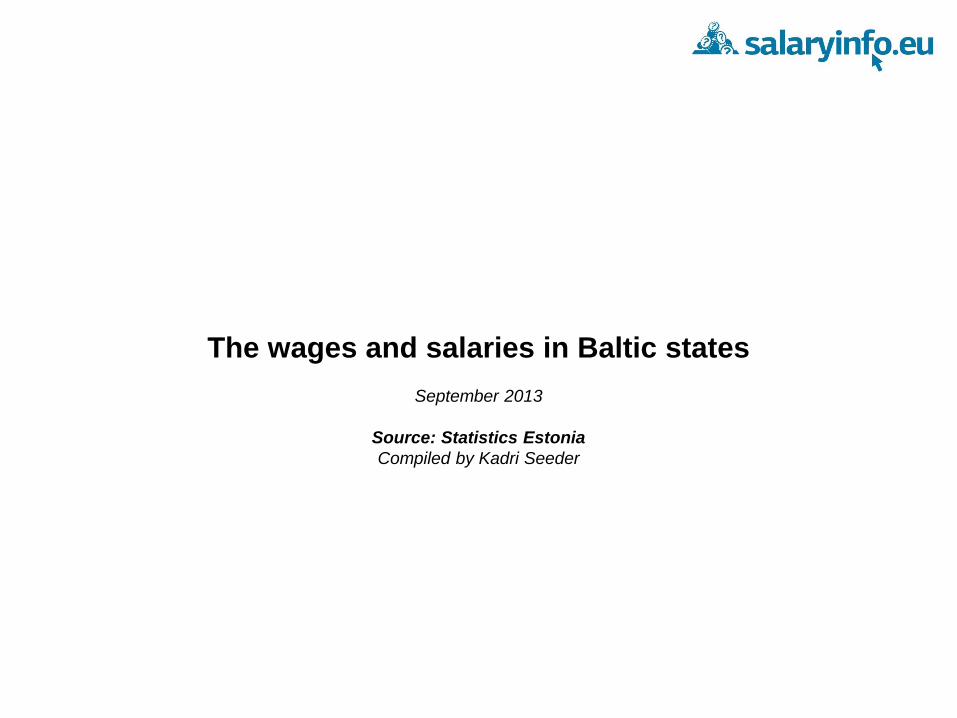
516
601
725
825
784 792
839
887
381
430
566
682 656
633 660
684
370
433
522
623 595
576 593
615
0
100
200
300
400
500
600
700
800
900
1000
2005 2006 2007 2008 2009 2010 2011 2012
EU
R
Years
Average monthly gross wages, EUR
Estonia Latvia Lithuania
Source: Statistics Estonia, Central Statistical Bureau of Latvia, Statistics Lithuania
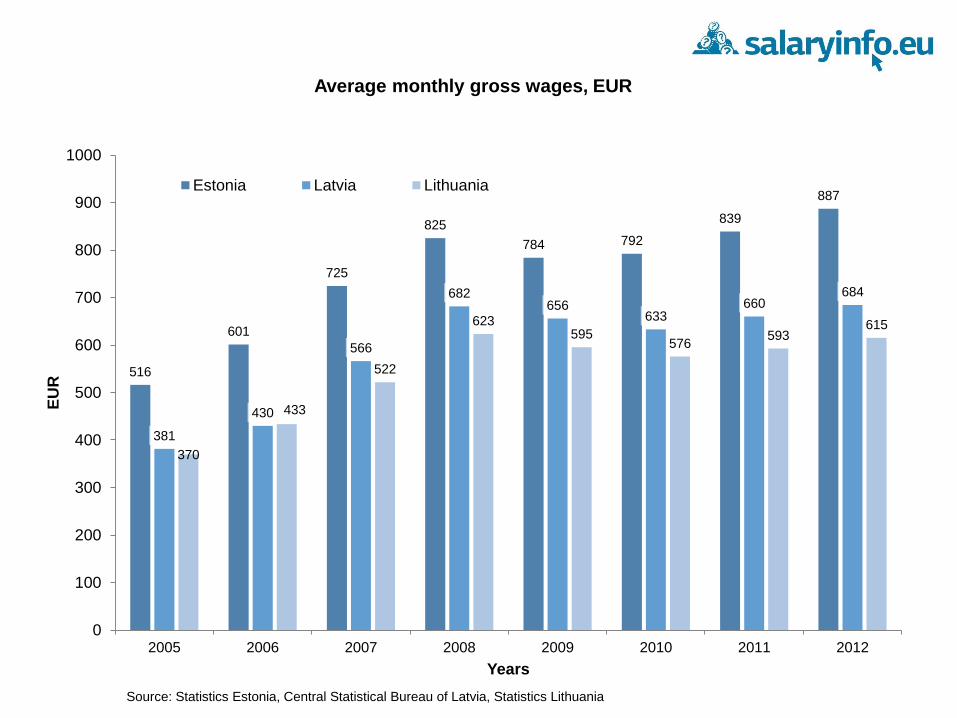
411
484
583
670
637 637
672
706
250
307
407
498 487
450 470
488
265
317
392
478 464
449 462
478
0
100
200
300
400
500
600
700
800
2005 2006 2007 2008 2009 2010 2011 2012
EU
R
Years
Average monthly net wages, EUR
Estonia Latvia Lithuania
Source: Statistics Estonia, Central Statistical Bureau of Latvia, Statistics Lithuania
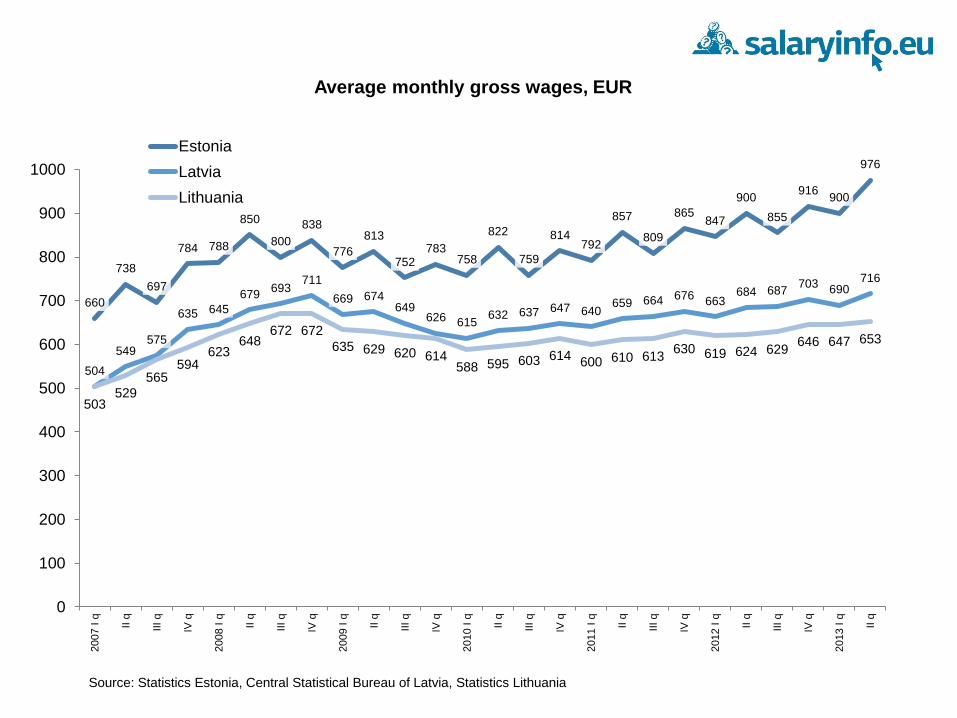
660
738
697
784 788
850
800
838
776
813
752 783
758
822
759
814 792
857
809
865 847
900
855
916 900
976
504
549 575
635 645
679 693
711
669 674 649
626 615 632 637 647 640
659 664 676 663 684 687
703 690 716
503 529
565 594
623 648
672 672
635 629 620 614 588 595 603 614
600 610 613 630 619 624 629
646 647 653
0
100
200
300
400
500
600
700
800
900
1000
2007 I q
II q
III q
IV q
2008 I q
II q
III q
IV q
2009 I q
II q
III q
IV q
2010 I q
II q
III q
IV q
2011 I q
II q
III q
IV q
2012 I q
II q
III q
IV q
2013 I q
II q
Average monthly gross wages, EUR
Estonia
Latvia
Lithuania
Source: Statistics Estonia, Central Statistical Bureau of Latvia, Statistics Lithuania
-15%
-10%
-5%
0%
5%
10%
15%
20%
25%
30%
35%
40%
20
05 I
kv
II k
v
III
kv
IV k
v
20
06 I
kv
II k
v
III
kv
IV k
v
20
07 I
kv
II k
v
III
kv
IV k
v
20
08 I
kv
II k
v
III
kv
IV k
v
20
09 I
kv
II k
v
III
kv
IV k
v
20
10 I
kv
II k
v
III
kv
IV k
v
20
11 I
kv
II k
v
III
kv
IV k
v
20
12 I
kv
II k
v
III
kv
IV k
v
20
13 I
kv
II k
v
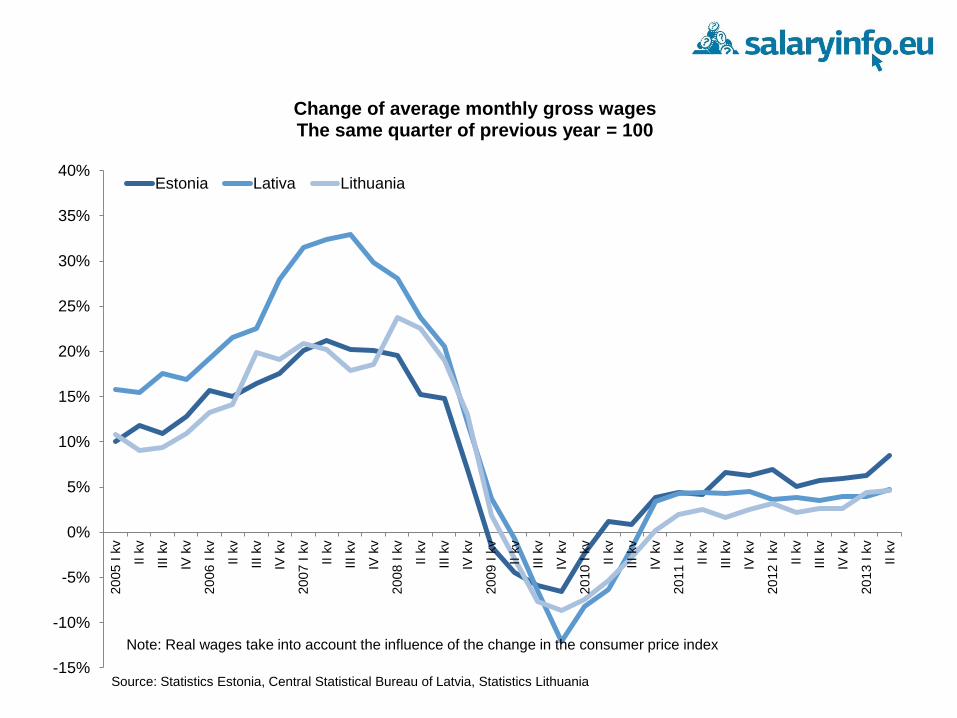
Change of average monthly gross wages The same quarter of previous year = 100
Estonia Lativa Lithuania
Source: Statistics Estonia, Central Statistical Bureau of Latvia, Statistics Lithuania
Note: Real wages take into account the influence of the change in the consumer price index
-15%
-10%
-5%
0%
5%
10%
15%
20%
25%
20
05 I
kv
II k
v
III
kv
IV k
v
20
06 I
kv
II k
v
III
kv
IV k
v
20
07 I
kv
II k
v
III
kv
IV k
v
20
08 I
kv
II k
v
III
kv
IV k
v
20
09 I
kv
II k
v
III
kv
IV k
v
20
10 I
kv
II k
v
III
kv
IV k
v
20
11 I
kv
II k
v
III
kv
IV k
v
20
12 I
kv
II k
v
III
kv
IV k
v
20
13 I
kv
II k
v
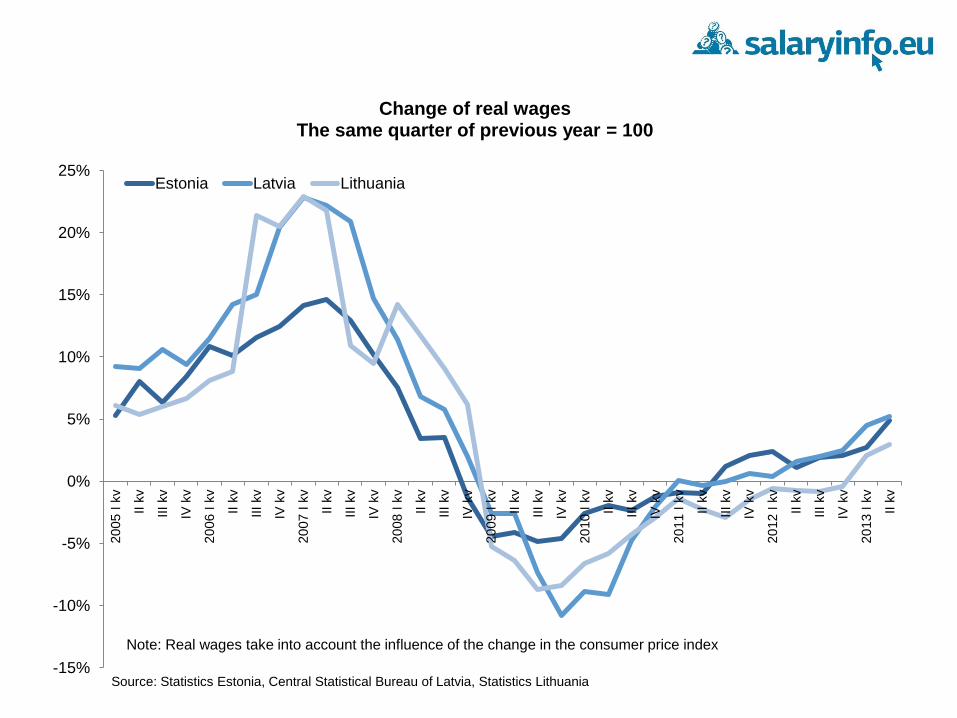
Change of real wages The same quarter of previous year = 100
Estonia Latvia Lithuania
Source: Statistics Estonia, Central Statistical Bureau of Latvia, Statistics Lithuania
Note: Real wages take into account the influence of the change in the consumer price index
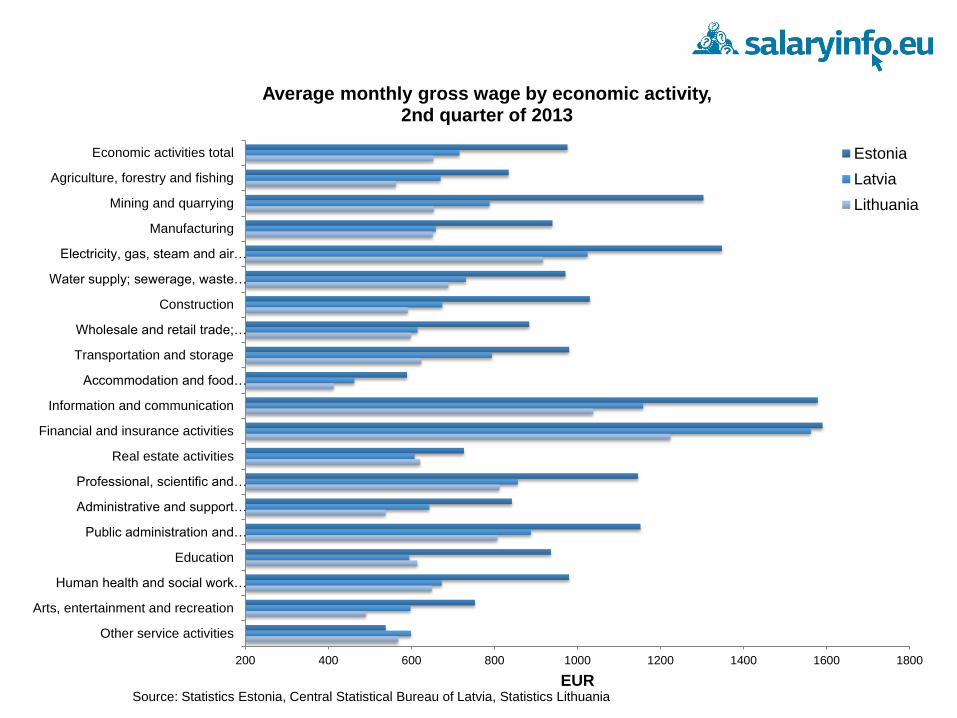
200 400 600 800 1000 1200 1400 1600 1800
Economic activities total
Agriculture, forestry and fishing
Mining and quarrying
Manufacturing
Electricity, gas, steam and air…
Water supply; sewerage, waste…
Construction
Wholesale and retail trade;…
Transportation and storage
Accommodation and food…
Information and communication
Financial and insurance activities
Real estate activities
Professional, scientific and…
Administrative and support…
Public administration and…
Education
Human health and social work…
Arts, entertainment and recreation
Other service activities
EUR
Average monthly gross wage by economic activity, 2nd quarter of 2013
Estonia
Latvia
Lithuania
Source: Statistics Estonia, Central Statistical Bureau of Latvia, Statistics Lithuania
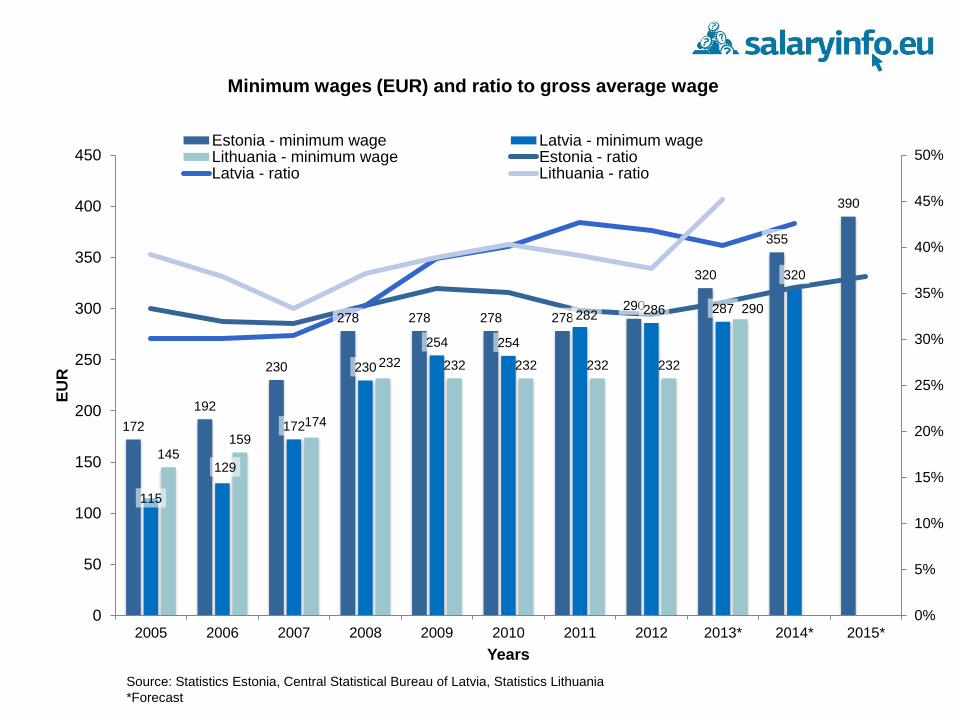
172
192
230
278 278 278 278 290
320
355
390
115
129
172
230
254 254
282 286 287
320
145 159
174
232 232 232 232 232
290
0%
5%
10%
15%
20%
25%
30%
35%
40%
45%
50%
0
50
100
150
200
250
300
350
400
450
2005 2006 2007 2008 2009 2010 2011 2012 2013* 2014* 2015*
EU
R
Years
Minimum wages (EUR) and ratio to gross average wage
Estonia - minimum wage Latvia - minimum wageLithuania - minimum wage Estonia - ratioLatvia - ratio Lithuania - ratio
Source: Statistics Estonia, Central Statistical Bureau of Latvia, Statistics Lithuania
*Forecast
50
55
60
65
70
75
80
85
90
95
100
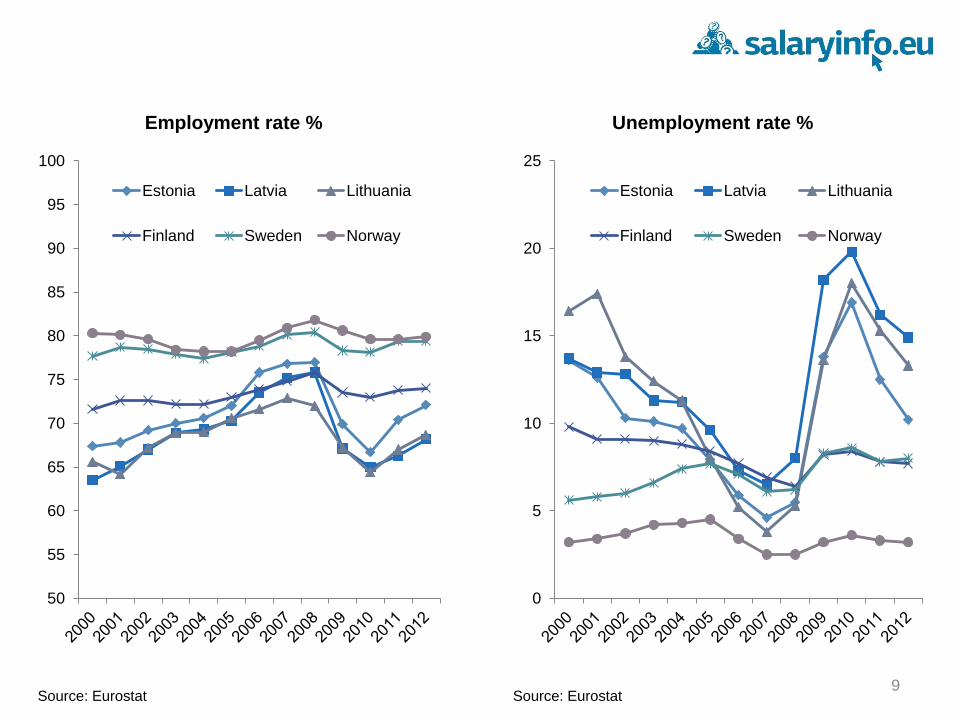
Employment rate %
Estonia Latvia Lithuania
Finland Sweden Norway
Source: Eurostat
0
5
10
15
20
25
Unemployment rate %
Estonia Latvia Lithuania
Finland Sweden Norway
Source: Eurostat 9
-20
-15
-10
-5
0
5
10
15
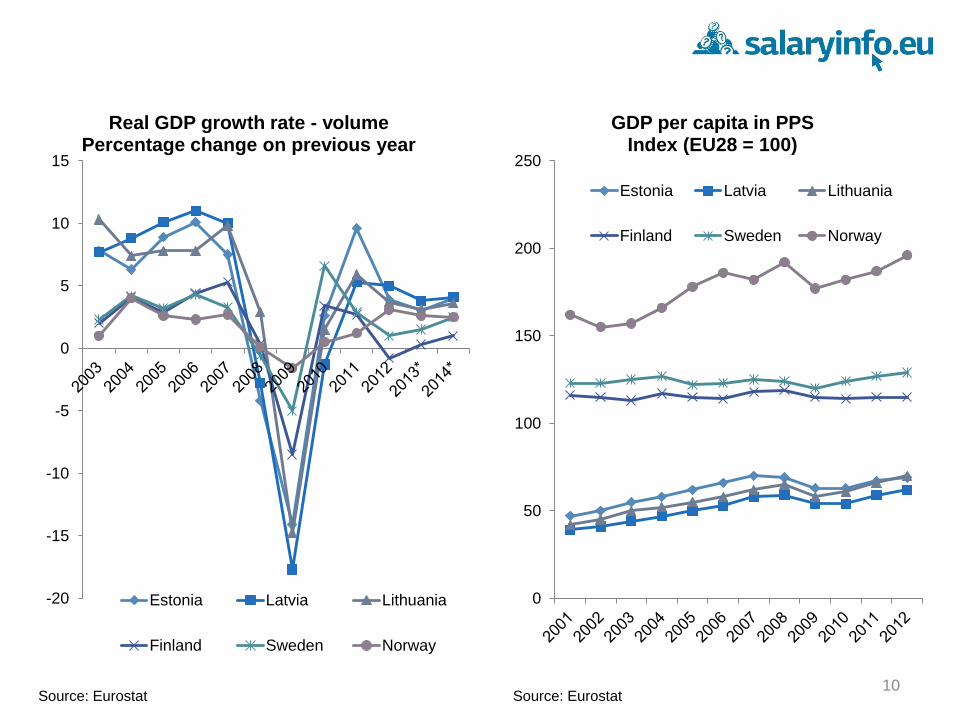
Real GDP growth rate - volume Percentage change on previous year
Estonia Latvia Lithuania
Finland Sweden Norway
Source: Eurostat
0
50
100
150
200
250
GDP per capita in PPS Index (EU28 = 100)
Estonia Latvia Lithuania
Finland Sweden Norway
Source: Eurostat 10