Embed Size (px)
Citation preview
BriefingJuly 2015
EPRS | European Parliamentary Research ServiceAuthor: Andrej StuchlikMembers' Research Service
ENPE 565.884
Wage developments in the euro areaIncreasingly unequal?
SUMMARY
In the wake of the crisis, gross wages in the euro area fell by 3.1% in 2009. Theystarted to grow again, by 2.0%, in 2011 and the European Commission forecasts anincrease of trend growth to 3.5% for 2016. Net earnings are only increasing slightly,however. Convergence in wage levels in the euro area remains static.
Income inequality has increased in two thirds of EU countries since 2006, specificallyfor low-wage earners. In the euro area, inequality increased in ten Member States:Luxembourg, Slovenia, Greece, France, Italy, Estonia, Austria, Slovakia, Cyprus andSpain (in ascending order). After decreasing levels of inequality in previous years, theeuro area is now back to 2004 levels.
Being the biggest share of labour costs, the structure and development of earnings areimportant features of labour markets. Within a monetary union much of the pressureto (re-)gain competitiveness is shifted onto labour markets, and thus real wagedevelopments. Yet nominal wage rigidities, increased by a low inflation environment,may increase unemployment and foster cross-country heterogeneity.
The European Parliament is stimulating the debate with the aim of formulating bettersocial and employment policy. The EP's own initiative report on the economicgovernance framework of June 2015 also focused on how to strengthen the socialdimension.
In this briefing: Context: Real, nominal, and unequal? Recent wage developments in the euro
area Insights from current research The European Semester and the European
Parliament Remaining challenges Main references
EPRS Wage developments in the euro area
Members' Research Service Page 2 of 11
Context: Real, nominal, and unequal?Wages are a crucial element of the economic and social development of the Europeaneconomic and monetary union. With GDP growth rates in the euro area on the riseagain,1 the question looms whether employment rates will increase as well and if so,whether wage developments will follow them.
So far, wages in the EU seem unaffected by the first signs of economic bloom. Thelabour market in the United States has recovered much more strongly than is the casein the EU, but real wages are still 1.2% below where they were in 2009.2 In the samevein, recent ILO data indicates that euro area countries most affected by the crisis havestill not regained their real wage levels of 2007. For example Spain is at 96.8% andIreland at 98.1% of 2007 wage levels – with Greece being significantly below, at just75.8%.
The structure and development of earnings, as a key part of total labour costs, areimportant features of any labour market, reflecting labour supply from individuals andlabour demand by enterprises. In a monetary union, much of the pressure to (re-)gainor retain competitiveness is shifted onto labour markets, relying on functional wage-setting mechanisms among economic players. Yet one of these mechanisms, to adjustwages downwards during periods of unemployment, may be impaired by whateconomists have called nominal wage rigidity. This means that, after economic shocksand despite sizable increases in unemployment, nominal wages may fail to adjustdownwards, they remain 'rigid'. Particularly in a period of low inflation, such aphenomenon might even increase unemployment.3 Combined with divergingadjustment mechanisms in national labour markets, such as wage-setting andcollective-bargaining structures, it might foster cross-country heterogeneity. The latteris a key challenge for the euro area, in the sense that it makes EU-wide policy responsesmore difficult.
At the same time, wages usually account for the biggest share of household income,and thereby eventually impact on the distribution of wealth within a society. So keepingreal wage developments in line with productivity is one tool to mitigate a wideningincome gap between rich and poor. With the on-going debate on the social dimensionof the EU's economic governance, trends in income inequality matter not only forindividual Member States, as they can affect growth prospects, but for the euro area as
GlossaryGross wages/earnings: Gross earnings cover monetary remuneration paid directly by theemployer, before tax deductions and social security contributions payable by wage earnersand retained by the employer. Includes bonuses and payments in kind, see CommissionRegulation (EC) No 1738/2005.
Net wages/earnings: Do not include social security contributions and taxes, but do includefamily allowances, if applicable.
Real wages: Nominal wages adjusted for inflation, i.e. adjusted for changes in the price ofgoods and services.
Household income: Wages (of all household members) plus revenues from other sources, e.g.private income from investment and property, transfers between households, and pensions,see Commission Regulation (EC) No 1981/2003 (EU SILC).
DNWR: Downward nominal wage rigidity – observed failure of nominal wages to adjustdownward after economic shocks, despite sizable increases in unemployment.
EPRS Wage developments in the euro area
Members' Research Service Page 3 of 11
a whole. Growing in size over recent years, the monetary union needs to monitormacroeconomic imbalances and to prevent trends of dwindling convergence.
Recent wage developments in the euro areaGross wagesFollowed by social contributions, gross earnings are the largest part of labour costs.According to Eurostat's most recent earnings survey,4 in 2010 the highest median5 grosshourly earnings in the euro area were recorded in Ireland (€18.30) and Luxembourg(€17.80). The lowest were recorded in Lithuania (€2.70) and Latvia (€2.90). These twoBaltic Member States also have the highest share of low wage earners6 with 27.2% and27.8%, respectively. Since 2006 the proportion of low wage earners among totalemployees has remained relatively stable, increasing in the euro area by 0.4 percentagepoints.
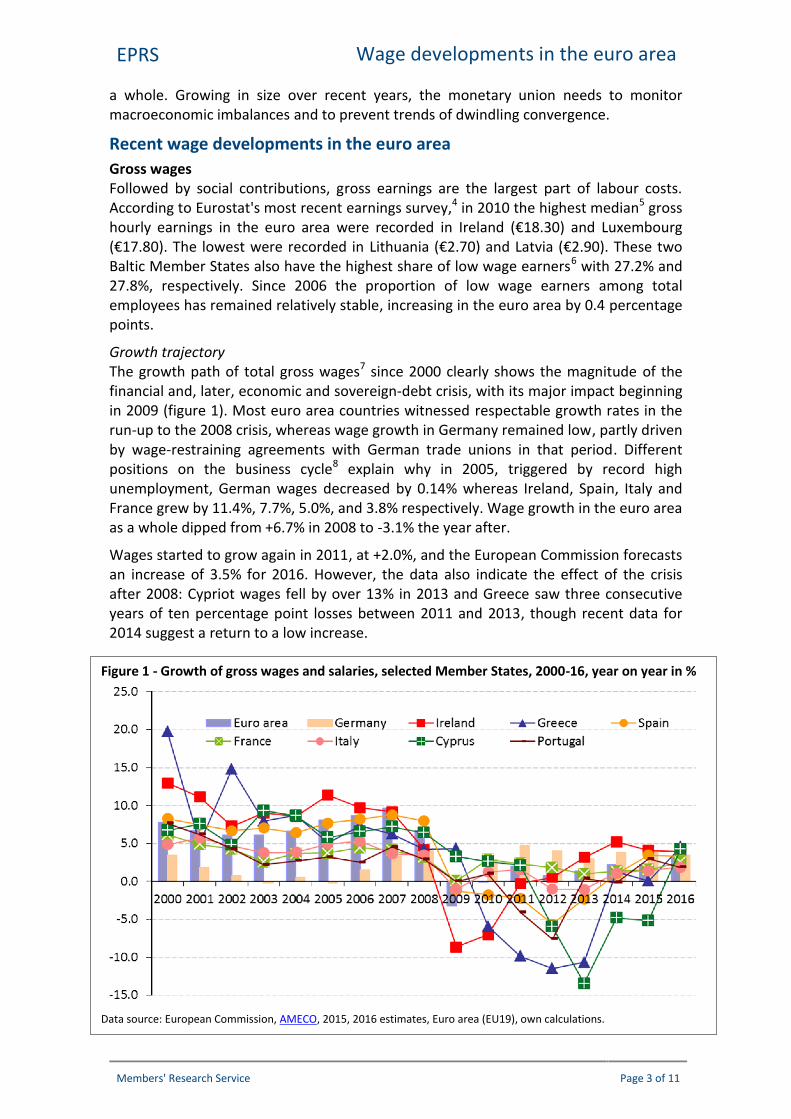
Growth trajectoryThe growth path of total gross wages7 since 2000 clearly shows the magnitude of thefinancial and, later, economic and sovereign-debt crisis, with its major impact beginningin 2009 (figure 1). Most euro area countries witnessed respectable growth rates in therun-up to the 2008 crisis, whereas wage growth in Germany remained low, partly drivenby wage-restraining agreements with German trade unions in that period. Differentpositions on the business cycle8 explain why in 2005, triggered by record highunemployment, German wages decreased by 0.14% whereas Ireland, Spain, Italy andFrance grew by 11.4%, 7.7%, 5.0%, and 3.8% respectively. Wage growth in the euro areaas a whole dipped from +6.7% in 2008 to -3.1% the year after.
Wages started to grow again in 2011, at +2.0%, and the European Commission forecastsan increase of 3.5% for 2016. However, the data also indicate the effect of the crisisafter 2008: Cypriot wages fell by over 13% in 2013 and Greece saw three consecutiveyears of ten percentage point losses between 2011 and 2013, though recent data for2014 suggest a return to a low increase.
Figure 1 - Growth of gross wages and salaries, selected Member States, 2000-16, year on year in %
Data source: European Commission, AMECO, 2015, 2016 estimates, Euro area (EU19), own calculations.
EPRS Wage developments in the euro area
Members' Research Service Page 4 of 11
But growth rates alone say little about wages' actual purchasing power (PPS)9 in realterms, as well as the relative difference between Member States. One proxy is to look atGDP per capita figures (aggregate measure of economic activity per person) and toadjust for differences in price levels. Adjusted for PPS, average annual GDP per capita inLuxembourg was €68 500 in 2013 and €17 000 in Latvia. While it is true that theabsolute difference between the richest and the poorest member of the euro area hasreduced since 2002, theheterogeneity among themembers (EA19) has not.
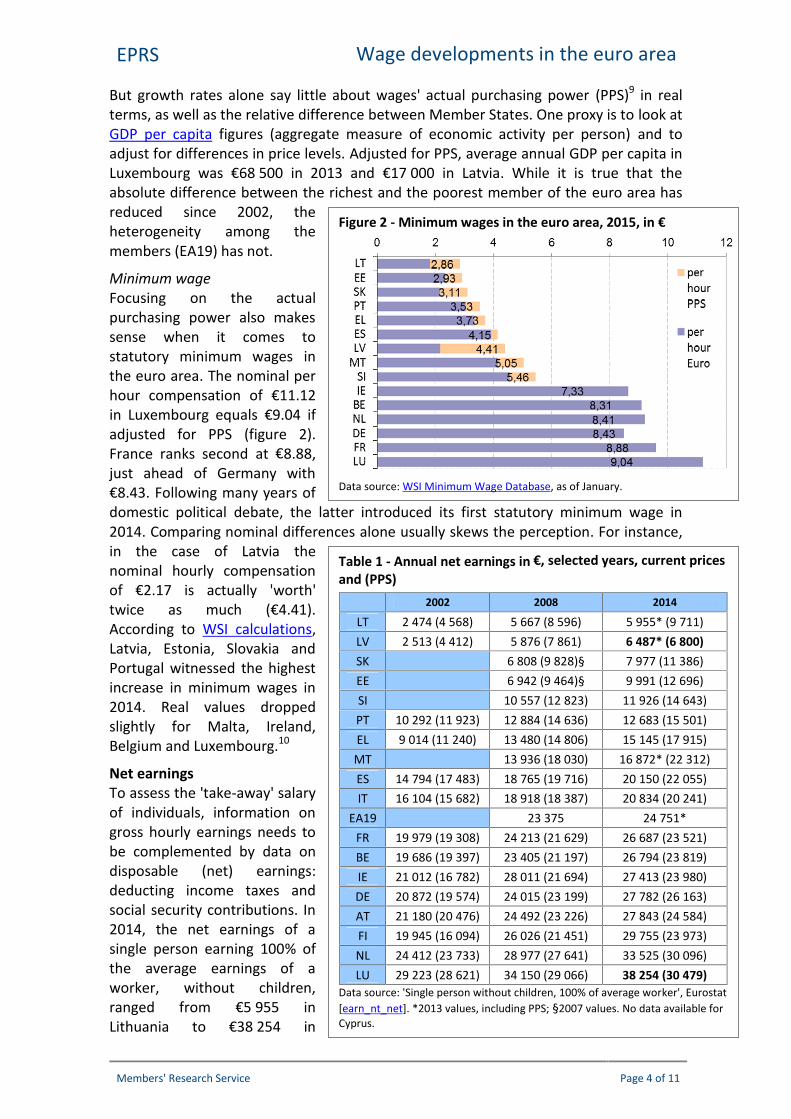
Minimum wageFocusing on the actualpurchasing power also makessense when it comes tostatutory minimum wages inthe euro area. The nominal perhour compensation of €11.12in Luxembourg equals €9.04 ifadjusted for PPS (figure 2).France ranks second at €8.88,just ahead of Germany with€8.43. Following many years ofdomestic political debate, the latter introduced its first statutory minimum wage in2014. Comparing nominal differences alone usually skews the perception. For instance,in the case of Latvia thenominal hourly compensationof €2.17 is actually 'worth'twice as much (€4.41).According to WSI calculations,Latvia, Estonia, Slovakia andPortugal witnessed the highestincrease in minimum wages in2014. Real values droppedslightly for Malta, Ireland,Belgium and Luxembourg.10
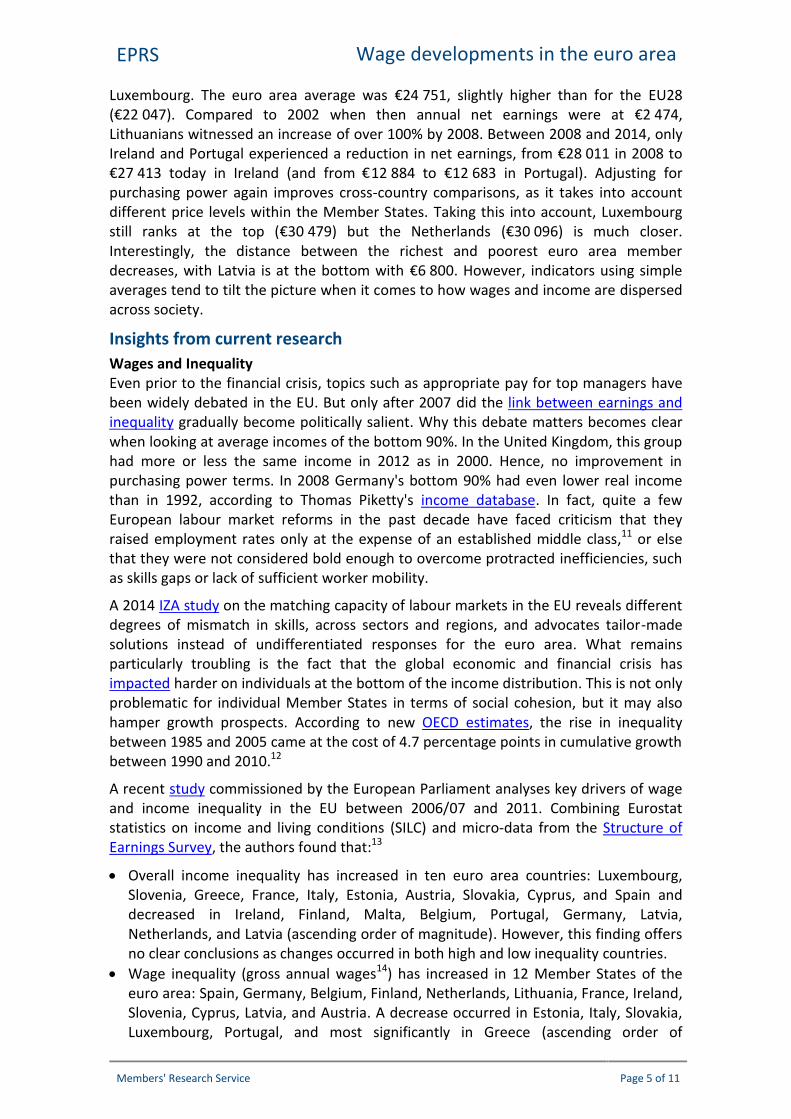
Net earningsTo assess the 'take-away' salaryof individuals, information ongross hourly earnings needs tobe complemented by data ondisposable (net) earnings:deducting income taxes andsocial security contributions. In2014, the net earnings of asingle person earning 100% ofthe average earnings of aworker, without children,ranged from €5 955 inLithuania to €38 254 in
Table 1 - Annual net earnings in €, selected years, current pricesand (PPS)
2002 2008 2014
LT 2 474 (4 568) 5 667 (8 596) 5 955* (9 711)LV 2 513 (4 412) 5 876 (7 861) 6 487* (6 800)SK 6 808 (9 828)§ 7 977 (11 386)EE 6 942 (9 464)§ 9 991 (12 696)SI 10 557 (12 823) 11 926 (14 643)PT 10 292 (11 923) 12 884 (14 636) 12 683 (15 501)EL 9 014 (11 240) 13 480 (14 806) 15 145 (17 915)MT 13 936 (18 030) 16 872* (22 312)ES 14 794 (17 483) 18 765 (19 716) 20 150 (22 055)IT 16 104 (15 682) 18 918 (18 387) 20 834 (20 241)
EA19 23 375 24 751*FR 19 979 (19 308) 24 213 (21 629) 26 687 (23 521)BE 19 686 (19 397) 23 405 (21 197) 26 794 (23 819)IE 21 012 (16 782) 28 011 (21 694) 27 413 (23 980)DE 20 872 (19 574) 24 015 (23 199) 27 782 (26 163)AT 21 180 (20 476) 24 492 (23 226) 27 843 (24 584)FI 19 945 (16 094) 26 026 (21 451) 29 755 (23 973)NL 24 412 (23 733) 28 977 (27 641) 33 525 (30 096)LU 29 223 (28 621) 34 150 (29 066) 38 254 (30 479)
Data source: 'Single person without children, 100% of average worker', Eurostat[earn_nt_net]. *2013 values, including PPS; §2007 values. No data available forCyprus.
Figure 2 - Minimum wages in the euro area, 2015, in €
Data source: WSI Minimum Wage Database, as of January.
EPRS Wage developments in the euro area
Members' Research Service Page 5 of 11
Luxembourg. The euro area average was €24 751, slightly higher than for the EU28(€22 047). Compared to 2002 when then annual net earnings were at €2 474,Lithuanians witnessed an increase of over 100% by 2008. Between 2008 and 2014, onlyIreland and Portugal experienced a reduction in net earnings, from €28 011 in 2008 to€27 413 today in Ireland (and from €12 884 to €12 683 in Portugal). Adjusting forpurchasing power again improves cross-country comparisons, as it takes into accountdifferent price levels within the Member States. Taking this into account, Luxembourgstill ranks at the top (€30 479) but the Netherlands (€30 096) is much closer.Interestingly, the distance between the richest and poorest euro area memberdecreases, with Latvia is at the bottom with €6 800. However, indicators using simpleaverages tend to tilt the picture when it comes to how wages and income are dispersedacross society.
Insights from current researchWages and InequalityEven prior to the financial crisis, topics such as appropriate pay for top managers havebeen widely debated in the EU. But only after 2007 did the link between earnings andinequality gradually become politically salient. Why this debate matters becomes clearwhen looking at average incomes of the bottom 90%. In the United Kingdom, this grouphad more or less the same income in 2012 as in 2000. Hence, no improvement inpurchasing power terms. In 2008 Germany's bottom 90% had even lower real incomethan in 1992, according to Thomas Piketty's income database. In fact, quite a fewEuropean labour market reforms in the past decade have faced criticism that theyraised employment rates only at the expense of an established middle class,11 or elsethat they were not considered bold enough to overcome protracted inefficiencies, suchas skills gaps or lack of sufficient worker mobility.
A 2014 IZA study on the matching capacity of labour markets in the EU reveals differentdegrees of mismatch in skills, across sectors and regions, and advocates tailor-madesolutions instead of undifferentiated responses for the euro area. What remainsparticularly troubling is the fact that the global economic and financial crisis hasimpacted harder on individuals at the bottom of the income distribution. This is not onlyproblematic for individual Member States in terms of social cohesion, but it may alsohamper growth prospects. According to new OECD estimates, the rise in inequalitybetween 1985 and 2005 came at the cost of 4.7 percentage points in cumulative growthbetween 1990 and 2010.12
A recent study commissioned by the European Parliament analyses key drivers of wageand income inequality in the EU between 2006/07 and 2011. Combining Eurostatstatistics on income and living conditions (SILC) and micro-data from the Structure ofEarnings Survey, the authors found that:13
Overall income inequality has increased in ten euro area countries: Luxembourg,Slovenia, Greece, France, Italy, Estonia, Austria, Slovakia, Cyprus, and Spain anddecreased in Ireland, Finland, Malta, Belgium, Portugal, Germany, Latvia,Netherlands, and Latvia (ascending order of magnitude). However, this finding offersno clear conclusions as changes occurred in both high and low inequality countries.
Wage inequality (gross annual wages14) has increased in 12 Member States of theeuro area: Spain, Germany, Belgium, Finland, Netherlands, Lithuania, France, Ireland,Slovenia, Cyprus, Latvia, and Austria. A decrease occurred in Estonia, Italy, Slovakia,Luxembourg, Portugal, and most significantly in Greece (ascending order of
EPRS Wage developments in the euro area
Members' Research Service Page 6 of 11
magnitude). Yet, the trend in Portugal and Greece comes with the caveat that highdegrees of unemployment may have short-term positive effects on (i.e. reducing)wage inequality.
This heterogeneous development of income and wage levels is interesting insofar asonly five countries witnessed deterioration in both indicators (Spain, France, Slovenia,Cyprus, and Austria). In most countries, income inequality has increased at the bottom of the distribution
(the lowest decile). There the incidence of low-wage work has also increased. Minimum wages can be interpreted as a protection mechanism for the bottom part
of the distribution. Wage changes are a key driver of inequality: they explain around 25% of the
variation in changes in overall income inequality between 2006 and 2011 (in theEU28).
Other sources of household income, such as transfers and capital income alsocontribute to explaining trends in overall inequality. Evidence shows that the capitalincome has contributed most to the increase, while taxes have contributed to thedecrease and transfers15 have been neutral.
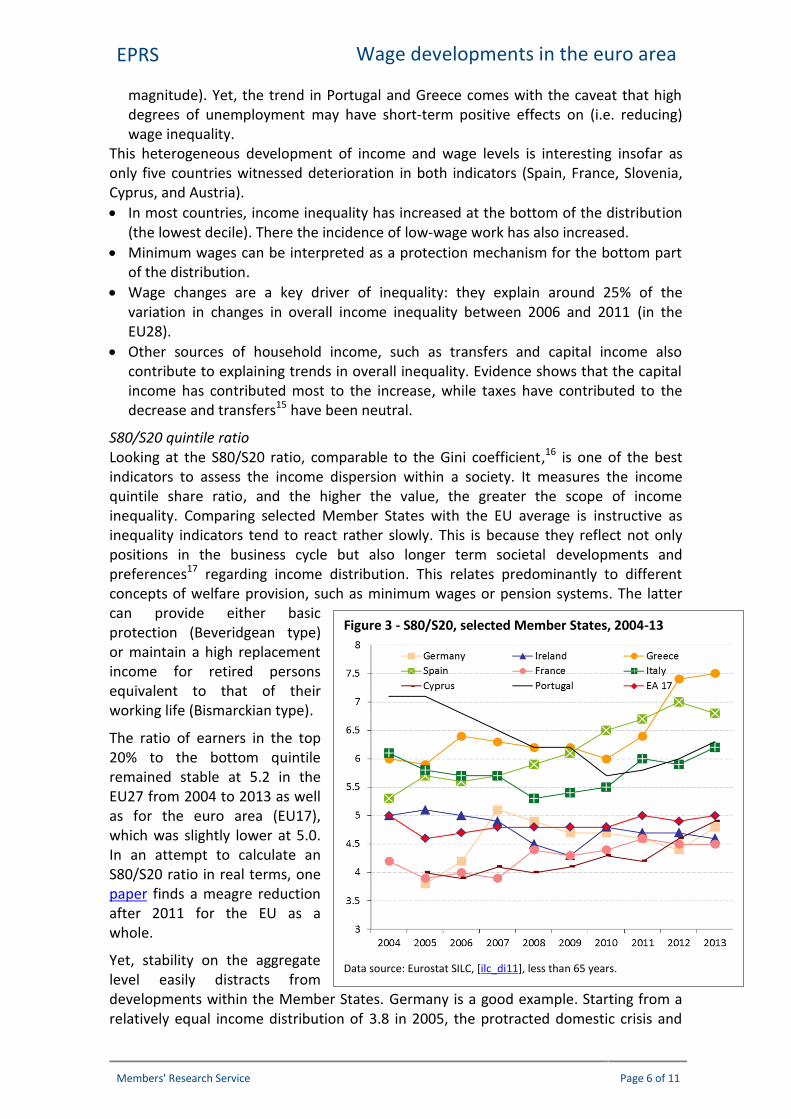
S80/S20 quintile ratioLooking at the S80/S20 ratio, comparable to the Gini coefficient,16 is one of the bestindicators to assess the income dispersion within a society. It measures the incomequintile share ratio, and the higher the value, the greater the scope of incomeinequality. Comparing selected Member States with the EU average is instructive asinequality indicators tend to react rather slowly. This is because they reflect not onlypositions in the business cycle but also longer term societal developments andpreferences17 regarding income distribution. This relates predominantly to differentconcepts of welfare provision, such as minimum wages or pension systems. The lattercan provide either basicprotection (Beveridgean type)or maintain a high replacementincome for retired personsequivalent to that of theirworking life (Bismarckian type).
The ratio of earners in the top20% to the bottom quintileremained stable at 5.2 in theEU27 from 2004 to 2013 as wellas for the euro area (EU17),which was slightly lower at 5.0.In an attempt to calculate anS80/S20 ratio in real terms, onepaper finds a meagre reductionafter 2011 for the EU as awhole.
Yet, stability on the aggregatelevel easily distracts fromdevelopments within the Member States. Germany is a good example. Starting from arelatively equal income distribution of 3.8 in 2005, the protracted domestic crisis and
Figure 3 - S80/S20, selected Member States, 2004-13
Data source: Eurostat SILC, [ilc_di11], less than 65 years.
EPRS Wage developments in the euro area
Members' Research Service Page 7 of 11
unseen levels of unemployment pushed the value in 2007 to 5.1 and dropped again to4.8 in 2013. Greece and Spain were affected by rising income inequality to much greaterextent. In 2004, the S80/S20 ratio in Spain was slightly above the EU17 average at 5.3and increased steadily to 6.8 in 2013 (most recent data available). Developments inGreece have been less linear. The ratio narrowed between 2006 and 2010 from 6.4 to6.0 but after that rose again to 7.5 in 2013, the most unequal ratio in the euro area. Onthe other hand, in the years running up to the economic and financial crisis, manyMember States of the euro area enjoyed increasing levels of equality, most notablyPortugal and Italy.
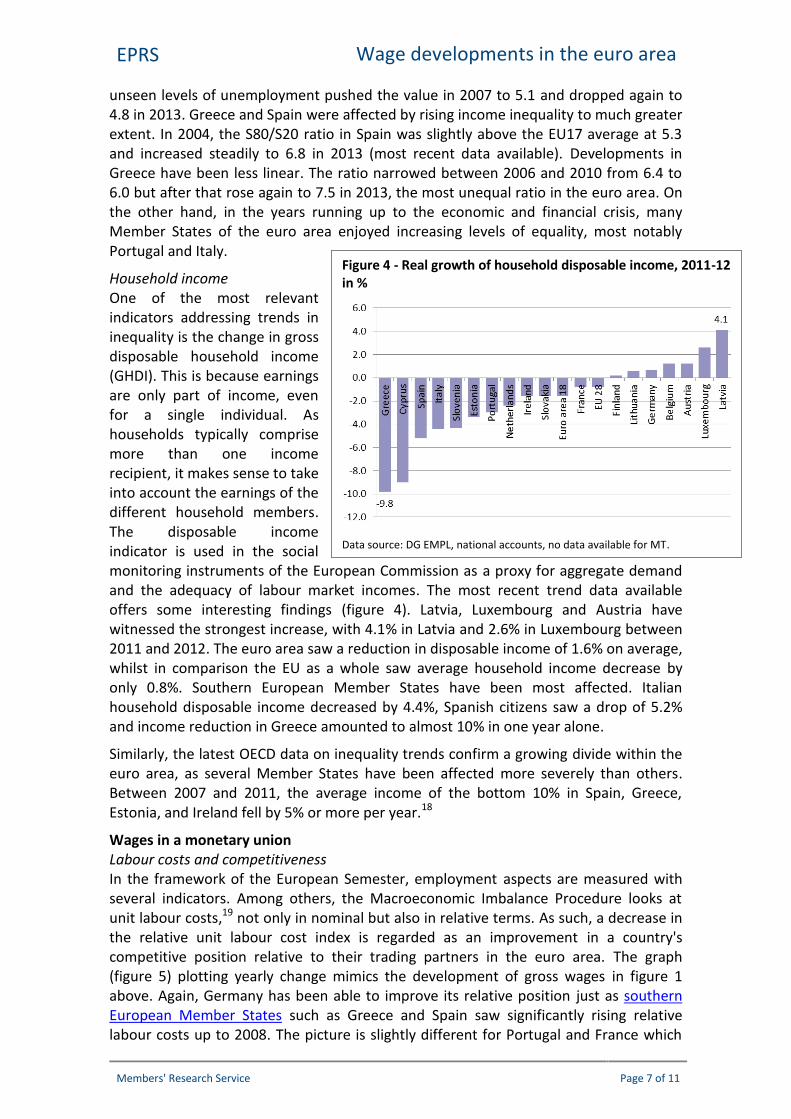
Household incomeOne of the most relevantindicators addressing trends ininequality is the change in grossdisposable household income(GHDI). This is because earningsare only part of income, evenfor a single individual. Ashouseholds typically comprisemore than one incomerecipient, it makes sense to takeinto account the earnings of thedifferent household members.The disposable incomeindicator is used in the socialmonitoring instruments of the European Commission as a proxy for aggregate demandand the adequacy of labour market incomes. The most recent trend data availableoffers some interesting findings (figure 4). Latvia, Luxembourg and Austria havewitnessed the strongest increase, with 4.1% in Latvia and 2.6% in Luxembourg between2011 and 2012. The euro area saw a reduction in disposable income of 1.6% on average,whilst in comparison the EU as a whole saw average household income decrease byonly 0.8%. Southern European Member States have been most affected. Italianhousehold disposable income decreased by 4.4%, Spanish citizens saw a drop of 5.2%and income reduction in Greece amounted to almost 10% in one year alone.
Similarly, the latest OECD data on inequality trends confirm a growing divide within theeuro area, as several Member States have been affected more severely than others.Between 2007 and 2011, the average income of the bottom 10% in Spain, Greece,Estonia, and Ireland fell by 5% or more per year.18
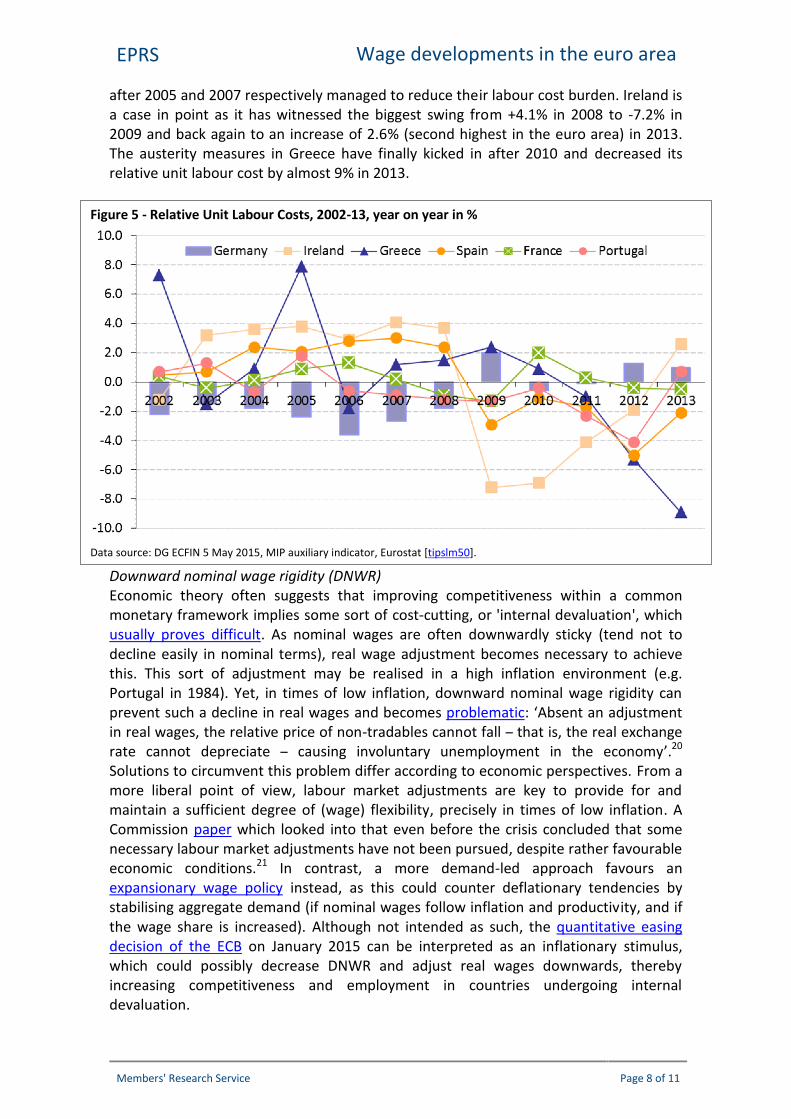
Wages in a monetary unionLabour costs and competitivenessIn the framework of the European Semester, employment aspects are measured withseveral indicators. Among others, the Macroeconomic Imbalance Procedure looks atunit labour costs,19 not only in nominal but also in relative terms. As such, a decrease inthe relative unit labour cost index is regarded as an improvement in a country'scompetitive position relative to their trading partners in the euro area. The graph(figure 5) plotting yearly change mimics the development of gross wages in figure 1above. Again, Germany has been able to improve its relative position just as southernEuropean Member States such as Greece and Spain saw significantly rising relativelabour costs up to 2008. The picture is slightly different for Portugal and France which
Figure 4 - Real growth of household disposable income, 2011-12in %
Data source: DG EMPL, national accounts, no data available for MT.
EPRS Wage developments in the euro area
Members' Research Service Page 8 of 11
after 2005 and 2007 respectively managed to reduce their labour cost burden. Ireland isa case in point as it has witnessed the biggest swing from +4.1% in 2008 to -7.2% in2009 and back again to an increase of 2.6% (second highest in the euro area) in 2013.The austerity measures in Greece have finally kicked in after 2010 and decreased itsrelative unit labour cost by almost 9% in 2013.
Downward nominal wage rigidity (DNWR)Economic theory often suggests that improving competitiveness within a commonmonetary framework implies some sort of cost-cutting, or 'internal devaluation', whichusually proves difficult. As nominal wages are often downwardly sticky (tend not todecline easily in nominal terms), real wage adjustment becomes necessary to achievethis. This sort of adjustment may be realised in a high inflation environment (e.g.Portugal in 1984). Yet, in times of low inflation, downward nominal wage rigidity canprevent such a decline in real wages and becomes problematic: ‘Absent an adjustmentin real wages, the relative price of non-tradables cannot fall – that is, the real exchangerate cannot depreciate – causing involuntary unemployment in the economy’.20
Solutions to circumvent this problem differ according to economic perspectives. From amore liberal point of view, labour market adjustments are key to provide for andmaintain a sufficient degree of (wage) flexibility, precisely in times of low inflation. ACommission paper which looked into that even before the crisis concluded that somenecessary labour market adjustments have not been pursued, despite rather favourableeconomic conditions.21 In contrast, a more demand-led approach favours anexpansionary wage policy instead, as this could counter deflationary tendencies bystabilising aggregate demand (if nominal wages follow inflation and productivity, and ifthe wage share is increased). Although not intended as such, the quantitative easingdecision of the ECB on January 2015 can be interpreted as an inflationary stimulus,which could possibly decrease DNWR and adjust real wages downwards, therebyincreasing competitiveness and employment in countries undergoing internaldevaluation.
Figure 5 - Relative Unit Labour Costs, 2002-13, year on year in %
Data source: DG ECFIN 5 May 2015, MIP auxiliary indicator, Eurostat [tipslm50].
EPRS Wage developments in the euro area
Members' Research Service Page 9 of 11
Panel data indicate that the financial and economic crisis has indeed triggered reformswhich successfully increased real wage flexibility.22 Still, for the time being, themonetary union faces stark differences regarding real wage adjustment mechanisms,depending on labour market institutions, maturity of the economy and the businesscycle. Despite the possible clash of economic approaches, Member States entertaindifferently regulated labour markets,23 which ultimately reflect societal and politicaldecisions and make one-size-fits-all solutions difficult. This is especially true as theremight be a trade-off between improving wage flexibility and income inequality. Whileresearch suggests that low labour market regulation goes in line with high real wageflexibility,24 a 2015 European Parliament study finds that countries with morecentralised wage-bargaining systems report lower inequality indices.25
The European Semester and the European ParliamentThe European Parliament has played an active role in formulating social andemployment policy to fight unemployment and promote better social conditions.Through its resolutions 'Towards a Genuine Economic and Monetary Union' (EMU) in2012 and 'Strengthening the Social Dimension of EMU' in 2013, Parliament activelycontributed to the debate on the social dimension of the economic and monetaryunion. It has stressed the need to integrate social and employment objectives into theEuropean Semester properly, by broadening the social indicators and making thembinding. In addition, the Parliament has repeatedly emphasised that the social andemployment effects of the reforms and crisis need to be addressed, with theinvolvement of the social partners. It has also reiterated its desire to see its decision-making role in this process expanded, including a strengthened role in the setting ofemployment priorities and guidelines. In particular, the Parliament gained the right togive its opinion on the current fiscal coordination cycle and the establishment of anEconomic Dialogue (the EP may invite Commission and Council Presidents, amongstothers, for discussion). Since the start of the eighth term, the Employment Committeehas prepared a motion for resolution and oral questions to the Commission and theCouncil on the employment and social aspects of the EU2020 strategy, with the aim ofrekindling the debate and putting employment and social considerations on an equalfooting with macroeconomic ones. Members adopted the resolution during theNovember 2014 plenary session.
Social scoreboardIn a communication of October 2013, the Commission introduced a 'social scoreboard', to beincluded in the benchmarking activities of the European Semester. The 5+1 indicators areunemployment rate, youth unemployment, NEETs (not in education, employment nor training),real growth in gross household disposable income (GHDI), at-risk-of-poverty rate (AROP), as wellas the inequality indicator S80/S20. Since 2014 the scoreboard results feed into the JointEmployment Report (JER, Article 148 TFEU) which accompanies the Annual Growth Survey (AGS)and are also included in the Alert Mechanism Report (AMR) to kick off the European Semesterevery November.
The European Parliament adopted in June 2015 a resolution on the economicgovernance framework, including aspects on how to strengthen the social dimensiontherein. Led by the Committee on Economic and Monetary Affairs, this 'Review of theeconomic governance framework: stocktaking and challenges' is intended to contributeto the debate on better functioning of the EMU. Such a debate should also address theEMU left-overs, including 'a minimum wage mechanism and a minimum unemployment
EPRS Wage developments in the euro area
Members' Research Service Page 10 of 11
scheme'. In a similar vein and commenting on the draft report, the EmploymentCommittee drew attention to the role of wages in macroeconomic imbalances.
Remaining challengesLooking at gross wage growth and relative labour costs, the euro area appears morebalanced today than prior to the financial and economic crisis. Nonetheless, regardingnet earnings, the heterogeneity of the euro area has not decreased. Moreover, despitethe first signs of economic recovery after the crisis, wages seem not to be picking up inthe way economic theory would suggest. This might be just a temporaryphenomenon,26 but it may equally become a prolonged development, given the unusualenvironment of low inflation rates for some time to come. Since a low inflationenvironment exacerbates downward nominal wage rigidity, 'internal devaluation' mayremain more problematic in terms of unemployment.
An option to mitigate the rising levels of income inequality in the monetary union is toincrease employment rates of women. The OECD estimates that if today's femaleemployment rate were as low as 20 to 25 years ago, income inequality would haveincreased by almost 1 Gini point more on the average.27
Growing shares of temporary and non-standard work over recent years affectpredominantly low-wage earners. Thus, experts suggest that more efforts should bemade to improve job-matching of skills, across sectors and regions, and to increase therelevance of employment monitoring as well as Active Labour Market Policies within theEuropean economic governance framework.
Main ReferencesNominal and real wage flexibility in EMU, A. Arpaia, K. Pichelmann, Economic Papers No. 281,DG ECFIN, European Commission, June 2007.
Wage and Income Inequality in the European Union, DG IPOL, Policy Department A, Study forthe EMPL Committee, European Parliament, 20 January 2015.
Wages and labour costs, Statistics Explained, Eurostat, March 2015.
Benchmarking Working Europe 2015, European Trade Union Institute, 2015.
Downward Nominal Wage Rigidity and the Case for Temporary Inflation in the Eurozone, S.Schmitt-Grohé, M. Uribe, Journal of Economic Perspectives, Vol. 27, No. 3, 2013, pp. 193-212.
In It Together. Why Less Inequality Benefits All, OECD, May, 2015.
Endnotes1 Euro area 1.5% in 2015 and 1.9% in 2016 (EU28 1.8% in 2015 and 2.1% in 2016). See Spring Forecast of the
European Commission, 5 May 2015.2 The Economist: When what comes down doesn't go up, 2 May 2015. In Europe, the United Kingdom has witnessed
falling real wages for seven consecutive years, and thus the 'longest period of pay stagnation since 1855', see: TheEconomist: What recovery? Workers continue to feel the pinch, 25 October 2014.
3 See e.g. Portugal, Pedro: The Portuguese Economic Crisis. Policies and Outcomes, Bertelsmann Stiftung, PolicyBrief, Gütersloh, February 2015.
4 Data on gross earnings is collected in Eurostat's four-yearly structure of earnings survey (SES), a firm-based survey.5 'Median' refers to the middle value, in which half the wage earners are above the median and half are below.6 Low-wage earners are defined as those employees earning two thirds or less of the national median gross hourly
earnings in a particular country.7 The European Commission applies the following definition: The sum of 'Gross wages and salaries; households and
NPISH (Non Profit Institutions Serving Households)' as received by households. Source: European Commission,AMECO Database (Annual macroeconomic database).
EPRS Wage developments in the euro area
Members' Research Service Page 11 of 11
8 A business cycle refers to fluctuations in economic activity, entailing expansion and recession periods. During aneconomic upswing (i.e. growth in real terms), employment and eventually salaries are assumed to rise as well.
9 Eurostat data [nama_10pc]. PPS are fictive 'currency' units that remove differences in purchasing power, i.e.different price levels between countries. These parities are obtained as a weighted average of relative price ratiosin respect of a homogeneous basket of goods and services, both comparable and representative for each country.
10 Among the euro area members Austria, Cyprus, Finland, and Italy do not have a universal minimum wage regime.11 Mau, Steffen: Inequality, Marketization and the Majority Class. Why Did the European Middle Classes Accept Neo-
Liberalism?, Houndmills: Palgrave, 2015.12 OECD: In It Together. Why Less Inequality Benefits All, Paris, May, 2015, p. 15.13 European Parliament: Wage and Income Inequality in the European Union, DG IPOL, Policy Department A, Study
for the EMPL Committee, Brussels, 20 January 2015, p. 11, 20, 39, 62.14 Here measured as 'change in Gini index for annual wages', based on EU SILC data, European Parliament (2015), p.
39, micro data item [PY010G].15 The finding regarding the role of transfers, particularly in Member States running an economic adjustment
programme, is contested.16 Here, we prefer the S80/S20 indicator over Gini because of its use in the social scoreboard in the European
Commission and the Open Method of Coordination for social protection and social inclusion (Social OMC). TheSocial OMC provides a framework for national strategy development for social protection and social investment,beyond the treaty competences. The Gini coefficient is an index used to measure the level of income inequality ina particular country at one point in time. It ranges from 0 to 100, where 0 represents perfect equality in a society.
17 For a recent discussion see Brady, David; Bostic, Amie: Paradoxes of Social Policy: Welfare Transfers, RelativePoverty, and Redistribution Preferences, in: American Sociological Review, Vol. 80, No 2, 2015, pp. 268-298.
18 OECD 2015, op. cit., p. 106.19 Unit labour cost (ULC) is defined as the ratio of labour costs to labour productivity. Compiled as a relative unit it
measures the trading position of an individual country relative to its partners in the euro area and as such offersan indication about changes in its competitive position.
20 Schmitt-Grohé, Stephanie; Uribe, Martin: Downward Nominal Wage Rigidity and the Case for Temporary Inflationin the Eurozone, in: Journal of Economic Perspectives, Vol. 27, No. 3, 2013, p. 210.
21 Arpaia, Alfonso and Pichelmann, Karl, Nominal and real wage flexibility in EMU, European Economy No 281, June2007, European Commission, DG ECFIN, p. 30.
22 Rusinova, Desislava; Lipatov, Vilen; Heinz, Frigyes Ferdinand: How flexible are real wages in EU countries? A panelinvestigation, in: Journal of Macroeconomics, Vol 43, March, 2015, p. 149.
23 Such as varying degrees of trade union density, collective bargaining coverage, company vs. sectoral wageagreements, etc. One might add that rigidities may have positive effects on consumption levels as they stabiliseincome expectations.
24 Rusinova et al 2015, op. cit., p. 148.25 European Parliament 2015, op. cit., p. 61.26 The Economist 2015, op. cit.27 OECD 2015, op. cit., p. 16.
Disclaimer and CopyrightThe content of this document is the sole responsibility of the author and any opinions expressed thereindo not necessarily represent the official position of the European Parliament. It is addressed to theMembers and staff of the EP for their parliamentary work. Reproduction and translation for non-commercial purposes are authorised, provided the source is acknowledged and the European Parliament isgiven prior notice and sent a copy.
© European Union, 2015.
Photo credits: © stockphoto-graf / Fotolia.
[email protected]://www.eprs.ep.parl.union.eu (intranet)http://www.europarl.europa.eu/thinktank (internet)http://epthinktank.eu (blog)