Embed Size (px)
Citation preview
Asset Allocation and Diversification Strategies
Key Factors to Consider
April 18, 2016
Keel Point provides wealth advisory services to institutions and families.
Securities offered through KPC, Member FINRA/SIPC. Investment Advisory services offered by Keel Point, an affiliate of KPC.
2
Important Disclosures
2
This presentation may contain forward-looking statements relating to anticipated future events, results, circumstances,
performance or expectations that are not historical facts but instead represent our beliefs regarding future events. By their nature,
forward-looking statements require us to make assumptions and are subject to inherent risks and uncertainties. There is
significant risk that predictions and other forward-looking statements will not prove to be accurate. We caution readers of this
document not to place undue reliance on our forward-looking statements as a number of factors could cause actual future results,
conditions, actions or events to differ materially from the targets, expectations, estimates or intentions expressed or implied in the
forward-looking statements. We caution that the foregoing list of factors is not exhaustive and that when relying on forward-
looking statements to make decisions with respect to investing you should carefully consider these factors, as well as other
uncertainties and potential events, and the inherent uncertainty of forward-looking statements. Due to the potential impact of
these factors, Keel Point does not undertake, and specifically disclaims, any intention or obligation to update or revise any
forward-looking statements, whether as a result of new information, future events or otherwise, unless required by applicable law.
Keel Point does not give tax, accounting, regulatory, or legal advice to its clients. The effectiveness of any of the strategies
described will depend on your individual situation and on a number of complex factors. You should consult with your other
advisors on the tax, accounting, and legal implications of these proposed strategies before any strategy is implemented.
THE DISCLOSURES FOLLOWING THIS PRESENTATION ARE AN INTEGRAL PART OF ITS
CONTENT AND SHOULD BE READ TOGETHER WITH THE INFORMATION PRESENTED.
3
Overview of Discussion
• Impact of Government & Dangers
• Global Condition and Outlook
• Asset Allocation & the Efficient Frontier
• Risk Expression Across Asset Classes
• Portfolio Simulation in Model & Custom
• Traditional vs Alternative Asset Classes
3

4
5
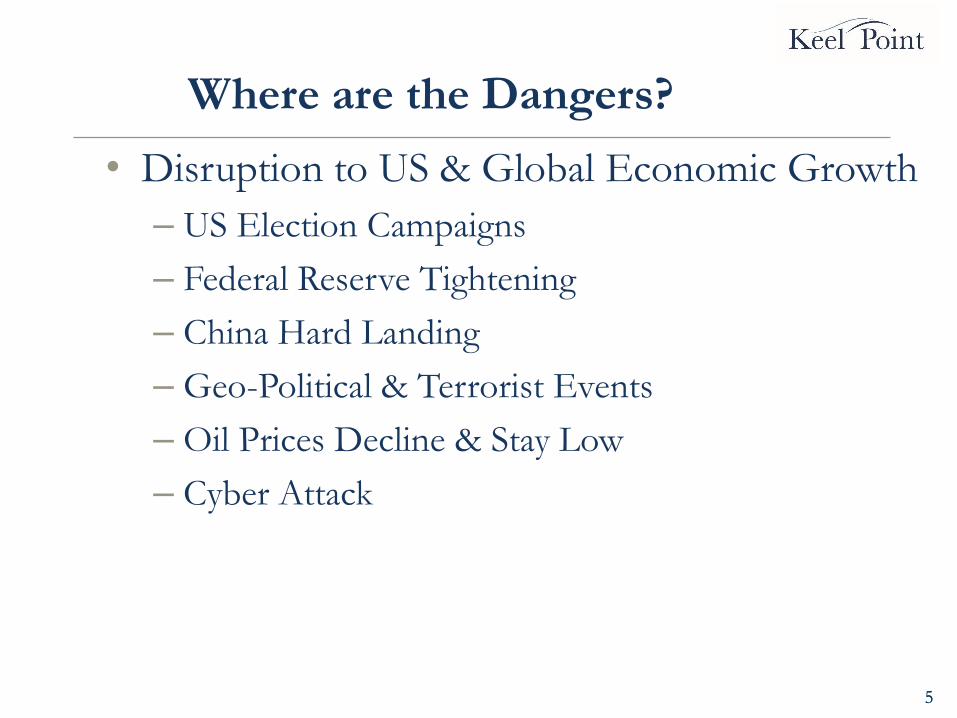
Where are the Dangers?
• Disruption to US & Global Economic Growth
– US Election Campaigns
– Federal Reserve Tightening
– China Hard Landing
– Geo-Political & Terrorist Events
– Oil Prices Decline & Stay Low
– Cyber Attack
5

6
Government Players
Source: CNN Politics 6
7
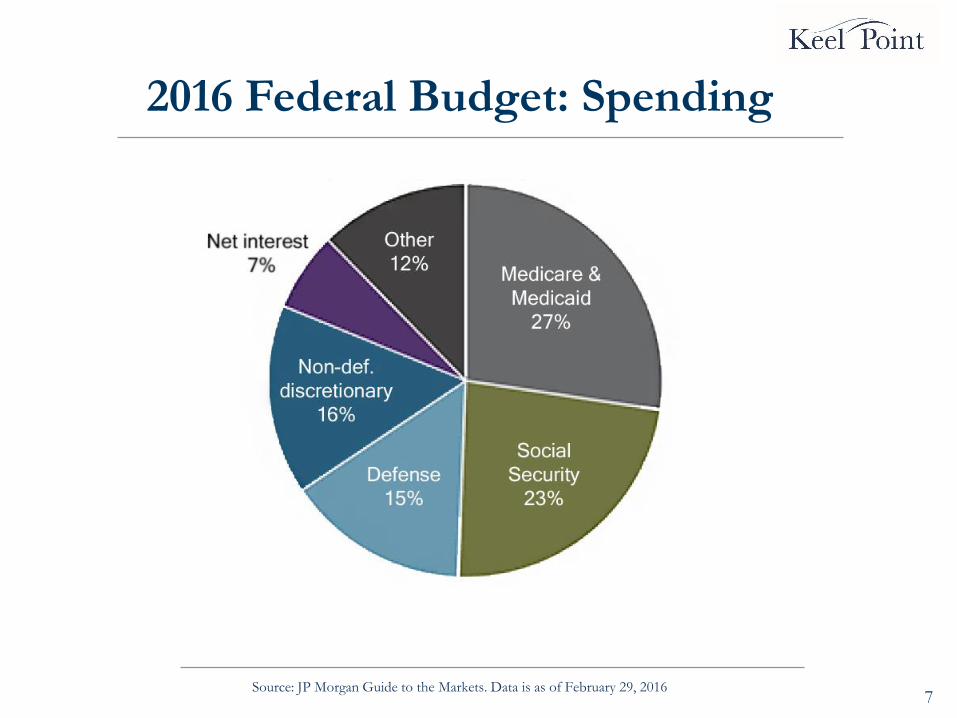
2016 Federal Budget: Spending
Source: JP Morgan Guide to the Markets. Data is as of February 29, 2016
8
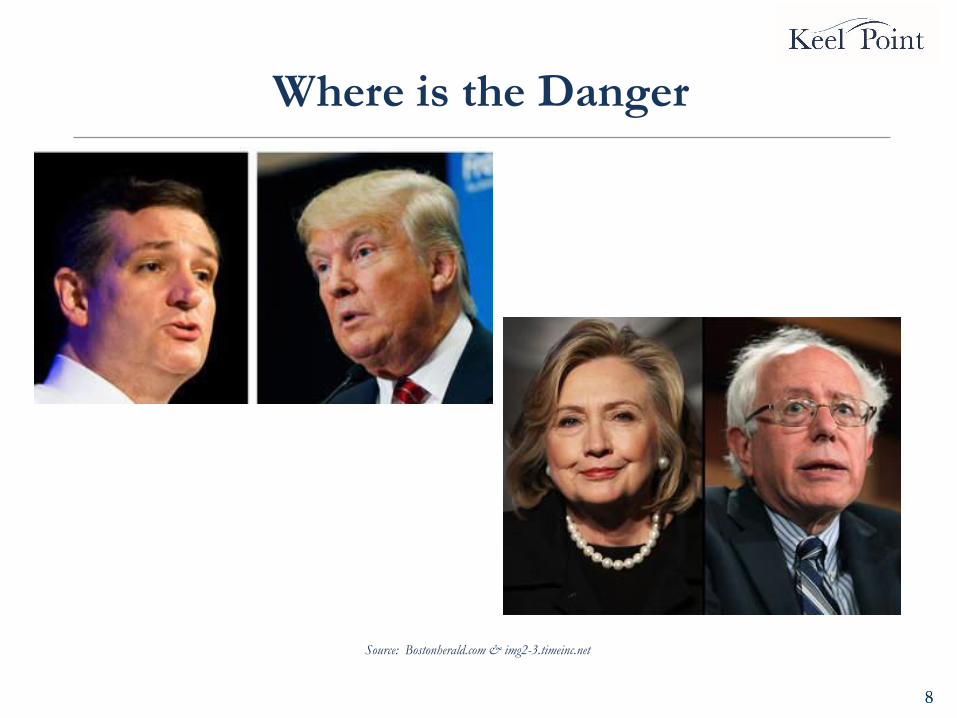
Where is the Danger
Source: Bostonherald.com & img2-3.timeinc.net
8
9
Candidate & Protectionism
• “Bank has started calling / And the wolves are
at my door” Cost of Livin’ by Ronnie Dunn
• 20% of ‘99-’11factory job losses => China
• Candidates Increasingly Protectionist
• 1846 UK Corn Laws: poor farmers paid most
• China Imports Increase Spending Power
• Median Income would Lose 29% spending power
• Lower Income would Lose 62% spending power
9
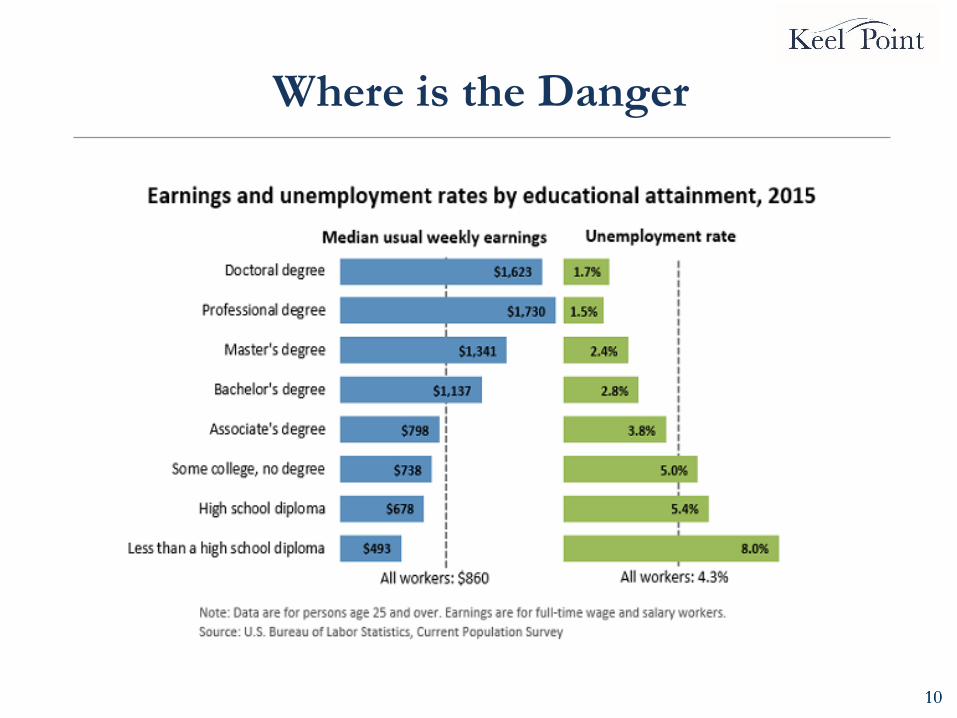
10
Where is the Danger
10

11
Who is in Charge?
Source: bing 11
12
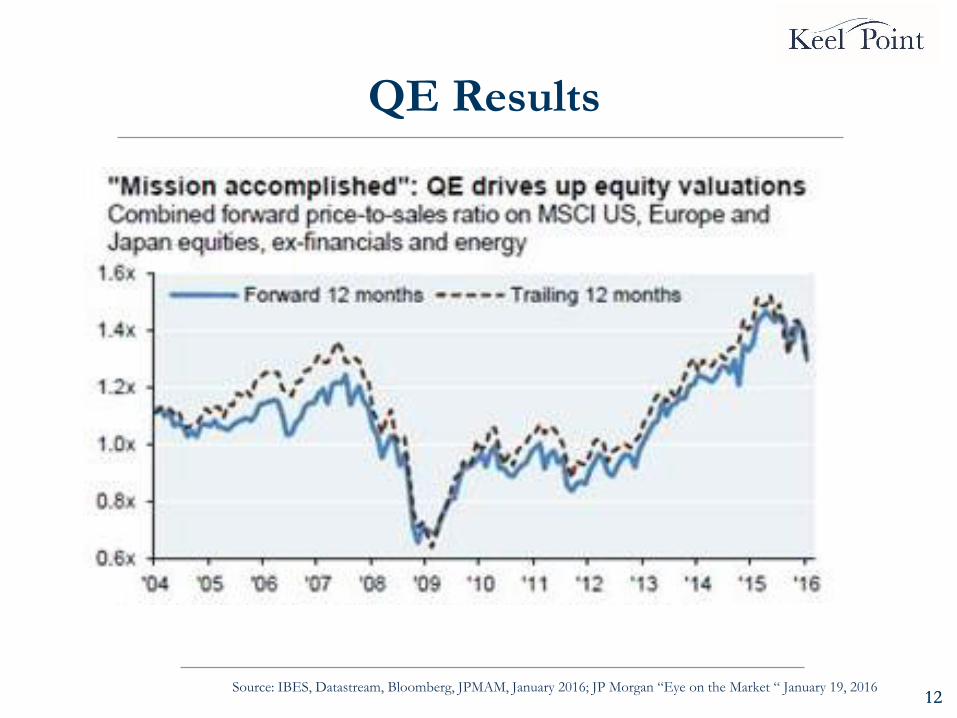
QE Results
Source: IBES, Datastream, Bloomberg, JPMAM, January 2016; JP Morgan “Eye on the Market “ January 19, 2016 12
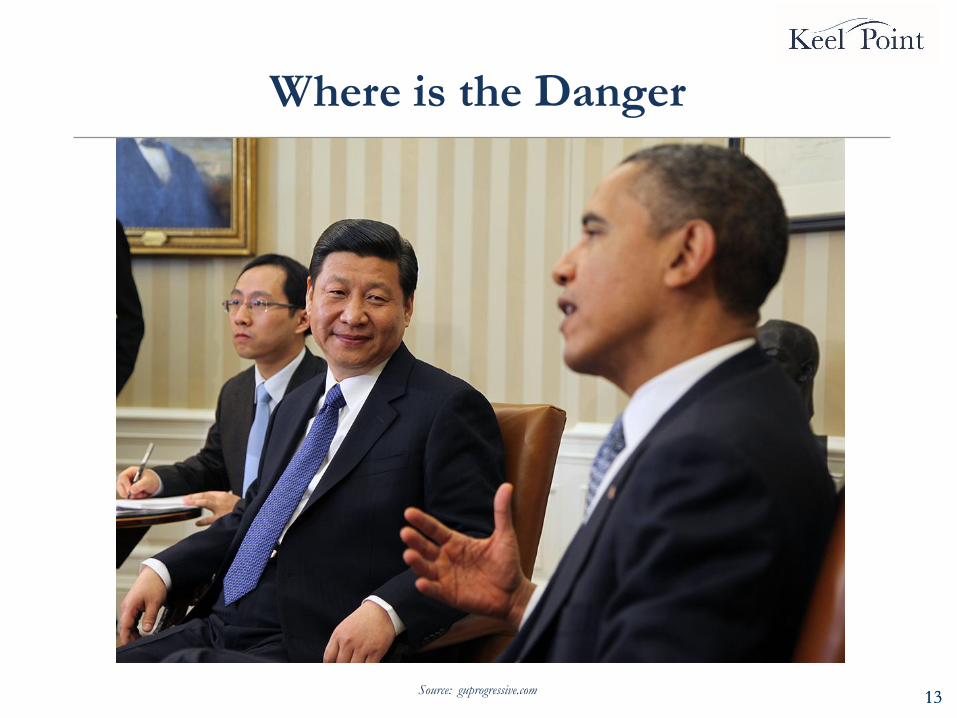
13 Source: guprogressive.com
13
Where is the Danger

14
Where is the Danger
Source: hersfelder-zeitung.de
14
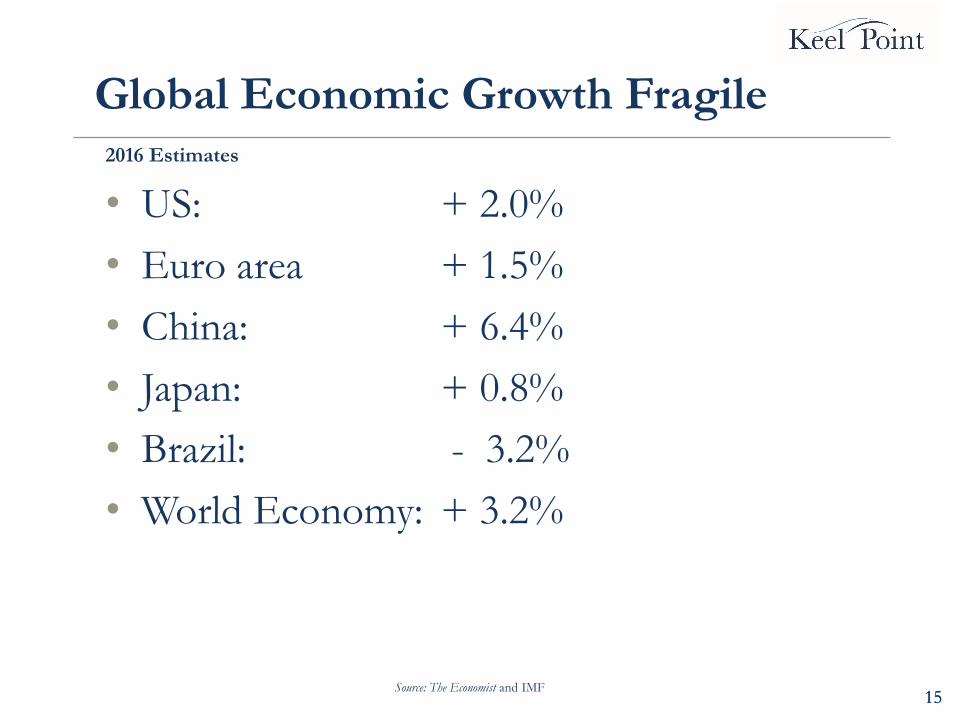
15
Global Economic Growth Fragile 2016 Estimates
• US: + 2.0%
• Euro area + 1.5%
• China: + 6.4%
• Japan: + 0.8%
• Brazil: - 3.2%
• World Economy: + 3.2%
15 Source: The Economist and IMF
16
Japan
Euro-Zone*
China
Australia India Brazil
U.S.
-21.0%
Canada
U.K.
Russia
-18.1%
Hong Kong
Source: BB&T
Wealth; S&P; MSCI
-6.2%
-25.7%
-9.9%
-14.2%
-22.8% -26.4% -40.0%
*Eurozone comprised of 17
countries that use the Euro as its
currency. Largest constituents
include Germany, France and
Italy.
Mexico
-17.3%
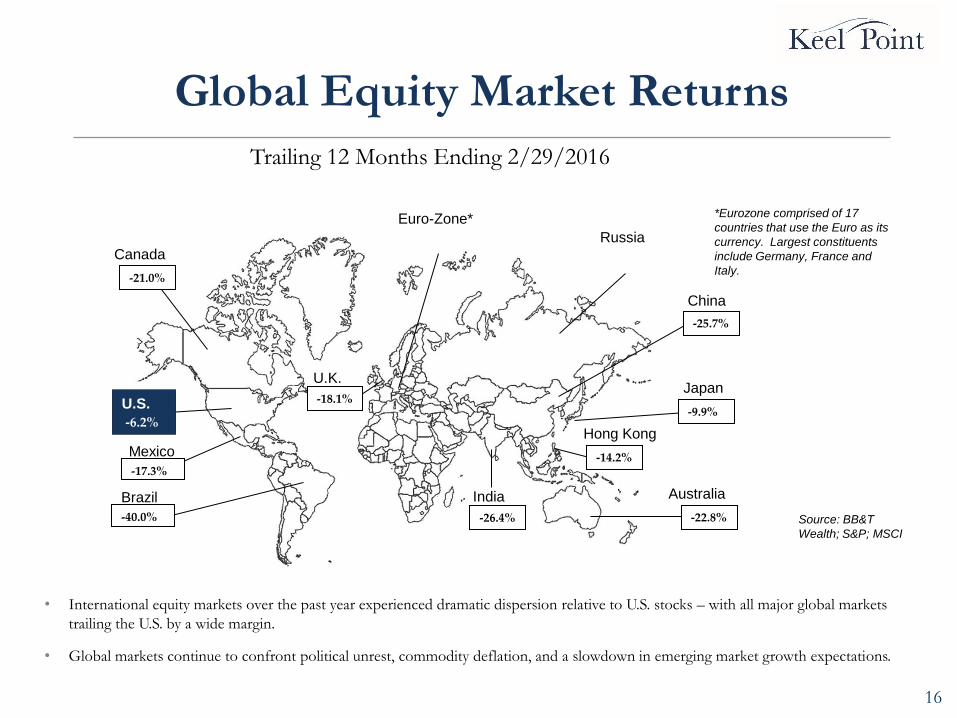
Global Equity Market Returns
• International equity markets over the past year experienced dramatic dispersion relative to U.S. stocks – with all major global markets
trailing the U.S. by a wide margin.
• Global markets continue to confront political unrest, commodity deflation, and a slowdown in emerging market growth expectations.
Trailing 12 Months Ending 2/29/2016
17
Global Economic Growth – US
• Job Growth without inflation
• Consumer Spending
• Energy Prices: +/- $40
• Money Policy: Next – Rising Interest Rate?
• U.S. $ Higher vs. Europe & Japan
• Higher Imports & Lower Exports
Source: IMF; Bloomberg
17
18
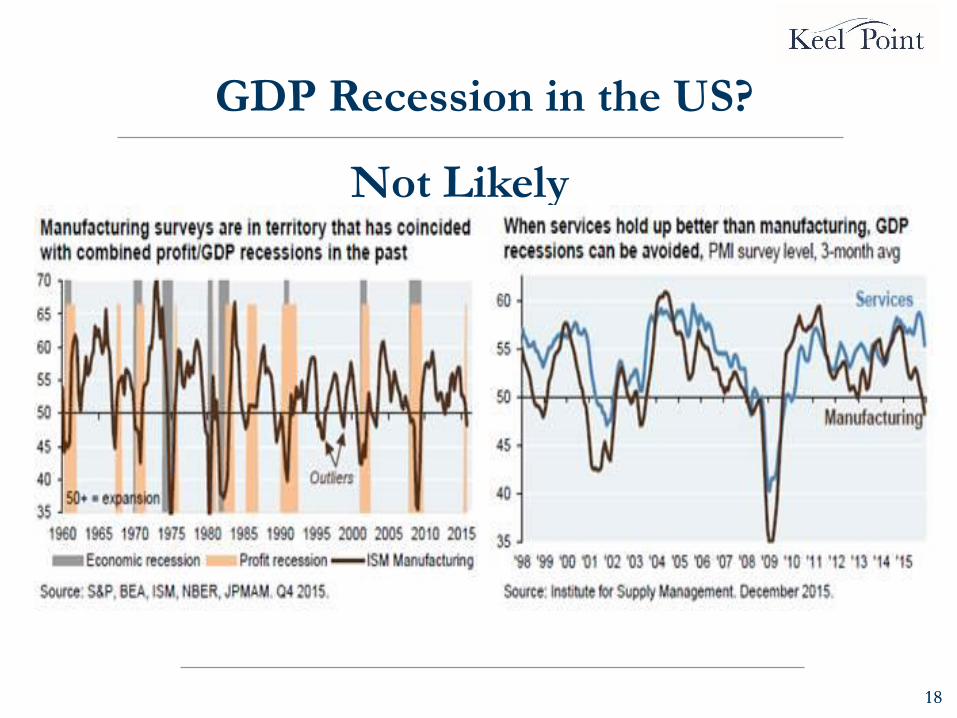
GDP Recession in the US?
Not Likely
18
19
Global Economic Growth – Europe
• Recovery in progress?
• ECB Massive Stimulus & Rescue
• Banking Union => Fiscal Union?
• Budget Deficits Shrinking
• Greece Exit or UK Exit from EU
19
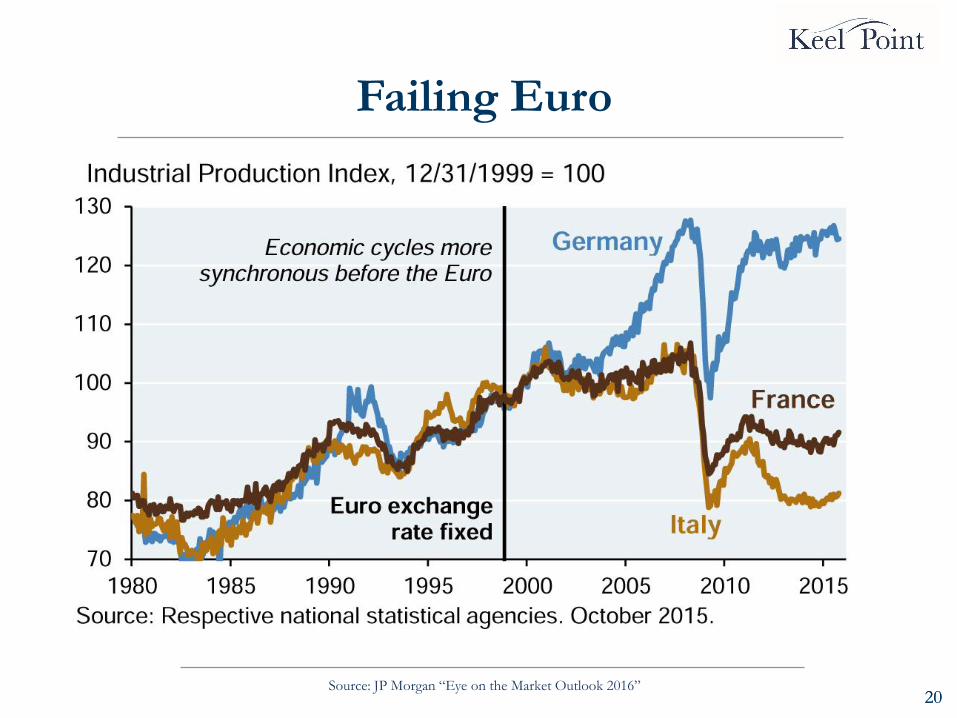
20 Source: JP Morgan “Eye on the Market Outlook 2016”
Failing Euro
20
21
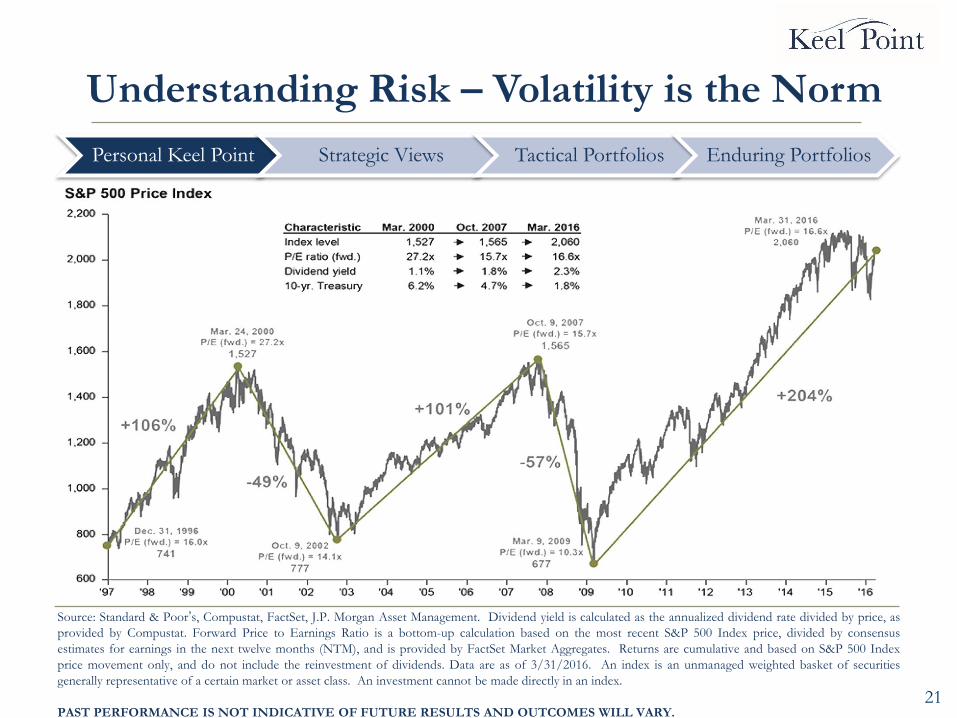
Understanding Risk – Volatility is the Norm
Source: Standard & Poor’s, Compustat, FactSet, J.P. Morgan Asset Management. Dividend yield is calculated as the annualized dividend rate divided by price, as
provided by Compustat. Forward Price to Earnings Ratio is a bottom-up calculation based on the most recent S&P 500 Index price, divided by consensus
estimates for earnings in the next twelve months (NTM), and is provided by FactSet Market Aggregates. Returns are cumulative and based on S&P 500 Index
price movement only, and do not include the reinvestment of dividends. Data are as of 3/31/2016. An index is an unmanaged weighted basket of securities
generally representative of a certain market or asset class. An investment cannot be made directly in an index.
PAST PERFORMANCE IS NOT INDICATIVE OF FUTURE RESULTS AND OUTCOMES WILL VARY.
Personal Keel Point Strategic Views Tactical Portfolios Enduring Portfolios
22
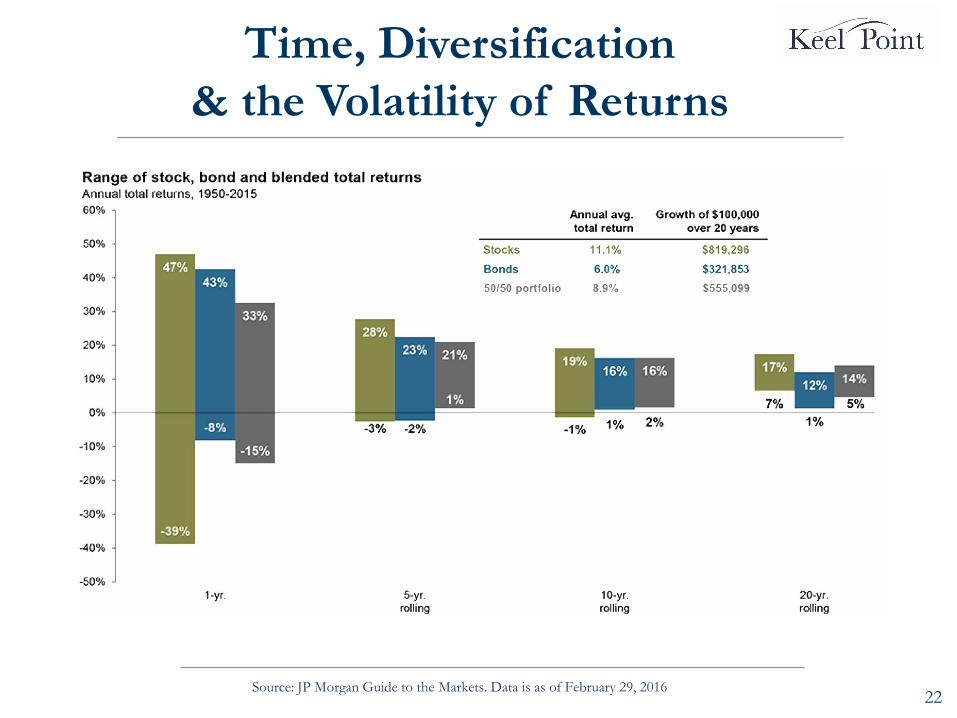
Time, Diversification
& the Volatility of Returns
Source: JP Morgan Guide to the Markets. Data is as of February 29, 2016
23
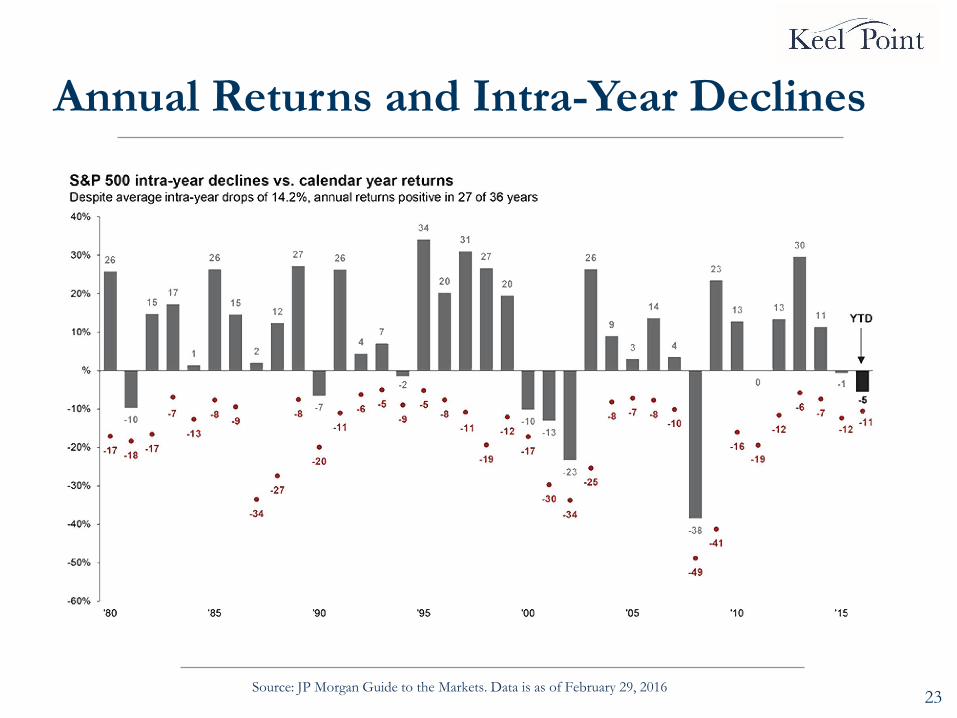
Annual Returns and Intra-Year Declines
Source: JP Morgan Guide to the Markets. Data is as of February 29, 2016
24 24
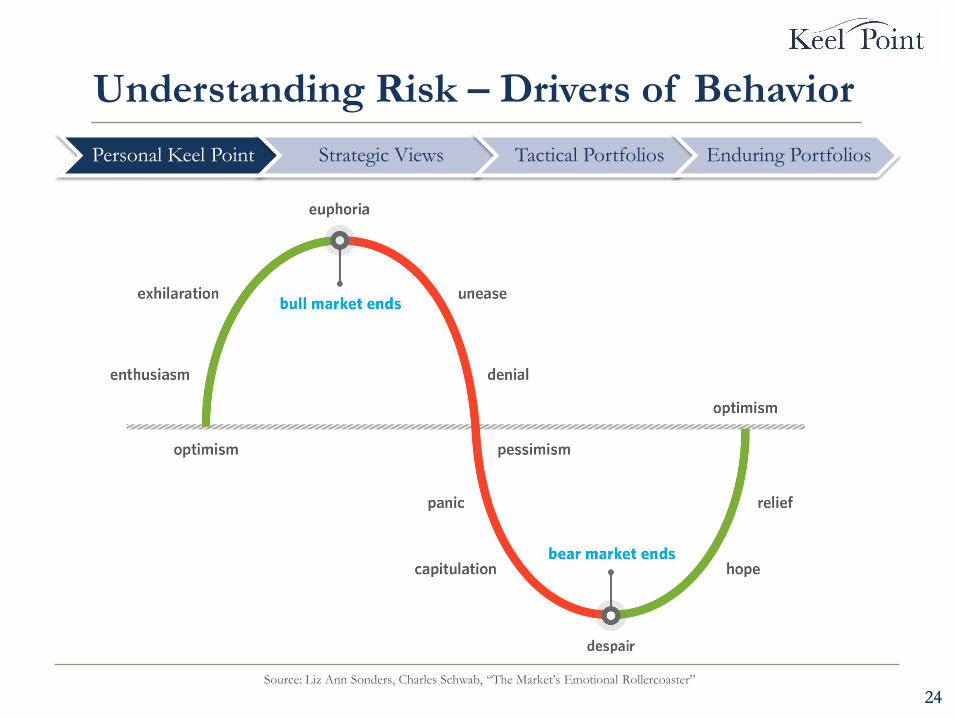
Understanding Risk – Drivers of Behavior
Source: Liz Ann Sonders, Charles Schwab, “The Market’s Emotional Rollercoaster”
Personal Keel Point Strategic Views Tactical Portfolios Enduring Portfolios
25 25
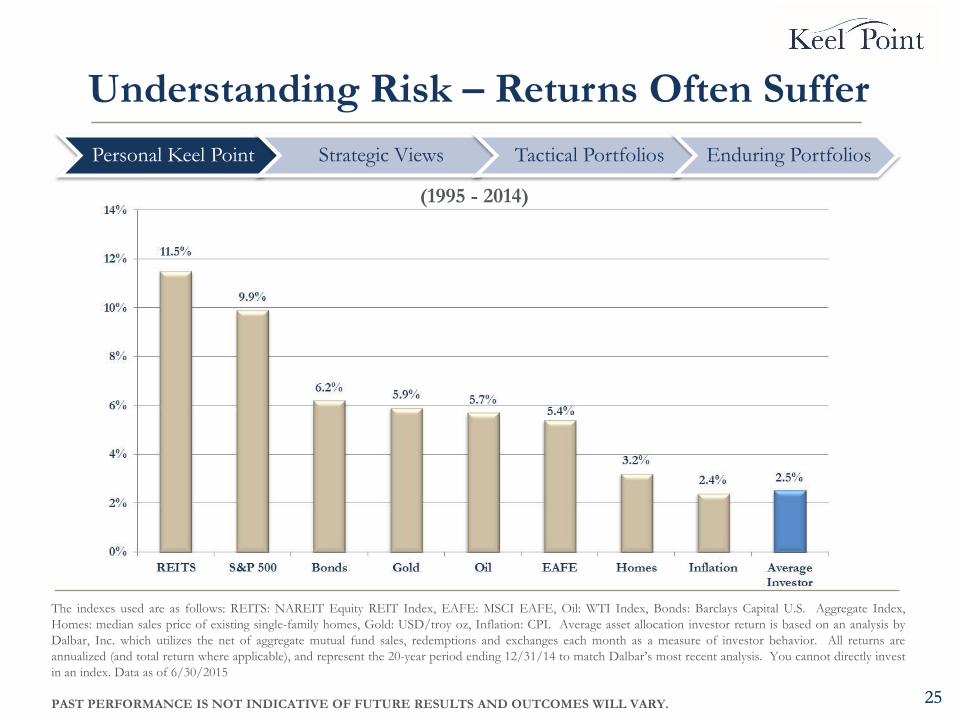
Understanding Risk – Returns Often Suffer
The indexes used are as follows: REITS: NAREIT Equity REIT Index, EAFE: MSCI EAFE, Oil: WTI Index, Bonds: Barclays Capital U.S. Aggregate Index,
Homes: median sales price of existing single-family homes, Gold: USD/troy oz, Inflation: CPI. Average asset allocation investor return is based on an analysis by
Dalbar, Inc. which utilizes the net of aggregate mutual fund sales, redemptions and exchanges each month as a measure of investor behavior. All returns are
annualized (and total return where applicable), and represent the 20-year period ending 12/31/14 to match Dalbar’s most recent analysis. You cannot directly invest
in an index. Data as of 6/30/2015
PAST PERFORMANCE IS NOT INDICATIVE OF FUTURE RESULTS AND OUTCOMES WILL VARY.
(1995 - 2014)
Personal Keel Point Strategic Views Tactical Portfolios Enduring Portfolios
26
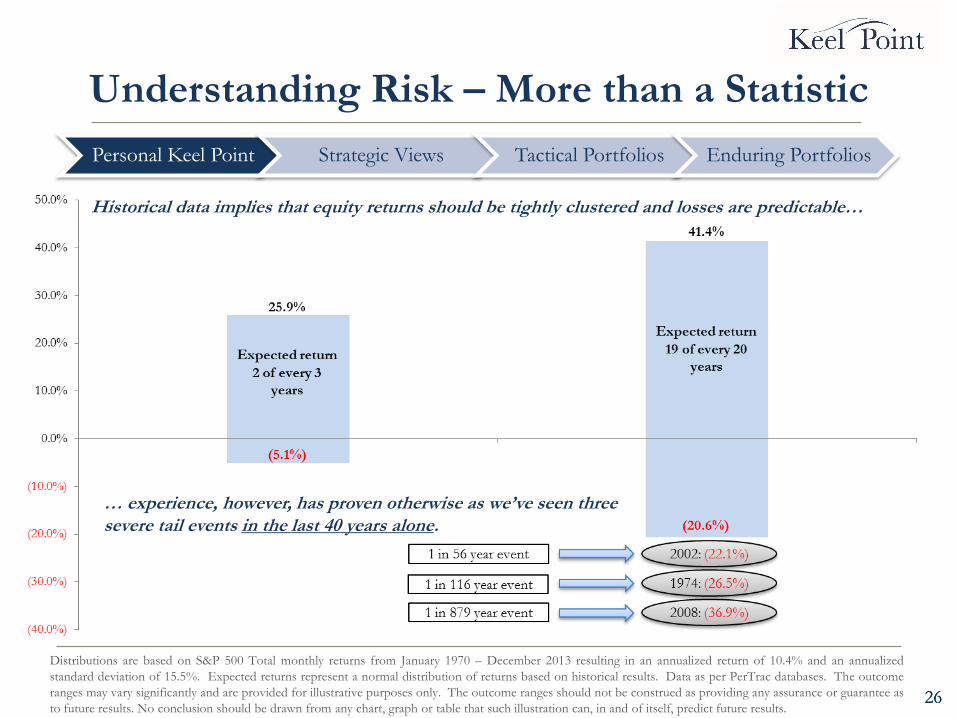
Distributions are based on S&P 500 Total monthly returns from January 1970 – December 2013 resulting in an annualized return of 10.4% and an annualized
standard deviation of 15.5%. Expected returns represent a normal distribution of returns based on historical results. Data as per PerTrac databases. The outcome
ranges may vary significantly and are provided for illustrative purposes only. The outcome ranges should not be construed as providing any assurance or guarantee as
to future results. No conclusion should be drawn from any chart, graph or table that such illustration can, in and of itself, predict future results. 26
Understanding Risk – More than a Statistic
… experience, however, has proven otherwise as we’ve seen three severe tail events in the last 40 years alone.
Personal Keel Point Strategic Views Tactical Portfolios Enduring Portfolios
Historical data implies that equity returns should be tightly clustered and losses are predictable…
27 27
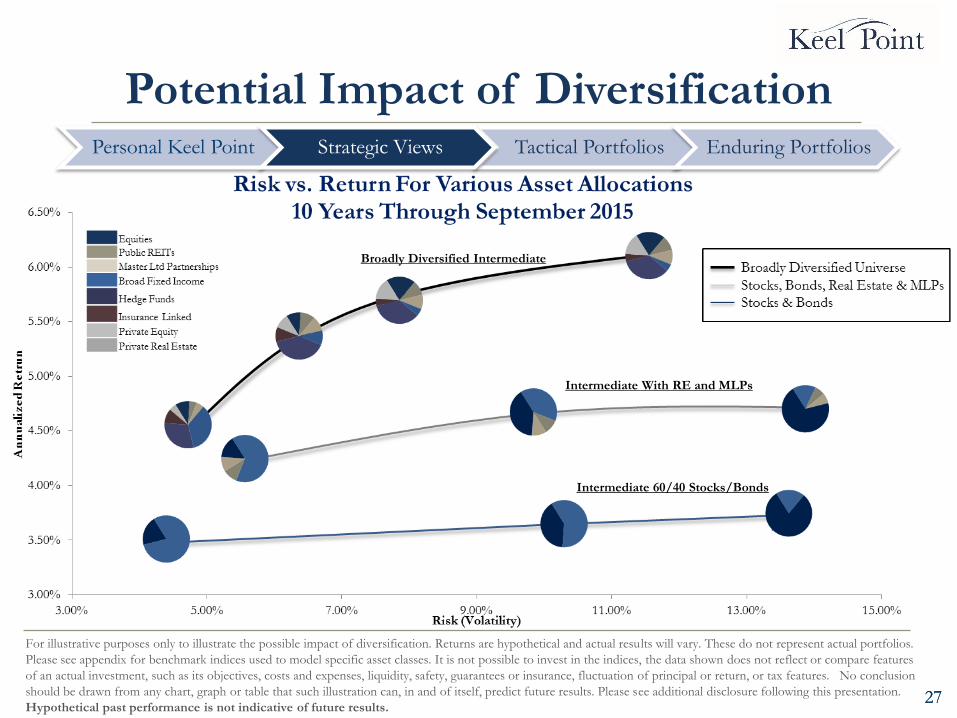
Potential Impact of Diversification
For illustrative purposes only to illustrate the possible impact of diversification. Returns are hypothetical and actual results will vary. These do not represent actual portfolios.
Please see appendix for benchmark indices used to model specific asset classes. It is not possible to invest in the indices, the data shown does not reflect or compare features
of an actual investment, such as its objectives, costs and expenses, liquidity, safety, guarantees or insurance, fluctuation of principal or return, or tax features. No conclusion
should be drawn from any chart, graph or table that such illustration can, in and of itself, predict future results. Please see additional disclosure following this presentation.
Hypothetical past performance is not indicative of future results.
Personal Keel Point Tactical Portfolios Enduring Portfolios Strategic Views
Broadly Diversified Intermediate
Intermediate With RE and MLPs
Intermediate 60/40 Stocks/Bonds
28 28
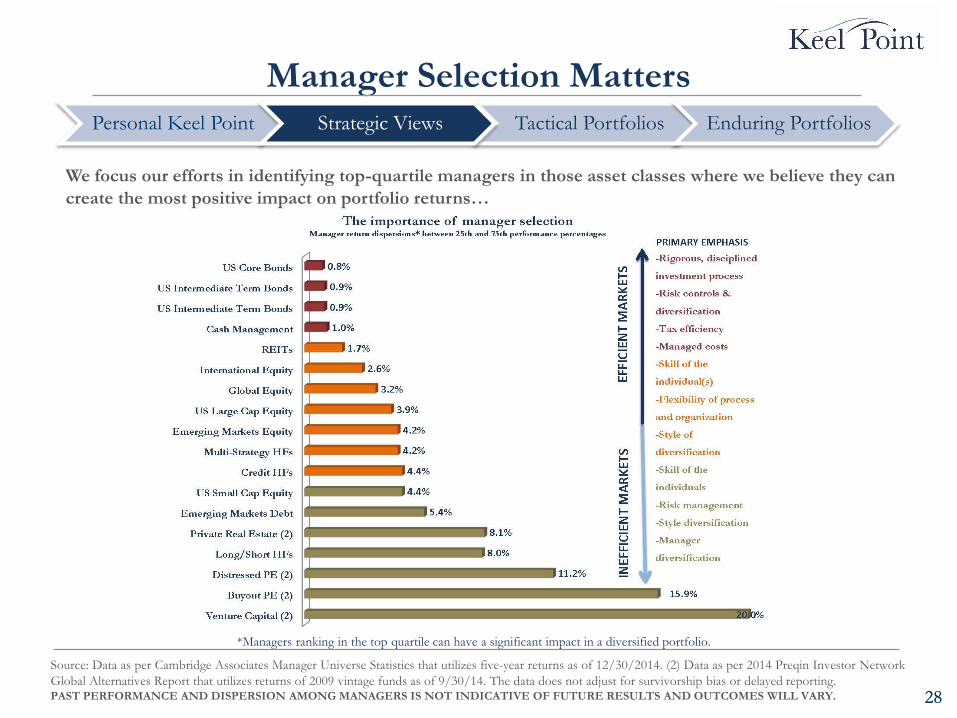
Manager Selection Matters
We focus our efforts in identifying top-quartile managers in those asset classes where we believe they can
create the most positive impact on portfolio returns…
Source: Data as per Cambridge Associates Manager Universe Statistics that utilizes five-year returns as of 12/30/2014. (2) Data as per 2014 Preqin Investor Network
Global Alternatives Report that utilizes returns of 2009 vintage funds as of 9/30/14. The data does not adjust for survivorship bias or delayed reporting. PAST PERFORMANCE AND DISPERSION AMONG MANAGERS IS NOT INDICATIVE OF FUTURE RESULTS AND OUTCOMES WILL VARY.
*Managers ranking in the top quartile can have a significant impact in a diversified portfolio.
Personal Keel Point Tactical Portfolios Enduring Portfolios Strategic Views
29
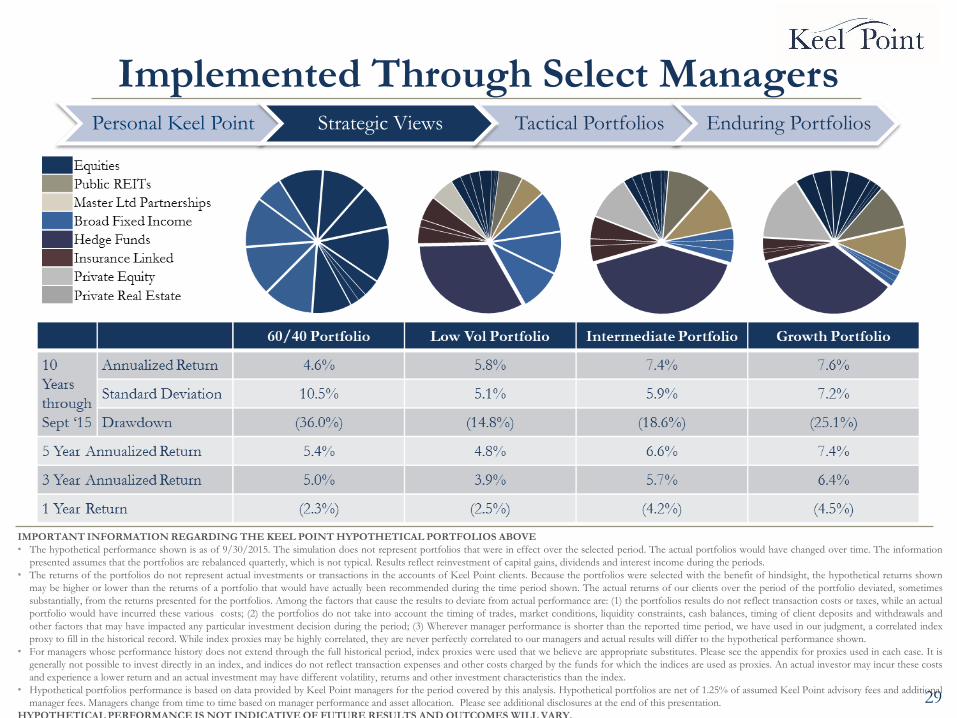
Implemented Through Select Managers
IMPORTANT INFORMATION REGARDING THE KEEL POINT HYPOTHETICAL PORTFOLIOS ABOVE
• The hypothetical performance shown is as of 9/30/2015. The simulation does not represent portfolios that were in effect over the selected period. The actual portfolios would have changed over time. The information
presented assumes that the portfolios are rebalanced quarterly, which is not typical. Results reflect reinvestment of capital gains, dividends and interest income during the periods.
• The returns of the portfolios do not represent actual investments or transactions in the accounts of Keel Point clients. Because the portfolios were selected with the benefit of hindsight, the hypothetical returns shown
may be higher or lower than the returns of a portfolio that would have actually been recommended during the time period shown. The actual returns of our clients over the period of the portfolio deviated, sometimes
substantially, from the returns presented for the portfolios. Among the factors that cause the results to deviate from actual performance are: (1) the portfolios results do not reflect transaction costs or taxes, while an actual
portfolio would have incurred these various costs; (2) the portfolios do not take into account the timing of trades, market conditions, liquidity constraints, cash balances, timing of client deposits and withdrawals and
other factors that may have impacted any particular investment decision during the period; (3) Wherever manager performance is shorter than the reported time period, we have used in our judgment, a correlated index
proxy to fill in the historical record. While index proxies may be highly correlated, they are never perfectly correlated to our managers and actual results will differ to the hypothetical performance shown.
• For managers whose performance history does not extend through the full historical period, index proxies were used that we believe are appropriate substitutes. Please see the appendix for proxies used in each case. It is
generally not possible to invest directly in an index, and indices do not reflect transaction expenses and other costs charged by the funds for which the indices are used as proxies. An actual investor may incur these costs
and experience a lower return and an actual investment may have different volatility, returns and other investment characteristics than the index.
• Hypothetical portfolios performance is based on data provided by Keel Point managers for the period covered by this analysis. Hypothetical portfolios are net of 1.25% of assumed Keel Point advisory fees and additional
manager fees. Managers change from time to time based on manager performance and asset allocation. Please see additional disclosures at the end of this presentation.
HYPOTHETICAL PERFORMANCE IS NOT INDICATIVE OF FUTURE RESULTS AND OUTCOMES WILL VARY.
Personal Keel Point Tactical Portfolios Enduring Portfolios Strategic Views
30
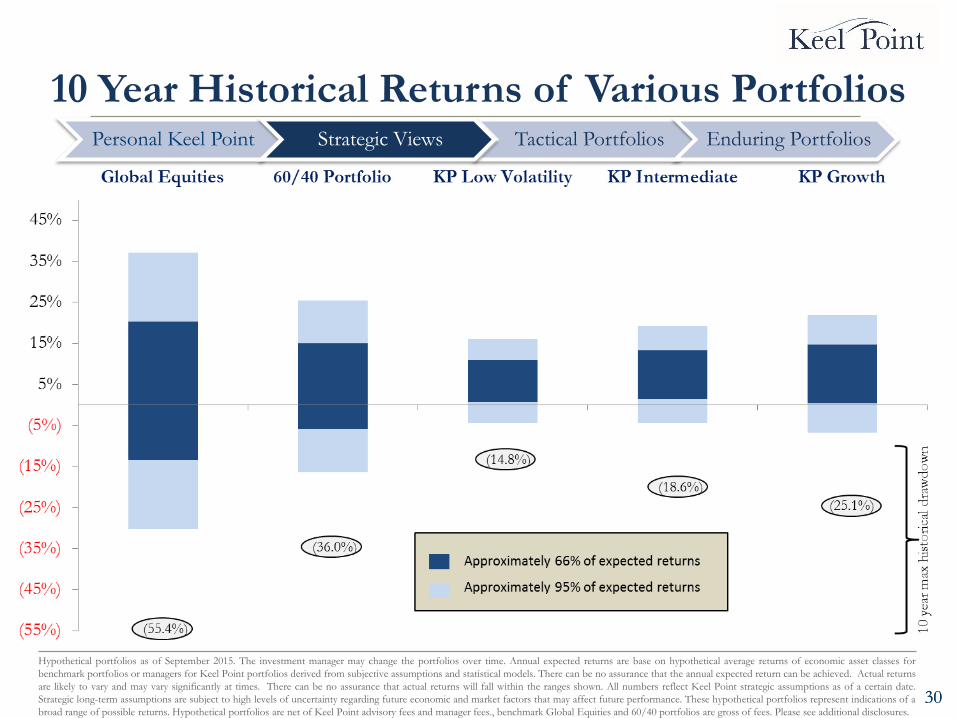
10 Year Historical Returns of Various Portfolios
30
Hypothetical portfolios as of September 2015. The investment manager may change the portfolios over time. Annual expected returns are base on hypothetical average returns of economic asset classes for
benchmark portfolios or managers for Keel Point portfolios derived from subjective assumptions and statistical models. There can be no assurance that the annual expected return can be achieved. Actual returns
are likely to vary and may vary significantly at times. There can be no assurance that actual returns will fall within the ranges shown. All numbers reflect Keel Point strategic assumptions as of a certain date.
Strategic long-term assumptions are subject to high levels of uncertainty regarding future economic and market factors that may affect future performance. These hypothetical portfolios represent indications of a
broad range of possible returns. Hypothetical portfolios are net of Keel Point advisory fees and manager fees., benchmark Global Equities and 60/40 portfolios are gross of fees. Please see additional disclosures.
Personal Keel Point Tactical Portfolios Enduring Portfolios Strategic Views
31
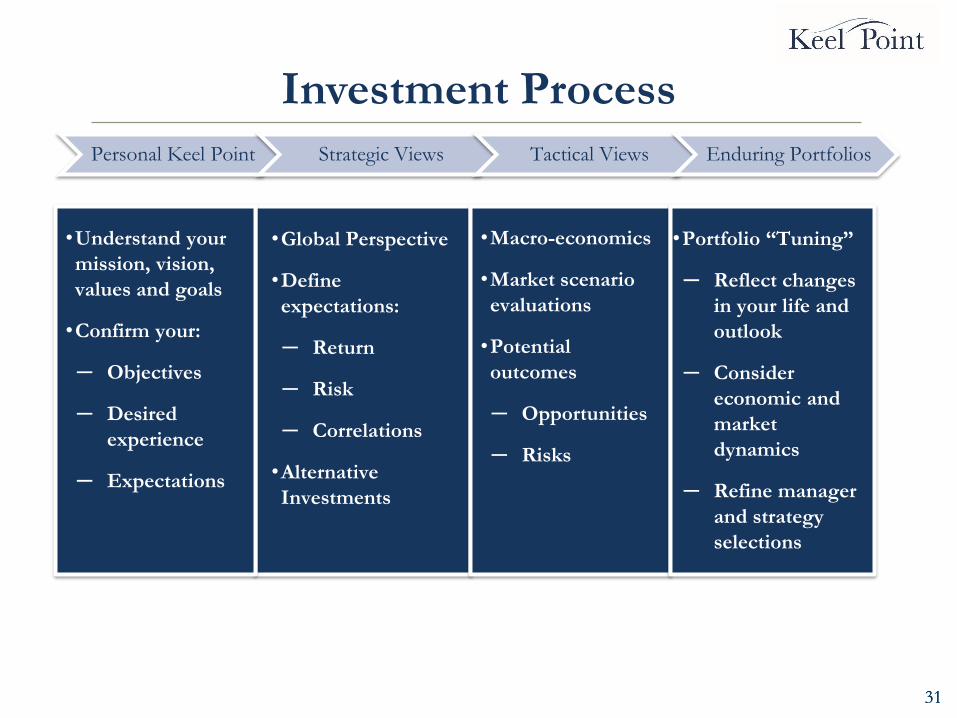
Investment Process
31
Personal Keel Point Strategic Views Tactical Views Enduring Portfolios
•Understand your
mission, vision,
values and goals
•Confirm your:
─ Objectives
─ Desired
experience
─ Expectations
•Global Perspective
•Define
expectations:
─ Return
─ Risk
─ Correlations
•Alternative
Investments
•Macro-economics
•Market scenario
evaluations
•Potential
outcomes
─ Opportunities
─ Risks
•Portfolio “Tuning”
─ Reflect changes
in your life and
outlook
─ Consider
economic and
market
dynamics
─ Refine manager
and strategy
selections
32
Portfolio Management Objectives
• Consistent Risk Expression Across Asset Classes
• Reduced Dispersion of Returns within Risk Categories
• Maintain Portfolio Construction Flexibility
• Consistent Performance Assessment
• Consistent Assessment of Portfolio Components
• Continue to Innovate New Strategies
• Prepare Platform for Additional Growth
32
34
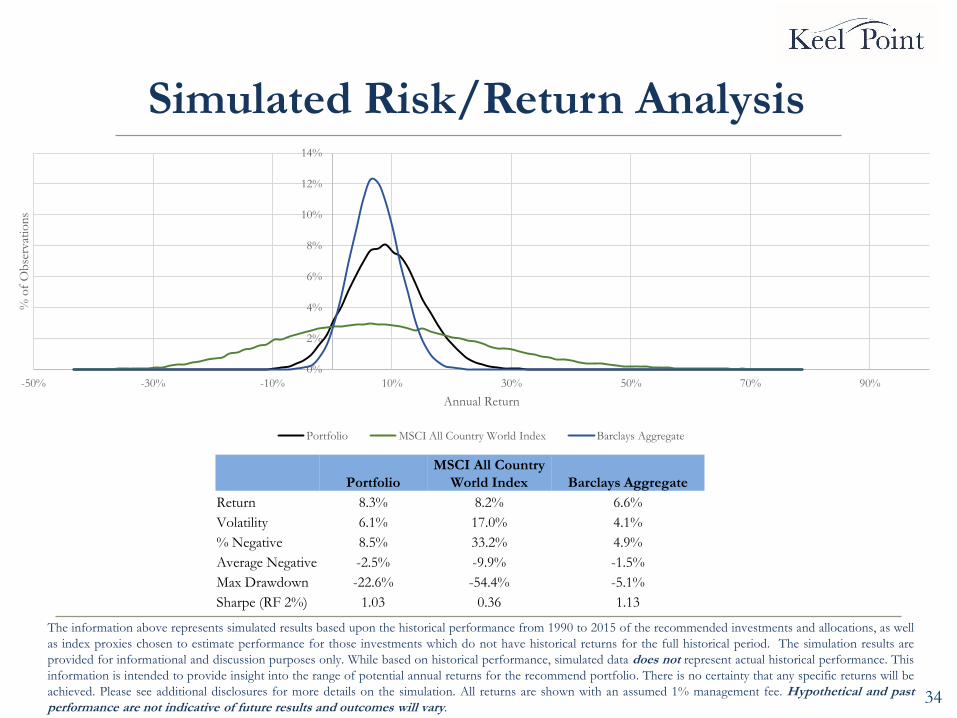
Simulated Risk/Return Analysis
Portfolio
MSCI All Country
World Index Barclays Aggregate
Return 8.3% 8.2% 6.6%
Volatility 6.1% 17.0% 4.1%
% Negative 8.5% 33.2% 4.9%
Average Negative -2.5% -9.9% -1.5%
Max Drawdown -22.6% -54.4% -5.1%
Sharpe (RF 2%) 1.03 0.36 1.13
The information above represents simulated results based upon the historical performance from 1990 to 2015 of the recommended investments and allocations, as well
as index proxies chosen to estimate performance for those investments which do not have historical returns for the full historical period. The simulation results are
provided for informational and discussion purposes only. While based on historical performance, simulated data does not represent actual historical performance. This
information is intended to provide insight into the range of potential annual returns for the recommend portfolio. There is no certainty that any specific returns will be
achieved. Please see additional disclosures for more details on the simulation. All returns are shown with an assumed 1% management fee. Hypothetical and past performance are not indicative of future results and outcomes will vary.
0%
2%
4%
6%
8%
10%
12%
14%
-50% -30% -10% 10% 30% 50% 70% 90%
% o
f O
bse
rvat
ion
s
Annual Return
Portfolio MSCI All Country World Index Barclays Aggregate
35
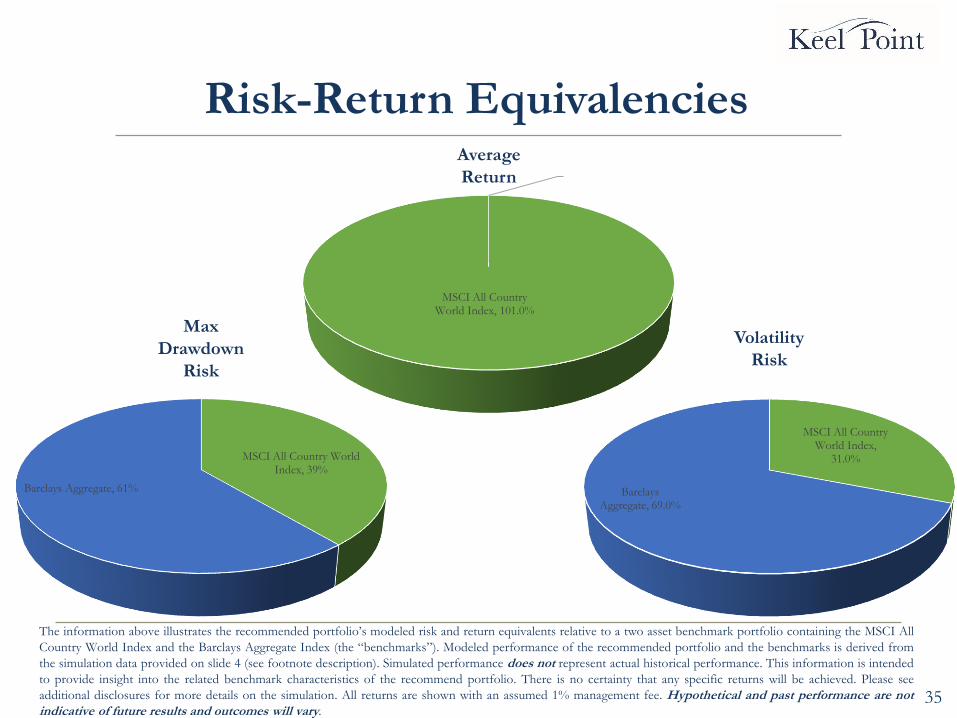
Risk-Return Equivalencies Average
Return
Max
Drawdown
Risk
The information above illustrates the recommended portfolio’s modeled risk and return equivalents relative to a two asset benchmark portfolio containing the MSCI All
Country World Index and the Barclays Aggregate Index (the “benchmarks”). Modeled performance of the recommended portfolio and the benchmarks is derived from
the simulation data provided on slide 4 (see footnote description). Simulated performance does not represent actual historical performance. This information is intended
to provide insight into the related benchmark characteristics of the recommend portfolio. There is no certainty that any specific returns will be achieved. Please see
additional disclosures for more details on the simulation. All returns are shown with an assumed 1% management fee. Hypothetical and past performance are not indicative of future results and outcomes will vary.
Volatility
Risk
MSCI All Country World Index, 101.0%
MSCI All Country World Index, 39%
Barclays Aggregate, 61%
MSCI All Country World Index,
31.0%
Barclays Aggregate, 69.0%
36
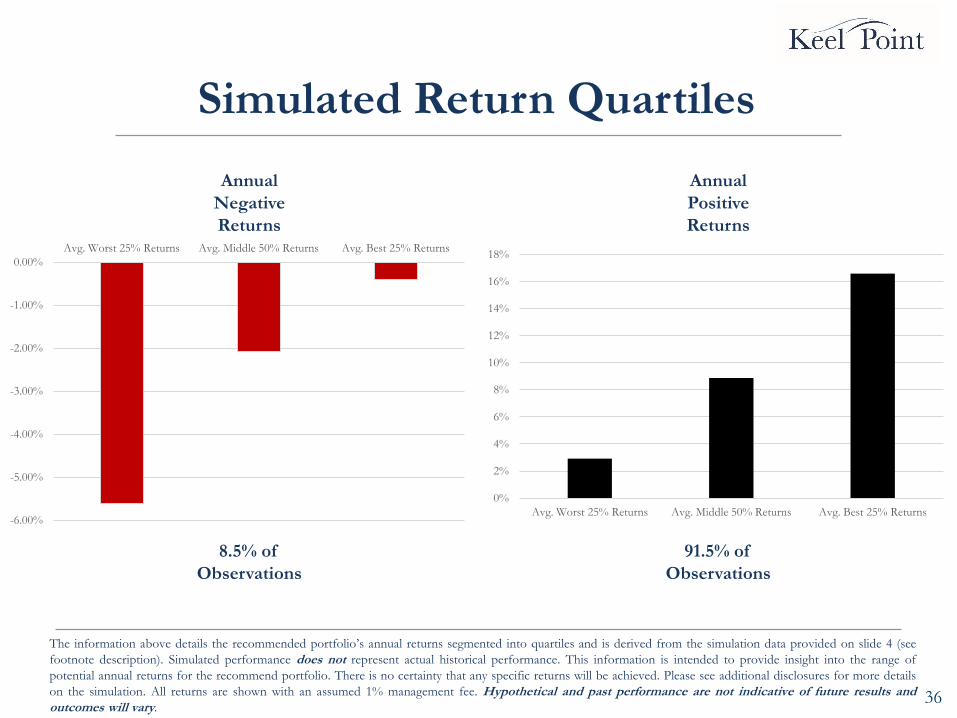
Simulated Return Quartiles
Annual
Negative
Returns
Annual
Positive
Returns
8.5% of
Observations
91.5% of
Observations
The information above details the recommended portfolio’s annual returns segmented into quartiles and is derived from the simulation data provided on slide 4 (see
footnote description). Simulated performance does not represent actual historical performance. This information is intended to provide insight into the range of
potential annual returns for the recommend portfolio. There is no certainty that any specific returns will be achieved. Please see additional disclosures for more details
on the simulation. All returns are shown with an assumed 1% management fee. Hypothetical and past performance are not indicative of future results and outcomes will vary.
-6.00%
-5.00%
-4.00%
-3.00%
-2.00%
-1.00%
0.00%
Avg. Worst 25% Returns Avg. Middle 50% Returns Avg. Best 25% Returns
0%
2%
4%
6%
8%
10%
12%
14%
16%
18%
Avg. Worst 25% Returns Avg. Middle 50% Returns Avg. Best 25% Returns
37
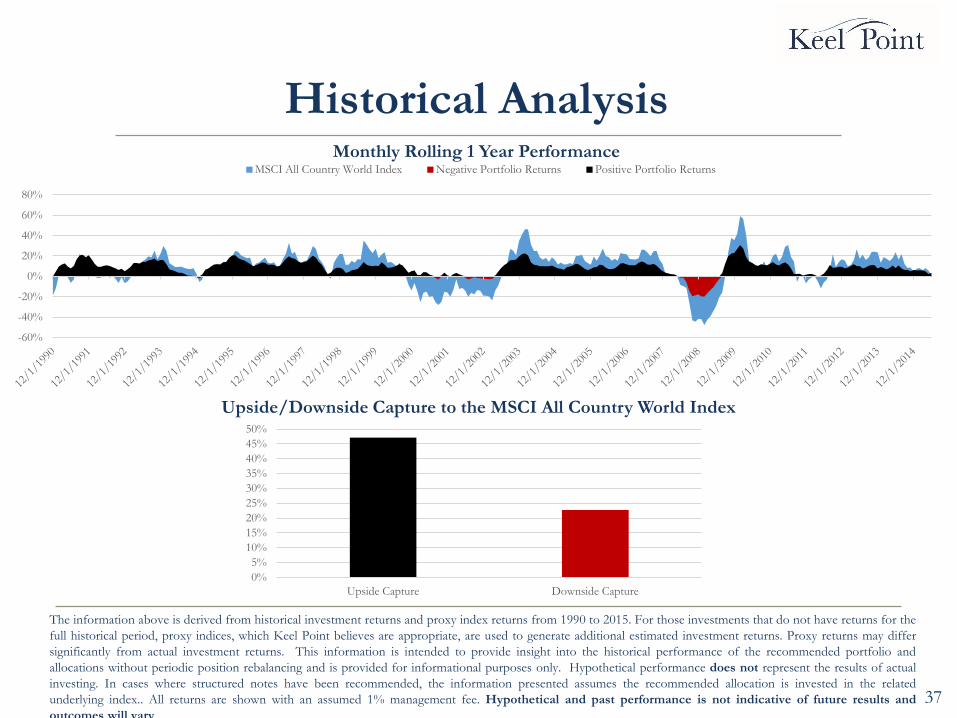
Historical Analysis Monthly Rolling 1 Year Performance
Upside/Downside Capture to the MSCI All Country World Index
The information above is derived from historical investment returns and proxy index returns from 1990 to 2015. For those investments that do not have returns for the
full historical period, proxy indices, which Keel Point believes are appropriate, are used to generate additional estimated investment returns. Proxy returns may differ
significantly from actual investment returns. This information is intended to provide insight into the historical performance of the recommended portfolio and
allocations without periodic position rebalancing and is provided for informational purposes only. Hypothetical performance does not represent the results of actual
investing. In cases where structured notes have been recommended, the information presented assumes the recommended allocation is invested in the related
underlying index.. All returns are shown with an assumed 1% management fee. Hypothetical and past performance is not indicative of future results and
outcomes will vary.
-60%
-40%
-20%
0%
20%
40%
60%
80%
MSCI All Country World Index Negative Portfolio Returns Positive Portfolio Returns
0%
5%
10%
15%
20%
25%
30%
35%
40%
45%
50%
Upside Capture Downside Capture
38
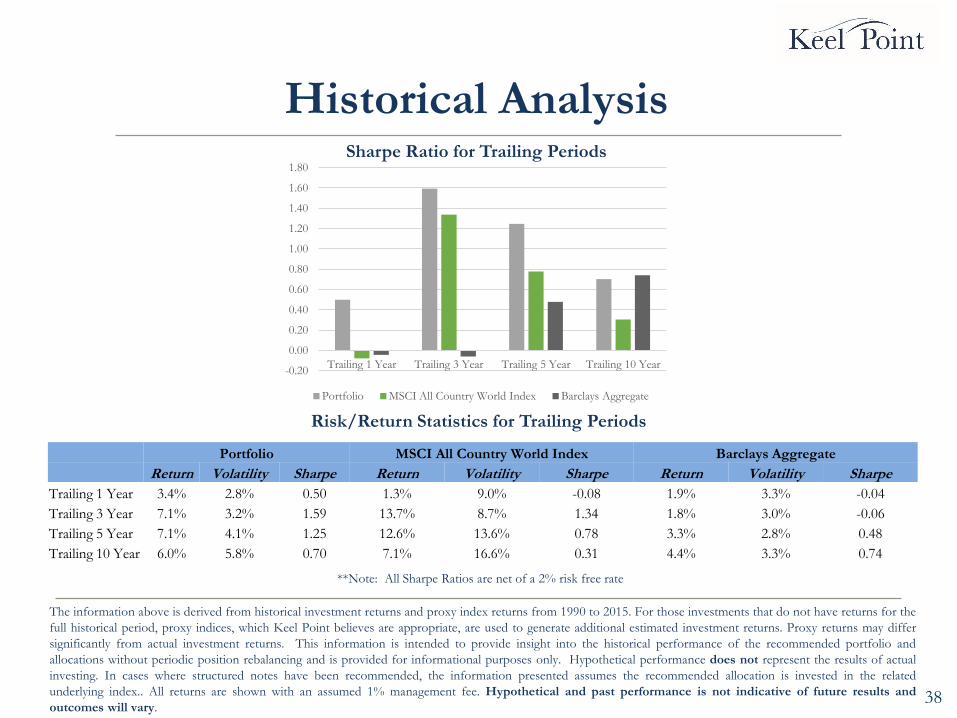
Historical Analysis Sharpe Ratio for Trailing Periods
Risk/Return Statistics for Trailing Periods
The information above is derived from historical investment returns and proxy index returns from 1990 to 2015. For those investments that do not have returns for the
full historical period, proxy indices, which Keel Point believes are appropriate, are used to generate additional estimated investment returns. Proxy returns may differ
significantly from actual investment returns. This information is intended to provide insight into the historical performance of the recommended portfolio and
allocations without periodic position rebalancing and is provided for informational purposes only. Hypothetical performance does not represent the results of actual
investing. In cases where structured notes have been recommended, the information presented assumes the recommended allocation is invested in the related
underlying index.. All returns are shown with an assumed 1% management fee. Hypothetical and past performance is not indicative of future results and
outcomes will vary.
Portfolio MSCI All Country World Index Barclays Aggregate
Return Volatility Sharpe Return Volatility Sharpe Return Volatility Sharpe
Trailing 1 Year 3.4% 2.8% 0.50 1.3% 9.0% -0.08 1.9% 3.3% -0.04
Trailing 3 Year 7.1% 3.2% 1.59 13.7% 8.7% 1.34 1.8% 3.0% -0.06
Trailing 5 Year 7.1% 4.1% 1.25 12.6% 13.6% 0.78 3.3% 2.8% 0.48
Trailing 10 Year 6.0% 5.8% 0.70 7.1% 16.6% 0.31 4.4% 3.3% 0.74
**Note: All Sharpe Ratios are net of a 2% risk free rate
-0.20
0.00
0.20
0.40
0.60
0.80
1.00
1.20
1.40
1.60
1.80
Trailing 1 Year Trailing 3 Year Trailing 5 Year Trailing 10 Year
Portfolio MSCI All Country World Index Barclays Aggregate
39
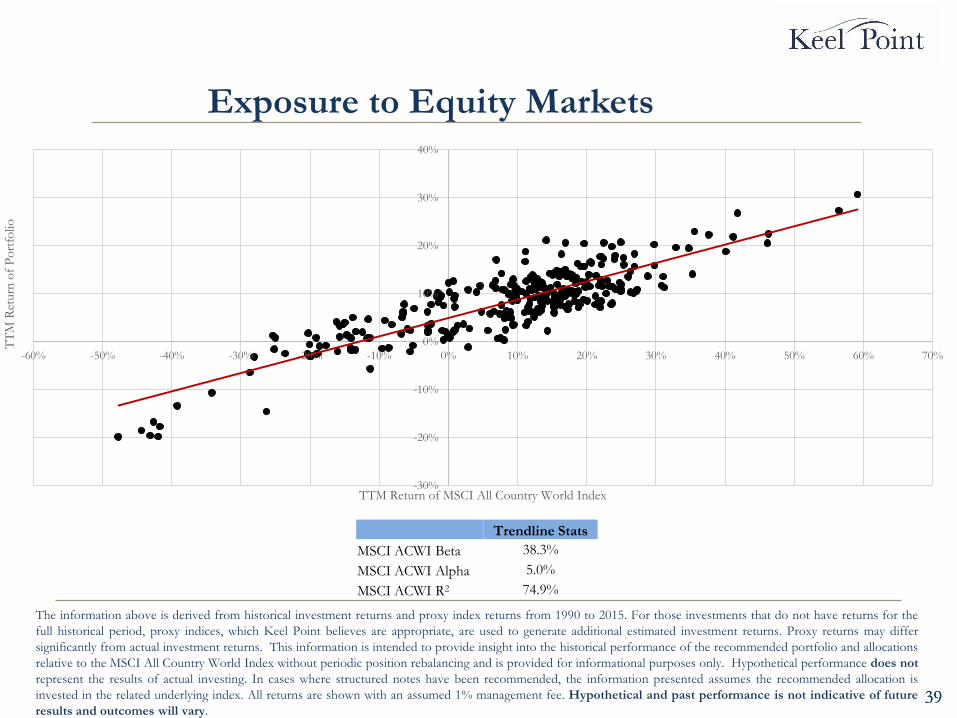
Exposure to Equity Markets
39
Trendline Stats
MSCI ACWI Beta 38.3%
MSCI ACWI Alpha 5.0%
MSCI ACWI R2 74.9%
The information above is derived from historical investment returns and proxy index returns from 1990 to 2015. For those investments that do not have returns for the
full historical period, proxy indices, which Keel Point believes are appropriate, are used to generate additional estimated investment returns. Proxy returns may differ
significantly from actual investment returns. This information is intended to provide insight into the historical performance of the recommended portfolio and allocations
relative to the MSCI All Country World Index without periodic position rebalancing and is provided for informational purposes only. Hypothetical performance does not
represent the results of actual investing. In cases where structured notes have been recommended, the information presented assumes the recommended allocation is
invested in the related underlying index. All returns are shown with an assumed 1% management fee. Hypothetical and past performance is not indicative of future
results and outcomes will vary.
-30%
-20%
-10%
0%
10%
20%
30%
40%
-60% -50% -40% -30% -20% -10% 0% 10% 20% 30% 40% 50% 60% 70%
TT
M R
eturn
of
Po
rtfo
lio
TTM Return of MSCI All Country World Index
40
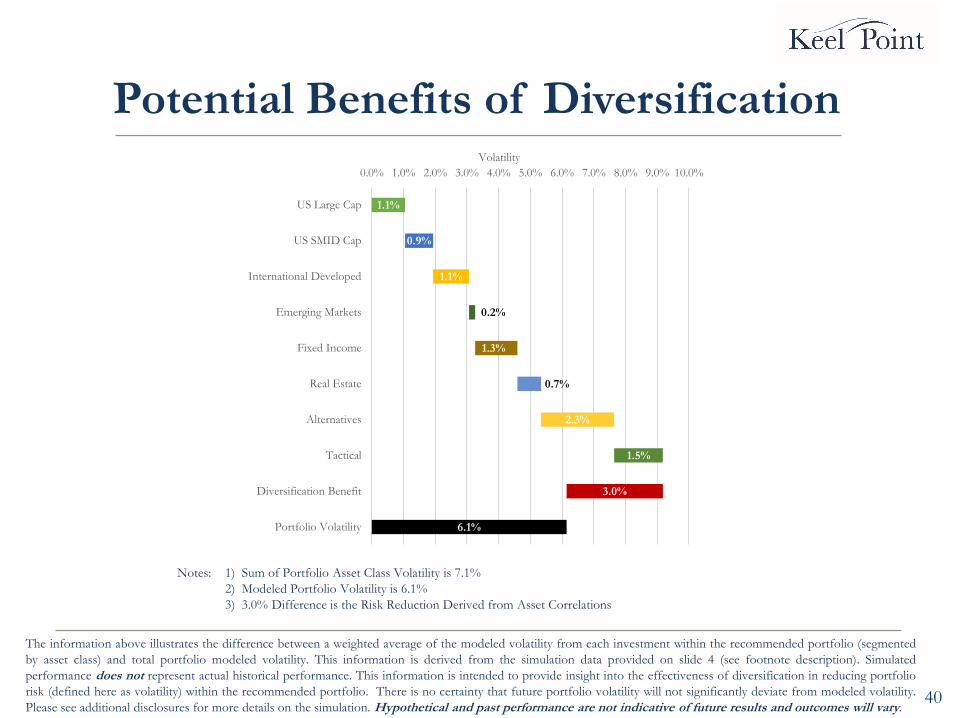
Potential Benefits of Diversification
The information above illustrates the difference between a weighted average of the modeled volatility from each investment within the recommended portfolio (segmented
by asset class) and total portfolio modeled volatility. This information is derived from the simulation data provided on slide 4 (see footnote description). Simulated
performance does not represent actual historical performance. This information is intended to provide insight into the effectiveness of diversification in reducing portfolio
risk (defined here as volatility) within the recommended portfolio. There is no certainty that future portfolio volatility will not significantly deviate from modeled volatility.
Please see additional disclosures for more details on the simulation. Hypothetical and past performance are not indicative of future results and outcomes will vary.
Notes: 1) Sum of Portfolio Asset Class Volatility is 7.1%
2) Modeled Portfolio Volatility is 6.1%
3) 3.0% Difference is the Risk Reduction Derived from Asset Correlations
1.1%
6.1%
0.9%
0.9%
3.1%
1.1%
3.0%
0.2%
1.3%
0.7%
2.3%
2.3%
2.3%
2.3%
2.3%
2.3%
1.5%
0.0% 1.0% 2.0% 3.0% 4.0% 5.0% 6.0% 7.0% 8.0% 9.0% 10.0%
US Large Cap
US SMID Cap
International Developed
Emerging Markets
Fixed Income
Real Estate
Alternatives
Tactical
Diversification Benefit
Portfolio Volatility
Volatility
41
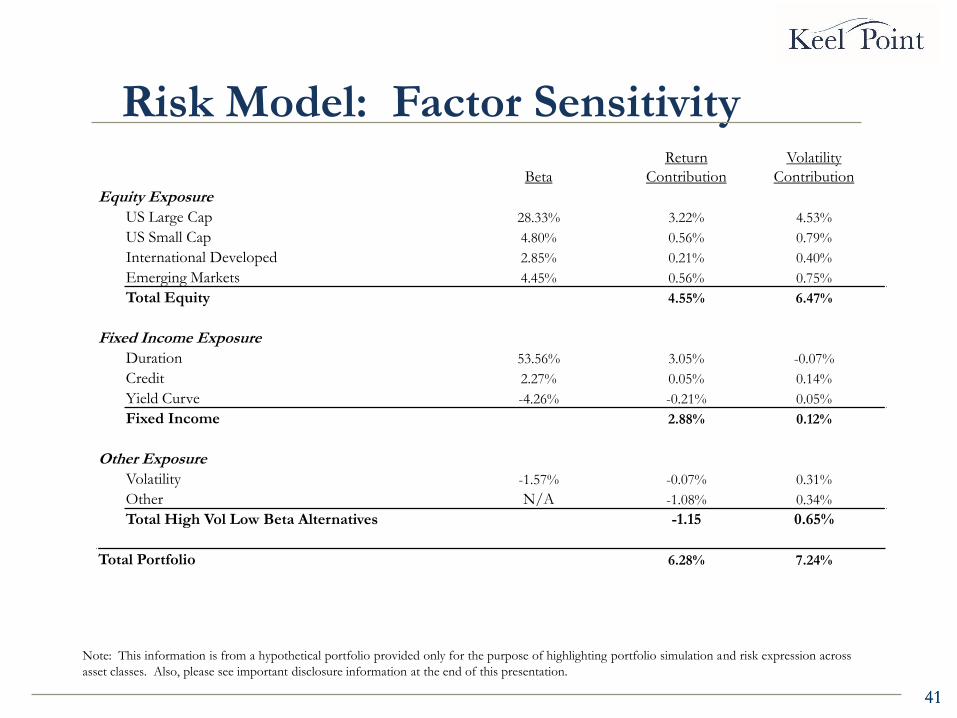
Risk Model: Factor Sensitivity
41
Beta
Return
Contribution
Volatility
Contribution
Equity Exposure
US Large Cap 28.33% 3.22% 4.53%
US Small Cap 4.80% 0.56% 0.79%
International Developed 2.85% 0.21% 0.40%
Emerging Markets 4.45% 0.56% 0.75%
Total Equity 4.55% 6.47%
Fixed Income Exposure
Duration 53.56% 3.05% -0.07%
Credit 2.27% 0.05% 0.14%
Yield Curve -4.26% -0.21% 0.05%
Fixed Income 2.88% 0.12%
Other Exposure
Volatility -1.57% -0.07% 0.31%
Other N/A -1.08% 0.34%
Total High Vol Low Beta Alternatives -1.15 0.65%
Total Portfolio 6.28% 7.24%
Note: This information is from a hypothetical portfolio provided only for the purpose of highlighting portfolio simulation and risk expression across
asset classes. Also, please see important disclosure information at the end of this presentation.
42
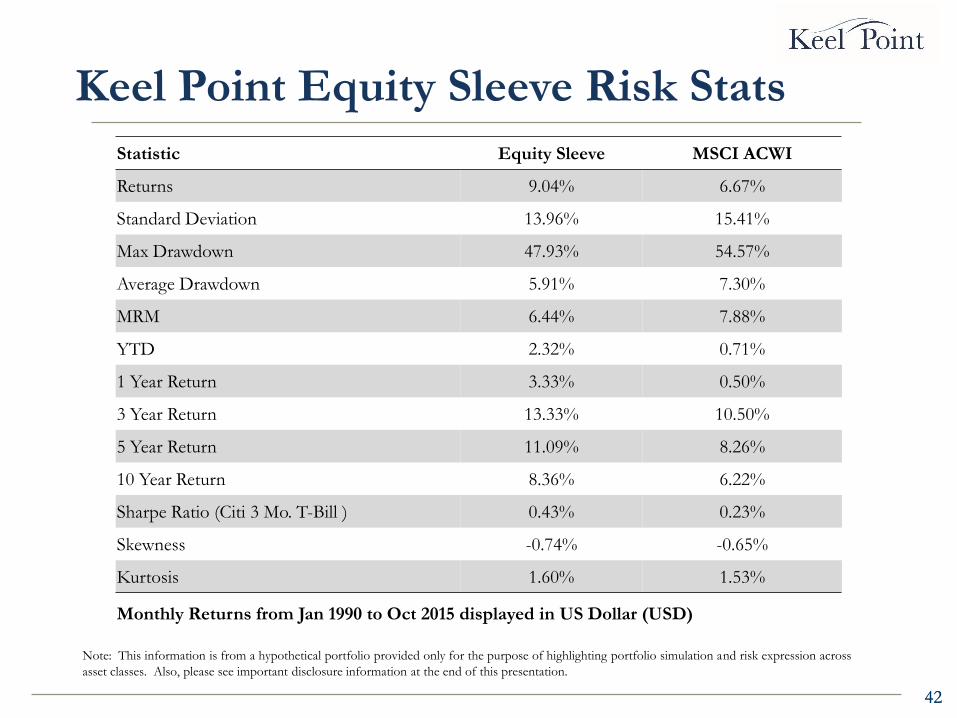
Keel Point Equity Sleeve Risk Stats
42
Statistic Equity Sleeve MSCI ACWI
Returns 9.04% 6.67%
Standard Deviation 13.96% 15.41%
Max Drawdown 47.93% 54.57%
Average Drawdown 5.91% 7.30%
MRM 6.44% 7.88%
YTD 2.32% 0.71%
1 Year Return 3.33% 0.50%
3 Year Return 13.33% 10.50%
5 Year Return 11.09% 8.26%
10 Year Return 8.36% 6.22%
Sharpe Ratio (Citi 3 Mo. T-Bill ) 0.43% 0.23%
Skewness -0.74% -0.65%
Kurtosis 1.60% 1.53%
Monthly Returns from Jan 1990 to Oct 2015 displayed in US Dollar (USD)
Note: This information is from a hypothetical portfolio provided only for the purpose of highlighting portfolio simulation and risk expression across
asset classes. Also, please see important disclosure information at the end of this presentation.
43
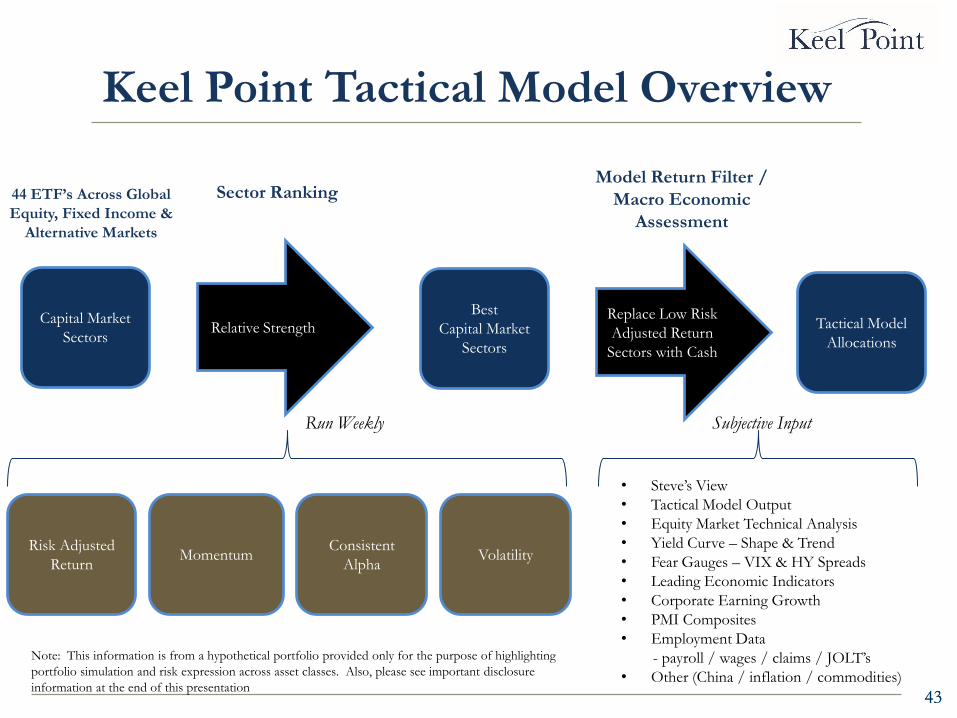
Keel Point Tactical Model Overview
43
Capital Market
Sectors Relative Strength
Risk Adjusted
Return Momentum
Consistent
Alpha
Best
Capital Market
Sectors
Replace Low Risk
Adjusted Return
Sectors with Cash
Tactical Model
Allocations
Volatility
Model Return Filter /
Macro Economic
Assessment
Sector Ranking 44 ETF’s Across Global
Equity, Fixed Income &
Alternative Markets
Run Weekly
• Steve’s View
• Tactical Model Output
• Equity Market Technical Analysis
• Yield Curve – Shape & Trend
• Fear Gauges – VIX & HY Spreads
• Leading Economic Indicators
• Corporate Earning Growth
• PMI Composites
• Employment Data
- payroll / wages / claims / JOLT’s
• Other (China / inflation / commodities)
Subjective Input
Note: This information is from a hypothetical portfolio provided only for the purpose of highlighting
portfolio simulation and risk expression across asset classes. Also, please see important disclosure
information at the end of this presentation
44
-10%
-5%
0%
5%
10%
15%
20%
25%
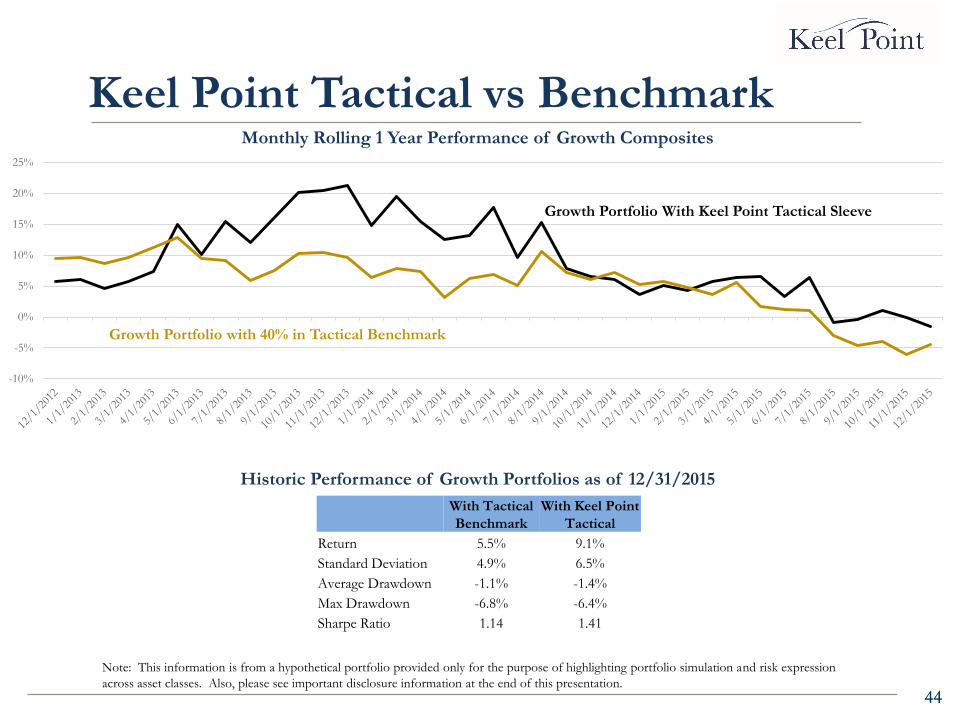
Keel Point Tactical vs Benchmark
44
With Tactical
Benchmark
With Keel Point
Tactical
Return 5.5% 9.1%
Standard Deviation 4.9% 6.5%
Average Drawdown -1.1% -1.4%
Max Drawdown -6.8% -6.4%
Sharpe Ratio 1.14 1.41
Historic Performance of Growth Portfolios as of 12/31/2015
Monthly Rolling 1 Year Performance of Growth Composites
Growth Portfolio With Keel Point Tactical Sleeve
Growth Portfolio with 40% in Tactical Benchmark
Note: This information is from a hypothetical portfolio provided only for the purpose of highlighting portfolio simulation and risk expression
across asset classes. Also, please see important disclosure information at the end of this presentation.
45
IMPORTANT INFORMATION
General
The disclosures provided in this presentation do not replace a comprehensive review of the disclosures that can be found in a fund’s Prospectus, Private Placement
Memorandum (“PPM”) or any other disclosures that may be made available to you for investments within the asset classes presented. Prior to making an investment, a client
is required to review all offering materials including the PPM and related risk disclosures and must complete necessary subscription documents. Actual funds utilized in
portfolios may vary from previously recommended funds or current funds presented.
Keel Point’s view and investment vehicles may change at any time and without notice. No conclusion should be drawn from any chart, graph or table that such illustration
can, in and of itself, predict future results. While reasonable efforts have been made to provide data from sources considered to be reliable, no guarantee of accuracy is given.
No representation is made that any investor will, or is likely to, achieve results comparable to those shown or will make any profit at all or will be able to avoid incurring
substantial losses. It is generally not possible to invest directly in an index, and indices presented do not reflect transaction expenses, management expenses and other costs
that would be charged by the investment vehicles for which the indices are being compared.
As an investment advisor, Keel Point does not provide tax, accounting, regulatory, or legal advice , however we partner with our client’s CPA’s and other professionals to
provide the most comprehensive advice to the client. The effectiveness of any of the strategies described in this presentation will depend on your individual situation and on
a number of complex factors. You should consult with your other advisors on the tax, accounting, and legal implications of any proposed strategies before the strategy is
implemented.
Conflicts of Interest
There are conflicts of interest relating to certain hedge funds that Keel Point may utilize in client portfolios. A client should read and understand each of the disclosures
made with regard to these conflicts before making a decision to invest. Likewise, a portion of a client’s portfolio may be allocated to structured notes under the Keel Point
Structured Note Buying Program. Since Keel Point receives an additional fee under this program, a conflict exists in that Keel Point may have a bias towards notes within its
program. The foregoing statements are not meant to be an exhaustive list of conflicts that may be present. For additional information regarding conflicts of interest please
refer to Keel Point’s FORM ADV and Brochure, the Keel Point Structure Note Buying Program Brochure and all other disclosures made available to you.
Forward Looking Statements
This document may contain forward-looking statements relating to anticipated future events, results, circumstances, performance or expectations that are not historical facts
but instead represent our beliefs regarding future events. By their nature, forward-looking statements require us to make assumptions and are subject to inherent risks and
uncertainties. There is significant risk that predictions and other forward-looking statements will not prove to be accurate. We caution readers of this document not to place
undue reliance on our forward-looking statements as a number of factors could cause actual future results, conditions, actions or events to differ materially from the targets,
expectations, estimates or intentions expressed or implied in the forward-looking statements. We caution that the foregoing list of factors is not exhaustive and that when
relying on forward-looking statements to make decisions with respect to investing you should carefully consider these factors, as well as other uncertainties and potential
events, and the inherent uncertainty of forward-looking statements. Due to the potential impact of these factors, Keel Point does not undertake, and specifically disclaims,
any intention or obligation to update or revise any forward-looking statements, whether as a result of new information, future events or otherwise, unless required by
applicable law.
Continued on the following page
46
IMPORTANT INFORMATION
FORM ADV / Brochure
Our FORM ADV and Brochure are available to you at no cost and should be reviewed prior to entering into an advisory relationship. The FORM ADV and Brochure
provide detailed information with regard to Keel Point, its management and conflicts of interest which may be present. Additional copies are available at the SEC Website
http://www.adviserinfo.sec.gov/IAPD/Content/IapdMain/iapd_SiteMap.aspx or by contacting our Chief Compliance Officer at (703) 226-2145.
No Solicitation
This document is not a solicitation to invest in any investment product or offer any investment strategy. It is intended for information purposes only and should be used
by sophisticated investors who are knowledgeable of the risks involved in making any investment.
Alternative Investments
Alternative investments involve specific risks that may be greater than those associated with traditional investments and may be offered only to clients who meet specific
suitability requirements, including minimum net worth tests. You should consider the special risks with alternative investments including limited liquidity, tax
considerations, incentive fee structures, potentially speculative investment strategies, and different regulatory and reporting requirements. You should only invest in hedge
funds, managed futures or other similar strategies if you do not require a liquid investment and can bear the risk of substantial losses. There can be no assurance that any
investment will meet its performance objectives or that substantial losses will be avoided.
Structured Notes
Structured Notes are complex investment vehicles and involve significant risks which are unique to their construction. Risk characteristics include: credit, liquidity and
market risk. Note holders are unsecured creditors of the issuer and any return upon maturity is subject to an issuer’s ability to pay its obligations as they become due. This
is not a complete list of the risks involved in structured notes and investors should read and understand the prospectus and offering documents for each note in which they
invest. Although structured notes may provide some limited downside protection, a complete loss of principal is possible.
Hedge Funds / Private Equity
Investing in hedge funds and private equity involves substantial risks, and potential investors should clearly understand the risks involved. Investing in hedge funds is
speculative, may not be suitable for all clients, and intended for experienced and sophisticated investors who are willing and able to bear the high economic risks of the
investment, which can include: loss of all, or a substantial portion, of the investment due to leveraging, short-selling or other speculative investment practices; lack of
liquidity in that there may be no secondary market for the fund and none expected to develop; volatility of returns; restrictions on transferring interests in the fund;
absence of information regarding valuations and pricing; delays in tax reporting; less regulation and higher fees than mutual funds; and advisor risk.
Continued on the following page
47
IMPORTANT INFORMATION
Hypothetical Performance
Hypothetical performance is provided for informational purposes only to illustrate what performance might have been had the strategy been utilized without restrictions
over the relevant period. Hypothetical performance does not represent the results of actual investing, but was achieved by means of retroactive application of a strategy
designed with the benefit of hindsight. Hypothetical performance calculations have many inherent limitations, do not represent actual performance in actual accounts, and
should not be interpreted as an indication of such performance. No representation is being made that any account will or is likely to achieve profits or losses similar to
those shown. In fact, there are frequently sharp differences between simulated performance results and actual results subsequently achieved by any particular investment
program. One of the limitations of hypothetical performance results is that they are generally prepared with the benefit of hindsight and, if the performance was actually
being calculated and published during these periods, it might have been based on different criteria and a different methodology. Moreover, the market conditions that
existed during prior periods will most likely not be repeated and this difference could adversely affect performance. There are numerous factors related to the markets in
general or the implementation of any investment strategy, which cannot be fully accounted for in the preparation of simulated results. All of these factors can adversely
affect actual performance results, including but not limited to market liquidity, general levels of interest rates and the effect on the relevant markets of political, economic
or other external events. In addition, results may not reflect the impact that material economic and market factors might have had on the adviser’s decision-making while
actually managing client assets. Further, hypothetical performance does not involve financial risk and no hypothetical record can completely account for the impact of
financial risk in actual time. For example the ability to withstand losses or to adhere to a particular strategy in spite of losses are material points, which can adversely affect
performance results. There are numerous other factors related to the markets in general or to the implementation of any specific investment strategy which cannot be fully
accounted for in the preparation of hypothetical performance results and all of which can adversely affect actual investment results.
THIS DOCUMENT IS INTENDED SOLELY FOR ILLUSTRATIVE PURPOSES FOR THE RECIPIENT TO WHOM KEEL POINT HAS
PROVIDED IT AND SHOULD NOT BE REDISTRIBUTED OR REPRINTED WITHOUT THE PERMISSION OF KEEL POINT. NOTHING
CONTAINED HEREIN SHOULD BE CONSIDERED TO BE AN OFFER TO BUY OR SELL ANY SECURITY OR ENGAGE IN ANY
PARTICULAR INVESTMENT STRATEGY. THIS MATERIAL IS INTENDED ONLY FOR SOPHISTICATED INVESTORS WHO UNDERSTAND
THE RISKS INVOLVED. HYPOTHETICAL AND PAST PERFORMANCE ARE NOT INDICATIVE OF FUTURE RESULTS AND OUTCOMES
CAN VARY SIGNIFICANTLY.
48
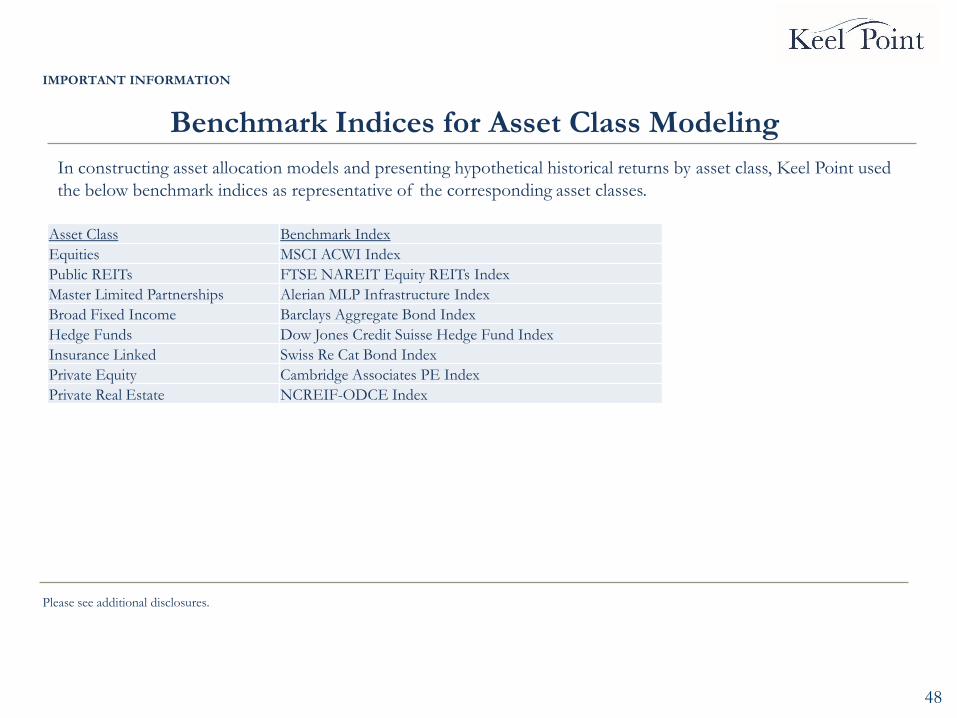
IMPORTANT INFORMATION
Asset Class Benchmark Index
Equities MSCI ACWI Index
Public REITs FTSE NAREIT Equity REITs Index
Master Limited Partnerships Alerian MLP Infrastructure Index
Broad Fixed Income Barclays Aggregate Bond Index
Hedge Funds Dow Jones Credit Suisse Hedge Fund Index
Insurance Linked Swiss Re Cat Bond Index
Private Equity Cambridge Associates PE Index
Private Real Estate NCREIF-ODCE Index
Benchmark Indices for Asset Class Modeling
Please see additional disclosures.
In constructing asset allocation models and presenting hypothetical historical returns by asset class, Keel Point used
the below benchmark indices as representative of the corresponding asset classes.
49
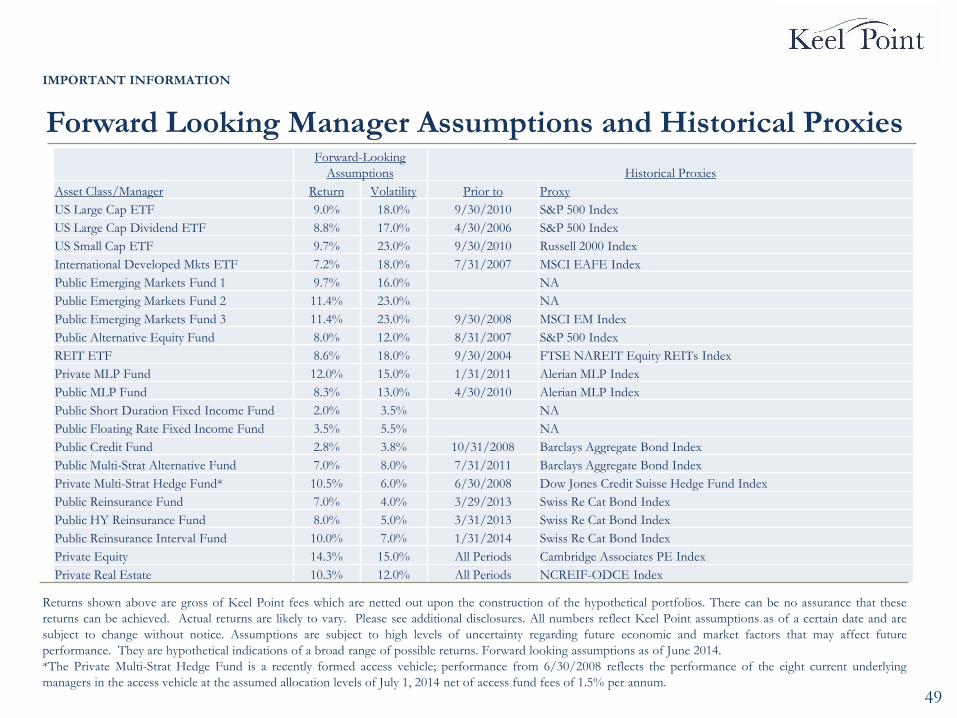
IMPORTANT INFORMATION
Forward-Looking
Assumptions Historical Proxies
Asset Class/Manager Return Volatility Prior to Proxy
US Large Cap ETF 9.0% 18.0% 9/30/2010 S&P 500 Index
US Large Cap Dividend ETF 8.8% 17.0% 4/30/2006 S&P 500 Index
US Small Cap ETF 9.7% 23.0% 9/30/2010 Russell 2000 Index
International Developed Mkts ETF 7.2% 18.0% 7/31/2007 MSCI EAFE Index
Public Emerging Markets Fund 1 9.7% 16.0% NA
Public Emerging Markets Fund 2 11.4% 23.0% NA
Public Emerging Markets Fund 3 11.4% 23.0% 9/30/2008 MSCI EM Index
Public Alternative Equity Fund 8.0% 12.0% 8/31/2007 S&P 500 Index
REIT ETF 8.6% 18.0% 9/30/2004 FTSE NAREIT Equity REITs Index
Private MLP Fund 12.0% 15.0% 1/31/2011 Alerian MLP Index
Public MLP Fund 8.3% 13.0% 4/30/2010 Alerian MLP Index
Public Short Duration Fixed Income Fund 2.0% 3.5% NA
Public Floating Rate Fixed Income Fund 3.5% 5.5% NA
Public Credit Fund 2.8% 3.8% 10/31/2008 Barclays Aggregate Bond Index
Public Multi-Strat Alternative Fund 7.0% 8.0% 7/31/2011 Barclays Aggregate Bond Index
Private Multi-Strat Hedge Fund* 10.5% 6.0% 6/30/2008 Dow Jones Credit Suisse Hedge Fund Index
Public Reinsurance Fund 7.0% 4.0% 3/29/2013 Swiss Re Cat Bond Index
Public HY Reinsurance Fund 8.0% 5.0% 3/31/2013 Swiss Re Cat Bond Index
Public Reinsurance Interval Fund 10.0% 7.0% 1/31/2014 Swiss Re Cat Bond Index
Private Equity 14.3% 15.0% All Periods Cambridge Associates PE Index
Private Real Estate 10.3% 12.0% All Periods NCREIF-ODCE Index
Forward Looking Manager Assumptions and Historical Proxies
Returns shown above are gross of Keel Point fees which are netted out upon the construction of the hypothetical portfolios. There can be no assurance that these
returns can be achieved. Actual returns are likely to vary. Please see additional disclosures. All numbers reflect Keel Point assumptions as of a certain date and are
subject to change without notice. Assumptions are subject to high levels of uncertainty regarding future economic and market factors that may affect future
performance. They are hypothetical indications of a broad range of possible returns. Forward looking assumptions as of June 2014.
*The Private Multi-Strat Hedge Fund is a recently formed access vehicle; performance from 6/30/2008 reflects the performance of the eight current underlying
managers in the access vehicle at the assumed allocation levels of July 1, 2014 net of access fund fees of 1.5% per annum.
50
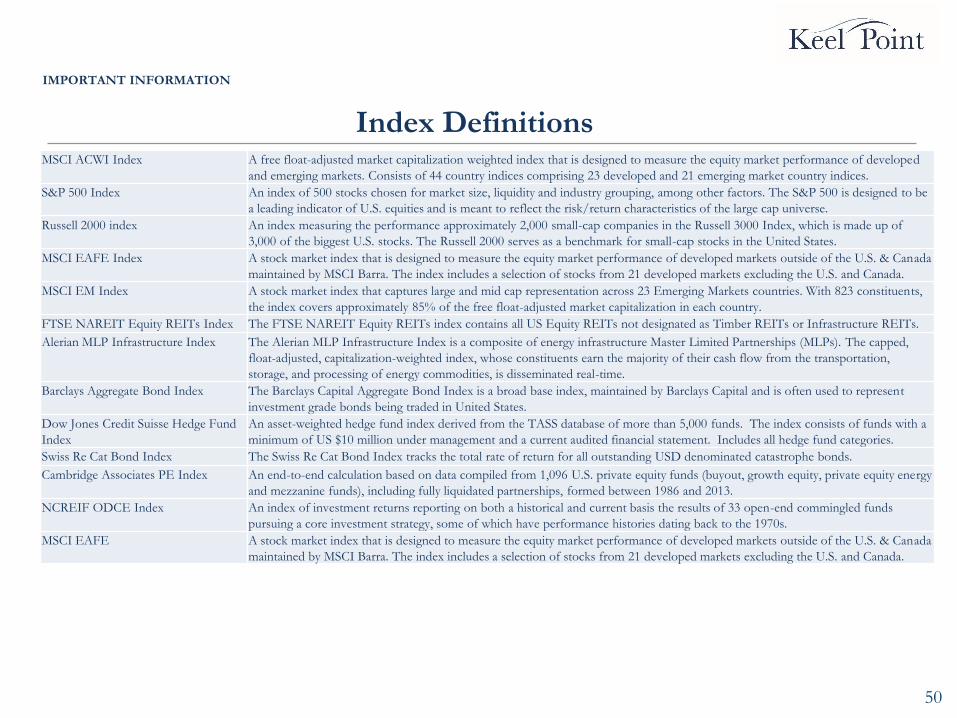
IMPORTANT INFORMATION
MSCI ACWI Index A free float-adjusted market capitalization weighted index that is designed to measure the equity market performance of developed
and emerging markets. Consists of 44 country indices comprising 23 developed and 21 emerging market country indices.
S&P 500 Index An index of 500 stocks chosen for market size, liquidity and industry grouping, among other factors. The S&P 500 is designed to be
a leading indicator of U.S. equities and is meant to reflect the risk/return characteristics of the large cap universe.
Russell 2000 index An index measuring the performance approximately 2,000 small-cap companies in the Russell 3000 Index, which is made up of
3,000 of the biggest U.S. stocks. The Russell 2000 serves as a benchmark for small-cap stocks in the United States.
MSCI EAFE Index A stock market index that is designed to measure the equity market performance of developed markets outside of the U.S. & Canada
maintained by MSCI Barra. The index includes a selection of stocks from 21 developed markets excluding the U.S. and Canada.
MSCI EM Index A stock market index that captures large and mid cap representation across 23 Emerging Markets countries. With 823 constituents,
the index covers approximately 85% of the free float-adjusted market capitalization in each country.
FTSE NAREIT Equity REITs Index The FTSE NAREIT Equity REITs index contains all US Equity REITs not designated as Timber REITs or Infrastructure REITs.
Alerian MLP Infrastructure Index The Alerian MLP Infrastructure Index is a composite of energy infrastructure Master Limited Partnerships (MLPs). The capped,
float-adjusted, capitalization-weighted index, whose constituents earn the majority of their cash flow from the transportation,
storage, and processing of energy commodities, is disseminated real-time.
Barclays Aggregate Bond Index The Barclays Capital Aggregate Bond Index is a broad base index, maintained by Barclays Capital and is often used to represent
investment grade bonds being traded in United States.
Dow Jones Credit Suisse Hedge Fund
Index
An asset-weighted hedge fund index derived from the TASS database of more than 5,000 funds. The index consists of funds with a
minimum of US $10 million under management and a current audited financial statement. Includes all hedge fund categories.
Swiss Re Cat Bond Index The Swiss Re Cat Bond Index tracks the total rate of return for all outstanding USD denominated catastrophe bonds.
Cambridge Associates PE Index An end-to-end calculation based on data compiled from 1,096 U.S. private equity funds (buyout, growth equity, private equity energy
and mezzanine funds), including fully liquidated partnerships, formed between 1986 and 2013.
NCREIF ODCE Index An index of investment returns reporting on both a historical and current basis the results of 33 open-end commingled funds
pursuing a core investment strategy, some of which have performance histories dating back to the 1970s.
MSCI EAFE A stock market index that is designed to measure the equity market performance of developed markets outside of the U.S. & Canada
maintained by MSCI Barra. The index includes a selection of stocks from 21 developed markets excluding the U.S. and Canada.
Index Definitions
51
Thank You
Keel Point
25 East Main Street, Suite 201
Chattanooga, TN 37408
423-756-4800
Keel Point
100 Church Street, Suite 500
Huntsville, AL 35801
256-704-5111
Keel Point
4000 West 114th Street, Suite 190
Leawood, KS 66211
913-663-1800
Keel Point
8065 Leesburg Pike, Suite 300
Vienna, VA 22182
703-807-2020
www.keelpoint.com