Embed Size (px)
Citation preview

Archer Daniels Midland Company 2008 Annual Report
nouRishMent
ConneCtion
eneRgy
pRogRess
vital
the world
tonouRishMent
ConneCtion
eneRgy
pRogRess
Archer D
aniels Midland C
ompany
20
08
Annual R
eportvitA
l to th
e wo
RlD

Copies of the Company’s annual report to the Securities and Exchange Commission on Form 10-K will be available to
Stockholders without charge upon written request to the Investor Relations Department.
Archer Daniels Midland Company is an equal opportunity employer.
Notice of ANNuAl MeetiNg
The Annual Meeting of Stockholders of the Company will be held at the
James R. Randall Research Center at 1001 Brush College Road in Decatur,
IL, on Thursday, November 6, 2008, commencing at 10:30 a.m. Proxies will
be requested by Management on or about September 25, 2008, at which
time a Proxy Statement and Form of Proxy will be sent to Stockholders.
executive certificAtioNs
The Company’s 2008 Annual Report on Form 10-K filed with the Securities
and Exchange Commission includes, as Exhibit 31, certifications of the
Company’s Chief Executive Officer and Chief Financial Officer as required by
Section 302 of the Sarbanes-Oxley Act of 2002. On November 26, 2007,
the Company submitted to the New York Stock Exchange (NYSE)
a certificate of the Chief Executive Officer certifying that she is not
aware of any violation by the Company of the NYSE corporate governance
listing standards.
stockholder INFORMATION
stock exchANges
Archer Daniels Midland Company
common stock is listed and traded
on the New York Stock Exchange
and the Frankfurt Stock Exchange.
Ticker Symbol: ADM.
trANsfer AgeNt ANd registrAr
Hickory Point Bank and Trust, fsb
1099 W. Wood St., Suite G
Decatur, IL 62522
888.740.5512
iNdepeNdeNt Auditors
Ernst & Young L.L.P., St. Louis, MO
sAfe hArbor stAteMeNt The annual report contains forward - looking information that is subject to certain risks and uncertainties, which could cause actual results to differ materially from those projected, expressed or implied by such forward - looking information. In some cases, you can identify forward - looking statements by our use of words such as “may, will, should, anticipates, believes, expects, plans, future, intends, could, estimate, predict, potential or contingent,” the negative of these terms, or other, similar expressions. The Company’s actual results could differ materially from those discussed or implied herein. Factors that could cause or contribute to such differences include, but are not limited to, those discussed in the Company’s Form 10 - K for the fiscal year ended June 30, 2008. Among these risks are legislative acts, changes in the prices of food, feed and other commodities, including gasoline, and macroeconomic conditions in various parts of the world. To the extent permitted under applicable law, the Company assumes no obligation to update any forward - looking statements as a result of new information or future events.
MAiliNg Address
Archer Daniels Midland Company
P.O. Box 1470
Decatur, IL 62525
U.S.A.
phoNe NuMber
Investor Relations
217.424.4647
iNterNet
www.admworld.com
priNted oN Mohawk Options
and Domtar Lynx Opaque
ADM BELIEvES Agriculture HAS ANswers TO SOME OF THE MOST PRESSING chAlleNges FACING OUR PLANET AND ITS PEOPLE.
As one of the world’s leading agricultural processors, ADM benefits from unrivaled global reach, strong relationships with farmers, and an extraordinary range of logistical, analytical and technological assets that enable us to serve thousands of customers efficiently and profitably.
IN SHORT, we’re vitAl to the world. And by continuing to evolve and diversify in response to changing global needs, ADM believes our vital role in the agricultural processing value chain will only grow over time.
That’s why our 27,600 employees are hard at work transforming corn, oilseeds, cocoa, wheat and other crops into food, feed, fuel and industrial products needed to sustain a rapidly growing and increasingly prosperous global population.
DE
SIG
N:
vS
A P
AR
TNE
RS
, C
HIC
AG
O
PR
INC
IPA
L P
HO
TOG
RA
PH
Y: J
EFF
CO
RW
IN,
HO
WA
RD
BJO
RN
SO
N
PR
INTI
NG
: TH
E H
EN
NEG
AN
CO
MPA
NY,
A C
ON
SO
LID
ATE
D G
RA
PH
ICS
CO
MPA
NY
shareholders’ equity(in $ billions)
cash dividends(in $ millions)
earnings per share(in dollars)
04 05 06 07 08 04 05 06 07 08 04 05 06 07 08
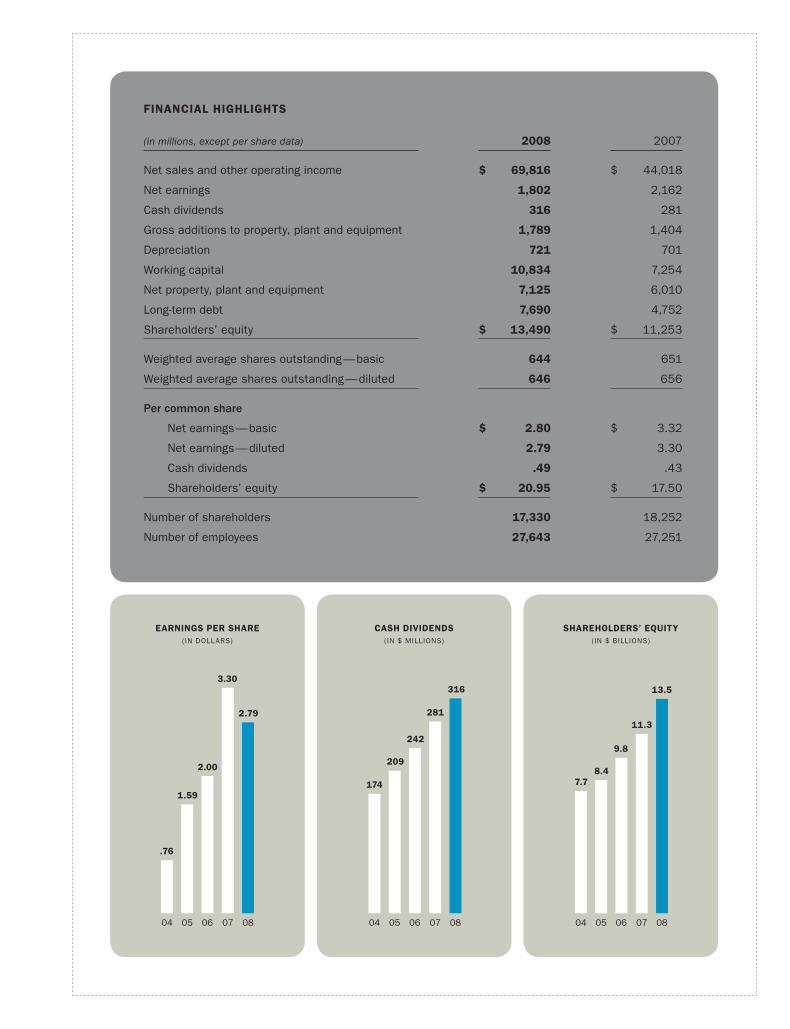
.76
1.59
2.00
3.30
2.79
174
209
242
281
316
7.78.4
9.8
11.3
13.5
04 05 06 07 08 04 05 06 07 08 04 05 06 07 08
.76
1.59
2.00
3.30
2.79
174
209
242
281
316
7.78.4
9.8
11.3
13.5
04 05 06 07 08 04 05 06 07 08 04 05 06 07 08
.76
1.59
2.00
3.30
2.79
174
209
242
281
316
7.78.4
9.8
11.3
13.5
Financial highlights
(in millions, except per share data) 2008 2007
net sales and other operating income $ 69,816 $ 44,018
net earnings 1,802 2,162
Cash dividends 316 281
Gross additions to property, plant and equipment 1,789 1,404
depreciation 721 701
Working capital 10,834 7,254
net property, plant and equipment 7,125 6,010
long-term debt 7,690 4,752
shareholders’ equity $ 13,490 $ 11,253
Weighted average shares outstanding — basic 644 651
Weighted average shares outstanding — diluted 646 656
Per common share
net earnings — basic $ 2.80 $ 3.32
net earnings — diluted 2.79 3.30
Cash dividends .49 .43
shareholders’ equity $ 20.95 $ 17.50
number of shareholders 17,330 18,252
number of employees 27,643 27,251

2 adm 2008 annual report
to the shareholders and employees oF adm,
adm’s strength has long been in the synergy of acumen
and assets. the deep experience and insight of our
people, combined with our global network of large-scale
assets — balanced across the agricultural processing
value chain — allow us to identify and then add value to
opportunities as they arise. in 2008, we deployed our
unique combination of acumen and assets against
an exceptional set of global opportunities and challenges
and again delivered excellent financial results. even as
strong demand for crops and commodities challenged
the global supply chain, we continued to capture value
for our shareholders as we met our customers’ needs for
food, feed, fuel and industrial products.
Chairman, Chief Executive Officer and President Patricia A. Woertz at ADM’s offices in São Paulo, Brazil.
vital to the World 3
are constrained, adm’s ability to produce renewable alter-
natives becomes essential.
to fulfill our vital role requires something of “bifocal” vision.
We must look ahead to the future — planning and investing
now to ensure we continue to have the scale and reach
to serve growing global needs. at the same time, we are
mindful that each quarter and each year external factors —
volatile commodity prices, planting decisions, weather
conditions — present new sets of challenges and opportu-
nities. that’s why we devoted effort this year to building
our internal capacity and our collaborative culture to sustain
the growth of our global enterprise well into the future. We
strongly believe that the positive steps we’ve taken stand
to enhance our profitability now and for years to come.
aligned For growth our actions to build success align with our historic
core strengths:
•AnunpArAlleledglobAlnetworkofcrop
procurement and transportation assets. adm’s
procurement network includes more than 300 facilities
on six continents, and we continue to add capacity in
strategically important geographic areas as customer
demand and new opportunities warrant. For example,
last year we acquired a large network of grain elevators
and rail shipping terminals in illinois. this additional
infrastructure enables adm to increase service to local
farmers while ensuring a steady flow of commodities
for adm’s own food, feed and fuel production, and
merchandising needs.
•processingscAleAndAproductportfolioofdepth
AndbreAdthservingdiversemArkets. our more
than 230 processing plants around the world generate
a remarkable array of products made from corn,
wheat, cocoa, oilseeds and other feedstocks, and the
breadth of our operations gives us flexibility to adjust
our manufacturing activities to respond to shifts in
a dynamic global marketplace. in 2008, we continued
expanding our oilseed processing capacity to meet
increasing demand for protein meal and for low-transfat
and transfat-free oils. We recently acquired a rapeseed
crushing facility in Germany, giving us new access to
markets in Central and eastern europe. We are continu-
ally investing in our corn wet mills to expand output and
lower operating costs. and we are increasing our cocoa
processing infrastructure with the addition of new plants
in Kumasi, Ghana, and hazelton, pa., both of which are
expected to commence operations in fiscal 2009.
For the year, net earnings reached $1.8 billion, or $2.79
per share, compared to 2007 results of $2.2 billion in
net earnings, or $3.30 per share. net earnings for 2007
included after-tax gains on asset sales of $665 million,
or $1.01 per share.
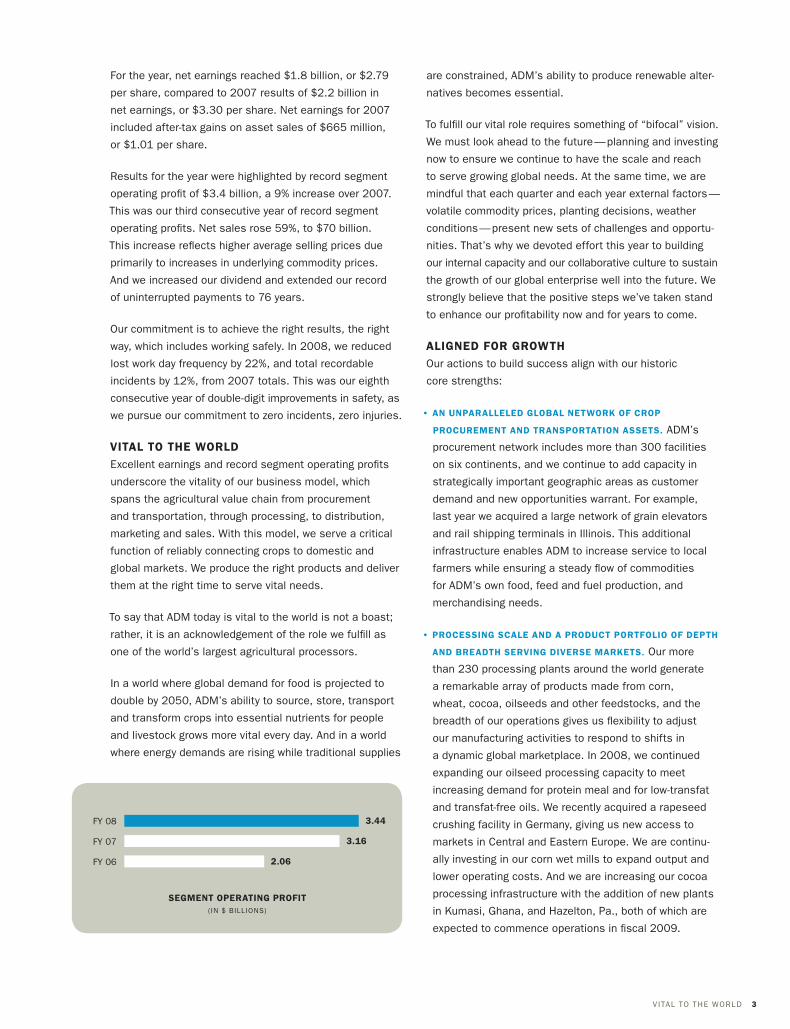
results for the year were highlighted by record segment
operating profit of $3.4 billion, a 9% increase over 2007.
this was our third consecutive year of record segment
operating profits. net sales rose 59%, to $70 billion.
this increase reflects higher average selling prices due
primarily to increases in underlying commodity prices.
and we increased our dividend and extended our record
of uninterrupted payments to 76 years.
our commitment is to achieve the right results, the right
way, which includes working safely. in 2008, we reduced
lost work day frequency by 22%, and total recordable
incidents by 12%, from 2007 totals. this was our eighth
consecutive year of double-digit improvements in safety, as
we pursue our commitment to zero incidents, zero injuries.
vital to the world excellent earnings and record segment operating profits
underscore the vitality of our business model, which
spans the agricultural value chain from procurement
and transportation, through processing, to distribution,
marketing and sales. With this model, we serve a critical
function of reliably connecting crops to domestic and
global markets. We produce the right products and deliver
them at the right time to serve vital needs.
to say that adm today is vital to the world is not a boast;
rather, it is an acknowledgement of the role we fulfill as
one of the world’s largest agricultural processors.
in a world where global demand for food is projected to
double by 2050, adm’s ability to source, store, transport
and transform crops into essential nutrients for people
and livestock grows more vital every day. and in a world
where energy demands are rising while traditional supplies
segment operating proFit(in $ billions)
FY 08
FY 07
FY 06
3.44
3.16
2.06
4 adm 2008 annual report
such as cellulosic fermentation, liquefaction, pyrolysis
and gasification is pointing the way to second- and third-
generation renewable fuels with the potential to foster
greater energy efficiency and environmental benefits.
•AnexperiencedmAnAgementteAmdedicAtedto
ApplyingAcumenAndAssetstobuildshAreholder
value. in 2008, we reorganized to streamline our opera-
tions, enhance accountability across the Company, and
provide leadership opportunities for more colleagues.
We also chartered several cross-functional, international
teams focused on areas such as sustainability and risk
management, and we created development plans for
more than 3,000 colleagues.
as we consider the challenges and opportunities that lie
ahead for our Company, i want to touch on an issue of
importance to the agribusiness sector as a whole. this
past year, there was considerable public discussion
about the ability of agriculture to provide for both food
and energy needs in a responsible, sustainable manner.
adm shares the view of many that farmers in the u.s. and
around the globe have the ability to increase productivity
to meet growing global demand. that ability will be en-
hanced in coming years by technological advances that
will boost crop yields, reduce waste, improve processing
methods, and reduce water and energy usage. We are
confident that, with these advances, agriculture can
effectively and sustainably meet global needs for food
and feed and play an increasing role in the production of
renewable fuels and chemicals.
• • •
“as variable as the weather” is just a figure of speech to
many. to us, it is a reality we address every day. We look
ahead knowing that, whatever may come, our assets
are well positioned and our people are ready to seek out
and capture value — with integrity, responsibility and an
abiding commitment to the interests of our shareholders,
customers, employees, communities and the world at
large. We are vital to the world. and we intend to fulfill our
role, with passion and vitality.
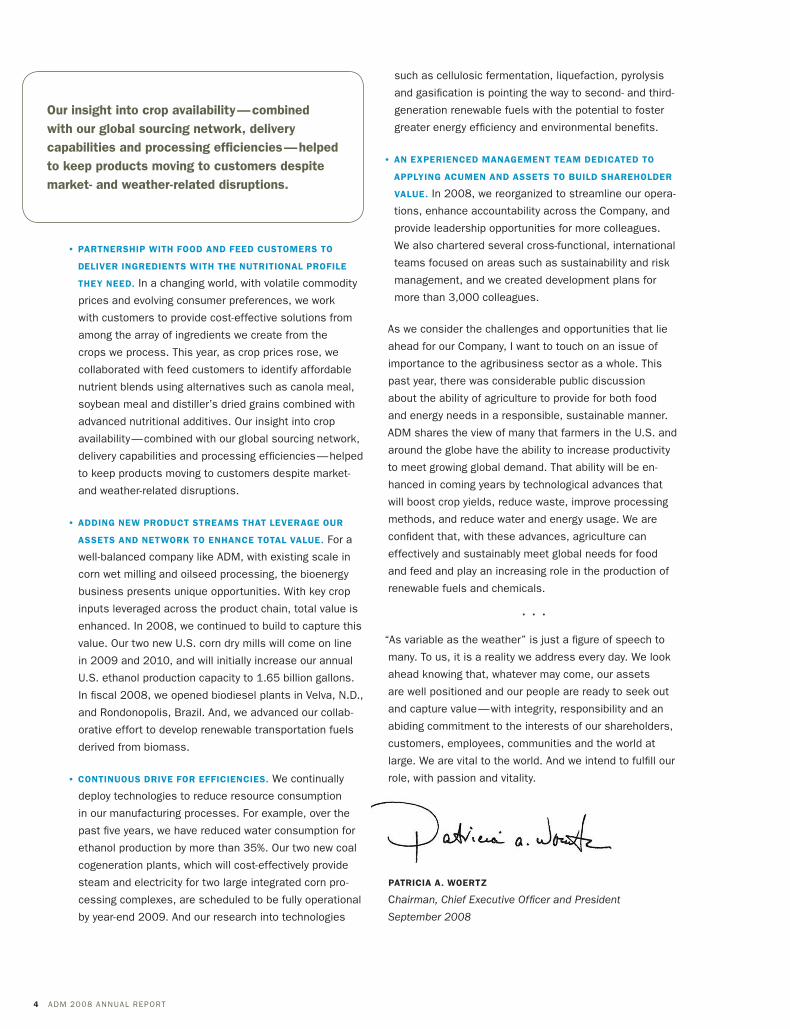
patricia a. woertz
Chairman, Chief Executive Officer and President
September 2008
•pArtnershipwithfoodAndfeedcustomersto
deliver ingredients with the nutritional proFile
they need. in a changing world, with volatile commodity
prices and evolving consumer preferences, we work
with customers to provide cost-effective solutions from
among the array of ingredients we create from the
crops we process. this year, as crop prices rose, we
collaborated with feed customers to identify affordable
nutrient blends using alternatives such as canola meal,
soybean meal and distiller’s dried grains combined with
advanced nutritional additives. our insight into crop
availability — combined with our global sourcing network,
delivery capabilities and processing efficiencies — helped
to keep products moving to customers despite market-
and weather-related disruptions.
•AddingnewproductstreAmsthAtleverAgeour
AssetsAndnetworktoenhAncetotAlvAlue. For a
well-balanced company like adm, with existing scale in
corn wet milling and oilseed processing, the bioenergy
business presents unique opportunities. With key crop
inputs leveraged across the product chain, total value is
enhanced. in 2008, we continued to build to capture this
value. our two new u.s. corn dry mills will come on line
in 2009 and 2010, and will initially increase our annual
u.s. ethanol production capacity to 1.65 billion gallons.
in fiscal 2008, we opened biodiesel plants in velva, n.d.,
and rondonopolis, brazil. and, we advanced our collab-
orative effort to develop renewable transportation fuels
derived from biomass.
•continuousdriveforefficiencies.We continually
deploy technologies to reduce resource consumption
in our manufacturing processes. For example, over the
past five years, we have reduced water consumption for
ethanol production by more than 35%. our two new coal
cogeneration plants, which will cost-effectively provide
steam and electricity for two large integrated corn pro-
cessing complexes, are scheduled to be fully operational
by year-end 2009. and our research into technologies
our insight into crop availability — combined with our global sourcing network, delivery capabilities and processing efficiencies — helped to keep products moving to customers despite market- and weather-related disruptions.

the vital linK:
all humankind.
adm’s business begins in the earth and culminates
in products that benefit

6 adm 2008 annual report
ADM produces hundreds of ingredients found in foods consumed all over the world.
as billions of people around the world improve the quality and diversity of their diets, adm is producing the food ingredients and animal feeds that make choices possible. our vast global network of processing facili-ties turns crops into flours, sweeteners, oils, proteins, chocolate and other products that nourish and satisfy millions of people each and every day, all around the world.
the World needs nourishment.
the ansWer is choice.

vital to the World 7
the World needs connection.
the ansWer is reach.
through the world’s most extensive crop sourc-ing and transportation network, adm serves as the vital connection between supply and demand in the global agricultural marketplace. adm’s rail, trucking and shipping assets span the globe, and our unparalleled elevator and port capabilities ensure products reach their destinations quickly and efficiently. our ability to connect products with markets increases the value of growers’ crops while enhancing the quality of consumers’ lives.
Flavio Bonfim Abrantes helps crops reach their global destinations from ADM’s port in Santos, Brazil.

8 adm 2008 annual report
the Worldneeds energy.
the ansWer is diversity.
as the world searches for more plentiful sources of clean, renewable energy, adm is producing today’s alternatives and engineering tomorrow’s solutions. our research teams are leveraging adm’s leadership in corn ethanol and biodiesel production to formulate advanced biofuels, such as biocrude. this non-fossil liquid, manufactured from cellulosic inputs such as corn stalks, can be made into gasoline in existing petroleum refineries. taken as a whole, our efforts are pointing the way to a more secure, environmentally sound energy future.
Chi-Cheng Ma is among the ADM researchers working to develop the next generation of
biofuels at the Company’s labs in Decatur, Ill.

vital to the World 9
the World needs progress.
the ansWer is growth.
developing nations with burgeoning economies and billions of citizens are driving massive increases in the already robust global demand for food, feed, fuel and industrial products made by adm. in response, we are investing strategically to strengthen and grow our global asset base in ways that will enable us to better serve our customers around the world.
ADM’s Erik Lightner oversees construction of the Company’s new cocoa processing plant in Hazleton, Pa.
10 adm 2008 annual report
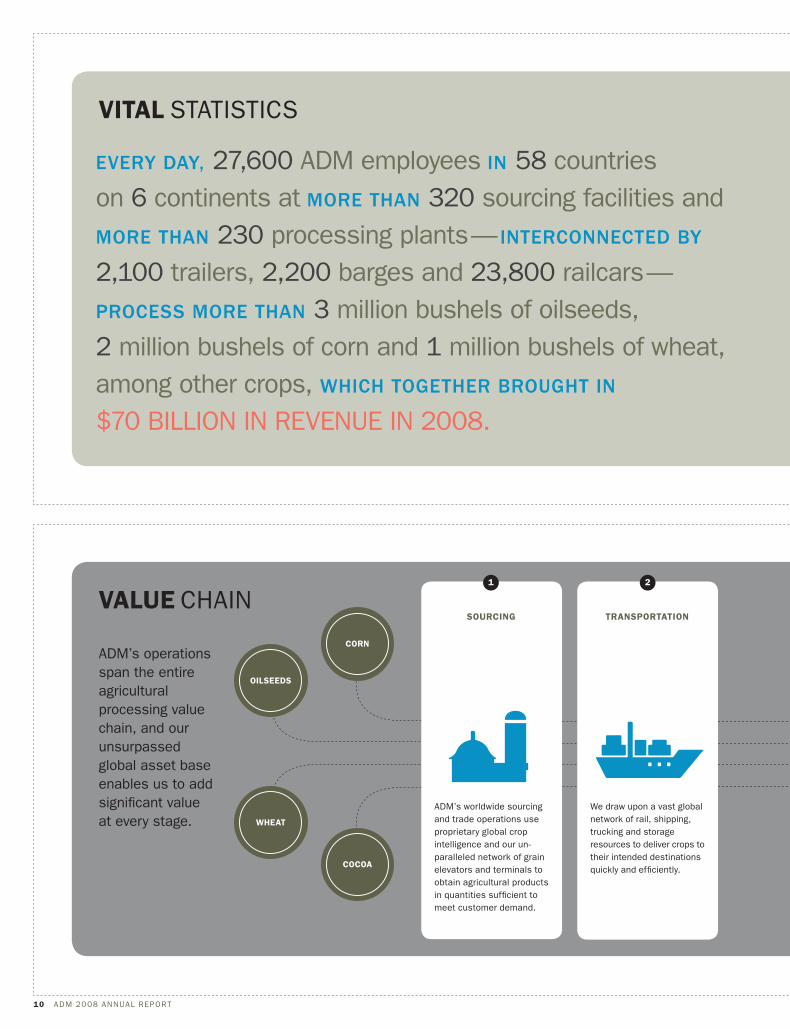
every day, 27,600 adm employees in 58 countries on 6 continents at more than 320 sourcing facilities and more than 230 processing plants — interconnected by
2,100 trailers, 2,200 barges and 23,800 railcars — Process more than 3 million bushels of oilseeds, 2 million bushels of corn and 1 million bushels of wheat, among other crops, which together brought in $70 billion in revenue in 2008.
sourcing
adm’s worldwide sourcing and trade operations use proprietary global crop intelligence and our un-paralleled network of grain elevators and terminals to obtain agricultural products in quantities sufficient to meet customer demand.
value Chain
vital statistiCs
adm’s operations span the entire agricultural processing value chain, and our unsurpassed global asset base enables us to add significant value at every stage.
transportation
We draw upon a vast global network of rail, shipping, trucking and storage resources to deliver crops to their intended destinations quickly and efficiently.
1 2
corn
oilseeds
wheat
cocoa
vital to the World 11
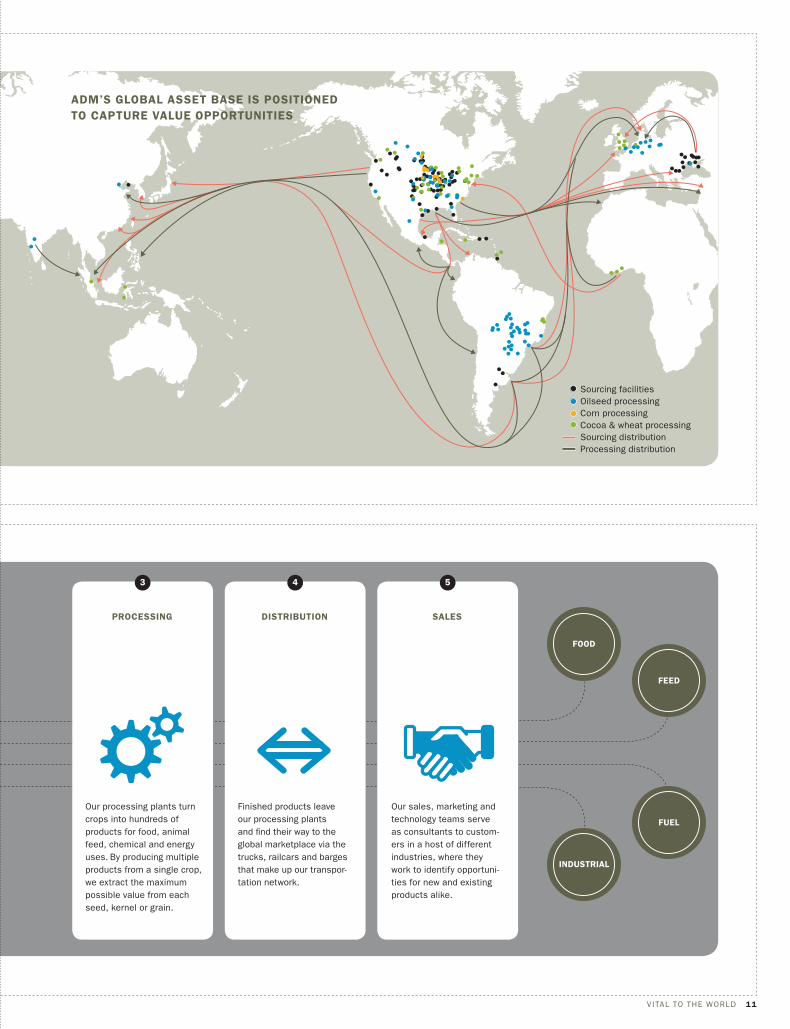
processing distribution sales
our processing plants turn crops into hundreds of products for food, animal feed, chemical and energy uses. by producing multiple products from a single crop, we extract the maximum possible value from each seed, kernel or grain.
Finished products leave our processing plants and find their way to the global marketplace via the trucks, railcars and barges that make up our transpor-tation network.
our sales, marketing and technology teams serve as consultants to custom-ers in a host of different industries, where they work to identify opportuni-ties for new and existing products alike.
3 4 5
Food
Feed
Fuel
industrial
sourcing facilitiesoilseed processingCorn processingCocoa & wheat processingsourcing distributionprocessing distribution
Adm’sglobAlAssetbAseispositioned to capture value opportunities

12 adm 2008 annual report
1 3 52 4 7 98 106
directors
Patricia a. Woertz Chairman, Chief Executive Officer and President
DaviD J. Smith Executive Vice President, Secretary and General Counsel
John D. rice Executive Vice President Commercial and Production
Steven r. millS Executive Vice President and Chief Financial Officer
leWiS W. BatchelDer Senior Vice President Toepfer/ADM Value Creation Team
michael D’amBroSe Senior Vice President Human Resources
eDWarD a. harJehauSen Senior Vice President Global Corn
mark a. BemiS Vice President Cocoa and Milling
mark J. cheviron Vice President Security and Corporate Services
Shannon herzfelD Vice President Government Relations
craig e. huSS Vice President Agricultural Services
Matthew J. Jansen Vice President Grain Group
Michael lusk Vice President Insurance and Risk Management
VikraM luthar Vice President and Treasurer
Victoria a. Podesta Vice President Corporate Communications
dennis riddle Vice President Corn Processing
isMael roig Vice President Planning and Business Development
scott a. roney Vice President Compliance and Ethics
John P. stott Vice President and Controller
Mark Zenuk Vice President Global Oilseeds
ronald s. Bandler Assistant Treasurer
scott a. roBerts Assistant Secretary and Assistant General Counsel
oFFicers
1. Patricia a. Woertz Chairman, Chief Executive Officer and President
2. alan l. Boeckmann Chairman and Chief Executive Officer, Fluor Corporation
3. GeorGe W. Buckley Chairman, President and Chief Executive Officer, 3M
4. mollie Hale carter Chairman, Chief Executive Officer and President, Sunflower Bank, and Vice President, Star A, Inc.
5. Victoria F. Haynes President and Chief Executive Officer, RTI International
6. antonio maciel neto Chief Executive Officer, Suzano Papel e Celulose
7. Patrick J. moore Chairman, President and Chief Executive Officer, Smurfit-Stone Container Corporation
8. m. Brian mulroney Senior Partner, Ogilvy Renault
9. tHomas F. o’neill Principal, Sandler O’Neill & Partners, L.P.
10. kelVin r. WestBrook President and Chief Executive Officer, KRW Advisors, L.L.C.

UNITED STATESSECURITIES AND EXCHANGE COMMISSION
WASHINGTON, D. C. 20549FORM 10-K
ANNUAL REPORT PURSUANT TO SECTION 13 OR 15(d) OF THE SECURITIES EXCHANGEACT OF 1934
For the fiscal year ended June 30, 2008
OR
TRANSITION REPORT PURSUANT TO SECTION 13 OR 15(d) OF THE SECURITIESEXCHANGE ACT OF 1934
For the transition period from________ to _________
Commission file number 1-44
Delaware 41-0129150(State or other jurisdiction of (I. R. S. Employerincorporation or organization) Identification No.)
4666 Faries Parkway Box 1470 Decatur, Illinois 62525(Address of principal executive offices) (Zip Code)
217-424-5200(Registrant's telephone number, including area code)
Securities registered pursuant to Section 12(b) of the Act:
Title of each class Name of each exchange on which registered
Common Stock, no par value New York Stock ExchangeFrankfurt Stock Exchange
Securities registered pursuant to Section 12(g) of the Act: None
Indicate by check mark if the registrant is a well-known seasoned issuer, as defined in Rule 405 of the SecuritiesAct. Yes � No �
�
�
ARCHER-DANIELS-MIDLAND COMPANY
(Exact name of registrant as specified in its charter)

Indicate by check mark if the registrant is not required to file reports pursuant to Section 13 or 15(d) of the Act.Yes � No �
Indicate by check mark whether the registrant (1) has filed all reports required to be filed by Section 13 or 15(d) ofthe Securities Exchange Act of 1934 during the preceding 12 months (or for such shorter period that the registrantwas required to file such reports), and (2) has been subject to such filing requirements for the past 90 days.Yes � No �
Indicate by check mark if disclosure of delinquent filers pursuant to Item 405 of Regulation S-K is not containedherein, and will not be contained, to the best of registrant’s knowledge, in definitive proxy or informationstatements incorporated by reference in Part III of this Form 10-K or any amendment to this Form 10-K. �
Indicate by check mark whether the registrant is a large accelerated filer, an accelerated filer, a non-acceleratedfiler, or a smaller reporting company. See definition of “large accelerated filer”, “accelerated filer” and “smallerreporting company” in Rule 12b-2 of the Exchange Act.
Large Accelerated Filer � Accelerated Filer �Non-accelerated Filer � Smaller Reporting Company �
Indicate by check mark whether the registrant is a shell company (as defined in Rule 12b-2 of the Exchange Act).Yes � No �
State the aggregate market value of the voting and non-voting common equity held by non-affiliates computed byreference to the price at which the common equity was last sold, or the average bid and asked price of suchcommon equity, as of the last business day of the registrant’s most recently completed second fiscal quarter.
Common Stock, no par value--$29.2 billion(Based on the closing sale price of Common Stock as reported on the New York Stock Exchange
as of December 31, 2007)
Indicate the number of shares outstanding of each of the registrant’s classes of common stock, as of the latestpracticable date.
Common Stock, no par value—644,267,509 shares(July 31, 2008)
DOCUMENTS INCORPORATED BY REFERENCE
Portions of the proxy statement for the annual meeting of stockholders to be held November 6, 2008, areincorporated by reference into Part III.
SAFE HARBOR STATEMENT
This Form 10-K contains forward-looking information that is subject to certain risks and uncertainties that couldcause actual results to differ materially from those projected, expressed, or implied by such forward-lookinginformation. In some cases, you can identify forward-looking statements by our use of words such as “may, will,should, anticipates, believes, expects, plans, future, intends, could, estimate, predict, potential or contingent,” thenegative of these terms or other similar expressions. The Company’s actual results could differ materially fromthose discussed or implied herein. Factors that could cause or contribute to such differences include, but are notlimited to, those discussed in this Form 10-K for the fiscal year ended June 30, 2008. Among these risks arelegislative acts; changes in the prices of food, feed, and other commodities, including gasoline; andmacroeconomic conditions in various parts of the world. To the extent permitted under applicable law, theCompany assumes no obligation to update any forward-looking statements as a result of new information or futureevents.
2

3
Table of Contents
Item No. Description Page No.
Part I1. Business 41A. Risk Factors 101B. Unresolved Staff Comments 122. Properties 133. Legal Proceedings 154. Submission of Matters to a Vote of Security Holders 15
Part II5. Market for Registrant’s Common Equity, Related Stockholder Matters,
and Issuer Purchases of Equity Securities 166. Selected Financial Data 197. Management’s Discussion and Analysis of Financial Condition and
Results of Operations 207A. Quantitative and Qualitative Disclosures About Market Risk 348. Financial Statements and Supplementary Data 369. Changes in and Disagreements With Accountants on Accounting
and Financial Disclosure 759A. Controls and Procedures 759B. Other Information 75
Part III10. Directors, Executive Officers and Corporate Governance 7611. Executive Compensation 7812. Security Ownership of Certain Beneficial Owners and Management
and Related Stockholder Matters 7913. Certain Relationships and Related Transactions, and Director Independence 7914. Principal Accounting Fees and Services 79
Part IV15. Exhibits and Financial Statement Schedules 79
Signatures 84

4
PART I
Item 1. BUSINESS
Company Overview
Archer Daniels Midland Company (the Company) was incorporated in Delaware in 1923, successor to theDaniels Linseed Co. founded in 1902. The Company is one of the world’s largest processors of oilseeds, corn,wheat, cocoa, and other feedstuffs and is a leading manufacturer of soybean oil and protein meal, cornsweeteners, flour, biodiesel, ethanol, and other value-added food and feed ingredients. The Company also has anextensive grain elevator and transportation network to procure, store, clean, and transport agriculturalcommodities, such as oilseeds, corn, wheat, milo, oats, and barley.
During the past five years, the Company has experienced significant growth, spending approximately $5.3 billionfor construction of new plants, maintenance and expansions of existing plants, and the acquisitions of plants andtransportation equipment. The Company is constructing two dry corn milling plants which will increase theCompany’s annual ethanol production capacity by 550 million gallons to 1.7 billion gallons. In addition, theCompany is currently constructing a polyhydroxy alkanoate (PHA) natural plastics production facility, apropylene/ethylene glycol production facility, two cocoa processing facilities, and two coal cogeneration facilities.Construction of these plants is expected to be completed during the next two fiscal years. The Company expects tospend approximately $2.5 billion to complete construction of these facilities and other approved capital projectsover the next five years. There have been no significant dispositions during the last five years.
Segment Descriptions
The Company’s operations are classified into three reportable business segments: Oilseeds Processing, CornProcessing, and Agricultural Services. Each of these segments is organized based upon the nature of products andservices offered. The Company’s remaining operations are aggregated and classified as Other. Financialinformation with respect to the Company’s reportable business segments is set forth in “Note 14 of Notes toConsolidated Financial Statements” included in Item 8 herein, “Financial Statements and Supplementary Data.”
Oilseeds Processing
The Company is engaged in processing oilseeds such as soybeans, cottonseed, sunflower seeds, canola, peanuts,and flaxseed into vegetable oils and protein meals in North America, Europe, South America and Asia principallyfor the food and feed industries. Crude vegetable oil is sold “as is” or is further processed by refining, bleaching,and deodorizing into salad oils. Salad oils can be further processed by hydrogenating and/or interesterifying intomargarine, shortening, and other food products. Partially refined oil is sold for use in chemicals, paints and otherindustrial products. Refined oil can be further processed for use in the production of biodiesel. Oilseed meals areprimary ingredients used in the manufacture of commercial livestock and poultry feeds. Cottonseed flour isproduced and sold primarily to the pharmaceutical industry. Cotton cellulose pulp is manufactured and sold to thechemical, paper, and filter markets. Lecithin, an emulsifier produced in the vegetable oil refining process, ismarketed as a food and animal feed ingredient.
The Company produces a wide range of edible soy protein products including soy flour, soy grits, soy proteinconcentrates and soy isolates that are used in processed meats, baked foods, nutritional products, snacks, and dairyand meat analogs.
The Company produces natural source vitamin E, tocopherol antioxidants and phytosterols from co-products ofoilseeds which are marketed to the dietary supplement and food industry. The Company produces soy isoflavones,a dietary supplement, from a co-product of edible soy processing.
In South America, the Company is also a supplier of fertilizer products.

5
Item 1. BUSINESS (Continued)
Golden Peanut Company LLC, a joint venture between the Company and Alimenta (U.S.A.), Inc., is a majorsupplier of peanuts to both the domestic and export markets. The Company has a 50% ownership interest in thisjoint venture.
The Company has a 16.1% ownership interest in Wilmar International Limited, a Singapore publicly-listedcompany. Wilmar International Limited is the largest agricultural processing business in Asia and operates palmplantations; soybean, rapeseed, cottonseed, sunflower seed, peanut, palm kernel, and sesame seed crushing facilitiesand related vegetable oil refineries and packaging facilities; an oleochemical plant that produces fatty acids,glycerin, and soap noodles; a soy protein plant; wheat flour mills; rice mills; feed mills; fertilizer operations; andrelated silos and storage facilities.
Corn Processing
The Company is engaged in wet milling and dry milling corn operations primarily in the United States. Productsproduced for use in the food and beverage industry include syrup, starch, glucose, dextrose, and sweeteners.Dextrose is also produced for use by the Company as a feedstock for its bioproducts operations. Corn gluten feedand meal as well as distillers grains are produced for use as animal feed ingredients. Corn germ, a by-product ofthe wet milling process, is further processed as an oilseed into vegetable oil and protein meal.
By fermentation of dextrose, the Company produces alcohol, amino acids, and other specialty food and animal feedingredients. Ethyl alcohol is produced to beverage grade or for industrial use as ethanol. In gasoline, ethanolincreases octane and is used as an extender and oxygenate. Amino acids, such as lysine and threonine, are vitalcompounds used in swine feeds to produce leaner animals and in poultry feeds to enhance the speed and efficiencyof poultry production. The Company also produces, by fermentation, astaxanthin, a product used in aquaculture toenhance flesh coloration. The Company produces citric and lactic acids, lactates, sorbitol and xanthan gum whichare used in various food and industrial products.
Almidones Mexicanos S.A., in which the Company has a 50% interest, operates a wet corn milling plant inMexico.
Eaststarch C.V. (Netherlands), in which the Company has a 50% interest, owns interests in companies that operatewet corn milling plants in Bulgaria, Hungary, Romania, Slovakia, and Turkey.
The Company has a 50% interest in Telles, LLC (Telles), a joint venture formed between the Company andMetabolix to market and sell PHA, which will be produced in a facility being constructed by the Company whichis expected to be completed during fiscal 2009.
Red Star Yeast Company, LLC produces and sells fresh and dry yeast in the United States and Canada. TheCompany has a 40% ownership interest in this joint venture.
Agricultural Services
The Agricultural Services segment utilizes the Company’s extensive grain elevator and transportation network inthe United States to buy, store, clean, and transport agricultural commodities, such as oilseeds, corn, wheat, milo,oats, and barley, and resells these commodities primarily as animal feed ingredients and as raw materials for theagricultural processing industry. Agricultural Services’ grain sourcing and transportation network provides reliableand efficient services to the Company’s agricultural processing operations. Agricultural Services’ transportationnetwork capabilities include ground, river, rail, and ocean services which provide the flexibility to transportagricultural commodities timely and efficiently to the end consumer or the Company’s agricultural processingoperations.
6
Item 1. BUSINESS (Continued)
The Company processes and distributes edible beans in the United States for use as a food ingredient. TheCompany produces and distributes formula feeds and animal health and nutrition products to the livestock, dairy,poultry, and pet food industries.
A.C. Toepfer International (Toepfer), in which the Company has an 80% interest, is a global merchandiser ofagricultural commodities and processed products. Toepfer has 38 sales offices worldwide and operates export,river, and country elevators in Argentina, Romania, Ukraine, and the United States.
The Company has a 45% interest in Kalama Export Company, a grain export elevator in Washington.
Other
The Company is engaged in milling wheat, corn, and milo into flour in the United States, Canada, the Caribbean,and the United Kingdom. Wheat flour is sold primarily to commercial bakeries, food companies, food servicecompanies, and retailers. Bulgur, a gelatinized wheat food, is sold to both the export and the domestic foodmarkets. Corn meal and flour is sold primarily to the cereal, snack, and bakery mix markets. The Companyproduces bakery products and mixes, wheat starch, and gluten which are sold to the baking industry. TheCompany also mills milo to produce industrial flour used in the manufacturing of wallboard for the buildingindustry.
Gruma S.A. de C.V. (Gruma), in which the Company has a 23% interest, is the world’s largest producer andmarketer of corn flour and tortillas with operations in the United States, Mexico, Central America, SouthAmerica, and Europe. Additionally, the Company has a 20% share, through a joint venture with Gruma, in sixU.S. corn flour mills. The Company also has a 40% share, through a joint venture with Gruma, in nine Mexican-based wheat flour mills.
The Company processes cocoa beans and produces cocoa liquor, cocoa butter, cocoa powder, chocolate, andvarious compounds in North America, South America, Europe, Asia, and Africa for the food processingindustry.
The Company sold its interest in International Malting Company (IMC), a wholly-owned subsidiary of theCompany, which operated malting barley plants in the United States, Australia, New Zealand, and Canada onJuly 31, 2008.
Hickory Point Bank and Trust Company, fsb, a wholly-owned subsidiary of the Company, furnishes publicbanking and trust services, as well as cash management, transfer agency, and securities safekeeping services, forthe Company.
ADM Investor Services, Inc., a wholly-owned subsidiary of the Company, is a registered futures commissionmerchant and a clearing member of all principal commodities exchanges. ADM Investor Services International,Ltd., ADMIS Hong Kong Limited, and ADM Investor Services Taiwan are wholly-owned subsidiaries of theCompany offering broker services in Europe and Asia. ADM Derivatives, Inc. offers foreign exchange servicesto institutional and retail clients.
Agrinational Insurance Company, a wholly-owned subsidiary of the Company, provides insurance coverage forcertain property, casualty, marine, and other miscellaneous risks of the Company and participates in certainthird-party reinsurance arrangements.
The Company is a limited partner in various private equity funds which invest primarily in emerging markets.
7
Item 1. BUSINESS (Continued)
Corporate
Compagnie Industrielle et Financiere des produits Amylaces SA (Luxembourg) and affiliates, of which theCompany has a 41.5% interest, is a joint venture which targets investments in food, feed ingredients and bioenergybusinesses.
Methods of Distribution
Since the Company’s customers are principally other manufacturers and processors, the Company’s products aredistributed mainly in bulk from processing plants or storage facilities directly to the customers’ facilities. TheCompany has developed a comprehensive transportation system utilizing trucks, railcars, river barges, and ocean-going vessels to efficiently move both commodities and processed products virtually anywhere in the world. TheCompany owns or leases large numbers of the trucks, trailers, railroad tank and hopper cars, river barges, andtowboats used in this transportation system.
Concentration of Sales by Product
The following products account for 10% or more of net sales and other operating income for the last three fiscalyears:
% of Net Sales and Other Operating Income2008 2007 2006
Soybeans 16% 12% 14%Corn 14% 15% 12%Soybean Meal 11% 12% 13%Wheat 10% 8% 8%
Status of New Products
The Company continues to expand its business through the development of new products to meet the growingdemands for food, animal feed, chemicals and energy.
The Company’s researchers continue to develop custom low-trans fats and oils for bakery and quick-servicerestaurants that utilize the Company’s Novalipid portfolio of low-trans fats and oils. These products have enabledcustomers to comply with various municipal trans fat bans.
The Company’s cooked, dried edible bean products are finding a number of new applications due to the increasedinterest among our customers in improving nutrition, especially in the area of foods designed for children.
The Company’s alliance with Metabolix for production of PHA, a biodegradable plastic, is proceeding. Semi-works production of PHA is being used for market development by Telles, a joint-venture company between theCompany and Metabolix. The construction of the Company’s 50,000 metric ton per year commercialmanufacturing facility is scheduled for completion in fiscal 2009.
The Company is proceeding with construction of a 100,000 metric ton per year commercial propylene/ethyleneglycol facility. These products are principally used in industrial applications such as antifreeze and coolants, themanufacture of certain plastics, and paints and coatings.
The Company has entered into a joint development agreement with ConocoPhillips that will develop renewabletransportation fuels from agriculture, forestry, and crops grown specifically for energy. This development effortis focused on the production of bio-crude oil that can be used by conventional petroleum refineries to producetransportation fuels.
8
Item 1. BUSINESS (Continued)
Source and Availability of Raw Materials
Substantially all of the Company’s raw materials are agricultural commodities. In any single year, theavailability and price of these commodities are subject to unpredictable factors such as weather, plantings,government programs and policies, changes in global demand created by population growth and changes instandards of living, and global production of similar and competitive crops. The Company’s raw materials areprocured from thousands of growers, grain elevators, and wholesale merchants, principally in North America,South America, and Europe, pursuant to short-term agreements (less than one year) or on a spot basis. TheCompany is not dependent upon any particular grower, elevator, or merchant as a source for its raw materials.
Patents, Trademarks, and Licenses
The Company owns several valuable patents, trademarks, and licenses but does not consider any segment of itsbusiness dependent upon any single or group of patents, trademarks or licenses.
Seasonality, Working Capital Needs, and Significant Customers
Since the Company is so widely diversified in global agribusiness markets, there are no material seasonalfluctuations in the manufacture, sale, and distribution of its products and services. There is a degree of seasonalityin the growing cycles, procurement, and transportation of the Company’s principal raw materials: oilseeds, corn,wheat, cocoa beans, and other grains. However, the physical movement of the millions of bushels of these cropsthrough the Company’s processing facilities is reasonably constant throughout the year.
Price variations and availability of raw agricultural commodities may cause fluctuations in the Company’s workingcapital levels. No material part of the Company’s business in any segment is dependent upon a single customer orvery few customers.
Competition
The Company has significant competition in the markets in which it operates based principally on price, quality,products and alternative products, some of which are made from different raw materials than those utilized by theCompany. Given the commodity-based nature of many of its businesses, the Company, on an ongoing basis,focuses on managing unit costs and improving efficiency through technology improvements, productivityenhancements, and regular evaluation of the Company’s asset portfolio.
Research and Development Expenditures
The Company’s research and development expenditures are focused on developing food, animal feed, chemical,and energy products from renewable agricultural crops.
The Company maintains a research laboratory in Decatur, Illinois, where product and process developmentactivities are conducted. Activities include the development of new bioproducts and the improvement of existingbioproducts, by utilizing new microbial strains that are developed using classical mutation and genetic engineering.Protein and vegetable oil research is also conducted in Decatur where bakery, meat and dairy pilot plants supportfood ingredient research. Vegetable oil research is also conducted in Hamburg, Germany; Erith, UK; and Arras,France. Research in Hamburg, Germany was expanded this year to include capabilities for biodiesel andoleochemicals. Research to support sales and development of flour and bakery products is conducted at a newly-constructed laboratory in Overland Park, Kansas. Sales and development support for cocoa and chocolate productsis performed in Milwaukee, Wisconsin, and the Netherlands. Research and technical support for industrial andfood wheat starch applications is conducted in Montreal, Canada. The Company has consolidated its researchfacilities by closing the Clinton, Iowa and Decatur, Indiana research locations and relocating staff to the researchcenter in Decatur, Illinois.

9
Item 1. BUSINESS (Continued)
The Company uses technical services representatives to interact with customers to understand the customers’product needs. These technical service representatives then interact with researchers who are familiar with theCompany’s wide range of products as well as applications technology. These individuals form quick-acting teamsto develop solutions to customer needs.
The Company has entered into a new cooperative research and development agreement with Pacific NorthwestNational Laboratory which is focused on hydrothermal liquefaction of biomass to biocrude oils. This agreementis part of the effort being undertaken to support a joint development project with ConocoPhillips.
The Company has begun research related to the recently awarded funding from the Department of Energy todevelop yeasts capable of fermenting 5-carbon sugars, which is a key technology for producing ethanol fromlignocellulosic biomass. The Company is partnered with Purdue University on this project.
The amounts spent during the three years ended June 30, 2008, 2007 and 2006 for such technical efforts wereapproximately $49 million, $45 million, and $45 million, respectively.
Environmental Compliance
During the year ended June 30, 2008, $125 million was spent for equipment, facilities, and programs for pollutioncontrol and compliance with the requirements of various environmental agencies.
There have been no material effects upon the earnings and competitive position of the Company resulting fromcompliance with federal, state, and local laws or regulations enacted or adopted relating to the protection of theenvironment.
Number of Employees
The number of persons employed by the Company was approximately 27,600 at June 30, 2008.
Financial Information About Foreign and Domestic Operations
Item 1A, “Risk Factors,” and Item 2, “Properties,” includes information relating to the Company’s foreignoperations. Geographic financial information is set forth in “Note 14 of Notes to Consolidated FinancialStatements” included in Item 8 herein, “Financial Statements and Supplementary Data”.
Available Information
The Company’s Internet address is http://www.admworld.com. The Company makes available, free of charge,through its Internet site, the Company’s annual reports on Form 10-K; quarterly reports on Form 10-Q; currentreports on Form 8-K; Directors and Officers Forms 3, 4, and 5; and amendments to those reports, as soon asreasonably practicable after electronically filing such materials with, or furnishing them to, the Securities andExchange Commission (SEC).
In addition, the Company makes available, through its Internet site, the Company’s Business Code of Conduct andEthics, Corporate Governance Guidelines, and the written charters of the Audit, Compensation/Succession,Nominating/Corporate Governance, and Executive Committees.
References to our website addressed in this report are provided as a convenience and do not constitute, or shouldnot be viewed as, an incorporation by reference of the information contained on, or available through, the website.Therefore, such information should not be considered part of this report.

10
Item 1. BUSINESS (Continued)
The public may read and copy any materials filed by the Company with the SEC at the SEC’s Public ReferenceRoom at 100 F Street, N.E., Washington, D.C. 20549. The public may obtain information on the operation of thePublic Reference Room by calling the SEC at 1-800-SEC-0330. The SEC maintains an Internet site whichcontains reports, proxy and information statements, and other information regarding issuers that file informationelectronically with the SEC. The SEC’s Internet address is http://www.sec.gov.
Item 1A. RISK FACTORS
The availability and price of the agricultural commodities and agricultural commodity products the Companyproduces and merchandises can be affected by weather, disease, government programs, competition, andvarious other factors beyond the Company’s control and could adversely affect the Company’s operating results.
The availability and price of agricultural commodities are subject to wide fluctuations due to unpredictable factorssuch as weather, plantings, government programs and policies, changes in global demand resulting from populationgrowth and changes in standards of living, and global production of similar and competitive crops. These factorshave historically caused volatility in the agricultural commodities industry and, consequently, in the Company’soperating results. Reduced supply of agricultural commodities due to weather-related factors or other reasonscould adversely affect the Company’s profitability by increasing the cost of raw materials used in the Company’sagricultural processing operations. Reduced supplies of agricultural commodities could also limit the Company’sability to procure, transport, store, process, and merchandise agricultural commodities in an efficient manner whichcould adversely affect the Company’s profitability. In addition, the availability and price of agriculturalcommodities can be affected by other factors, such as plant disease, which can result in crop failures and reducedharvests.
Also, with respect to prices, to the extent production capacity is added within the agricultural processing industry,the disruption to the balance of supply and demand may result in increased raw material costs and/or downwardpressure on the relevant product selling prices, thereby adversely affecting revenues and operating results.
Fluctuations in energy prices could adversely affect the Company’s operating results.
The Company’s operating costs and the selling prices of certain finished products are sensitive to changes in energyprices. The Company’s processing plants are powered principally by electricity, natural gas, and coal. TheCompany’s transportation operations are dependent upon diesel fuel and other petroleum products. Significantincreases in the cost of these items could adversely affect the Company’s production costs and operating results.
The Company has certain finished products, such as ethanol and biodiesel, which are closely related to, or may besubstituted for, petroleum products. Therefore, the selling prices of ethanol and biodiesel can be impacted by theselling prices of gasoline and diesel fuel. A significant decrease in the price of gasoline or diesel fuel could resultin a significant decrease in the selling price of the Company’s ethanol and biodiesel and could adversely affect theCompany’s revenues and operating results.
The Company is subject to economic downturns, political instability and other risks of doing business globallywhich could adversely affect the Company’s operating results.
The Company conducts its business and has substantial assets located in many countries and geographic areas.The Company’s operations are principally in the United States and developed countries in Western Europe andSouth America, but the Company also operates in, or plans to expand or develop its business in, emergingmarket areas such as Asia, Eastern Europe, and Africa. Both developed and emerging market areas are subject toeconomic downturns and emerging market areas could be subject to more volatile economic, political andmarket conditions. Such economic downturns and volatile conditions may have a negative impact on theCompany’s ability to execute its business strategies and on its operating results.

11
Item 1A. RISK FACTORS (Continued)
The Company’s operating results could be affected by changes in trade, monetary and fiscal policies, laws andregulations, and other activities of governments, agencies, and similar organizations. These conditions include butare not limited to changes in a country’s or region’s economic or political conditions, trade regulations affectingproduction, pricing and marketing of products, local labor conditions and regulations, reduced protection ofintellectual property rights, changes in the regulatory or legal environment, restrictions on currency exchangeactivities, currency exchange fluctuations, burdensome taxes and tariffs, enforceability of legal agreements andjudgments, and other trade barriers. International risks and uncertainties, including changing social and economicconditions as well as terrorism, political hostilities, and war, could limit the Company’s ability to transact businessin these markets and could adversely affect the Company’s revenues and operating results.
Government policies and regulations, in general, and specifically affecting the agricultural sector and relatedindustries, could adversely affect the Company’s operating results.
Agricultural production and trade flows are subject to government policies and regulations. Governmental policiesaffecting the agricultural industry, such as taxes, tariffs, duties, subsidies, incentives, and import and exportrestrictions on agricultural commodities and commodity products, can influence the planting of certain crops, thelocation and size of crop production, whether unprocessed or processed commodity products are traded, the volumeand types of imports and exports, the availability and competitiveness of feedstocks as raw materials, and industryprofitability. In addition, international trade disputes can adversely affect agricultural commodity trade flows bylimiting or disrupting trade between countries or regions. Future government policies may adversely affect thesupply of, demand for, and prices of the Company’s products, restrict the Company’s ability to do business in itsexisting and target markets, and could negatively impact revenues and operating results.
The Company is subject to industry - specific risks which could adversely affect the Company’s operatingresults.
The Company is subject to risks which include, but are not limited to, product quality or contamination, shiftingconsumer preferences, federal, state, and local food processing regulations, and customer product liability claims.The liability which could result from these risks may not always be covered by, or could exceed liability insurancerelated to product liability and food safety matters maintained by the Company. The occurrence of any of thematters described above could adversely affect the Company’s revenues and operating results.
Certain of the Company’s merchandised commodities and finished products are used as ingredients in livestockand poultry feed. The Company is subject to risks associated with the outbreak of disease in livestock andpoultry, including, but not limited to, mad-cow disease and avian influenza. The outbreak of disease couldadversely affect demand for the Company’s products used as ingredients in livestock and poultry feed. Adecrease in demand for these products could adversely affect the Company’s revenues and operating results.
The Company is subject to numerous laws and regulations globally which could adversely affect the Company’soperating results.
The Company is required to comply with the numerous and broad reaching laws and regulations administered byUnited States federal, state, local, and foreign governmental agencies relating to, but not limited to, the sourcing,transporting, storing, and processing of agricultural raw materials as well as the transporting, storing anddistributing of related agricultural products including commercial activities conducted by Company employees andthird parties globally. Any failure to comply with applicable laws and regulations could subject the Company toadministrative penalties and injunctive relief, civil remedies, including fines, injunctions, and recalls of its products.
The production of the Company’s products requires the use of materials which can create emissions of certainregulated substances. Although the Company has programs in place throughout the organization globally to guardagainst non-compliance, failure to comply with these regulations can have serious consequences, including civiland administrative penalties as well as a negative impact on the Company’s reputation.
12
Item 1A. RISK FACTORS (Continued)
In addition, changes to regulations may require the Company to modify existing processing facilities and/orprocesses which could significantly increase operating costs and negatively impact operating results.
The Company is exposed to potential business disruption, including but not limited to transportation services,and other serious adverse impacts resulting from acts of terrorism or war, natural disasters and severe weatherconditions, and accidents which could adversely affect the Company’s operating results.
The assets and operations of the Company are subject to damage and disruption from various events which include,but are not limited to, acts of terrorism or war, natural disasters and severe weather conditions, accidents,explosions, and fires.
The potential effects of the conditions cited above include, but are not limited to, extensive property damage,extended business interruption, personal injuries, and damage to the environment. The Company’s operations alsorely on dependable and efficient transportation services. A disruption in transportation services could result insupply problems at the Company’s facilities and impair the Company’s ability to deliver products to its customersin a timely manner.
The Company’s business is capital intensive in nature and the Company relies on cash generated from itsoperations and external financing to fund its growth and ongoing capital needs. Limitations on access toexternal financing could adversely affect the Company’s operating results.
The Company requires significant capital to operate its current business and fund its growth strategy. TheCompany’s working capital requirements are directly affected by the price of agricultural commodities, which mayfluctuate significantly and change quickly. The Company also requires substantial capital to maintain and upgradeits extensive network of storage facilities, processing plants, refineries, mills, ports, transportation assets and otherfacilities to keep pace with competitive developments, technological advances, regulations and changing safetystandards in the industry. Moreover, the expansion of the Company’s business and pursuit of acquisitions or otherbusiness opportunities may require significant amounts of capital. If the Company is unable to generate sufficientcash flows or raise adequate external financing, it may restrict the Company’s current operations and its growthopportunities which could adversely affect the Company’s operating results
The Company’s risk management strategies may not be effective.
The Company’s business is affected by fluctuations in agricultural commodity prices, transportation costs, energyprices, interest rates, and foreign currency exchange rates. We engage in hedging transactions to manage theserisks. However, our hedging strategies may not be successful in mitigating our exposure to these fluctuations. See“Item 7A. Quantitative and Qualitative Disclosures About Market Risk.”
Item 1B. UNRESOLVED STAFF COMMENTS
The Company has no unresolved staff comments.

13
Item 2. PROPERTIES
The Company owns or leases the following processing plants and procurement facilities:
Processing Plants Procurement FacilitiesUnited International Total United International TotalStates States
Owned 131 97 228 176 104 280Leased 2 2 4 19 29 48
133 99 232 195 133 328
The Company’s operations are such that most products are efficiently processed near the source of raw materials.Consequently, the Company has many plants strategically located in agricultural commodity producing areas. Theannual volume of commodities processed will vary depending upon availability of raw materials and demand forfinished products.
To enhance the efficiency of transporting large quantities of raw materials and finished products between theCompany’s procurement facilities and processing plants and also the final delivery of products to our customersaround the world, the Company owns or leases over 2,200 barges, 23,700 rail cars, 800 trucks, and 2,100 trailers.
Oilseeds Processing
Processing Plants Procurement FacilitiesUnitedStates
International Total UnitedStates
International Total
Owned 53 56 109 15 80 95Leased – – – – 20 20
53 56 109 15 100 115
The Company operates twenty-three domestic and eighteen international oilseed crushing plants with a dailyprocessing capacity of approximately 91,000 metric tons (3.4 million bushels). The domestic plants are located inGeorgia, Illinois, Indiana, Iowa, Kansas, Minnesota, Missouri, Nebraska, North Dakota, Ohio, South Carolina,Tennessee, and Texas. The international plants are located in Bolivia, Brazil, Canada, England, Germany, India,Mexico, the Netherlands, Poland, and Ukraine.
The Company operates thirteen domestic oilseed refineries in Georgia, Illinois, Indiana, Iowa, Minnesota, Missouri,Nebraska, North Dakota, and Tennessee, as well as seventeen international refineries in Bolivia, Brazil, Canada,England, Germany, India, the Netherlands, and Poland. The Company packages oils at five domestic plants locatedin California, Georgia, and Illinois, as well as at seven international plants located in Bolivia, Brazil, England,Poland and Germany. The Company operates one domestic and six international biodiesel plants located in NorthDakota, Brazil, Germany, and India. In addition, the Company operates two fertilizer blending plants in Brazil.
The Oilseeds Processing segment operates fifteen domestic country grain elevators as adjuncts to its processingplants. These elevators, with an aggregate storage capacity of eight million bushels, are located in Illinois,Missouri, North Carolina, and Ohio.
This segment also operates one hundred international elevators, including port facilities, in Bolivia, Brazil, Canada,Germany, the Netherlands, Paraguay, and Poland as adjuncts to its processing plants. These facilities have astorage capacity of 125 million bushels.
The Company operates two soy protein specialty plants in Illinois and one plant in the Netherlands. Lecithinproducts are produced at six domestic and four international plants in Illinois, Iowa, Nebraska, Canada, Germany,and the Netherlands. The Company produces soy-based foods at a plant in North Dakota and produces vitamin E,sterols, and isoflavones at plants in Illinois. The Company also operates a specialty oils and fats plant in Francethat produces various value-added products for the pharmaceutical, cosmetic and food industries.
14
Item 2. PROPERTIES (Continued)
Corn Processing
Processing Plants Procurement FacilitiesUnitedStates
International Total UnitedStates
International Total
Owned 13 – 13 5 – 5
The Company operates five wet corn milling plants and two dry corn milling plants with a daily grind capacity ofapproximately 50,000 metric tons (2.0 million bushels). The Company also operates corn germ extraction plants,sweeteners and starches production facilities, and bioproducts production facilities in Illinois, Iowa, Minnesota,Nebraska, North Carolina, and North Dakota. The Corn Processing segment also operates five domestic grainterminal elevators as adjuncts to its processing plants. These elevators, with an aggregate storage capacity of 13million bushels, are located in Minnesota.
Agricultural Services
Processing Plants Procurement FacilitiesUnitedStates
International Total UnitedStates
International Total
Owned 29 6 35 156 18 174Leased 2 1 3 19 7 26
31 7 38 175 25 200
The Company operates one hundred fifty-two domestic terminal, sub-terminal, country, and river elevatorscovering the major grain producing states, including sixty-four country elevators, eighty sub-terminal, terminal andriver loading facilities, and eight grain export elevators in Florida, Louisiana, Ohio, and Texas. Elevators arelocated in Arkansas, Illinois, Indiana, Iowa, Kansas, Kentucky, Michigan, Minnesota, Missouri, Montana,Nebraska, North Dakota, Ohio, Oklahoma, Tennessee, and Texas. These elevators have an aggregate storagecapacity of approximately 356 million bushels. The Company has five grain export elevators in Argentina,Mexico, and Ukraine that have an aggregate storage capacity of approximately 29 million bushels. The Companyhas thirteen country elevators located in the Dominican Republic, Romania, and Ukraine. In addition, theCompany has seven river elevators located in Romania and Ukraine.
The Company operates twenty-three domestic edible bean procurement facilities with an aggregate storage capacityof approximately 11 million bushels, located in Colorado, Idaho, Michigan, Minnesota, North Dakota, andWyoming.
The Company operates a rice mill located in California, an animal feed facility in Illinois, and an edible bean plantin North Dakota. The Company also operates twenty-eight domestic and seven international formula feed andanimal health and nutrition plants. The domestic plants are located in Georgia, Illinois, Indiana, Iowa, Kansas,Kentucky, Michigan, Minnesota, Missouri, Nebraska, Ohio, Pennsylvania, Texas, Washington, and Wisconsin.The foreign plants are located in Canada, China, Puerto Rico, and Trinidad & Tobago.
15
Item 2. PROPERTIES (Continued)
Other
Processing Plants Procurement FacilitiesUnitedStates
International Total UnitedStates
International Total
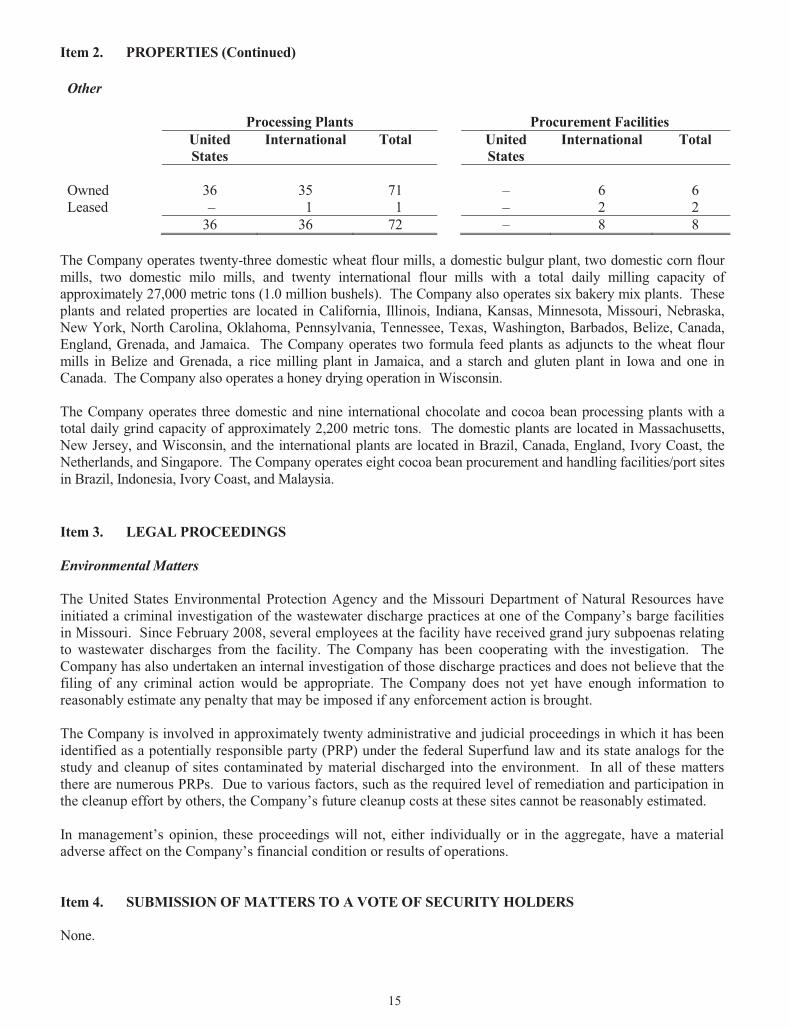
Owned 36 35 71 – 6 6Leased – 1 1 – 2 2
36 36 72 – 8 8
The Company operates twenty-three domestic wheat flour mills, a domestic bulgur plant, two domestic corn flourmills, two domestic milo mills, and twenty international flour mills with a total daily milling capacity ofapproximately 27,000 metric tons (1.0 million bushels). The Company also operates six bakery mix plants. Theseplants and related properties are located in California, Illinois, Indiana, Kansas, Minnesota, Missouri, Nebraska,New York, North Carolina, Oklahoma, Pennsylvania, Tennessee, Texas, Washington, Barbados, Belize, Canada,England, Grenada, and Jamaica. The Company operates two formula feed plants as adjuncts to the wheat flourmills in Belize and Grenada, a rice milling plant in Jamaica, and a starch and gluten plant in Iowa and one inCanada. The Company also operates a honey drying operation in Wisconsin.
The Company operates three domestic and nine international chocolate and cocoa bean processing plants with atotal daily grind capacity of approximately 2,200 metric tons. The domestic plants are located in Massachusetts,New Jersey, and Wisconsin, and the international plants are located in Brazil, Canada, England, Ivory Coast, theNetherlands, and Singapore. The Company operates eight cocoa bean procurement and handling facilities/port sitesin Brazil, Indonesia, Ivory Coast, and Malaysia.
Item 3. LEGAL PROCEEDINGS
Environmental Matters
The United States Environmental Protection Agency and the Missouri Department of Natural Resources haveinitiated a criminal investigation of the wastewater discharge practices at one of the Company’s barge facilitiesin Missouri. Since February 2008, several employees at the facility have received grand jury subpoenas relatingto wastewater discharges from the facility. The Company has been cooperating with the investigation. TheCompany has also undertaken an internal investigation of those discharge practices and does not believe that thefiling of any criminal action would be appropriate. The Company does not yet have enough information toreasonably estimate any penalty that may be imposed if any enforcement action is brought.
The Company is involved in approximately twenty administrative and judicial proceedings in which it has beenidentified as a potentially responsible party (PRP) under the federal Superfund law and its state analogs for thestudy and cleanup of sites contaminated by material discharged into the environment. In all of these mattersthere are numerous PRPs. Due to various factors, such as the required level of remediation and participation inthe cleanup effort by others, the Company’s future cleanup costs at these sites cannot be reasonably estimated.
In management’s opinion, these proceedings will not, either individually or in the aggregate, have a materialadverse affect on the Company’s financial condition or results of operations.
Item 4. SUBMISSION OF MATTERS TO A VOTE OF SECURITY HOLDERS
None.
16
PART II
Item 5. MARKET FOR REGISTRANT’S COMMON EQUITY, RELATED STOCKHOLDERMATTERS, AND ISSUER PURCHASES OF EQUITY SECURITIES
Common Stock Market Prices and Dividends
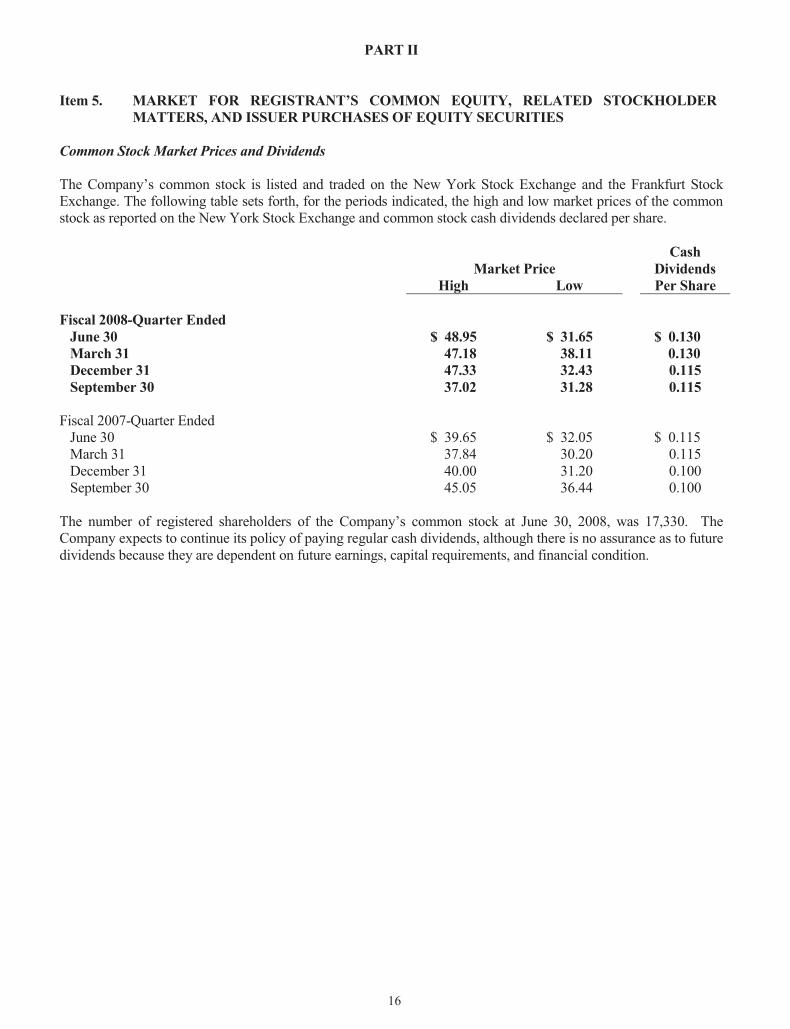
The Company’s common stock is listed and traded on the New York Stock Exchange and the Frankfurt StockExchange. The following table sets forth, for the periods indicated, the high and low market prices of the commonstock as reported on the New York Stock Exchange and common stock cash dividends declared per share.
CashMarket Price Dividends
High Low Per Share
Fiscal 2008-Quarter EndedJune 30 $ 48.95 $ 31.65 $ 0.130March 31 47.18 38.11 0.130December 31 47.33 32.43 0.115September 30 37.02 31.28 0.115
Fiscal 2007-Quarter EndedJune 30 $ 39.65 $ 32.05 $ 0.115March 31 37.84 30.20 0.115December 31 40.00 31.20 0.100September 30 45.05 36.44 0.100
The number of registered shareholders of the Company’s common stock at June 30, 2008, was 17,330. TheCompany expects to continue its policy of paying regular cash dividends, although there is no assurance as to futuredividends because they are dependent on future earnings, capital requirements, and financial condition.

17
Item 5. MARKET FOR REGISTRANT’S COMMON EQUITY, RELATED STOCKHOLDERMATTERS, AND ISSUER PURCHASES OF EQUITY SECURITIES (Continued)
Issuer Purchases of Equity Securities
Total Number of Number of SharesTotal Number Average Shares Purchased as Remaining to be
of Shares Price Paid Part of Publicly Purchased Under thePeriod Purchased (1) per Share Announced Program (2) Program (2)
April 1, 2008 toApril 30, 2008 1,799 $ 47.13 307 75,630,561
May 1, 2008 toMay 31, 2008 9,061 43.99 154 75,630,407
June 1, 2008 toJune 30, 2008 118 41.80 118 75,630,289
Total 10,978 $ 44.48 579 75,630,289
(1) Total shares purchased represents those shares purchased as part of the Company’s publicly announced sharerepurchase program described below and shares received as payment of the exercise price for stock optionexercises. During the three-month period ended June 30, 2008, the Company received 10,399 shares as payment ofthe exercise price for stock option exercises.
(2) On November 4, 2004, the Company’s Board of Directors approved a stock repurchase program authorizingthe Company to repurchase up to 100,000,000 shares of the Company’s common stock during the periodcommencing January 1, 2005 and ending December 31, 2009.
18
Item 5. MARKET FOR REGISTRANT’S COMMON EQUITY, RELATED STOCKHOLDERMATTERS, AND ISSUER PURCHASES OF EQUITY SECURITIES (Continued)
Performance Graph
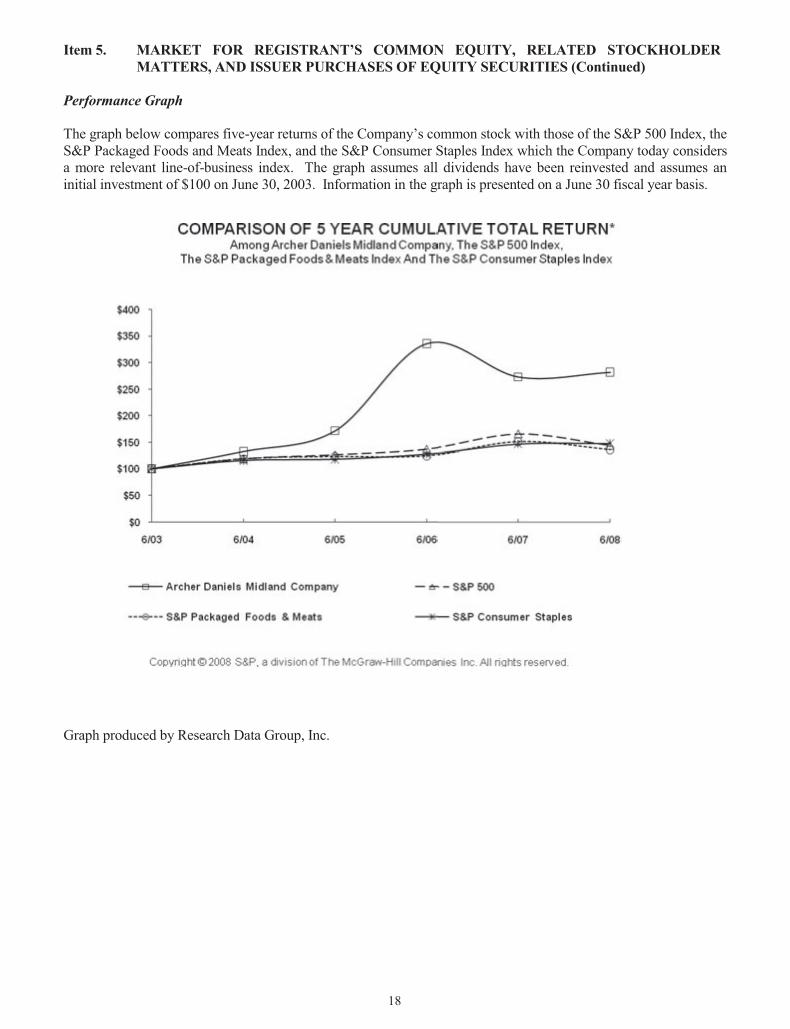
The graph below compares five-year returns of the Company’s common stock with those of the S&P 500 Index, theS&P Packaged Foods and Meats Index, and the S&P Consumer Staples Index which the Company today considersa more relevant line-of-business index. The graph assumes all dividends have been reinvested and assumes aninitial investment of $100 on June 30, 2003. Information in the graph is presented on a June 30 fiscal year basis.
Graph produced by Research Data Group, Inc.
Item 6. SELECTED FINANCIAL DATA
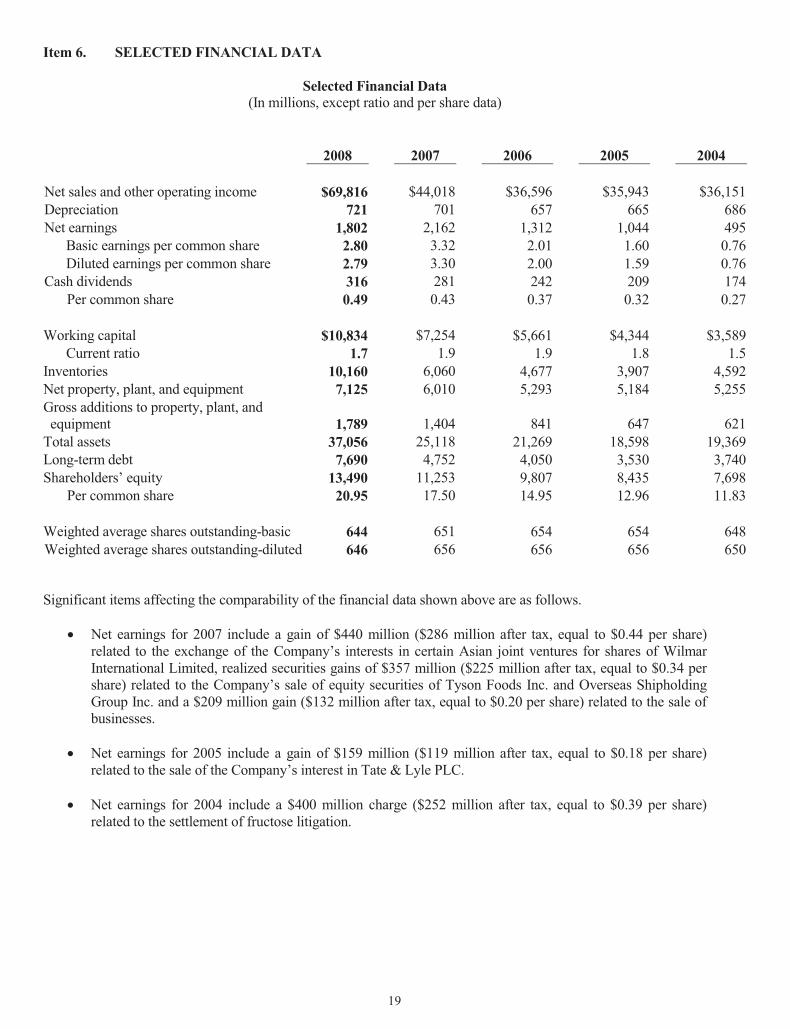
Selected Financial Data(In millions, except ratio and per share data)
2008 2007 2006 2005 2004
Net sales and other operating income $69,816 $44,018 $36,596 $35,943 $36,151Depreciation 721 701 657 665 686Net earnings 1,802 2,162 1,312 1,044 495
Basic earnings per common share 2.80 3.32 2.01 1.60 0.76Diluted earnings per common share 2.79 3.30 2.00 1.59 0.76
Cash dividends 316 281 242 209 174Per common share 0.49 0.43 0.37 0.32 0.27
Working capital $10,834 $7,254 $5,661 $4,344 $3,589Current ratio 1.7 1.9 1.9 1.8 1.5
Inventories 10,160 6,060 4,677 3,907 4,592Net property, plant, and equipment 7,125 6,010 5,293 5,184 5,255Gross additions to property, plant, andequipment 1,789 1,404 841 647 621
Total assets 37,056 25,118 21,269 18,598 19,369Long-term debt 7,690 4,752 4,050 3,530 3,740Shareholders’ equity 13,490 11,253 9,807 8,435 7,698
Per common share 20.95 17.50 14.95 12.96 11.83
Weighted average shares outstanding-basic 644 651 654 654 648Weighted average shares outstanding-diluted 646 656 656 656 650
Significant items affecting the comparability of the financial data shown above are as follows.
� Net earnings for 2007 include a gain of $440 million ($286 million after tax, equal to $0.44 per share)related to the exchange of the Company’s interests in certain Asian joint ventures for shares of WilmarInternational Limited, realized securities gains of $357 million ($225 million after tax, equal to $0.34 pershare) related to the Company’s sale of equity securities of Tyson Foods Inc. and Overseas ShipholdingGroup Inc. and a $209 million gain ($132 million after tax, equal to $0.20 per share) related to the sale ofbusinesses.
� Net earnings for 2005 include a gain of $159 million ($119 million after tax, equal to $0.18 per share)related to the sale of the Company’s interest in Tate & Lyle PLC.
� Net earnings for 2004 include a $400 million charge ($252 million after tax, equal to $0.39 per share)related to the settlement of fructose litigation.
19

20
Item 7. MANAGEMENTÕS DISCUSSION AND ANALYSIS OF FINANCIAL CONDITION AND
RESULTS OF OPERATIONS
Company Overview
The Company is principally engaged in procuring, transporting, storing, processing, and merchandising agricultural
commodities and products. Beginning in fiscal 2008, the Company has reclassified certain operations within its
reportable segments to reflect how the Company now manages its businesses following a realignment of the
organizational structure of the Company and to reflect the activities of the Company as viewed by the
CompanyÕs chief operating decision maker. Prior period segment information has been reclassified to conform
to the new presentation. The CompanyÕs operations are classified into three reportable business segments: Oilseeds
Processing, Corn Processing and Agricultural Services. Each of these segments is organized based upon the nature
of products and services offered. The CompanyÕs remaining operations are aggregated and classified as Other.
The Oilseeds Processing segment includes activities related to the origination and crushing of oilseeds such as
soybeans, cottonseed, sunflower seeds, canola, peanuts, and flaxseed into vegetable oils and protein meals
principally for the food and feed industries. In addition, oilseeds and oilseed products may be processed internally
or resold into the marketplace as raw materials for other processing. Crude vegetable oil is sold "as is" or is further
processed by refining, bleaching, and deodorizing into salad oils. Salad oils can be further processed by
hydrogenating and/or interesterifying into margarine, shortening, and other food products. Partially refined oil is
sold for use in chemicals, paints, and other industrial products. Refined oil can be further processed for use in the
production of biodiesel. Oilseed protein meals are primary ingredients used in the manufacture of commercial
livestock and poultry feeds. Oilseeds Processing includes activities related to the production of natural health and
nutrition products and the production of other specialty food and feed ingredients. This segment also includes
activities related to the CompanyÕs interests in unconsolidated affiliates in Asia, principally Wilmar International
Limited.
The Corn Processing segment includes activities related to the production of sweeteners, starches, dextrose, and
syrups primarily for the food and beverage industry as well as activities related to the production, by fermentation,
of bioproducts such as ethanol, amino acids, and other food, feed and industrial products.
The Agricultural Services segment utilizes the CompanyÕs extensive grain elevator and transportation network to
buy, store, clean, and transport agricultural commodities, such as oilseeds, corn, wheat, milo, oats, barley, and
edible beans, and resells or processes these commodities primarily as food and feed ingredients for the agricultural
processing industry. Agricultural ServicesÕ grain sourcing and transportation network provides reliable and
efficient services to the CompanyÕs agricultural processing operations. Also included in Agricultural Services are
the activities of A.C. Toepfer International, a global merchant of agricultural commodities and processed products.
Other includes the CompanyÕs remaining processing operations, consisting of activities related to processing
agricultural commodities into food ingredient products such as wheat into wheat flour, cocoa into chocolate and
cocoa products, and barley into malt. Other also includes financial activities related to banking, captive insurance,
private equity fund investments, and futures commission merchant activities.
Operating Performance Indicators
The CompanyÕs Oilseeds Processing, Agricultural Services, and wheat processing operations are principally
agricultural commodity-based businesses where changes in selling prices move in relationship to changes in prices
of the commodity-based agricultural raw materials. Therefore, changes in agricultural commodity prices have
relatively equal impacts on both net sales and cost of products sold and minimal impact on the gross profit of
underlying transactions. As a result, changes in gross profit of these businesses do not necessarily correspond to the
changes in net sales amounts.
21
Item 7. MANAGEMENT’S DISCUSSION AND ANALYSIS OF FINANCIAL CONDITION ANDRESULTS OF OPERATIONS (Continued)
The Company’s Corn Processing operations and certain other food and animal feed processing operations alsoutilize agricultural commodities (or products derived from agricultural commodities) as raw materials. In theseoperations, agricultural commodity market price changes can result in significant fluctuations in cost of productssold, and such price changes cannot necessarily be passed directly through to the selling price of the finishedproducts.
The Company conducts its business in many countries. For the majority of the Company’s subsidiaries locatedoutside the United States, the local currency is the functional currency. Revenues and expenses denominated inforeign currencies are translated into U.S. dollars at the weighted average exchange rates for the applicable periods.Fluctuations in the exchange rates of foreign currencies, primarily the Euro, British pound, and Canadian dollar, ascompared to the U.S. dollar will result in corresponding fluctuations in the U.S. dollar value of revenues andexpenses reported by the Company. The impact of these currency exchange rate changes, where significant, isdiscussed below.
The Company measures the performance of its business segments using key operating statistics such as segmentoperating profit, return on fixed capital investment, return on equity, return on net assets, and cost per metric tonproduced. The Company’s operating results can vary significantly due to changes in unpredictable factors such asfluctuations in energy prices, weather conditions, crop plantings, government programs and policies, changes inglobal demand resulting from population growth and changes in standards of living, and global production ofsimilar and competitive crops. Due to these unpredictable factors, the Company does not provide forward-lookinginformation in “Management’s Discussion and Analysis of Financial Condition and Results of Operations.”
2008 Compared to 2007
As an agricultural-based commodity business, the Company is subject to a variety of market factors which affectthe Company’s operating results. Strong demand for agricultural commodities and processed products haschallenged the global supply chain and provided exceptional margin opportunities in 2008. Strong global demandfor protein meal and vegetable oil and strong fertilizer demand in South America positively impacted OilseedsProcessing results. The market price of corn rose due to increased demand, resulting in higher raw material costsfor Corn Processing which were only partially passed on in the form of increased selling prices for sweeteners andstarches. Average ethanol selling prices decreased due to additional supply entering the market. Large NorthAmerican crops combined with global wheat shortages created favorable conditions in agricultural merchandisingand handling operations. Increased commodity costs resulted in larger LIFO inventory valuation reserves.
Earnings before income taxes decreased due principally to gains totaling $1.0 billion before income tax on businessdisposals recorded in 2007 including $440 million related to the exchange of the Company’s interest in certainAsian joint ventures for shares of Wilmar International Limited (the Wilmar gain), a $357 million realizedsecurities gain from sales of the Company’s equity securities of Tyson Foods, Inc. and Overseas ShipholdingGroup, Inc., a gain of $153 million from the sale of the Company’s interest in Agricore United, and a $53 milliongain from the sale of the Company’s Arkady food ingredient business.
Earnings before income taxes for 2008 include a charge of $569 million from the effect of changing commodityprices on LIFO inventory valuations, compared to a charge of $207 million in 2007. Earnings before income taxesfor 2008 also include a $32 million charge related to abandonment and write-down of long-lived assets, a $38million gain on sales of securities, and a $21 million gain on the disposal of long-lived assets. Earnings beforeincome taxes for 2007 include charges of $46 million related to the repurchase of $400 million of the Company’soutstanding debentures and $21 million related to abandonment and write-down of long-lived assets.

22
Item 7. MANAGEMENT’S DISCUSSION AND ANALYSIS OF FINANCIAL CONDITION ANDRESULTS OF OPERATIONS (Continued)
Analysis of Statements of Earnings
Net sales and other operating income increased 59% to $69.8 billion. Increased selling prices of agriculturalcommodities and oilseed processing products and, to a lesser extent, corn processing products and wheat flouraccounted for 85% of the increase and higher sales volumes, principally of agricultural commodities, ethanol, andbiodiesel, also contributed to the increase in net sales. In addition, net sales and other operating income increased$1.83 billion, or 4%, due to currency rate fluctuations.
Net sales and other operating income by segment are as follows:
2008 2007 Change(In millions)
Oilseeds ProcessingCrushing & Origination $14,477 $ 8,036 $ 6,441Refining, Packaging, Biodiesel & Other 8,588 5,758 2,830Asia 214 149 65
Total Oilseeds Processing 23,279 13,943 9,336
Corn ProcessingSweeteners & Starches 3,546 2,761 785Bioproducts 3,591 3,064 527
Total Corn Processing 7,137 5,825 1,312
Agricultural ServicesMerchandising & Handling 33,749 20,222 13,527Transportation 219 197 22
Total Agricultural Services 33,968 20,419 13,549
OtherWheat, Cocoa, & Malt 5,335 3,738 1,597Financial 97 93 4
Total Other 5,432 3,831 1,601Total $69,816 $44,018 $25,798
Oilseeds Processing sales increased 67% to $23.3 billion due principally to increased average selling pricesresulting primarily from increases in underlying commodity costs and from continuing strong demand for vegetableoil, biodiesel and protein meal. Sales volumes of vegetable oil, protein meal and biodiesel also increased. CornProcessing sales increased 23% to $7.1 billion. Good demand for sweeteners and starches resulted in higheraverage selling prices. Bioproducts sales increased primarily as a result of increased ethanol sales volumespartially offset by lower average ethanol selling prices. Increased ethanol sales volumes reflect higher gasolineprices, improved gasoline blending economics and additional demand, principally from newly-opened markets inthe southeastern United States. Agricultural Services sales increased 66% to $34.0 billion primarily due toincreased underlying commodity costs, and to a lesser extent, increased sales volumes. Sales in the Other segmentincreased 42% to $5.4 billion primarily due to higher average selling prices of wheat flour and, to a lesser extent,higher sales volumes and higher average selling prices of cocoa products.
Cost of products sold increased 62% to $66.0 billion primarily due to higher agricultural commodity costs, and, to alesser extent, higher sales volumes. Manufacturing expenses increased $549 million primarily due to higher energyand transportation fuel costs, increased employee-related costs, higher storage and handling costs, increasedproduction capacity, and the impact of foreign currency translation. In addition, cost of products sold increased$1.75 billion, or 4%, due to currency rate fluctuations.

23
Item 7. MANAGEMENT’S DISCUSSION AND ANALYSIS OF FINANCIAL CONDITION ANDRESULTS OF OPERATIONS (Continued)
Selling, general and administrative expenses increased $224 million to $1.4 billion primarily due to higheremployee-related costs and higher outside service costs, including $44 million related to an organizationalrealignment and reorganization of the company’s European headquarters, and increased $37 million due to theimpact of currency rate fluctuations.
Other income – net decreased $911 million primarily due to gains totaling $1.0 billion on business disposalsrecorded in 2007 including $440 million related to the Wilmar gain, $357 million realized securities gain from salesof the Company’s equity securities of Tyson Foods, Inc. and Overseas Shipholding Group, Inc., a gain of $153million from the sale of the Company’s interest in Agricore United, and a $53 million gain from the sale of theCompany’s Arkady food ingredient business. Equity in earnings of unconsolidated affiliates increased $121million in 2008, primarily related to improved operating results of the Company’s investments in U.S. grain export,Asian oilseeds and peanut processing ventures. Other income - net also reflects $38 million in gains on sales ofsecurities in 2008, $21 million in gains on disposals of long-lived assets in 2008, an increase from 2007 to 2008 of$11 million in charges related to abandonment and write-down of long-lived assets, and a charge of $46 millionrelated to the repurchase of $400 million of the Company’s outstanding debentures in 2007.
Operating profit by segment is as follows:
2008 2007 Change(In millions)
Oilseeds ProcessingCrushing & Origination $ 727 $ 414 $ 313Refining, Packaging, Biodiesel & Other 181 202 (21)Asia 132 523 (391)
Total Oilseeds Processing 1,040 1,139 (99)
Corn ProcessingSweeteners & Starches 529 509 20Bioproducts 432 596 (164)
Total Corn Processing 961 1,105 (144)
Agricultural ServicesMerchandising & Handling 873 382 491Transportation 144 156 (12)
Total Agricultural Services 1,017 538 479
OtherWheat, Cocoa, & Malt 217 209 8Financial 206 170 36
Total Other 423 379 44Total Segment Operating Profit 3,441 3,161 280
Corporate (817) (7) (810)Earnings Before Income Taxes $2,624 $3,154 $ (530)
Oilseeds Processing operating profit decreased 9% to $1.0 billion. Excluding the $440 million Wilmar gainreflected in Asia results in 2007, Oilseeds Processing operating profit increased 49%, primarily due to strong globaldemand for protein meal, vegetable oil, and fertilizer. Crushing and Origination operating profits increased 76% to$727 million due principally to improved crushing margins in North and South America and improved fertilizerresults in South America. Refining, Packaging, Biodiesel and Other operating profits decreased 10% to $181million due principally to decreased biodiesel margins in Europe and asset impairment charges of $28 million in2008, partially offset by improved global refining margins. 2007 operating profit for Refining, Packaging,

24
Item 7. MANAGEMENT’S DISCUSSION AND ANALYSIS OF FINANCIAL CONDITION ANDRESULTS OF OPERATIONS (Continued)
Biodiesel and Other includes a $14 million gain on a business disposal. Excluding the Wilmar gain, Asia operatingprofits increased 59% to $132 million, principally reflecting the Company’s share of improved operating profits ofWilmar International Limited.
Corn Processing operating profits decreased 13% to $961 million, primarily due to higher net corn costs.Sweeteners and Starches operating profits of $529 were relatively unchanged as higher average selling prices wereoffset by higher net corn costs and increased manufacturing costs. Manufacturing cost increases reflect higherenergy costs, higher repair and maintenance expenses, and higher costs for chemicals used in the manufacturingprocess. Bioproducts operating profits decreased 28% to $432 million primarily due to higher net corn costs,higher manufacturing expenses, and decreased average ethanol selling prices, partially offset by higher salesvolumes for ethanol and, to a lesser extent, higher average lysine selling prices and higher lysine sales volumes.
Agricultural Services operating profits increased 89% to $1.0 billion. 2007 operating profits in Merchandising andHandling include a $153 million gain on the sale of the Company’s interest in Agricore United. Excluding thisgain, Merchandising and Handling operating profits increased 281% to $873 million. This increase was primarilydue to enhanced merchandising and handling margins caused by volatile global grain and freight markets, favorablerisk management results, and to a lesser extent, increased sales volumes. Transportation operating profits decreased8% to $144 million primarily due to increased fuel costs.
Other operating profits increased 12% to $423 million. Wheat, Cocoa and Malt operating profits increased 4% to$217 million. 2007 operating profits for Wheat included a gain of $39 million from the sale of the Company’sArkady food ingredient business. Excluding the Arkady gain, Wheat, Cocoa and Malt operating profits improved28%, primarily due to improved wheat and malt margins reflecting increased demand, partially offset by decreasedcocoa processing margins reflecting higher raw material and operating costs and competitive pressures experiencedin the North American chocolate market. Financial operating profits improved 21% to $206 million primarily dueto improvements in the Company’s futures commission merchant business.
Corporate expense increased $810 million to $817 million, primarily due to a $362 million increase in the chargerelated to the effects of changing commodity prices on LIFO inventory valuations, a $371 million decrease inrealized securities gains primarily reflecting the $357 million gain recorded in 2007 from sales of the Company’sequity securities of Tyson Foods, Inc. and Overseas Shipholding Group, Inc., a $51 million increase in corporateexpenses due principally to reorganization and realignment costs, partially offset by a charge of $46 millionrecorded in 2007 related to the repurchase of $400 million of the Company’s outstanding debentures.
Income taxes decreased primarily due to lower pretax earnings. The Company’s effective tax rate during 2008 of31.3% was comparable to the 2007 rate of 31.5%.

25
Item 7. MANAGEMENT’S DISCUSSION AND ANALYSIS OF FINANCIAL CONDITION ANDRESULTS OF OPERATIONS (Continued)
2007 Compared to 2006
As an agricultural-based commodity business, the Company is subject to a variety of market factors which affectthe Company’s operating results. Strong biodiesel demand in Europe continued to create increased vegetable oildemand and positively impacted rapeseed crushing margins in Europe. Abundant oilseed supplies, improvedvegetable oil values, and strong protein meal demand have positively impacted oilseed crushing margins in NorthAmerica. Increased ethanol contracted selling prices, continuing strong ethanol demand, and solid demand forsweetener and starch products improved corn processing results. These increases in corn processing results werepartially offset by higher net corn costs. Global grain merchandising opportunities resulting from regionalproduction imbalances also improved operating results. North American river transportation operations werefavorably impacted by strong demand for river transportation services which increased barge freight rates.Increasing commodity price levels resulted in larger LIFO inventory valuation reserves.
Net earnings increased due principally to improved operating results in all of the Company’s operating segments.Earnings before income taxes for 2007 include a gain of $440 million related to the exchange of the Company’sinterests in certain Asian joint ventures for shares of Wilmar International Limited (the Wilmar Gain), a $357million realized securities gain from sales of the Company’s equity securities of Tyson Foods, Inc. and OverseasShipholding Group, Inc., a gain of $153 million from the sale of the Company’s interest in Agricore United and a$53 million gain from the sale of the Company’s Arkady food ingredient business. Earnings before income taxesfor 2007 also include charges of $207 million from the effect of changing commodity prices on LIFO inventoryvaluations, $46 million related to the repurchase of $400 million of the Company’s outstanding debentures, and $21million related to abandonment and write-down of long-lived assets. Net earnings for 2006 include a $36 millionreduction in income tax expense related to the recognition of federal and state income tax credits and adjustmentsresulting from the reconciliation of filed tax returns to the previously estimated tax provision. Earnings beforeincome taxes for 2006 include charges of $15 million resulting from the Company’s adoption of FinancialAccounting Standards Board Interpretation No. 47, Accounting for Conditional Asset Retirement Obligations, aninterpretation of FASB Statement No. 143 (FIN 47), $71 million related to abandonment and write-down of long-lived assets, $9 million representing the Company’s share of a charge for abandonment and write-down of long-lived assets reported by an unconsolidated affiliate of the Company, and $22 million associated with the closure ofa citric acid plant and exiting the European animal feed business. Earnings before income taxes for 2006 alsoinclude credits of $12 million from the effect of changing commodity prices on LIFO inventory valuations, $17million from the sale of long-lived assets, $46 million related to Brazilian transactional tax credits, and $40 millionrelated to realized securities gains.
Analysis of Statements of Earnings
Net sales and other operating income increased 20% to $44.0 billion due primarily to increased selling prices ofagricultural commodities, oilseed and corn processing products and, to a lesser extent, increased sales volumes ofagricultural commodities and oilseed processing products. In addition, net sales and other operating incomeincreased $916 million, or 3%, due to currency exchange rate fluctuations.
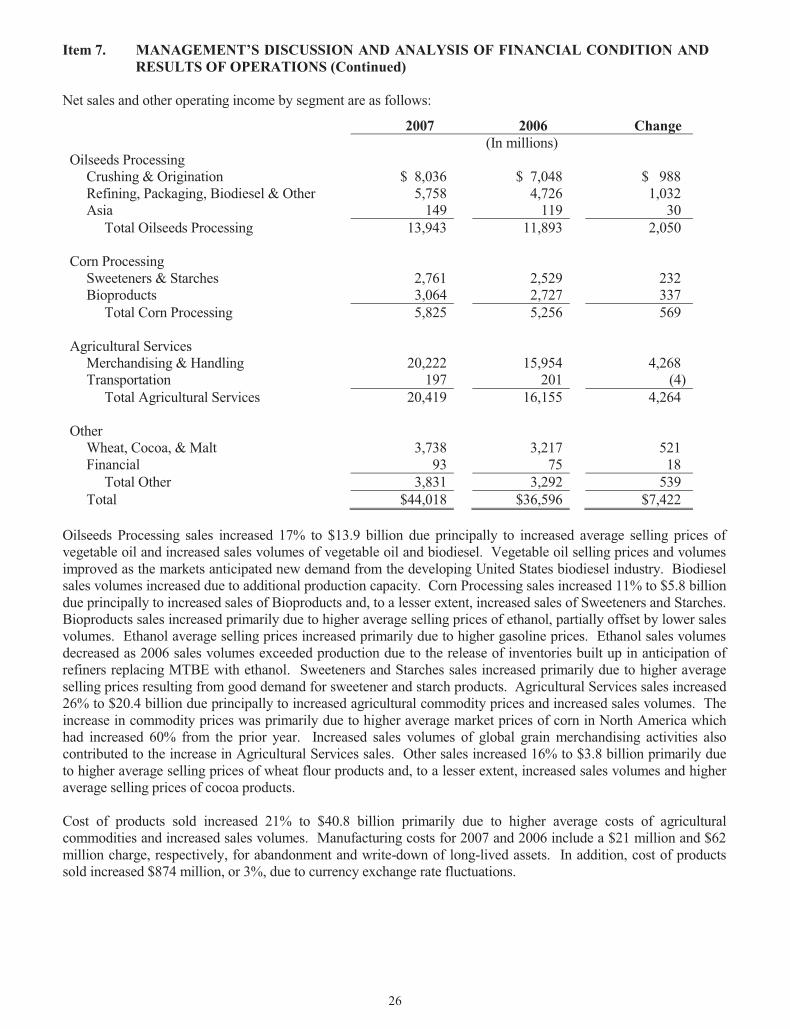
26
Item 7. MANAGEMENT’S DISCUSSION AND ANALYSIS OF FINANCIAL CONDITION ANDRESULTS OF OPERATIONS (Continued)
Net sales and other operating income by segment are as follows:
2007 2006 Change(In millions)
Oilseeds ProcessingCrushing & Origination $ 8,036 $ 7,048 $ 988Refining, Packaging, Biodiesel & Other 5,758 4,726 1,032Asia 149 119 30
Total Oilseeds Processing 13,943 11,893 2,050
Corn ProcessingSweeteners & Starches 2,761 2,529 232Bioproducts 3,064 2,727 337
Total Corn Processing 5,825 5,256 569
Agricultural ServicesMerchandising & Handling 20,222 15,954 4,268Transportation 197 201 (4)
Total Agricultural Services 20,419 16,155 4,264
OtherWheat, Cocoa, & Malt 3,738 3,217 521Financial 93 75 18
Total Other 3,831 3,292 539Total $44,018 $36,596 $7,422
Oilseeds Processing sales increased 17% to $13.9 billion due principally to increased average selling prices ofvegetable oil and increased sales volumes of vegetable oil and biodiesel. Vegetable oil selling prices and volumesimproved as the markets anticipated new demand from the developing United States biodiesel industry. Biodieselsales volumes increased due to additional production capacity. Corn Processing sales increased 11% to $5.8 billiondue principally to increased sales of Bioproducts and, to a lesser extent, increased sales of Sweeteners and Starches.Bioproducts sales increased primarily due to higher average selling prices of ethanol, partially offset by lower salesvolumes. Ethanol average selling prices increased primarily due to higher gasoline prices. Ethanol sales volumesdecreased as 2006 sales volumes exceeded production due to the release of inventories built up in anticipation ofrefiners replacing MTBE with ethanol. Sweeteners and Starches sales increased primarily due to higher averageselling prices resulting from good demand for sweetener and starch products. Agricultural Services sales increased26% to $20.4 billion due principally to increased agricultural commodity prices and increased sales volumes. Theincrease in commodity prices was primarily due to higher average market prices of corn in North America whichhad increased 60% from the prior year. Increased sales volumes of global grain merchandising activities alsocontributed to the increase in Agricultural Services sales. Other sales increased 16% to $3.8 billion primarily dueto higher average selling prices of wheat flour products and, to a lesser extent, increased sales volumes and higheraverage selling prices of cocoa products.
Cost of products sold increased 21% to $40.8 billion primarily due to higher average costs of agriculturalcommodities and increased sales volumes. Manufacturing costs for 2007 and 2006 include a $21 million and $62million charge, respectively, for abandonment and write-down of long-lived assets. In addition, cost of productssold increased $874 million, or 3%, due to currency exchange rate fluctuations.
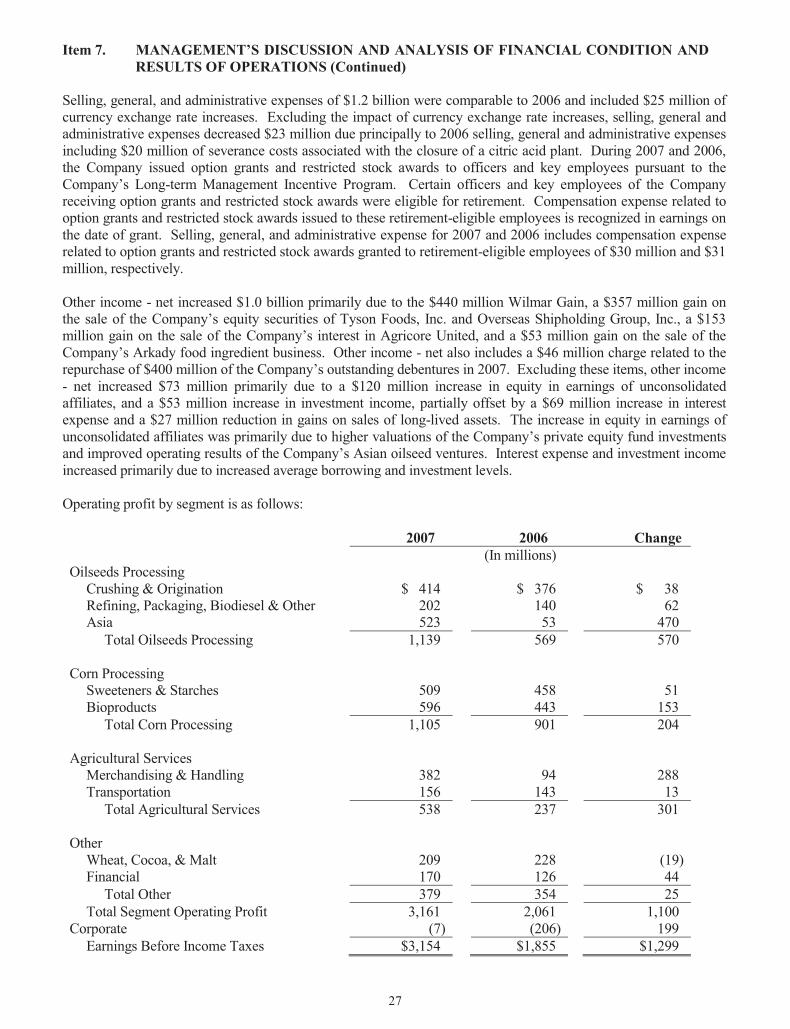
27
Item 7. MANAGEMENT’S DISCUSSION AND ANALYSIS OF FINANCIAL CONDITION ANDRESULTS OF OPERATIONS (Continued)
Selling, general, and administrative expenses of $1.2 billion were comparable to 2006 and included $25 million ofcurrency exchange rate increases. Excluding the impact of currency exchange rate increases, selling, general andadministrative expenses decreased $23 million due principally to 2006 selling, general and administrative expensesincluding $20 million of severance costs associated with the closure of a citric acid plant. During 2007 and 2006,the Company issued option grants and restricted stock awards to officers and key employees pursuant to theCompany’s Long-term Management Incentive Program. Certain officers and key employees of the Companyreceiving option grants and restricted stock awards were eligible for retirement. Compensation expense related tooption grants and restricted stock awards issued to these retirement-eligible employees is recognized in earnings onthe date of grant. Selling, general, and administrative expense for 2007 and 2006 includes compensation expenserelated to option grants and restricted stock awards granted to retirement-eligible employees of $30 million and $31million, respectively.
Other income - net increased $1.0 billion primarily due to the $440 million Wilmar Gain, a $357 million gain onthe sale of the Company’s equity securities of Tyson Foods, Inc. and Overseas Shipholding Group, Inc., a $153million gain on the sale of the Company’s interest in Agricore United, and a $53 million gain on the sale of theCompany’s Arkady food ingredient business. Other income - net also includes a $46 million charge related to therepurchase of $400 million of the Company’s outstanding debentures in 2007. Excluding these items, other income- net increased $73 million primarily due to a $120 million increase in equity in earnings of unconsolidatedaffiliates, and a $53 million increase in investment income, partially offset by a $69 million increase in interestexpense and a $27 million reduction in gains on sales of long-lived assets. The increase in equity in earnings ofunconsolidated affiliates was primarily due to higher valuations of the Company’s private equity fund investmentsand improved operating results of the Company’s Asian oilseed ventures. Interest expense and investment incomeincreased primarily due to increased average borrowing and investment levels.
Operating profit by segment is as follows:
2007 2006 Change(In millions)
Oilseeds ProcessingCrushing & Origination $ 414 $ 376 $ 38Refining, Packaging, Biodiesel & Other 202 140 62Asia 523 53 470
Total Oilseeds Processing 1,139 569 570
Corn ProcessingSweeteners & Starches 509 458 51Bioproducts 596 443 153
Total Corn Processing 1,105 901 204
Agricultural ServicesMerchandising & Handling 382 94 288Transportation 156 143 13
Total Agricultural Services 538 237 301
OtherWheat, Cocoa, & Malt 209 228 (19)Financial 170 126 44
Total Other 379 354 25Total Segment Operating Profit 3,161 2,061 1,100
Corporate (7) (206) 199Earnings Before Income Taxes $3,154 $1,855 $1,299

28
Item 7. MANAGEMENT’S DISCUSSION AND ANALYSIS OF FINANCIAL CONDITION ANDRESULTS OF OPERATIONS (Continued)
Oilseeds Processing operating profits increased $570 million to $1.1 billion due principally to the $440 millionWilmar Gain and improved market conditions in all geographic regions. North American processing resultsimproved due principally to abundant oilseed supplies in the United States and good demand for vegetable oil andsoybean meal. Vegetable oil values improved as the markets anticipated new demand from the developing UnitedStates biodiesel industry. North American processing results were also favorably impacted by lower plantoperating costs resulting from improved capacity utilization. Asian joint venture results improved due to improvedpalm processing operating results partially offset by decreased soy crushing operating results. European processingresults improved due principally to abundant oilseed supplies in Europe and strong demand for vegetable oil. Thestrong demand for vegetable oil is the result of strong biodiesel demand. These increases were partially offset bydecreased biodiesel operating profits resulting from higher vegetable oil prices, increased market productioncapacity, and lower diesel fuel prices. South American processing results declined due principally to the $27million credit for Brazilian transactional taxes in 2006. Excluding the impact of the credit for Braziliantransactional taxes, South American processing results improved due principally to increased fertilizer margins.The improvement in fertilizer margins was primarily due to higher average sales prices due to improved fertilizerdemand combined with stable raw material costs. Operating profits for 2007 include a $6 million charge forabandonment and write-down of long-lived assets. Operating profits for 2006 include a $14 million charge forabandonment and write-down of long-lived assets and a $6 million charge related to the adoption of FIN 47.
Corn Processing operating profits increased $204 million to $1.1 billion due principally to higher average sellingprices and lower energy costs, partially offset by lower ethanol sales volumes and higher net corn costs. Net corncosts increased approximately 60% during 2007 due to significant anticipated demand increases for corn resultingprimarily from increasing corn-derived ethanol industry capacity. Agricultural commodity market concernsregarding the expected decline in the ending 2006 corn crop carryover also contributed to the increase in corn costs.Sweeteners and Starches operating profits increased $51 million primarily due to higher average sales prices andlower energy costs. Sales prices increased due principally to good demand for sweetener and starch products.These increases were partially offset by increased net corn costs. Sweeteners and Starches operating profits for2006 include a $5 million charge related to the adoption of FIN 47. Bioproducts operating profits increased $153million primarily due to higher ethanol average selling prices and lower energy costs, partially offset by increasednet corn costs and lower ethanol sales volumes. Ethanol average sales prices increased due principally to strongdemand from gasoline refiners and higher gasoline prices. Ethanol sales volumes decreased as 2006 sales volumesexceeded production due to the release of inventories built up in anticipation of refiners replacing MTBE withethanol. Bioproducts operating results for 2007 include a $1 million charge for abandonment and write-down oflong-lived assets. Bioproducts operating results for 2006 include a $6 million charge for abandonment and write-down of long-lived assets, a $2 million charge related to the adoption of FIN 47, and $6 million of costs related tothe closure of a citric acid plant.
Agricultural Services operating profits increased $301 million to $538 million due principally to a $153 milliongain from the sale of the Company’s interest in Agricore United, a Canadian business which specialized in cropinput, crop protection services, and grain marketing and merchandising. Excluding the Agricore United gain,Agricultural Services operating profits increased $148 million to $385 million due principally to improved globalgrain merchandising operating results and, to a lesser extent, improved transportation and North Americanorigination operating results. Global grain merchandising results improved as regional production imbalancesallowed the Company to capitalize on merchandising opportunities. North American river transportation operatingresults increased primarily due to increased barge freight rates created by strong demand for barge capacity. NorthAmerican origination operating results improved due to good export demand for agricultural commodities andhigher ocean freight rates. Agricultural Services operating profits for 2007 include a $12 million trade disruptioninsurance recovery related to Hurricane Katrina.
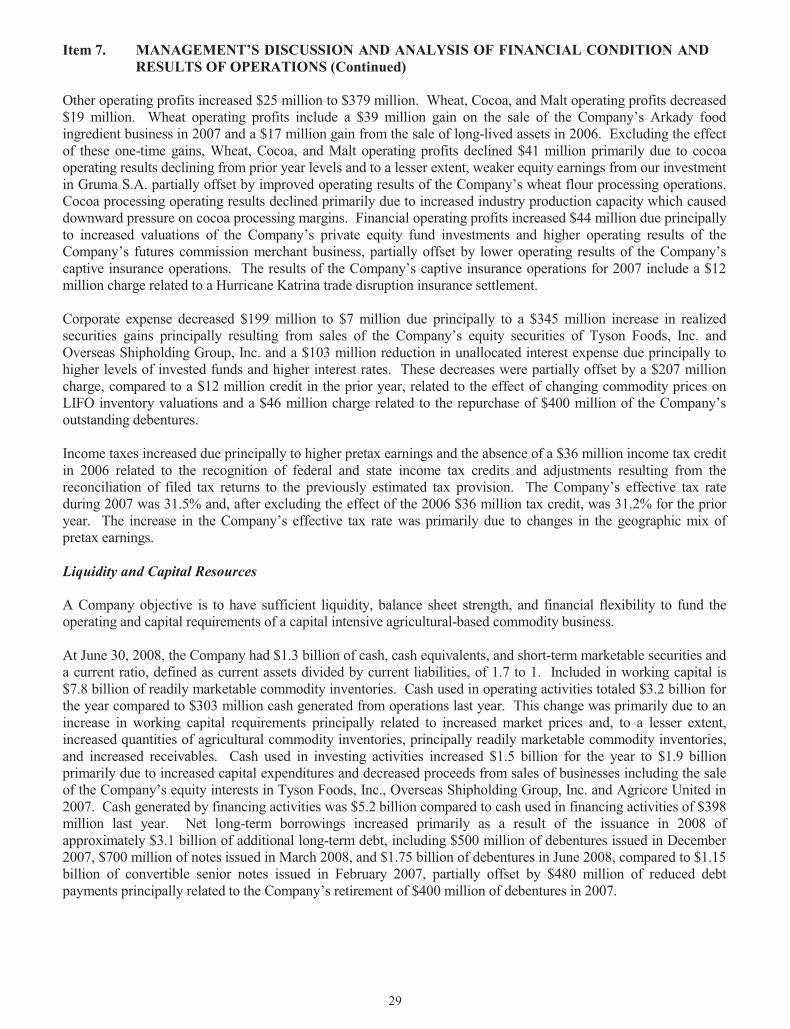
29
Item 7. MANAGEMENT’S DISCUSSION AND ANALYSIS OF FINANCIAL CONDITION ANDRESULTS OF OPERATIONS (Continued)
Other operating profits increased $25 million to $379 million. Wheat, Cocoa, and Malt operating profits decreased$19 million. Wheat operating profits include a $39 million gain on the sale of the Company’s Arkady foodingredient business in 2007 and a $17 million gain from the sale of long-lived assets in 2006. Excluding the effectof these one-time gains, Wheat, Cocoa, and Malt operating profits declined $41 million primarily due to cocoaoperating results declining from prior year levels and to a lesser extent, weaker equity earnings from our investmentin Gruma S.A. partially offset by improved operating results of the Company’s wheat flour processing operations.Cocoa processing operating results declined primarily due to increased industry production capacity which causeddownward pressure on cocoa processing margins. Financial operating profits increased $44 million due principallyto increased valuations of the Company’s private equity fund investments and higher operating results of theCompany’s futures commission merchant business, partially offset by lower operating results of the Company’scaptive insurance operations. The results of the Company’s captive insurance operations for 2007 include a $12million charge related to a Hurricane Katrina trade disruption insurance settlement.
Corporate expense decreased $199 million to $7 million due principally to a $345 million increase in realizedsecurities gains principally resulting from sales of the Company’s equity securities of Tyson Foods, Inc. andOverseas Shipholding Group, Inc. and a $103 million reduction in unallocated interest expense due principally tohigher levels of invested funds and higher interest rates. These decreases were partially offset by a $207 millioncharge, compared to a $12 million credit in the prior year, related to the effect of changing commodity prices onLIFO inventory valuations and a $46 million charge related to the repurchase of $400 million of the Company’soutstanding debentures.
Income taxes increased due principally to higher pretax earnings and the absence of a $36 million income tax creditin 2006 related to the recognition of federal and state income tax credits and adjustments resulting from thereconciliation of filed tax returns to the previously estimated tax provision. The Company’s effective tax rateduring 2007 was 31.5% and, after excluding the effect of the 2006 $36 million tax credit, was 31.2% for the prioryear. The increase in the Company’s effective tax rate was primarily due to changes in the geographic mix ofpretax earnings.
Liquidity and Capital Resources
A Company objective is to have sufficient liquidity, balance sheet strength, and financial flexibility to fund theoperating and capital requirements of a capital intensive agricultural-based commodity business.
At June 30, 2008, the Company had $1.3 billion of cash, cash equivalents, and short-term marketable securities anda current ratio, defined as current assets divided by current liabilities, of 1.7 to 1. Included in working capital is$7.8 billion of readily marketable commodity inventories. Cash used in operating activities totaled $3.2 billion forthe year compared to $303 million cash generated from operations last year. This change was primarily due to anincrease in working capital requirements principally related to increased market prices and, to a lesser extent,increased quantities of agricultural commodity inventories, principally readily marketable commodity inventories,and increased receivables. Cash used in investing activities increased $1.5 billion for the year to $1.9 billionprimarily due to increased capital expenditures and decreased proceeds from sales of businesses including the saleof the Company’s equity interests in Tyson Foods, Inc., Overseas Shipholding Group, Inc. and Agricore United in2007. Cash generated by financing activities was $5.2 billion compared to cash used in financing activities of $398million last year. Net long-term borrowings increased primarily as a result of the issuance in 2008 ofapproximately $3.1 billion of additional long-term debt, including $500 million of debentures issued in December2007, $700 million of notes issued in March 2008, and $1.75 billion of debentures in June 2008, compared to $1.15billion of convertible senior notes issued in February 2007, partially offset by $480 million of reduced debtpayments principally related to the Company’s retirement of $400 million of debentures in 2007.

30
Item 7. MANAGEMENT’S DISCUSSION AND ANALYSIS OF FINANCIAL CONDITION ANDRESULTS OF OPERATIONS (Continued)
Capital resources were strengthened in 2008 as shown by the increase in the Company’s net worth from $11.3billion to $13.5 billion. The Company’s ratio of long-term debt to total capital (the sum of the Company’s long-term debt and shareholders’ equity) was 36% at June 30, 2008, and 30% at June 30, 2007. This ratio is a measureof the Company’s long-term liquidity and is an indicator of financial flexibility. The Company currently has $7.4billion of commercial paper and commercial bank lines available to meet seasonal cash requirements of which $5.2billion are committed and $2.2 billion are uncommitted. At June 30, 2008, the Company had $3.1 billion of short-term debt outstanding. Standard & Poor’s, Moody’s, and Fitch rate the Company’s commercial paper as A-1, P-1,and F1, respectively, and rate the Company’s long-term debt as A, A2, and A, respectively. In addition to the cashflow generated from operations, the Company has access to equity and debt capital through numerous alternativesfrom public and private sources in domestic and international markets.
The Company has outstanding $1.15 billion principal amount of convertible senior notes. As of June 30, 2008,none of the conditions permitting conversion of the notes had been satisfied. As of June 30, 2008, the market priceof the Company’s common stock was not greater than the exercise price of the purchased call options or warrantsrelated to the convertible senior notes.
In June 2008, the Company issued $1.75 billion of debentures as a component of Equity Units. The Equity Unitsare a combination of (a) debt and (b) forward contracts for the holder to purchase the Company’s common stock.The purchase contracts obligate the holder to purchase from the Company, no later than June 1, 2011, for a price of$50 in cash, a certain number of shares, ranging from 1.0453 shares to 1.2544 shares, of the Company’s commonstock, based on a formula established in the contract.
Contractual Obligations and Off-Balance Sheet Arrangements
In the normal course of business, the Company enters into contracts and commitments which obligate the Companyto make payments in the future. The following table sets forth the Company’s significant future obligations by timeperiod. Purchases include commodity-based contracts entered into in the normal course of business, which arefurther described in Item 7A, “Quantitative and Qualitative Disclosures About Market Risk,” energy-relatedpurchase contracts entered into in the normal course of business, and other purchase obligations related to theCompany’s normal business activities. Where applicable, information included in the Company’s consolidatedfinancial statements and notes is cross-referenced in this table.

31
Item 7. MANAGEMENT’S DISCUSSION AND ANALYSIS OF FINANCIAL CONDITION ANDRESULTS OF OPERATIONS (Continued)
Payments Due by Period
Contractual Note Less than 1 - 3 3 – 5 More thanObligations Reference Total 1 Year Years Years 5 Years
(In millions)Purchases
Inventories $ 24,230 $ 22,813 $ 1,200 $ 174 $ 43Energy 952 502 302 80 68Other 148 58 60 18 12
Total purchases 25,330 23,373 1,562 272 123
Short-term debt Note 7 3,123 3,123 – – –Long-term debt Note 7 7,993 232 358 380 7,023Estimated interest payments 9,639 511 808 758 7,562Operating leases Note 12 1,364 403 402 239 320Estimated pension and otherpostretirement plancontributions Note 13 1,217 90 204 229 694
Total $ 48,666 $ 27,732 $ 3,334 $ 1,878 $ 15,722
At June 30, 2008, the Company estimates it will spend approximately $2.5 billion over the next five years tocomplete currently approved capital projects and acquisitions which is not included in the table above. TheCompany is a limited partner in various private equity funds which invest primarily in emerging markets. At June30, 2008, the Company’s carrying value of these limited partnership investments was $129 million. The Companyhas future capital commitments related to these partnerships of $137 million and expects the majority of theseadditional capital commitments, if called for, to be funded by cash flows generated by the partnerships. TheCompany also has outstanding letters of credit and surety bonds of $500 million at June 30, 2008.
In addition, the Company has entered into agreements, primarily debt guarantee agreements related to equity-method investees, which could obligate the Company to make future payments. The Company’s liability underthese agreements arises only if the primary entity fails to perform its contractual obligation. The Company hascollateral for a portion of these contingent obligations. At June 30, 2008, these contingent obligations totaledapproximately $135 million. Amounts outstanding for the primary entity under these contingent obligations were$62 million at June 30, 2008.
Critical Accounting Policies
The process of preparing financial statements requires management to make estimates and judgments that affect thecarrying values of the Company’s assets and liabilities as well as the recognition of revenues and expenses. Theseestimates and judgments are based on the Company’s historical experience and management’s knowledge andunderstanding of current facts and circumstances. Certain of the Company’s accounting policies are consideredcritical, as these policies are important to the depiction of the Company’s financial statements and requiresignificant or complex judgment by management. Management has discussed with the Company’s AuditCommittee the development, selection, disclosure, and application of these critical accounting policies. Followingare the accounting policies management considers critical to the Company’s financial statements.

32
Item 7. MANAGEMENT’S DISCUSSION AND ANALYSIS OF FINANCIAL CONDITION ANDRESULTS OF OPERATIONS (Continued)
Inventories and Derivatives
Certain of the Company’s merchandisable agricultural commodity inventories, forward fixed-price purchase andsale contracts, and exchange-traded futures and exchange-traded and over-the-counter options contracts are valuedat estimated market values. These merchandisable agricultural commodities are freely traded, have quoted marketprices, and may be sold without significant additional processing. Management estimates market value based onexchange-quoted prices, adjusted for differences in local markets. Changes in the market values of theseinventories and contracts are recognized in the statement of earnings as a component of cost of products sold. Ifmanagement used different methods or factors to estimate market value, amounts reported as inventories and costof products sold could differ materially. Additionally, if market conditions change subsequent to year-end,amounts reported in future periods as inventories and cost of products sold could differ materially.
The Company, from time to time, uses derivative contracts designated as cash flow hedges to fix the purchase priceof anticipated volumes of commodities to be purchased and processed in a future month, to fix the purchase priceof the Company’s anticipated natural gas requirements for certain production facilities, and to fix the sales price ofanticipated volumes of ethanol. The change in the market value of such derivative contracts has historically been,and is expected to continue to be, highly effective at offsetting changes in price movements of the hedged item.Gains and losses arising from open and closed hedging transactions are deferred in other comprehensive income,net of applicable income taxes, and recognized as a component of cost of products sold in the statement of earningswhen the hedged item is recognized. If it is determined that the derivative instruments used are no longer effectiveat offsetting changes in the price of the hedged item, then the changes in the market value of these exchange-tradedfutures and exchange-traded and over-the-counter option contracts would be recorded in the statement of earningsas a component of cost of products sold.
Employee Benefit Plans
The Company provides substantially all domestic employees and employees at certain international subsidiarieswith pension benefits. The Company also provides substantially all domestic salaried employees withpostretirement health care and life insurance benefits. In order to measure the expense and funded status of theseemployee benefit plans, management makes several estimates and assumptions, including interest rates used todiscount certain liabilities, rates of return on assets set aside to fund these plans, rates of compensation increases,employee turnover rates, anticipated mortality rates, and anticipated future health care costs. These estimates andassumptions are based on the Company’s historical experience combined with management’s knowledge andunderstanding of current facts and circumstances. Management also uses third-party actuaries to assist inmeasuring the expense and funded status of these employee benefit plans. If management used different estimatesand assumptions regarding these plans, the funded status of the plans could vary significantly, and the Companycould recognize different amounts of expense over future periods.
Income Taxes
The Company frequently faces challenges from domestic and foreign tax authorities regarding the amount of taxesdue. These challenges include questions regarding the timing and amount of deductions and the allocation ofincome among various tax jurisdictions. In evaluating the exposure associated with various tax filing positions, theCompany records reserves for estimates of potential additional tax owed by the Company. Deferred tax assetsrepresent items to be used as tax deductions or credits in future tax returns, and the related tax benefit has alreadybeen recognized in the Company’s income statement. Realization of certain deferred tax assets reflects theCompany’s tax planning strategies. Valuation allowances related to these deferred tax assets have been establishedto the extent the realization of the tax benefit is not probable. Based on management’s evaluation of theCompany’s tax position, it is believed the amounts related to these tax exposures are appropriately accrued. To theextent the Company were to favorably resolve matters for which accruals have been established or be required topay amounts in excess of the aforementioned reserves, the Company’s effective tax rate in a given financialstatement period may be impacted.

33
Item 7. MANAGEMENT’S DISCUSSION AND ANALYSIS OF FINANCIAL CONDITION ANDRESULTS OF OPERATIONS (Continued)
Undistributed earnings of the Company’s foreign subsidiaries and affiliated corporate joint ventures accounted foron the equity method are considered to be permanently reinvested, and accordingly, no provision for U.S. incometaxes has been provided thereon. If the Company were to receive distributions from any of these foreignsubsidiaries or affiliates or determine the undistributed earnings of these foreign subsidiaries or affiliates to not bepermanently reinvested, the Company could be subject to U.S. tax liabilities which have not been provided for inthe consolidated financial statements.
Asset Abandonments and Write-Downs
The Company is principally engaged in the business of procuring, transporting, storing, processing, andmerchandising agricultural commodities and products. This business is global in nature and is highly capital-intensive. Both the availability of the Company’s raw materials and the demand for the Company’s finishedproducts are driven by unpredictable factors such as weather, plantings, government programs and policies,changes in global demand resulting from population growth and changes in standards of living, and globalproduction of similar and competitive crops. These aforementioned unpredictable factors, therefore, may cause ashift in the supply/demand dynamics for the Company’s raw materials and finished products. Any such shift willcause management to evaluate the efficiency and profitability of the Company’s asset base in terms of geographiclocation, size, and age of its factories. The Company, from time to time, will also invest in equipment, technology,and companies related to new, value-added products produced from agricultural commodities and products. Thesenew products are not always successful from either a commercial production or marketing perspective.Management evaluates the Company’s property, plant, and equipment for impairment whenever indicators ofimpairment exist. The Company evaluates goodwill and other intangible assets with indefinite lives for impairmentannually. Assets are written down after consideration of the ability to utilize the assets for their intended purpose orto employ the assets in alternative uses or sell the assets to recover the carrying value. If management useddifferent estimates and assumptions in its evaluation of these assets, then the Company could recognize differentamounts of expense over future periods.
Valuation of Marketable Securities and Investments in Affiliates
The Company classifies the majority of its marketable securities as available-for-sale and carries these securities atfair value. Investments in affiliates are carried at cost plus equity in undistributed earnings and are adjusted, whereappropriate, for amortizable basis differences between the investment balance and the underlying net assets of theinvestee. For publicly traded securities, the fair value of the Company’s investments is readily available based onquoted market prices. For non-publicly traded securities, management’s assessment of fair value is based onvaluation methodologies including discounted cash flows and estimates of sales proceeds. In the event of a declinein fair value of an investment below carrying value, management may be required to determine if the decline in fairvalue is other than temporary. In evaluating the nature of a decline in the fair value of an investment, managementconsiders the market conditions, trends of earnings, discounted cash flows, trading volumes, and other keymeasures of the investment as well as the Company’s ability and intent to hold the investment. When such adecline in value is deemed to be other than temporary, an impairment loss is recognized in the current periodoperating results to the extent of the decline. See Notes 3 and 5 to the Company’s consolidated financial statementsfor information regarding the Company’s marketable securities and investments in affiliates. If management useddifferent estimates and assumptions in its evaluation of these marketable securities, then the Company couldrecognize different amounts of expense over future periods.

34
Item 7A. QUANTITATIVE AND QUALITATIVE DISCLOSURES ABOUT MARKET RISK
The market risk inherent in the Company’s market risk sensitive instruments and positions is the potential lossarising from adverse changes in: commodity market prices as they relate to the Company’s net commodity position,foreign currency exchange rates, and interest rates as described below.
Commodities
The availability and price of agricultural commodities are subject to wide fluctuations due to unpredictable factorssuch as weather, plantings, government programs and policies, changes in global demand resulting from populationgrowth and changes in standards of living, and global production of similar and competitive crops.
To reduce price risk caused by market fluctuations, the Company generally follows a policy of using exchange-traded futures and exchange-traded and over-the-counter options contracts to minimize its net position ofmerchandisable agricultural commodity inventories and forward cash purchase and sales contracts. The Companywill also use exchange-traded futures and exchange-traded and over-the-counter options contracts as components ofmerchandising strategies designed to enhance margins. The results of these strategies can be significantly impactedby factors such as the volatility of the relationship between the value of exchange-traded commodities futurescontracts and the cash prices of the underlying commodities, counterparty contracts defaults, and volatility offreight markets. In addition, the Company from time-to-time enters into derivative contracts which are designatedas hedges of specific volumes of commodities that will be purchased and processed, or sold, in a future month. Thechanges in the market value of such futures contracts have historically been, and are expected to continue to be,highly effective at offsetting changes in price movements of the hedged item. Gains and losses arising from openand closed hedging transactions are deferred in other comprehensive income, net of applicable taxes, andrecognized as a component of cost of products sold in the statement of earnings when the hedged item isrecognized.
A sensitivity analysis has been prepared to estimate the Company’s exposure to market risk of its daily netcommodity position. The Company’s daily net commodity position consists of merchandisable agriculturalcommodity inventories, related purchase and sale contracts, and exchange-traded futures and exchange-traded andover-the-counter option contracts, including those contracts used to hedge portions of production requirements. Thefair value of such daily net commodity position is a summation of the fair values calculated for each commodity byvaluing each net position at quoted futures prices. Market risk is estimated as the potential loss in fair valueresulting from a hypothetical 10% adverse change in such prices. Actual results may differ.
2008 2007Long/(Short) Fair Value Market Risk Fair Value Market Risk
(In millions)Highest position $ 1,260 $ 126 $ 703 $ 70Lowest position (915) (92) (565) (57)Average position 251 25 180 18
The change in fair value of the average position for 2008 compared to 2007 was principally a result of increases incommodity prices and, to a lesser extent, quantities underlying the daily net commodity position.
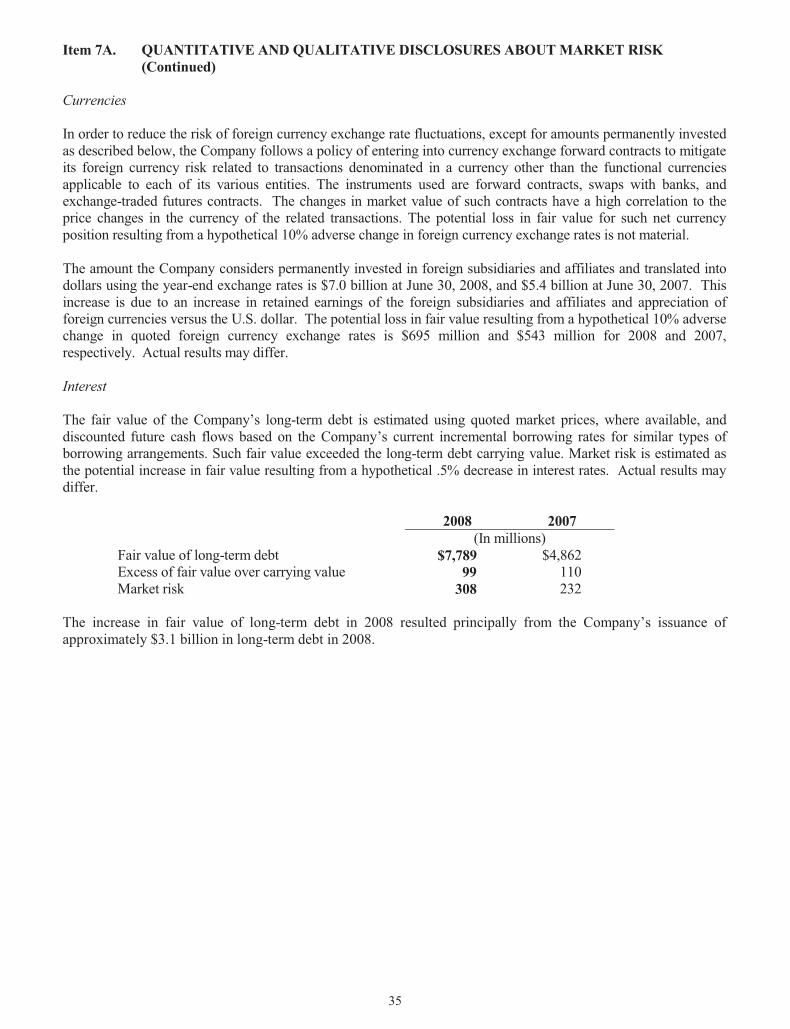
35
Item 7A. QUANTITATIVE AND QUALITATIVE DISCLOSURES ABOUT MARKET RISK(Continued)
Currencies
In order to reduce the risk of foreign currency exchange rate fluctuations, except for amounts permanently investedas described below, the Company follows a policy of entering into currency exchange forward contracts to mitigateits foreign currency risk related to transactions denominated in a currency other than the functional currenciesapplicable to each of its various entities. The instruments used are forward contracts, swaps with banks, andexchange-traded futures contracts. The changes in market value of such contracts have a high correlation to theprice changes in the currency of the related transactions. The potential loss in fair value for such net currencyposition resulting from a hypothetical 10% adverse change in foreign currency exchange rates is not material.
The amount the Company considers permanently invested in foreign subsidiaries and affiliates and translated intodollars using the year-end exchange rates is $7.0 billion at June 30, 2008, and $5.4 billion at June 30, 2007. Thisincrease is due to an increase in retained earnings of the foreign subsidiaries and affiliates and appreciation offoreign currencies versus the U.S. dollar. The potential loss in fair value resulting from a hypothetical 10% adversechange in quoted foreign currency exchange rates is $695 million and $543 million for 2008 and 2007,respectively. Actual results may differ.
Interest
The fair value of the Company’s long-term debt is estimated using quoted market prices, where available, anddiscounted future cash flows based on the Company’s current incremental borrowing rates for similar types ofborrowing arrangements. Such fair value exceeded the long-term debt carrying value. Market risk is estimated asthe potential increase in fair value resulting from a hypothetical .5% decrease in interest rates. Actual results maydiffer.
2008 2007(In millions)
Fair value of long-term debt $7,789 $4,862Excess of fair value over carrying value 99 110Market risk 308 232
The increase in fair value of long-term debt in 2008 resulted principally from the Company’s issuance ofapproximately $3.1 billion in long-term debt in 2008.

36
Item 8. FINANCIAL STATEMENTS AND SUPPLEMENTARY DATA
Financial Statements Page No.
Consolidated Statements of Earnings 37
Consolidated Balance Sheets 38
Consolidated Statements of Cash Flows 39
Consolidated Statements of Shareholders’ Equity 40
Notes to Consolidated Financial Statements 41
Reports of Independent Registered Public Accounting Firm 73

37
Archer Daniels Midland Company
Consolidated Statements of Earnings
Year Ended June 302008 2007 2006(In millions, except per share amounts)
Net sales and other operating income $69,816 $44,018 $36,596Cost of products sold 65,974 40,781 33,630
Gross Profit 3,842 3,237 2,966
Selling, general and administrative expenses 1,419 1,195 1,193Other income - net (201) (1,112) (82)
Earnings Before Income Taxes 2,624 3,154 1,855
Income taxes 822 992 543
Net Earnings $ 1,802 $ 2,162 $ 1,312
Average number of shares outstanding – basic 644 651 654
Average number of shares outstanding – diluted 646 656 656
Basic earnings per common share $ 2.80 $ 3.32 $ 2.01
Diluted earnings per common share $ 2.79 $ 3.30 $ 2.00
See notes to consolidated financial statements.

38
Archer Daniels Midland Company
Consolidated Balance Sheets
June 302008 2007
(In millions)AssetsCurrent Assets
Cash and cash equivalents $ 810 $ 663Short-term marketable securities 455 212Segregated cash and investments 2,035 1,424Receivables 11,483 6,404Inventories 10,160 6,060Other assets 512 359
Total Current Assets 25,455 15,122
Investments and Other AssetsInvestments in and advances to affiliates 2,773 2,498Long-term marketable securities 590 657Goodwill 506 317Other assets 607 514
Total Investments and Other Assets 4,476 3,986
Property, Plant, and EquipmentLand 238 227Buildings 3,207 3,002Machinery and equipment 12,410 11,822Construction in progress 1,924 884
17,779 15,935Accumulated depreciation (10,654) (9,925)
Net Property, Plant, and Equipment 7,125 6,010Total Assets $ 37,056 $25,118
Liabilities and Shareholders’ EquityCurrent Liabilities
Short-term debt $ 3,123 $ 468Accounts payable 6,544 4,919Accrued expenses 4,722 2,416Current maturities of long-term debt 232 65
Total Current Liabilities 14,621 7,868
Long-Term LiabilitiesLong-term debt 7,690 4,752Deferred income taxes 473 532Other 782 713
Total Long-Term Liabilities 8,945 5,997
Shareholders’ EquityCommon stock 5,039 5,090Reinvested earnings 7,494 5,982Accumulated other comprehensive income 957 181
Total Shareholders’ Equity 13,490 11,253Total Liabilities and Shareholders’ Equity $ 37,056 $25,118
See notes to consolidated financial statements.
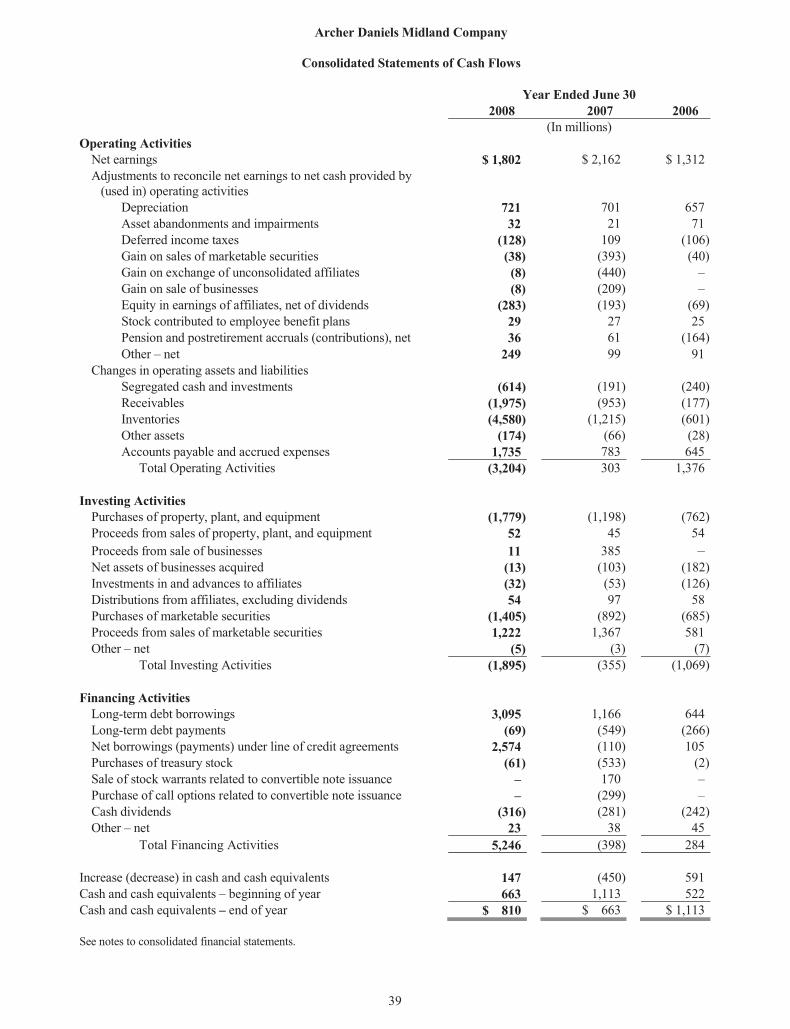
39
Archer Daniels Midland Company
Consolidated Statements of Cash Flows
Year Ended June 302008 2007 2006
(In millions)Operating Activities
Net earnings $ 1,802 $ 2,162 $ 1,312Adjustments to reconcile net earnings to net cash provided by
(used in) operating activitiesDepreciation 721 701 657Asset abandonments and impairments 32 21 71Deferred income taxes (128) 109 (106)Gain on sales of marketable securities (38) (393) (40)Gain on exchange of unconsolidated affiliates (8) (440) –Gain on sale of businesses (8) (209) –Equity in earnings of affiliates, net of dividends (283) (193) (69)Stock contributed to employee benefit plans 29 27 25Pension and postretirement accruals (contributions), net 36 61 (164)Other – net 249 99 91
Changes in operating assets and liabilitiesSegregated cash and investments (614) (191) (240)Receivables (1,975) (953) (177)Inventories (4,580) (1,215) (601)Other assets (174) (66) (28)Accounts payable and accrued expenses 1,735 783 645
Total Operating Activities (3,204) 303 1,376
Investing ActivitiesPurchases of property, plant, and equipment (1,779) (1,198) (762)Proceeds from sales of property, plant, and equipment 52 45 54Proceeds from sale of businesses 11 385 –Net assets of businesses acquired (13) (103) (182)Investments in and advances to affiliates (32) (53) (126)Distributions from affiliates, excluding dividends 54 97 58Purchases of marketable securities (1,405) (892) (685)Proceeds from sales of marketable securities 1,222 1,367 581Other – net (5) (3) (7)
Total Investing Activities (1,895) (355) (1,069)
Financing ActivitiesLong-term debt borrowings 3,095 1,166 644Long-term debt payments (69) (549) (266)Net borrowings (payments) under line of credit agreements 2,574 (110) 105Purchases of treasury stock (61) (533) (2)Sale of stock warrants related to convertible note issuance – 170 –Purchase of call options related to convertible note issuance – (299) –Cash dividends (316) (281) (242)Other – net 23 38 45
Total Financing Activities 5,246 (398) 284
Increase (decrease) in cash and cash equivalents 147 (450) 591Cash and cash equivalents – beginning of year 663 1,113 522Cash and cash equivalents – end of year $ 810 $ 663 $ 1,113
See notes to consolidated financial statements.
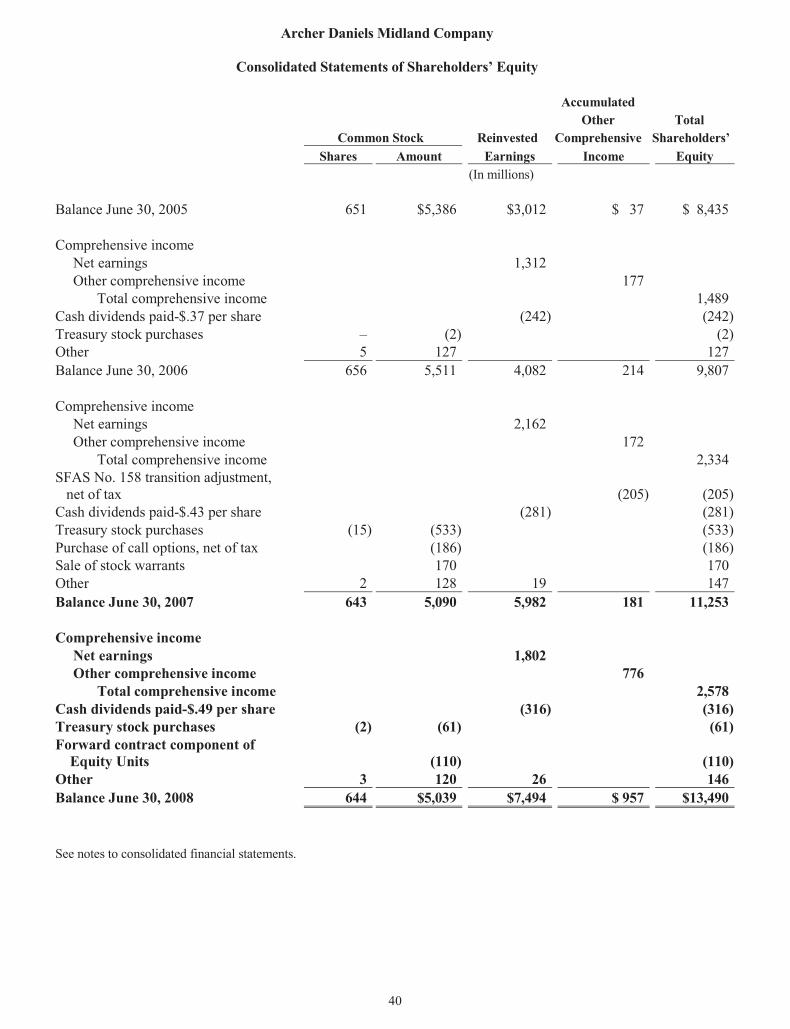
40
Archer Daniels Midland Company
Consolidated Statements of Shareholders’ Equity
AccumulatedOther Total
Common Stock Reinvested Comprehensive Shareholders’Shares Amount Earnings Income Equity
(In millions)
Balance June 30, 2005 651 $5,386 $3,012 $ 37 $ 8,435
Comprehensive incomeNet earnings 1,312Other comprehensive income 177
Total comprehensive income 1,489Cash dividends paid-$.37 per share (242) (242)Treasury stock purchases – (2) (2)Other 5 127 127Balance June 30, 2006 656 5,511 4,082 214 9,807
Comprehensive incomeNet earnings 2,162Other comprehensive income 172
Total comprehensive income 2,334SFAS No. 158 transition adjustment,
net of tax (205) (205)Cash dividends paid-$.43 per share (281) (281)Treasury stock purchases (15) (533) (533)Purchase of call options, net of tax (186) (186)Sale of stock warrants 170 170Other 2 128 19 147Balance June 30, 2007 643 5,090 5,982 181 11,253
Comprehensive incomeNet earnings 1,802Other comprehensive income 776
Total comprehensive income 2,578Cash dividends paid-$.49 per share (316) (316)Treasury stock purchases (2) (61) (61)Forward contract component of
Equity Units (110) (110)Other 3 120 26 146Balance June 30, 2008 644 $5,039 $7,494 $ 957 $13,490
See notes to consolidated financial statements.

41
Archer Daniels Midland Company
Notes to Consolidated Financial Statements
Note 1. Summary of Significant Accounting Policies
Nature of Business
The Company is principally engaged in procuring, transporting, storing, processing, and merchandising agriculturalcommodities and products.
Principles of Consolidation
The consolidated financial statements as of June 30, 2008, and for the three years then ended include the accountsof the Company and its majority-owned subsidiaries. All significant intercompany accounts and transactions havebeen eliminated. Investments in affiliates are carried at cost plus equity in undistributed earnings since acquisitionand are adjusted, where appropriate, for amortizable basis differences between the investment balance and theunderlying net assets of the investee. Certain majority-owned subsidiaries whose fiscal periods differ from theCompany’s are consolidated using the most recent available financial statements which in each case are within 93days of the Company’s year end and are consistent from period to period
The Company evaluates and consolidates where appropriate its less than majority-owned investments pursuant toFinancial Accounting Standards Board (FASB) Interpretation No. 46, Consolidation of Variable Interest Entities,an Interpretation of Accounting Research Bulletin No. 51 (FIN 46). A variable interest entity (VIE) is acorporation, partnership, trust, or any other legal structure used for business purposes that does not have equityinvestors with proportionate voting rights or has equity investors that do not provide sufficient financial resourcesfor the entity to support its activities. FIN 46 requires a VIE to be consolidated by a company if that company is theprimary beneficiary of the VIE. The primary beneficiary of a VIE is an entity that is subject to a majority of therisk of loss from the VIE’s activities or entitled to receive a majority of the entity’s residual returns, or both.
Use of Estimates
The preparation of consolidated financial statements in conformity with generally accepted accounting principlesrequires management to make estimates and assumptions that affect amounts reported in its consolidated financialstatements and accompanying notes. Actual results could differ from those estimates.
Cash Equivalents
The Company considers all non-segregated, highly-liquid investments with a maturity of three months or less at thetime of purchase to be cash equivalents.
Segregated Cash and Investments
The Company segregates certain cash and investment balances in accordance with certain regulatory requirements,commodity exchange requirements, and insurance arrangements. These segregated balances represent depositsreceived from customers trading in exchange-traded commodity instruments, securities pledged to commodityexchange clearinghouses, and cash and securities pledged as security under certain insurance arrangements.Segregated cash and investments primarily consist of cash, United States government securities, and money-marketfunds.
Receivables
The Company records trade accounts receivable at net realizable value. This value includes an appropriateallowance for estimated uncollectible accounts, $89 million and $69 million at June 30, 2008 and 2007,respectively, to reflect any loss anticipated on the trade accounts receivable balances. The Company calculates thisallowance based on its history of write-offs, level of past-due accounts, and its relationships with, and the economicstatus of, its customers.

42
Archer Daniels Midland Company
Notes to Consolidated Financial Statements (Continued)
Note 1. Summary of Significant Accounting Policies (Continued)
Credit risk on trade receivables is minimized as a result of the large and diversified nature of the Company’sworldwide customer base. The Company controls its exposure to credit risk through credit approvals, credit limits,and monitoring procedures. Collateral is generally not required for the Company’s trade receivables. Tradeaccounts receivable due from unconsolidated affiliates as of June 30, 2008 and 2007 was $199 million and $260million, respectively.
Inventories
Inventories of certain merchandisable agricultural commodities, which include amounts acquired under deferredpricing contracts, are stated at market value. In addition, the Company values certain inventories using the lower ofcost, determined by either the first-in, first-out (FIFO) or last-in, first-out (LIFO) methods, or market.
Marketable Securities
The Company classifies its marketable securities as available-for-sale, except for certain designated securitieswhich are classified as trading securities. Available-for-sale securities are carried at fair value, with the unrealizedgains and losses, net of income taxes, reported as a component of other comprehensive income. Unrealized gainsand losses related to trading securities are included in income on a current basis. The Company uses the specificidentification method when securities are sold or reclassified out of accumulated other comprehensive income intoearnings. The Company considers marketable securities maturing in less than one year as short-term. All othermarketable securities are classified as long-term.
Property, Plant, and Equipment
Property, plant, and equipment is recorded at cost. Repair and maintenance costs are expensed as incurred. TheCompany generally uses the straight-line method in computing depreciation for financial reporting purposes andgenerally uses accelerated methods for income tax purposes. The annual provisions for depreciation have beencomputed principally in accordance with the following ranges of asset lives: buildings - 10 to 40 years; machineryand equipment - 3 to 30 years.
Asset Abandonments and Write-Downs
The Company recorded a $32 million, a $21 million, and a $71 million charge in cost of products sold during 2008,2007, and 2006, respectively, principally related to the abandonment and write-down of certain long-lived assets.The majority of these assets were idle or related to underperforming product lines, and the decision to abandon orwrite-down was finalized after consideration of the ability to utilize the assets for their intended purpose, employthe assets in alternative uses, or sell the assets to recover the carrying value. After the write-downs, the carryingvalue of these assets is immaterial.
Net Sales
The Company follows a policy of recognizing sales revenue at the time of delivery of the product and when all ofthe following have occurred: a sales agreement is in place, pricing is fixed or determinable, and collection isreasonably assured. Freight costs and handling charges related to sales are recorded as a component of cost ofproducts sold. Net sales to unconsolidated affiliates during 2008, 2007, and 2006 were $6.8 billion, $3.7 billion,and $3.1 billion, respectively.

43
Archer Daniels Midland Company
Notes to Consolidated Financial Statements (Continued)
Note 1. Summary of Significant Accounting Policies (Continued)
Stock Compensation
The Company adopted the fair value recognition provisions of Statement of Financial Accounting Standards(SFAS) No. 123(R), Share-Based Payment (SFAS 123 (R)), using the modified prospective transition method.Under the modified prospective transition method, compensation expense includes: (a) compensation expense forall share-based payments granted prior to, but not yet vested as of July 1, 2005, based on the grant date fair valueestimated in accordance with the original provisions of SFAS No. 123; and (b) compensation expense for all share-based payments granted subsequent to July 1, 2005, based on the grant date fair value estimated in accordance withthe provisions of SFAS No. 123(R). The Company recognizes expense for its share-based compensation based onthe fair value of the awards that are granted. The fair value of stock options is estimated at the date of grant usingthe Black-Scholes option valuation model which requires the input of highly subjective assumptions. Measuredcompensation cost, net of estimated forfeitures, is recognized ratably over the vesting period of the related share-based compensation award.
Research and Development
Costs associated with research and development are expensed as incurred. Such costs incurred were $49 million,$45 million, and $45 million for the years ended June 30, 2008, 2007, and 2006, respectively.
Per Share Data
Basic earnings per common share are determined by dividing net earnings by the weighted average number ofcommon shares outstanding. In computing diluted earnings per share, the weighted average number of commonshares outstanding is increased by common stock options outstanding with exercise prices lower than the averagemarket prices of common shares. During 2008, 2007, and 2006, diluted average shares outstanding includedincremental shares related to outstanding common stock options of 2 million, 5 million, and 2 million, respectively.
New Accounting Standards
During July 2006, the FASB issued Interpretation No. 48, Accounting for Uncertainty in Income Taxes – aninterpretation of FASB Statement No. 109 (FIN 48). FIN 48 clarifies the accounting for income taxes byprescribing the minimum requirements a tax position must meet before being recognized in the financialstatements. In addition, FIN 48 prohibits the use of SFAS No. 5, Accounting for Contingencies, in evaluating therecognition and measurement of uncertain tax positions. The Company adopted FIN 48 on July 1, 2007, and theadoption did not have a material effect on the Company’s financial statements. See Note 11 for furtherinformation.
During September 2006, the FASB issued SFAS No. 157, Fair Value Measurements (SFAS 157). SFAS 157establishes a framework for measuring fair value within generally accepted accounting principles, clarifies thedefinition of fair value within that framework, and expands disclosures about the use of fair value measurements.SFAS 157 does not require any new fair value measurements in generally accepted accounting principles. TheCompany will adopt SFAS 157 for items that are recognized or disclosed at fair value in the financial statements ona recurring basis (at least annually) effective as of July 1, 2008. The Company has not completed its evaluation ofthe impact of adopting SFAS 157 on the Company’s financial statements. The adoption of SFAS 157 may requiremodification of the Company’s fair value measurements and will require expanded disclosures in the notes to theCompany’s consolidated financial statements.

44
Archer Daniels Midland Company
Notes to Consolidated Financial Statements (Continued)
Note 1. Summary of Significant Accounting Policies (Continued)
During February 2007, the FASB issued SFAS No. 159, The Fair Value Option for Financial Assets and FinancialLiabilities (SFAS 159). SFAS 159 allows entities to voluntarily choose, at specified election dates, to measuremany financial assets and financial liabilities at fair value. The election is made on an instrument-by-instrumentbasis and is irrevocable. If the fair value option is elected for an instrument, SFAS 159 specifies that all subsequentchanges in fair value for that instrument shall be reported in earnings. The Company will adopt SFAS 159 on July1, 2008 and does not believe such adoption will have a significant impact on the Company’s financial statements,because the Company does not expect to make any additional fair value measurement elections.
During December 2007, the FASB issued SFAS No. 141(R), Business Combinations (SFAS 141(R)) and SFASNo. 160, Accounting and Reporting of Noncontrolling Interests in Consolidated Financial Statements, anamendment of ARB No. 51 (SFAS 160). SFAS 141(R) replaces SFAS 141, Business Combinations. SFAS 141(R)and SFAS 160 will change the financial accounting and reporting of business combination transactions andnoncontrolling (or minority) interests in consolidated financial statements. SFAS 141(R) requires recognizing, withcertain exceptions, 100 percent of the fair values of assets acquired, liabilities assumed, and noncontrolling interestsin acquisitions of less than a 100 percent controlling interest when the acquisition constitutes a change in control ofthe acquired entity; measuring acquirer shares issued and contingent consideration arrangements in connection witha business combination at fair value on the acquisition date with subsequent changes in fair value reflected inearnings; and expensing as incurred acquisition-related transaction costs. SFAS 160 establishes accounting andreporting standards for the noncontrolling interest in a subsidiary and for the deconsolidation of a subsidiary. Italso amends the consolidation procedures of Accounting Research Bulletin No. 51, Consolidated financialStatements (ARB 51) for consistency with the requirements of SFAS 141(R). The Company will be required toadopt SFAS 141(R) for business combination transactions for which the acquisition date is on or after July 1, 2009.The Company will also be required to adopt SFAS 160 on July 1, 2009. The Company has not yet assessed theimpact of the adoption of these standards on its financial statements.
During March 2008, the FASB issued SFAS No. 161, Disclosures about Derivative Instruments and HedgingActivities – an amendment of FASB Statement No. 133 (SFAS 161). SFAS 161 expands and disaggregates thedisclosure requirements in SFAS No. 133, Accounting for Derivative Instruments and Hedging Activities (SFAS133). The disclosure provisions of SFAS 161 apply to all entities with derivative instruments subject to SFAS 133and also apply to related hedged items, bifurcated derivatives, and nonderivative instruments that are designatedand qualify as hedging instruments. SFAS 161 requires an entity with derivatives to disclose how and why it usesderivative instruments; how derivative instruments and related hedged items are accounted for under SFAS 133;and how derivative instruments and related hedged items affect the entity’s financial position, financialperformance, and cash flows. Entities must provide tabular disclosures of the location, by line item, of amounts ofgains and losses reported in the statement of earnings. The Company will be required to adopt SFAS 161 onJanuary 1, 2009. The adoption of this standard will require expanded disclosure in the notes to the Company’sconsolidated financial statements but will not impact financial results.
During May, 2008, the FASB issued FASB Staff Position (FSP) APB 14-1, Accounting for Convertible DebtInstruments That May Be Settled in Cash upon Conversion (Including Partial Cash Settlement) (FSP APB 14-1).FSP APB 14-1 addresses the accounting for convertible debt securities that, upon conversion, may be settled by theissuer fully or partially in cash. Currently, most forms of convertible debt securities are treated solely as debt.Under the FSP, issuers of convertible debt securities within its scope must separate these securities into twoaccounting components; a debt component, representing the issuer’s contractual obligation to pay principal andinterest; and an equity component, representing the holder’s option to convert the debt security into equity of theissuer or, if the issuer so elects, an equivalent amount of cash. The Company will be required to adopt FSP APB14-1 on July 1, 2009 in connection with its outstanding convertible debt and must apply it retrospectively to all pastperiods presented, even if the instrument has matured, converted, or otherwise been extinguished as of the FSP’seffective date. The Company has not yet assessed the impact of the adoption of this standard on its financialstatements.

45
Archer Daniels Midland Company
Notes to Consolidated Financial Statements (Continued)
Note 1. Summary of Significant Accounting Policies (Continued)
During June 2008, the FASB issued FSP Emerging Issues Task Force (EITF) 03-6-1, Determining WhetherInstruments Granted in Share-Based Payment Transactions Are Participating Securities (FSP EITF03-6-1). FSPEITF 03-6-1 addresses whether instruments granted in share-based payment transactions are participating securitiesprior to vesting and, therefore, need to be included in the earnings allocation in computing Earnings per Share(EPS) under the two-class method. The FSP clarifies that all outstanding unvested share-based payment awards thatcontain rights to nonforfeitable dividends participate in undistributed earnings with common shareholders and areconsidered to be participating securities. As such, the issuing entity is required to apply the two-class method ofcomputing basic and diluted EPS. The Company will be required to adopt FSP EITF 03-6-1 on July 1, 2009 andhas not yet assessed the impact of the adoption of this standard on the Company’s financial statements.
Note 2. Acquisitions
The Company’s 2008, 2007, and 2006 acquisitions were accounted for as purchases in accordance with SFAS No.141, Business Combinations. Accordingly, the tangible assets and liabilities have been adjusted to fair values withthe remainder of the purchase price, if any, recorded as goodwill. The identifiable intangible assets acquired as partof these acquisitions are not material.
2008 Acquisitions
During 2008, the Company acquired six businesses for a total cost of $15 million, satisfied by $2 million inCompany stock and $13 million in cash, and recorded a preliminary allocation to the purchase price related to theseacquisitions. The purchase price allocation resulted in no goodwill. The purchase price of $15 million wasallocated to current assets, property, plant and equipment, and liabilities for $18 million, $10 million, and $13million, respectively.
2007 Acquisitions
During 2007, the Company acquired seven businesses for a total cost of $103 million. One of the acquisitionsresulted in obtaining the remaining outstanding shares of an unconsolidated affiliate where the Company held a50% interest.
The Company recorded goodwill of $5 million related to these acquisitions. The cash purchase price of $103million plus the $100 million carrying value of the previously unconsolidated affiliate was allocated to currentassets, property, plant, and equipment, current liabilities, and debt for $82 million, $206 million, $33 million, and$52 million, respectively.
2006 Acquisitions
During 2006, the Company acquired twelve businesses for a total cost of $182 million. The Company recorded nogoodwill related to these acquisitions.
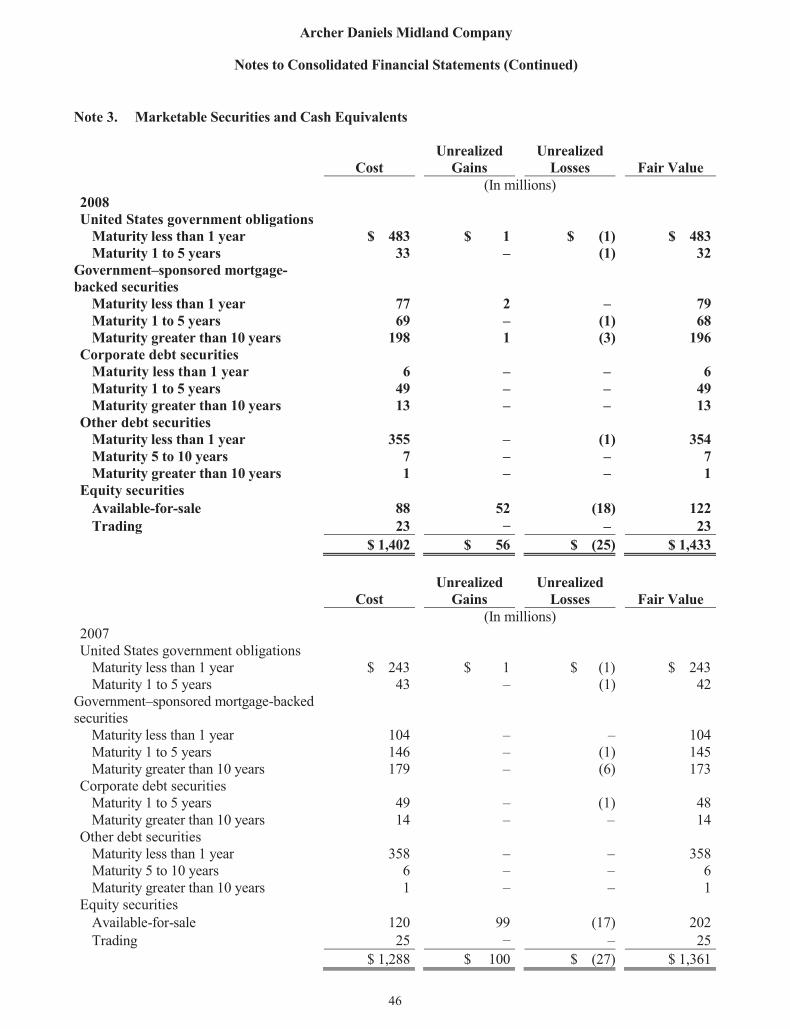
46
Archer Daniels Midland Company
Notes to Consolidated Financial Statements (Continued)
Note 3. Marketable Securities and Cash Equivalents
Unrealized UnrealizedCost Gains Losses Fair Value
(In millions)2008United States government obligations
Maturity less than 1 year $ 483 $ 1 $ (1) $ 483Maturity 1 to 5 years 33 – (1) 32
Government–sponsored mortgage-backed securities
Maturity less than 1 year 77 2 – 79Maturity 1 to 5 years 69 – (1) 68Maturity greater than 10 years 198 1 (3) 196
Corporate debt securitiesMaturity less than 1 year 6 – – 6Maturity 1 to 5 years 49 – – 49Maturity greater than 10 years 13 – – 13
Other debt securitiesMaturity less than 1 year 355 – (1) 354Maturity 5 to 10 years 7 – – 7Maturity greater than 10 years 1 – – 1
Equity securitiesAvailable-for-sale 88 52 (18) 122Trading 23 – – 23
$ 1,402 $ 56 $ (25) $ 1,433
Unrealized UnrealizedCost Gains Losses Fair Value
(In millions)2007United States government obligations
Maturity less than 1 year $ 243 $ 1 $ (1) $ 243Maturity 1 to 5 years 43 – (1) 42
Government–sponsored mortgage-backedsecurities
Maturity less than 1 year 104 – – 104Maturity 1 to 5 years 146 – (1) 145Maturity greater than 10 years 179 – (6) 173
Corporate debt securitiesMaturity 1 to 5 years 49 – (1) 48Maturity greater than 10 years 14 – – 14
Other debt securitiesMaturity less than 1 year 358 – – 358Maturity 5 to 10 years 6 – – 6Maturity greater than 10 years 1 – – 1
Equity securitiesAvailable-for-sale 120 99 (17) 202Trading 25 – – 25
$ 1,288 $ 100 $ (27) $ 1,361
47
Archer Daniels Midland Company
Notes to Consolidated Financial Statements (Continued)
Note 3. Marketable Securities and Cash Equivalents (Continued)
Of the $25 million in unrealized losses at June 30, 2008, $5 million arose within the last 12 months. The market
value of the investments that have been in an unrealized loss position for less than 12 months and for 12 months
and longer is $292 million and $148 million, respectively. The market value of United States government
obligations, government-sponsored mortgage-backed securities, corporate debt securities, and other debt securities
with unrealized losses as of June 30, 2008, is $383 million. The $7 million of unrealized losses associated with
United States government obligations, government-sponsored mortgage-backed securities, and other debt
securities are not considered to be other-than-temporary because their unrealized losses are related to changes in
interest rates and do not affect the expected cash flows to be received upon maturity of these investments or the
credit quality of the issuer. The market value of available-for-sale equity securities with unrealized losses as of
June 30, 2008, is $57 million. The $18 million of unrealized losses associated with these available-for-sale equity
securities are principally related to long-term strategic investments. The Company has the intent and ability to hold
its debt and equity securities for a period of time sufficient to recover all unrealized losses. The Company has not
recognized any other-than-temporary impairments for its debt and equity securities.
Note 4. Inventories and Derivatives
To reduce price risk caused by market fluctuations, the Company generally follows a policy of using exchange-
traded futures and exchange-traded and over-the-counter options contracts to minimize its net position of
merchandisable agricultural commodity inventories and forward cash purchase and sales contracts. The
Company will also use exchange-traded futures and exchange-traded and over-the-counter options contracts as
components of merchandising strategies designed to enhance margins. The results of these strategies can be
significantly impacted by factors such as the volatility of the relationship between the value of exchange-traded
commodities futures contracts and the cash prices of the underlying commodities, counterparty contracts
defaults, and volatility of freight markets. Inventories of certain merchandisable agricultural commodities,
which include amounts acquired under deferred pricing contracts, are stated at market value. Exchange-traded
futures and exchange-traded and over-the-counter options contracts, and forward cash purchase and sales
contracts of certain merchandisable agricultural commodities, none of which are designated as fair value hedges,
are valued at market price. Changes in the market value of inventories of merchandisable agricultural
commodities, forward cash purchase and sales contracts, and exchange-traded futures and exchange-traded and
over-the-counter options contracts are recognized in earnings immediately, resulting in cost of goods sold
approximating first-in, first-out (FIFO) cost. Unrealized gains on forward cash purchase contracts, forward cash
sales contracts, and exchange-traded futures and exchange-traded and over-the-counter options contracts
represent the fair value of such instruments and are classified on the CompanyÕs balance sheet as receivables.
Unrealized losses on forward cash purchase contracts, forward cash sales contracts, and exchange-traded futures
and exchange-traded and over-the-counter options contracts represent the fair value of such instruments and are
classified on the CompanyÕs balance sheet as accounts payable.

48
Archer Daniels Midland Company
Notes to Consolidated Financial Statements (Continued)
Note 4. Inventories and Derivatives (Continued)
The Company also values certain inventories using the lower of cost, determined by either the LIFO or FIFOmethod, or market. During 2008, reductions in certain LIFO inventory quantities resulted in liquidations of apreviously established LIFO cost layer, thereby decreasing the impact of the LIFO valuation reserve adjustment onearnings by $112 million after income tax.
2008 2007(In millions)
LIFO inventoriesFIFO value $ 1,215 $ 786LIFO valuation reserve (784) (215)
LIFO inventories carrying value 431 571FIFO inventories 2,343 1,688Market inventories 7,386 3,801
$ 10,160 $ 6,060
The Company, from time to time, uses futures or options contracts to fix the purchase price of anticipated volumesof commodities to be purchased and processed in a future month. The Company also uses futures, options, andswaps to fix the purchase price of the Company’s anticipated natural gas requirements for certain productionfacilities. In addition, certain of the Company’s ethanol sales contracts are indexed to gasoline prices. TheCompany uses futures and options to fix the sales price of anticipated volumes of these ethanol sales in futuremonths. These derivatives are designated as cash flow hedges. The changes in the market value of such derivativecontracts have historically been, and are expected to continue to be, highly effective at offsetting changes in pricemovements of the hedged item. The amounts representing the ineffectiveness of these cash flow hedges areimmaterial. Gains and losses arising from open and closed hedging transactions are deferred in othercomprehensive income, net of applicable income taxes, and recognized as a component of cost of products sold inthe statement of earnings when the hedged item is recognized. As of June 30, 2008, the Company has recorded $81million of after-tax gains in accumulated other comprehensive income related to gains and losses from cash flowhedge transactions. The Company expects to recognize these after-tax gains in the statement of earningsprincipally during fiscal year 2009.
At June 30, 2008, accumulated other comprehensive income included $5 million of after-tax gains related totreasury-lock agreements. These treasury-lock agreements were designated as cash flow hedges of anticipatedproceeds from the Company’s issuance of debentures in 2005 and 2008. The Company will recognize the $5million of after-tax gain in the statement of earnings over the terms of the debentures. At June 30, 2008,accumulated other comprehensive income also included $4 million of after-tax gains representing theCompany’s share of derivative gains reported by unconsolidated affiliates of the Company.

49
Archer Daniels Midland Company
Notes to Consolidated Financial Statements (Continued)
Note 5. Investments in and Advances to Affiliates
The Company has ownership interests in non-majority-owned affiliates accounted for under the equity method.The Company had 80 and 79 unconsolidated affiliates as of June 30, 2008 and 2007, respectively, located inNorth and South America, Africa, Europe, and Asia. The following table summarizes the combined balancesheets and the combined statements of earnings of the Company’s unconsolidated affiliates as of and for each ofthe three years ended June 30, 2008, 2007, and 2006.
2008 2007 2006(In millions)
Current assets $ 15,111 $ 7,683Non-current assets 17,201 11,156Current liabilities (11,069) (5,758)Non-current liabilities (2,799) (1,975)Minority interests (720) (915)Net assets $ 17,724 $ 10,191
Net sales $ 37,542 $ 25,127 $ 20,304Gross profit 4,575 3,123 2,328Net income 2,503 1,684 793
Undistributed earnings of the Company’s unconsolidated affiliates as of June 30, 2008, are $1.0 billion. Thecompany is a limited partner in various private equity funds which have a carrying value at June 30, 2008 of$129 million. The Company has future capital commitments related to these partnerships of $137 million as ofJune 30, 2008. Two foreign affiliates for which the Company has a carrying value of $1.2 billion have a marketvalue of $1.9 billion based on quoted market prices and exchange rates at June 30, 2008.
The Company provides credit facilities totaling $240 million to two unconsolidated affiliates. One facility is dueon demand and bears interest equal to the monthly average commercial paper rate applicable to the Company’scommercial paper borrowing facility. The second facility has a 90 day term and bears interest at LIBOR plusone. Outstanding advances under these credit facilities are $195 million as of June 30, 2008, and are included inreceivables in the accompanying consolidated balance sheet.
During 2007, the Company sold its 28% ownership interest in Agricore United for cash of $321 million andrecognized a gain of $153 million.
During June 2007, the Company exchanged its ownership interests in eleven Asian joint venture companies forshares of Wilmar International Limited (WIL), a Singapore publicly listed company. In exchange for its ownershipinterests in the joint ventures, the Company received 366 million WIL shares with a fair value of $756 million.Immediately prior to the exchange, the carrying value of the Company’s interests in the joint ventures exchangedfor WIL shares was $231 million. The Company recognized a $286 million after-tax gain in 2007 related to theexchange transaction. The gain represents the difference between the fair value of the WIL shares received and thecarrying value of the Company’s interests in the joint ventures exchanged for WIL shares, less the elimination ofthe portion of the gain representing the Company’s retained direct and indirect ownership interests in WIL. During2008, the Company finalized its accounting for this exchange using the purchase method of accounting. As aresult, the Company reduced its investment in WIL and recorded goodwill of $176 million. The Companyaccounts for its direct and indirect interests in WIL using the equity method of accounting as the Company believesit has the ability to exercise significant influence over the operating and financial policies of WIL.

50
Archer Daniels Midland Company
Notes to Consolidated Financial Statements (Continued)
Note 5. Investments in and Advances to Affiliates (Continued)
As of June 30, 2008, there is one joint venture company subject to the WIL exchange transaction for whichregulatory approval is pending. The Company has not recognized any gain related to the exchange of this jointventure with WIL as of June 30, 2008. The exchange transaction and the related gain for this joint venture will berecognized when, and if, final regulatory approval is obtained.
Note 6. Goodwill
The Company accounts for its goodwill and other intangible assets in accordance with SFAS No. 142, Goodwilland Other Intangible Assets. Under this standard, goodwill and intangible assets deemed to have indefinite livesare not amortized but are subject to annual impairment tests. The Company did not record goodwill impairmentcharges during 2008 and 2007. The carrying value of the Company’s other intangible assets is not material.
Goodwill balances attributable to consolidated businesses and investments in affiliates, by segment, are set forthin the following table.
2008 2007Consolidated Investments Consolidated Investments
Businesses in Affiliates Total Businesses In Affiliates Total(In millions) (In millions)
Oilseeds Processing $ 15 $185 $200 $ 15 $ 9 $ 24Corn Processing 77 7 84 77 7 84Agricultural Services 51 1 52 38 1 39Other 103 67 170 104 66 170Total $246 $260 $506 $234 $83 $317
During 2008, the Company finalized its accounting for the exchange of the Company’s interests in certain Asianjoint ventures for shares in Wilmar International, Ltd. using the purchase method of accounting. As a result, theCompany recorded $176 million of goodwill and reduced investments and advances to affiliates on theCompany’s balance sheet. The $176 million increase in goodwill represents the difference between the pre-adjustment carrying value of the Company’s investment and the Company’s interest in the estimated fair valueof WIL’s net assets at the acquisition date. The other changes in goodwill during 2008 are related to foreigncurrency translation adjustments.

51
Archer Daniels Midland Company
Notes to Consolidated Financial Statements (Continued)
Note 7. Debt and Financing Arrangements
2008 2007(In millions)
4.70% Debentures $1,750 million face amount, due in 2041 $ 1,750 $ –
0.875% Convertible Senior Notes $1,150 million face amount, due in 2014 1,150 1,150
5.45% Notes $700 million face amount, due in 2018 700 –
5.375% Debentures $600 million face amount, due in 2035 586 585
6.45% Debentures $500 million face amount, due in 2038 498 –
5.935% Debentures $500 million face amount, due in 2032 494 494
7.0% Debentures $400 million face amount, due in 2031 398 398
7.5% Debentures $343 million face amount, due in 2027 341 341
6.625% Debentures $298 million face amount, due in 2029 296 296
8.375% Debentures $295 million face amount, due in 2017 292 291
6.95% Debentures $250 million face amount, due in 2097 246 246
7.125% Debentures $243 million face amount, due in 2013 243 243
6.75% Debentures $200 million face amount, due in 2027 197 196
5.87% Debentures $196 million face amount, due in 2010 164 154
8.125% Debentures $103 million face amount, due in 2012 103 103
8.875% Debentures $102 million face amount, due in 2011 102 101
Other 362 219Total long-term debt including current maturities 7,922 4,817Current maturities (232) (65)Total long-term debt $ 7,690 $ 4,752

52
Archer Daniels Midland Company
Notes to Consolidated Financial Statements (Continued)
Note 7. Debt and Financing Arrangements (Continued)
In fiscal year 2008, the Company issued $3.10 billion of additional long-term debt, including $500 million ofdebentures issued in December 2007, $700 million of notes issued in March 2008, and $1.75 billion of debenturesissued in June 2008 (the Debentures).
In connection with the issuance of the debentures in June 2008, the Company issued $1.75 billion of Equity Units.Equity Units are a combination of (a) debt and (b) forward purchase contract for the holder to purchase theCompany’s common stock. The debt and equity instruments are deemed to be separate instruments as the investormay transfer or settle the equity instrument separately from the debt instrument.
The forward purchase contract will obligate the buyer to purchase from the Company, no later than June 1, 2011,for a price of $50 in cash, the following number of shares of the Company’s common stock, subject to anti-dilutionadjustments:
• if the “Applicable Market Value” (AMV) of the Company’s common stock, which is the averageclosing price of the Company’s common stock over the 20-trading day period ending on the thirdtrading day prior to June 1, 2011, equals or exceeds $47.83, 1.0453 shares of the Company’s commonstock;
• if the AMV is less than $47.83, but greater than $39.86, a number of shares of the Company’s commonstock having a value, based on the AMV, equal to $50; and
• if the AMV is less than or equal $39.86, 1.2544 shares of the Company’s common stock.
The Debentures bear interest at a rate of 4.70% per year, payable quarterly and are due June 1, 2041. TheDebentures will be remarketed in three years. If this remarketing is successful, the interest rate on the Debentureswill be reset, and thereafter interest will be payable semi-annually at the reset rate. In addition, following asuccessful remarketing, the Company may modify certain terms of the Debentures including adjusting thefrequency of interest payments, adjusting the ranking of the Debentures or changing the stated maturity. If therehas been no successful remarketing, the interest rate on the Debentures will not be reset, and the holder of eachEquity Unit will have the right to put its interest in the Debentures to the Company on June 1, 2011 at a put priceequal to 100% of its principal amount plus accrued and unpaid interest. The proceeds of the put right will bedeemed to have been applied against the holder’s obligations under the forward purchase contracts.
The Company will also pay the Equity Unit holder quarterly contract adjustment payments at a rate of 1.55% peryear of the stated amount of $50 per Equity Unit, or $0.775 per year. The present value of the future contractadjustment payments of $75 million, which will be paid over the next three years, is recorded as a reduction toshareholders’ equity. The Company also recorded a $35 million decrease in shareholders’ equity for issuance costsrelated to the equity portion of the Equity Units. The remaining issuance costs have been allocated to the debt andwill be recognized in earnings over the life of the debt.
The forward purchase contracts issued in connection with the issuance of the debentures in June 2008, will besettled for the company’s common stock on June 1, 2011. Until settlement of the forward purchase contract, theshares of stock underlying each forward purchase contract are not outstanding. The forward purchase contracts willonly be included in the computation of diluted earnings per share to the extent they are dilutive. As of June 30,2008, the forward purchase contracts were not considered dilutive and therefore not included in the computation ofdiluted earnings per share. Basic earnings per share will not be affected until the forward purchase contracts aresettled and the holders thereof become stockholders.

53
Archer Daniels Midland Company
Notes to Consolidated Financial Statements (Continued)
Note 7. Debt and Financing Arrangements (Continued)
In February 2007, the Company issued $1.15 billion principal amount of convertible senior notes due in 2014 (theNotes) in a private placement. The Notes were issued at par and bear interest at a rate of 0.875% per year, payablesemiannually. The Notes are convertible based on a conversion rate of 22.8423 shares per $1,000 principal amountof Notes (which is equal to a conversion price of approximately $43.78 per share). The Notes may be converted,subject to adjustment, only under the following circumstances: 1) during any calendar quarter beginning afterMarch 31, 2007, if the closing price of the Company’s common stock for at least 20 trading days in the 30consecutive trading days ending on the last trading day of the immediately preceding quarter is more than 140% ofthe applicable conversion price per share, which is $1,000 divided by the then applicable conversion rate, 2) duringthe five consecutive business day period immediately after any five consecutive trading day period (the notemeasurement period) in which the average of the trading price per $1,000 principal amount of Notes was equal toor less than 98% of the average of the product of the closing price of the Company’s common stock and theconversion rate at each date during the note measurement period, 3) if the Company makes specified distributionsto its common stockholders or specified corporate transactions occur, or 4) at any time on or after January 15, 2014,through the business day preceding the maturity date. Upon conversion, a holder would receive an amount in cashequal to the lesser of 1) $1,000 and 2) the conversion value, as defined. If the conversion value exceeds $1,000, theCompany will deliver, at the Company’s election, cash or common stock or a combination of cash and commonstock for the conversion value in excess of $1,000. If the Notes are converted in connection with a change incontrol, as defined, the Company may be required to provide a make-whole premium in the form of an increase inthe conversion rate, subject to a stated maximum amount. In addition, in the event of a change in control, theholders may require the Company to purchase all or a portion of their Notes at a purchase price equal to 100% ofthe principal amount of the Notes, plus accrued and unpaid interest, if any.
Concurrent with the issuance of the Notes, the Company purchased call options in private transactions at a cost of$299 million. The purchased call options allow the Company to receive shares of its common stock and/or cashfrom the counterparties equal to the amounts of common stock and/or cash related to the excess of the currentmarket price of the Company’s common stock over the exercise price of the purchased call options. In addition, theCompany sold warrants in private transactions to acquire, subject to customary anti-dilution adjustments, 26.3million shares of its common stock at an exercise price of $62.56 per share and received proceeds of $170 million.If the average price of the Company’s common stock during a defined period ending on or about the respectivesettlement dates exceeds the exercise price of the warrants, the warrants will be settled, at the Company’s option, incash or shares of common stock. The purchased call options and warrants are intended to reduce the potentialdilution upon future conversions of the Notes by effectively increasing the initial conversion price to $62.56 pershare. The net cost of the purchased call options and warrant transactions of $130 million was recorded as areduction of shareholders’ equity. The Company also recorded a $114 million increase in shareholders’ equity forthe deferred tax assets recognized related to the purchased call options.
Upon closing of the sale of the Notes, $370 million of the net proceeds from the Note issuance and the proceedsfrom the warrant transactions were used to repurchase 10.3 million shares of the Company’s common stock underthe Company’s stock repurchase program.
As of June 30, 2008, none of the conditions permitting conversion of the Notes had been satisfied. In addition, asof June 30, 2008, the market price of the Company’s common stock was not greater than the exercise price of thepurchased call options or warrants. As of June 30, 2008, no share amounts related to the conversion of the Notes orexercise of the warrants are included in diluted average shares outstanding.

54
Archer Daniels Midland Company
Notes to Consolidated Financial Statements (Continued)
Note 7. Debt and Financing Arrangements (Continued)
At June 30, 2008, the fair value of the Company’s long-term debt exceeded the carrying value by $99 million, asestimated by using quoted market prices or discounted future cash flows based on the Company’s currentincremental borrowing rates for similar types of borrowing arrangements.
The aggregate maturities of long-term debt for the five years after June 30, 2008, are $232 million, $43 million,$283 million, $118 million, and $261 million, respectively.
At June 30, 2008, the Company had pledged certain property, plant, and equipment with a carrying value of $359million as security for certain long-term debt obligations.
At June 30, 2008, the Company had lines of credit totaling $7.4 billion, of which $4.3 billion was unused. Theweighted average interest rates on short-term borrowings outstanding at June 30, 2008 and 2007, were 2.83% and6.18%, respectively. Of the Company’s total lines of credit, $5.1 billion support a commercial paper borrowingfacility, against which there was $2.2 billion borrowed at June 30, 2008.
The Company has outstanding standby letters of credit and surety bonds at June 30, 2008 and 2007, totaling$500 million and $339 million, respectively.
Note 8. Shareholders’ Equity
The Company has authorized one billion shares of common stock and 500,000 shares of preferred stock, eachwithout par value. No preferred stock has been issued. At June 30, 2008 and 2007, the Company hadapproximately 27.8 million and 28.6 million shares, respectively, in treasury. Treasury stock of $719 million atJune 30, 2008, and $723 million at June 30, 2007, is recorded at cost as a reduction of common stock.
The Company’s employee stock compensation plans provide for the granting of options to employees to purchasecommon stock of the Company pursuant to the Company’s 1999 Incentive Compensation Plan and 2002 IncentiveCompensation Plan. These options are issued at market value on the date of grant, vest over three to nine years,and expire five to ten years after the date of grant.
The Company’s 1999 and 2002 Incentive Compensation Plans provide for the granting of restricted stock andrestricted stock units (Restricted Stock Awards) at no cost to certain officers and key employees. The awards aremade in common stock or stock units with equivalent rights and vest at the end of a three-year restriction period.During 2008, 2007, and 2006, 1.3 million, 1.1 million, and 2.4 million common shares or units, respectively,were granted as Restricted Stock Awards. At June 30, 2008, there were 1.5 million and 7.9 million sharesavailable for future grants pursuant to the 1999 and 2002 plans, respectively.
Compensation expense for option grants and Restricted Stock Awards granted to employees is generallyrecognized on a straight-line basis during the service period of the respective grant. Certain of the Company’soption grants and Restricted Stock Awards continue to vest upon the recipient’s retirement from the Companyand compensation expense related to option grants and Restricted Stock Awards granted to retirement eligibleemployees is recognized in earnings on the date of grant. Total compensation expense for option grants andRestricted Stock Awards recognized during 2008, 2007, and 2006 was $70 million, $70 million, and $67 million,respectively.

55
Archer Daniels Midland Company
Note 8. ShareholdersÕ Equity (Continued)
The fair value of each option grant is estimated as of the date of grant using the Black-Scholes single option
pricing model. The volatility assumption used in the Black-Scholes single option pricing model is based on the
historical volatility of the CompanyÕs stock. The volatility of the CompanyÕs stock was calculated based upon
the monthly closing price of the CompanyÕs stock for the eight year period immediately prior to the date of
grant. The average expected life represents the period of time that option grants are expected to be outstanding.
The risk-free rate is based on the rate of U.S. Treasury zero-coupon issues with a remaining term equal to the
expected life of option grants. The assumptions used in the Black-Scholes single option pricing model are as
follows.
2008 2007 2006
Dividend yield 1% 1% 2%
Risk-free interest rate 5% 5% 4%
Stock volatility 30% 30% 31%
Average expected life (years) 8 8 8
A summary of option activity during 2008 is presented below:
Shares
Weighted-Average
Exercise Price
(In thousands, except per share amounts)
Shares under option at June 30, 2007 9,382 $19.80
Granted 1,958 34.37
Exercised (1,614) 15.79
Forfeited or expired (777) 18.86
Shares under option at June 30, 2008 8,949 $23.79
Exercisable at June 30, 2008 2,768 $17.34
The weighted-average remaining contractual term of options outstanding and exercisable at June 30, 2008, is 7
years and 5 years, respectively. The aggregate intrinsic value of options outstanding and exercisable at
June 30, 2008, is $89 million and $45 million, respectively. The weighted-average grant-date fair values of
options granted during 2008, 2007, and 2006, were $12.60, $16.42, and $7.52 respectively. The total intrinsic
values of options exercised during 2008, 2007, and 2006, were $34 million, $41 million, and $60 million,
respectively. Cash proceeds received from options exercised during 2008, 2007, and 2006, were $20 million,
$20 million, and $30 million, respectively.
At June 30, 2008, there was $35 million of total unrecognized compensation expense related to option grants.
Amounts to be recognized as compensation expense during the next five fiscal years are $13 million, $10
million, $7 million, $4 million, and $1 million, respectively.
Notes to Consolidated Financial Statements (Continued)
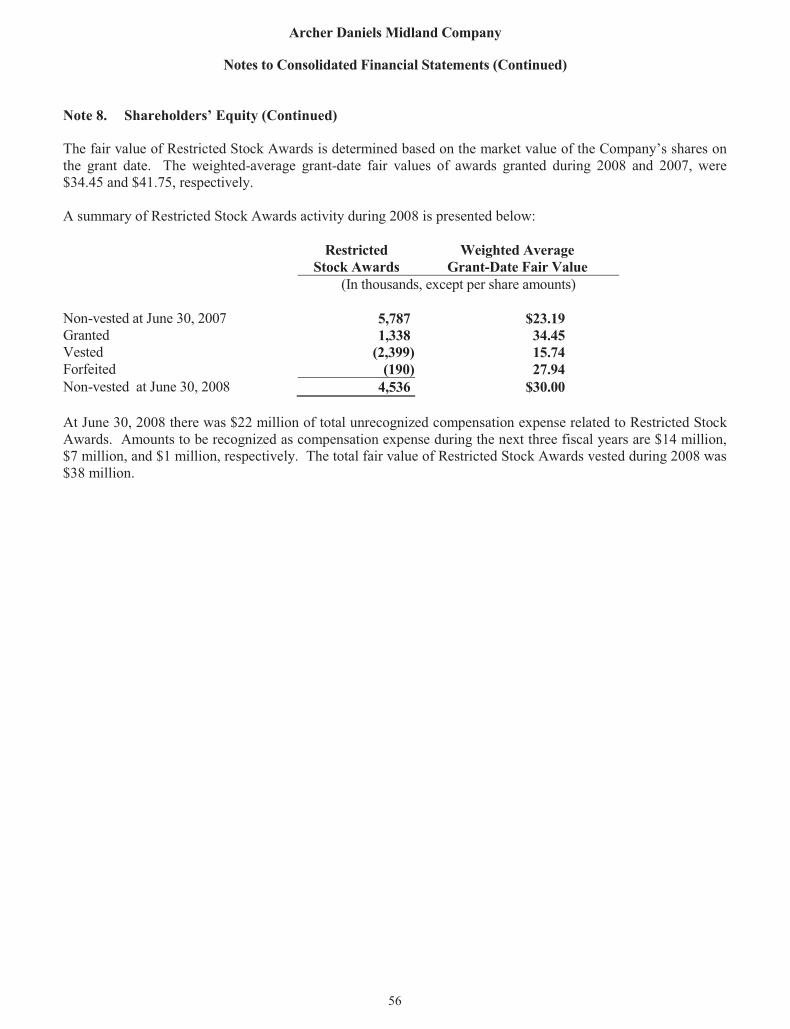
56
Archer Daniels Midland Company
Notes to Consolidated Financial Statements (Continued)
Note 8. Shareholders’ Equity (Continued)
The fair value of Restricted Stock Awards is determined based on the market value of the Company’s shares onthe grant date. The weighted-average grant-date fair values of awards granted during 2008 and 2007, were$34.45 and $41.75, respectively.
A summary of Restricted Stock Awards activity during 2008 is presented below:
Restricted Weighted AverageStock Awards Grant-Date Fair Value
(In thousands, except per share amounts)
Non-vested at June 30, 2007 5,787 $23.19Granted 1,338 34.45Vested (2,399) 15.74Forfeited (190) 27.94Non-vested at June 30, 2008 4,536 $30.00
At June 30, 2008 there was $22 million of total unrecognized compensation expense related to Restricted StockAwards. Amounts to be recognized as compensation expense during the next three fiscal years are $14 million,$7 million, and $1 million, respectively. The total fair value of Restricted Stock Awards vested during 2008 was$38 million.
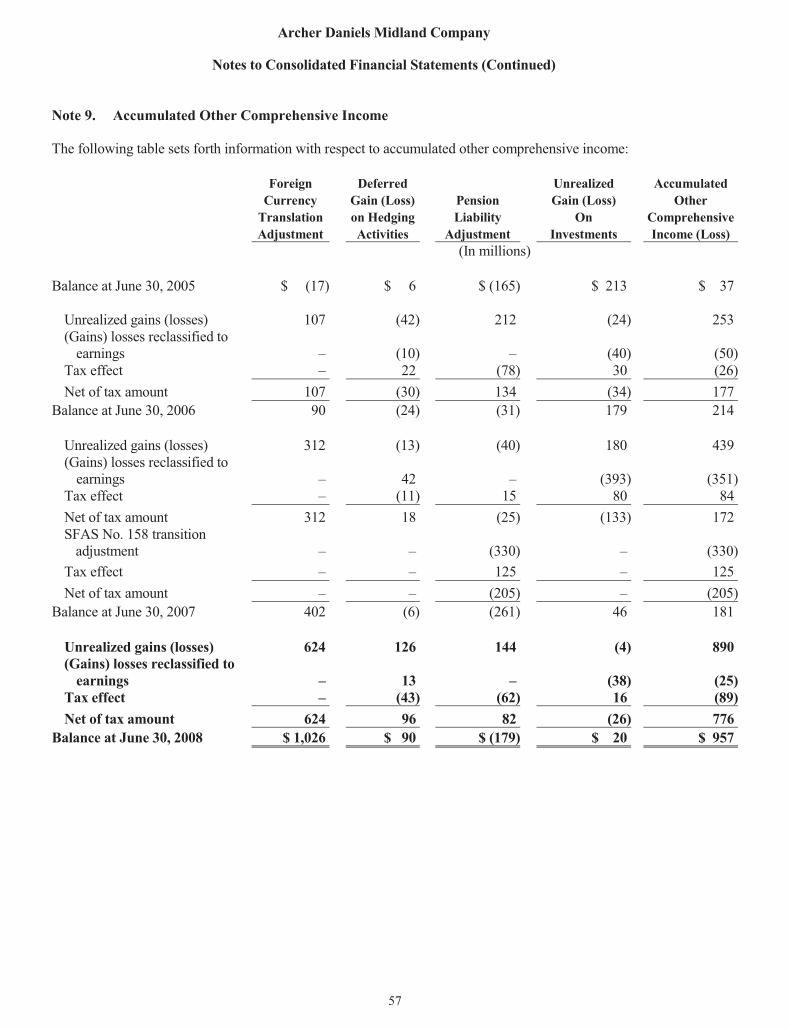
57
Archer Daniels Midland Company
Notes to Consolidated Financial Statements (Continued)
Note 9. Accumulated Other Comprehensive Income
The following table sets forth information with respect to accumulated other comprehensive income:
Foreign Deferred Unrealized AccumulatedCurrency Gain (Loss) Pension Gain (Loss) Other
Translation on Hedging Liability On ComprehensiveAdjustment Activities Adjustment Investments Income (Loss)
(In millions)
Balance at June 30, 2005 $ (17) $ 6 $ (165) $ 213 $ 37
Unrealized gains (losses) 107 (42) 212 (24) 253(Gains) losses reclassified to
earnings – (10) – (40) (50)Tax effect – 22 (78) 30 (26)Net of tax amount 107 (30) 134 (34) 177
Balance at June 30, 2006 90 (24) (31) 179 214
Unrealized gains (losses) 312 (13) (40) 180 439(Gains) losses reclassified to
earnings – 42 – (393) (351)Tax effect – (11) 15 80 84Net of tax amount 312 18 (25) (133) 172SFAS No. 158 transition
adjustment – – (330) – (330)Tax effect – – 125 – 125Net of tax amount – – (205) – (205)
Balance at June 30, 2007 402 (6) (261) 46 181
Unrealized gains (losses) 624 126 144 (4) 890(Gains) losses reclassified to
earnings – 13 – (38) (25)Tax effect – (43) (62) 16 (89)Net of tax amount 624 96 82 (26) 776
Balance at June 30, 2008 $ 1,026 $ 90 $ (179) $ 20 $ 957
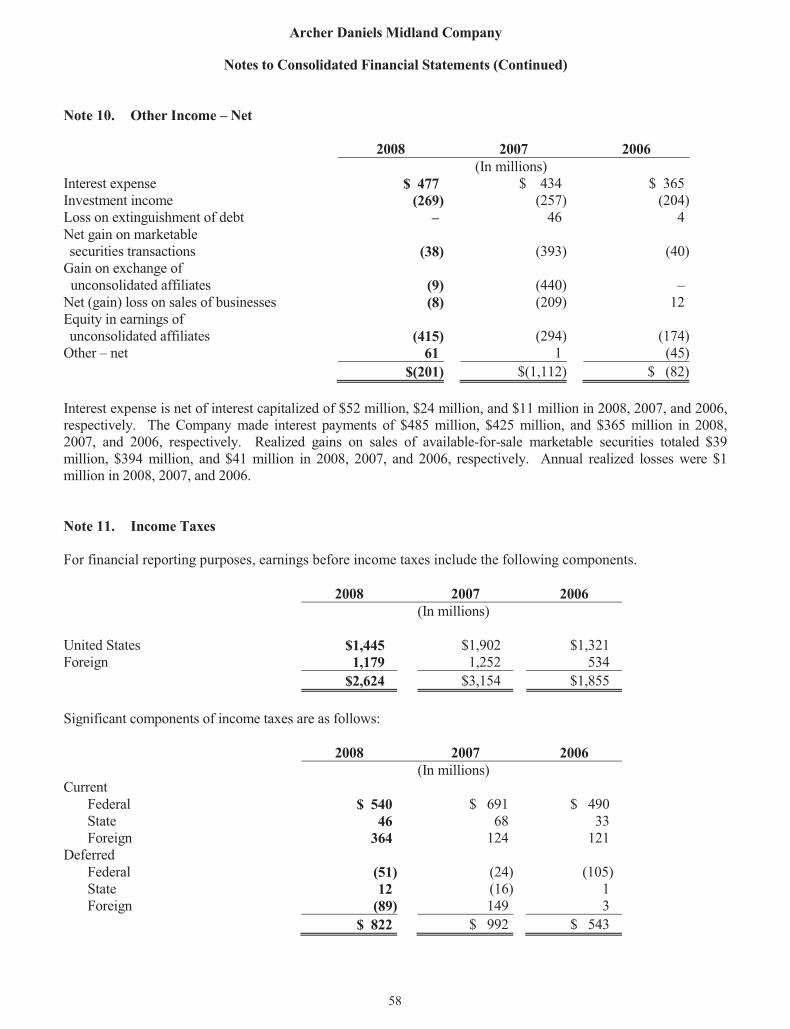
58
Archer Daniels Midland Company
Notes to Consolidated Financial Statements (Continued)
Note 10. Other Income – Net
2008 2007 2006(In millions)
Interest expense $ 477 $ 434 $ 365Investment income (269) (257) (204)Loss on extinguishment of debt – 46 4Net gain on marketablesecurities transactions (38) (393) (40)
Gain on exchange ofunconsolidated affiliates (9) (440) –
Net (gain) loss on sales of businesses (8) (209) 12Equity in earnings ofunconsolidated affiliates (415) (294) (174)
Other – net 61 1 (45)$(201) $(1,112) $ (82)
Interest expense is net of interest capitalized of $52 million, $24 million, and $11 million in 2008, 2007, and 2006,respectively. The Company made interest payments of $485 million, $425 million, and $365 million in 2008,2007, and 2006, respectively. Realized gains on sales of available-for-sale marketable securities totaled $39million, $394 million, and $41 million in 2008, 2007, and 2006, respectively. Annual realized losses were $1million in 2008, 2007, and 2006.
Note 11. Income Taxes
For financial reporting purposes, earnings before income taxes include the following components.
2008 2007 2006(In millions)
United States $1,445 $1,902 $1,321Foreign 1,179 1,252 534
$2,624 $3,154 $1,855
Significant components of income taxes are as follows:
2008 2007 2006(In millions)
CurrentFederal $ 540 $ 691 $ 490State 46 68 33Foreign 364 124 121
DeferredFederal (51) (24) (105)State 12 (16) 1Foreign (89) 149 3
$ 822 $ 992 $ 543
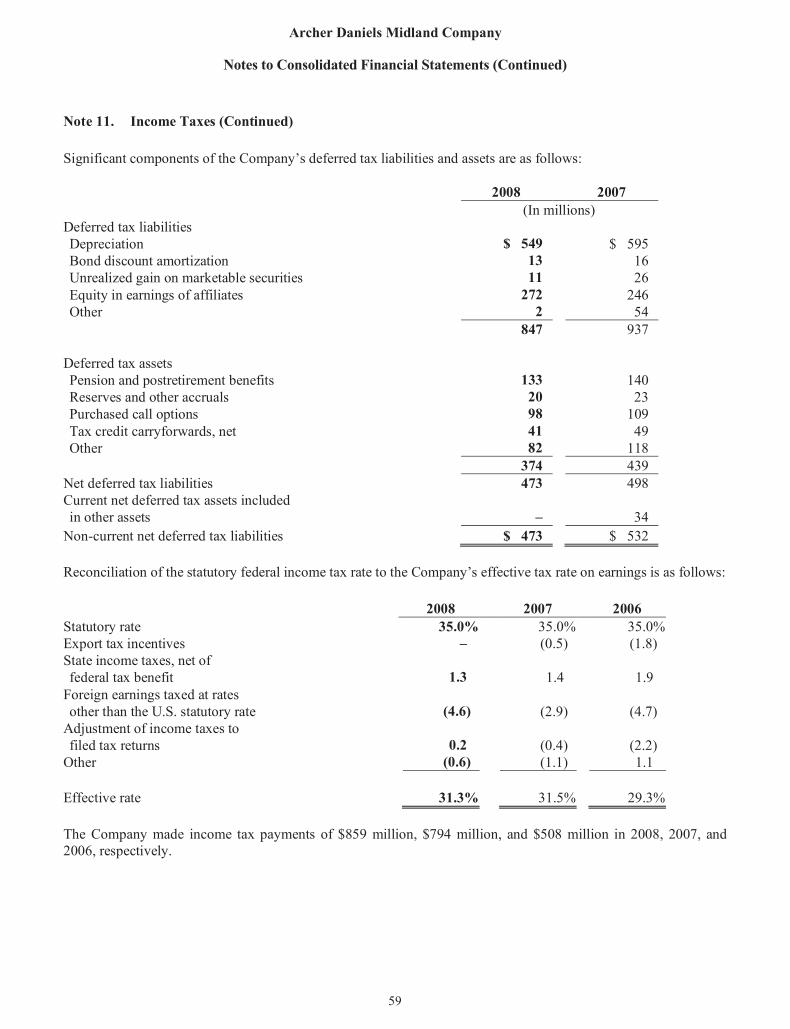
59
Archer Daniels Midland Company
Note 11. Income Taxes (Continued)
Significant components of the CompanyÕs deferred tax liabilities and assets are as follows:
2008 2007
(In millions)
Deferred tax liabilities
Depreciation $ 549 $ 595
Bond discount amortization 13 16
Unrealized gain on marketable securities 11 26
Equity in earnings of affiliates 272 246
Other 2 54
847 937
Deferred tax assets
Pension and postretirement benefits 133 140
Reserves and other accruals 20 23
Purchased call options 98 109
Tax credit carryforwards, net 41 49
Other 82 118
374 439
Net deferred tax liabilities 473 498
Current net deferred tax assets included
in other assets Ð 34
Non-current net deferred tax liabilities $ 473 $ 532
Reconciliation of the statutory federal income tax rate to the CompanyÕs effective tax rate on earnings is as follows:
2008 2007 2006
Statutory rate 35.0% 35.0% 35.0%
Export tax incentives Ð (0.5) (1.8)
State income taxes, net of
federal tax benefit 1.3 1.4 1.9
Foreign earnings taxed at rates
other than the U.S. statutory rate (4.6) (2.9) (4.7)
Adjustment of income taxes to
filed tax returns 0.2 (0.4) (2.2)
Other (0.6) (1.1) 1.1
Effective rate 31.3% 31.5% 29.3%
The Company made income tax payments of $859 million, $794 million, and $508 million in 2008, 2007, and
2006, respectively.
Notes to Consolidated Financial Statements (Continued)

60
Archer Daniels Midland Company
Notes to Consolidated Financial Statements (Continued)
Note 11. Income Taxes (Continued)
The Company has $69 million and $82 million of tax assets for net operating loss carry-forwards related to certaininternational subsidiaries at June 30, 2008 and 2007, respectively. As of June 30, 2008, approximately $54 millionof these assets have no expiration date, and the remaining $15 million expire at various times through fiscal 2017.The annual usage of certain of these assets is limited to a percentage of taxable income of the respectiveinternational subsidiary for the year. The Company has recorded a valuation allowance of $60 million and $52million against these tax assets at June 30, 2008 and 2007, respectively, due to the uncertainty of their realization.
The Company also has $41 million of tax assets related to excess foreign tax credits which begin to expire in fiscal2013 and $25 million of tax assets related to state income tax attributes (incentive credits and net operating losscarryforwards) net of federal benefit which will expire at various times through fiscal 2012. The Company hasrecorded a valuation allowance of $24 million against the excess foreign tax credits at June 30, 2008, due to theuncertainty of realization. The Company has also recorded a valuation allowance against the state income taxattributes of $1 million as of June 30, 2008. As of June 30, 2007, the Company had a $15 million valuationallowance recorded related to the excess foreign tax credits and a $1 million valuation allowance related to stateincome tax incentive credits, due to the uncertainty of realization.
The Company remains subject to examination in the U.S. for the calendar tax years 2007 and 2008.
Undistributed earnings of the Company’s foreign subsidiaries and affiliated corporate joint venture companiesaccounted for on the equity method of approximately $4.9 billion at June 30, 2008, are considered to bepermanently reinvested, and accordingly, no provision for U.S. income taxes has been provided thereon. It is notpracticable to determine the deferred tax liability for temporary differences related to these undistributed earnings.
The Company adopted the provisions of FIN 48 effective July 1, 2007. FIN 48 clarifies the accounting for incometax positions by prescribing a minimum threshold a tax position is required to meet before being recognized in theconsolidated financial statements. This interpretation requires the Company to recognize in the consolidatedfinancial statements tax positions determined more likely than not to be sustained upon examination, based on thetechnical merits of the position. Upon adoption of FIN 48, no material changes were required to be taken intoaccount in the income statement or balance sheet of the Company. Additionally, the 2008 changes in unrecognizedtax benefits did not have a material effect on the Company’s net income or cash flow. The total amounts ofunrecognized tax benefits at July 1, 2007, and June 30, 2008, are as follows:
UnrecognizedTax Benefits(In millions)
July 1, 2007 balance $ 21Additions related to current year tax positions 29Additions related to prior years’ tax position 7Reduction related to prior years’ tax positions –Reductions due to a lapse of the statue of limitations –Settlements with tax authorities (2)
June 30, 2008 balance $ 55

61
Archer Daniels Midland Company
Notes to Consolidated Financial Statements (Continued)
Note 11. Income Taxes (Continued)
The Company is subject to income taxation in many jurisdictions around the world. Resolution of the related taxpositions through negotiations with relevant tax authorities or through litigation may take years to complete.Therefore, it is difficult to predict the timing for resolution for tax positions. However, the Company does notanticipate that the total amount of unrecognized tax benefits will increase or decrease significantly in the nexttwelve months. Given the long periods of time involved in resolving tax positions, the Company does not expectthat the recognition of unrecognized tax benefits will have a material impact on the Company’s effective incometax rate in any given period. If the total amount of unrecognized tax benefits were required to be recognized by theCompany at one time, there would be a positive impact of $26 million on the tax expense for that period.
The Company classifies interest on income tax-related balances as interest expense or interest income and classifiestax-related penalties as operating expense. At July 1, 2007, and June 30, 2008, respectively, the Company hadaccrued $14.4 million and $17.5 million of liabilities for interest and penalties on unrecognized tax benefits.
Note 12. Leases
The Company leases manufacturing and warehouse facilities, real estate, transportation assets, and otherequipment under non-cancelable operating leases which expire at various dates through the year 2076. Rentexpense for 2008, 2007, and 2006 was $201 million, $166 million, and $129 million, respectively. Futureminimum rental payments for non-cancelable operating leases with initial or remaining terms in excess of oneyear are as follows:
Minimum RentalPayments
Fiscal years (In millions)
2009 $ 4032010 2172011 1852012 1292013 110Thereafter 320Total minimum lease payments $1,364

62
Archer Daniels Midland Company
Notes to Consolidated Financial Statements (Continued)
Note 13. Employee Benefit Plans
The Company provides substantially all domestic employees and employees at certain international subsidiarieswith pension benefits. The Company also provides substantially all domestic salaried employees withpostretirement health care and life insurance benefits.
The Company has savings and investment plans available to employees. The Company also maintains stockownership plans for qualifying employees. The Company contributes shares of its stock to the plans to matchqualifying employee contributions. Employees have the choice of retaining Company stock in their accounts ordiversifying the shares into other investment options. Expense is measured and recorded based upon the fairmarket value of the stock contributed to the plans each month. The number of shares designated for use in theplans is not significant compared to the shares outstanding for the periods presented. Assets of the Company’sdefined contribution savings plans consist primarily of listed common stocks and pooled funds. The Company’sdefined contribution savings plans held 16.4 million shares of Company common stock at June 30, 2008, with amarket value of $555 million. Cash dividends received on shares of Company common stock held by theseplans during the year ended June 30, 2008 were $9 million.
Pension Benefits Postretirement Benefits2008 2007 2006 2008 2007 2006
(In millions) (In millions)Retirement plan expenseDefined benefit plans:
Service cost (benefits earned during theperiod) $ 68 $ 62 $ 59 $ 9 $ 7 $ 6
Interest cost 109 94 87 12 10 9Expected return on plan assets (121) (102) (81) – – –Curtailment – – 10 – – –Amortization of actuarial loss 17 19 35 2 1 –Other amortization 5 6 4 (1) (1) –
Net periodic defined benefit planexpense 78 79 114 22 17 15
Defined contribution plans 31 29 27 – – –Total retirement plan expense $ 109 $ 108 $ 141 $ 22 $ 17 $ 15
On June 30, 2007, the Company adopted the recognition and disclosure provisions of SFAS No. 158. SFAS No.158 required the Company to recognize the funded status of its pension plans in the June 30, 2007, consolidatedbalance sheet, with a corresponding adjustment to accumulated other comprehensive income. The adjustment toaccumulated other comprehensive income at adoption represented the net unrecognized actuarial losses,unrecognized prior service costs, and unrecognized transition obligation remaining from the initial adoption ofSFAS No. 87, Employers’ Accounting for Pensions, all of which were previously netted against the plans’ fundedstatus in the Company’s consolidated balance sheet pursuant to the provisions of SFAS No. 87. These amounts aresubsequently recognized as net periodic pension cost pursuant to the Company’s historical accounting policy foramortizing such amounts. Further, actuarial gains and losses that arise in subsequent periods and are notrecognized as net periodic pension cost in the same periods are recognized as a component of other comprehensiveincome. Those amounts are subsequently recognized as a component of net periodic pension cost on the samebasis as the amounts recognized in accumulated other comprehensive income pursuant to the provisions of SFASNo. 158.
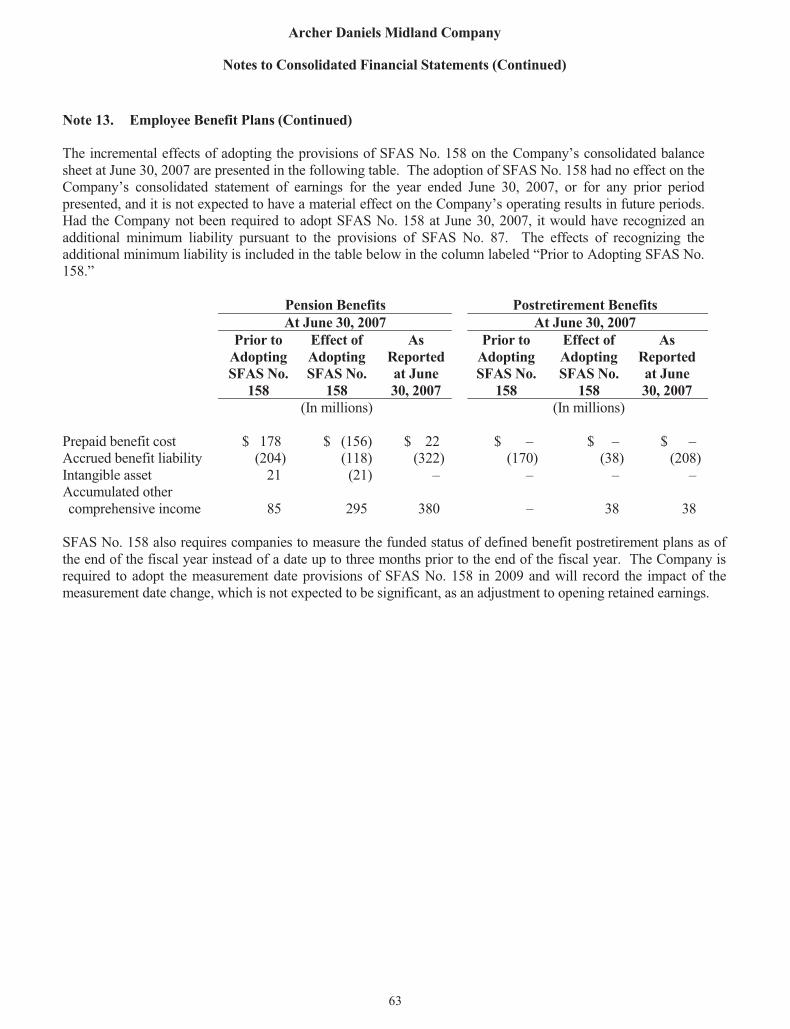
63
Archer Daniels Midland Company
Notes to Consolidated Financial Statements (Continued)
Note 13. Employee Benefit Plans (Continued)
The incremental effects of adopting the provisions of SFAS No. 158 on the Company’s consolidated balancesheet at June 30, 2007 are presented in the following table. The adoption of SFAS No. 158 had no effect on theCompany’s consolidated statement of earnings for the year ended June 30, 2007, or for any prior periodpresented, and it is not expected to have a material effect on the Company’s operating results in future periods.Had the Company not been required to adopt SFAS No. 158 at June 30, 2007, it would have recognized anadditional minimum liability pursuant to the provisions of SFAS No. 87. The effects of recognizing theadditional minimum liability is included in the table below in the column labeled “Prior to Adopting SFAS No.158.”
Pension Benefits Postretirement BenefitsAt June 30, 2007 At June 30, 2007
Prior to Effect of As Prior to Effect of AsAdopting Adopting Reported Adopting Adopting ReportedSFAS No. SFAS No. at June SFAS No. SFAS No. at June
158 158 30, 2007 158 158 30, 2007(In millions) (In millions)
Prepaid benefit cost $ 178 $ (156) $ 22 $ – $ – $ –Accrued benefit liability (204) (118) (322) (170) (38) (208)Intangible asset 21 (21) – – – –Accumulated othercomprehensive income 85 295 380 – 38 38
SFAS No. 158 also requires companies to measure the funded status of defined benefit postretirement plans as ofthe end of the fiscal year instead of a date up to three months prior to the end of the fiscal year. The Company isrequired to adopt the measurement date provisions of SFAS No. 158 in 2009 and will record the impact of themeasurement date change, which is not expected to be significant, as an adjustment to opening retained earnings.

64
Archer Daniels Midland Company
Notes to Consolidated Financial Statements (Continued)
Note 13. Employee Benefit Plans (Continued)
The Company uses a March 31 measurement date for substantially all defined benefit plans. The followingtables set forth changes in the defined benefit obligation and the fair value of defined benefit plan assets:
Pension BenefitsPostretirement
Benefits2008 2007 2008 2007
(In millions) (In millions)Benefit obligation, beginning $ 1,916 $ 1,707 $ 208 $ 165Service cost 68 62 9 7Interest cost 109 94 12 10Actuarial loss (gain) (242) 65 (15) 24Curtailment – (1) – –Employee contributions 3 4 – 2Benefits paid (78) (77) (8) (7)Plan amendments 6 3 – –Acquisitions and divestitures – 15 – 7Foreign currency effects 69 44 – –Benefit obligation, ending $ 1,851 $ 1,916 $ 206 $ 208
Fair value of plan assets, beginning $ 1,611 $ 1,468 $ – $ –Actual return on plan assets 5 118 – –Employer contributions 69 50 8 5Employee contributions 3 4 – 2Benefits paid (78) (77) (8) (7)Acquisitions and divestitures – 14 – –Foreign currency effects 52 34 – –Fair value of plan assets, ending $ 1,662 $ 1,611 $ – $ –
Funded status $ (189) $ (305) $ (206) $ (208)Adjustment for fourth quarter contributions 7 5 – –Pension liability recognized in the balance sheet $ (182) $ (300) $ (206) $ (208)
Prepaid benefit cost $ 68 $ 22 $ – $ –Accrued benefit liability – current (11) (9) (8) (7)Accrued benefit liability – long-term (239) (313) (198) (201)Net amount recognized in the balance sheet $ (182) $ (300) $ (206) $ (208)
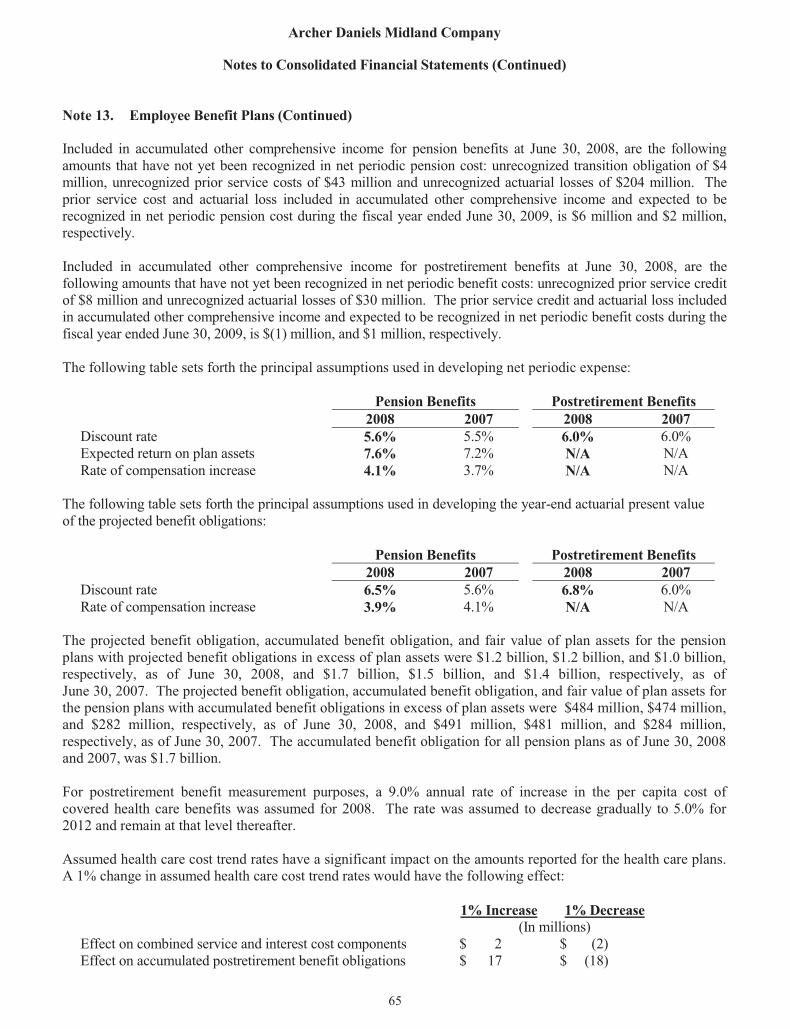
65
Archer Daniels Midland Company
Notes to Consolidated Financial Statements (Continued)
Note 13. Employee Benefit Plans (Continued)
Included in accumulated other comprehensive income for pension benefits at June 30, 2008, are the followingamounts that have not yet been recognized in net periodic pension cost: unrecognized transition obligation of $4million, unrecognized prior service costs of $43 million and unrecognized actuarial losses of $204 million. Theprior service cost and actuarial loss included in accumulated other comprehensive income and expected to berecognized in net periodic pension cost during the fiscal year ended June 30, 2009, is $6 million and $2 million,respectively.
Included in accumulated other comprehensive income for postretirement benefits at June 30, 2008, are thefollowing amounts that have not yet been recognized in net periodic benefit costs: unrecognized prior service creditof $8 million and unrecognized actuarial losses of $30 million. The prior service credit and actuarial loss includedin accumulated other comprehensive income and expected to be recognized in net periodic benefit costs during thefiscal year ended June 30, 2009, is $(1) million, and $1 million, respectively.
The following table sets forth the principal assumptions used in developing net periodic expense:
Pension Benefits Postretirement Benefits2008 2007 2008 2007
Discount rate 5.6% 5.5% 6.0% 6.0%Expected return on plan assets 7.6% 7.2% N/A N/ARate of compensation increase 4.1% 3.7% N/A N/A
The following table sets forth the principal assumptions used in developing the year-end actuarial present valueof the projected benefit obligations:
Pension Benefits Postretirement Benefits2008 2007 2008 2007
Discount rate 6.5% 5.6% 6.8% 6.0%Rate of compensation increase 3.9% 4.1% N/A N/A
The projected benefit obligation, accumulated benefit obligation, and fair value of plan assets for the pensionplans with projected benefit obligations in excess of plan assets were $1.2 billion, $1.2 billion, and $1.0 billion,respectively, as of June 30, 2008, and $1.7 billion, $1.5 billion, and $1.4 billion, respectively, as ofJune 30, 2007. The projected benefit obligation, accumulated benefit obligation, and fair value of plan assets forthe pension plans with accumulated benefit obligations in excess of plan assets were $484 million, $474 million,and $282 million, respectively, as of June 30, 2008, and $491 million, $481 million, and $284 million,respectively, as of June 30, 2007. The accumulated benefit obligation for all pension plans as of June 30, 2008and 2007, was $1.7 billion.
For postretirement benefit measurement purposes, a 9.0% annual rate of increase in the per capita cost ofcovered health care benefits was assumed for 2008. The rate was assumed to decrease gradually to 5.0% for2012 and remain at that level thereafter.
Assumed health care cost trend rates have a significant impact on the amounts reported for the health care plans.A 1% change in assumed health care cost trend rates would have the following effect:
1% Increase 1% Decrease(In millions)
Effect on combined service and interest cost components $ 2 $ (2)Effect on accumulated postretirement benefit obligations $ 17 $ (18)

66
Archer Daniels Midland Company
Notes to Consolidated Financial Statements (Continued)
Note 13. Employee Benefit Plans (Continued)
Plan Assets
The following table sets forth the actual asset allocation for the Company’s global pension plan assets as of themeasurement date:
20081, 2 2007
Equity securities 51% 54%Debt securities 41% 40%Other 8% 6%Total 100% 100%
1 The Company’s U.S. pension plans contain approximately 60% of the Company’s global pension planassets. The target asset allocation for the Company’s U.S. pension plans consists of 60% equity securities,30% debt securities, and 10% real estate. The actual asset allocation for the U.S. pension plans as of themeasurement date consists of 61% equity securities, 28% debt securities, and 11% in real estate. The actualasset allocation for the Company’s foreign pension plans as of the measurement date consists of 37% equitysecurities, 61% debt securities, and 2% in other investments. The target asset allocation for the Company’sforeign pension plans is approximately the same as the actual asset allocation.
2 The Company’s pension plans held 3.1 million shares of Company common stock as of the measurementdate, March 31, 2008, with a market value of $129 million. Cash dividends received on shares of Companycommon stock by these plans during the twelve-month period ended March 31, 2008, were $2 million.
Investment objectives for the Company’s plan assets are to:
� Optimize the long-term return on plan assets at an acceptable level of risk.� Maintain a broad diversification across asset classes and among investment managers.� Maintain careful control of the risk level within each asset class.
Asset allocation targets promote optimal expected return and volatility characteristics given the long-term timehorizon for fulfilling the obligations of the pension plans. Selection of the targeted asset allocation for planassets was based upon a review of the expected return and risk characteristics of each asset class, as well as thecorrelation of returns among asset classes. The U.S. pension plans target asset allocation was also based on anasset and liability study concluded in January 2005.
Investment guidelines are established with each investment manager. These guidelines provide the parameterswithin which the investment managers agree to operate, including criteria that determine eligible and ineligiblesecurities, diversification requirements, and credit quality standards, where applicable. In some countries,derivatives may be used to gain market exposure in an efficient and timely manner; however, derivatives maynot be used to leverage the portfolio beyond the market value of underlying investments.

67
Archer Daniels Midland Company
Notes to Consolidated Financial Statements (Continued)
Note 13. Employee Benefit Plans (Continued)
External consultants monitor the investment strategy and asset mix for the Company’s plan assets. To developthe Company’s expected long-term rate of return assumption on plan assets, the Company generally uses long-term historical return information for the targeted asset mix identified in asset and liability studies. Adjustmentsare made to the expected long-term rate of return assumption when deemed necessary based upon revisedexpectations of future investment performance of the overall investment markets. The expected long-term rateof return assumption used in computing 2008 net periodic pension cost for the pension plans was 7.6%.
Contributions and Expected Future Benefit Payments
The Company expects to contribute $36 million to the pension plans and $8 million to the postretirement benefitplan during 2009.
The following benefit payments, which reflect expected future service, are expected to be paid:
PensionBenefits
PostretirementBenefits
(In millions)
2009 $ 82 $ 82010 90 92011 95 102012 100 112013 106 122014 – 2018 621 73
Note 14. Segment and Geographic Information
The Company is principally engaged in procuring, transporting, storing, processing, and merchandisingagricultural commodities and products. Beginning July 1, 2007, the Company has reclassified certain operationswithin its reportable segments to reflect how the Company now manages its businesses following a realignmentof the organizational structure of the Company and to reflect the activities of the Company as viewed by theCompany’s chief operating decision maker. Prior period segment information has been reclassified to conformto the new presentation. The Company’s operations are classified into three reportable business segments:Oilseeds Processing, Corn Processing and Agricultural Services. Each of these segments is organized basedupon the nature of products and services offered. The Company’s remaining operations are aggregated andclassified as Other. The reclassification of certain operations in the Company’s reportable segments principallyresulted in the movement of certain food, feed, and industrial operations previously classified in Other to therespective segment which produces the raw material feedstock used in those operations. The OilseedsProcessing segment now includes the Company’s natural health and nutrition and protein specialties operations,the Corn Processing segment now includes the Company’s industrial bioproducts operations, and theAgricultural Services segment now includes the Company’s formula feed processing and edible bean originationoperations.
68
Archer Daniels Midland Company
Notes to Consolidated Financial Statements (Continued)
Note 14. Segment and Geographic Information (Continued)
The Oilseeds Processing segment includes activities related to the crushing and origination of oilseeds such assoybeans, cottonseed, sunflower seeds, canola, peanuts, and flaxseed into vegetable oils and protein mealsprincipally for the food and feed industries. In addition, oilseeds and oilseed products may be processedinternally or resold into the marketplace as raw materials for other processing. Crude vegetable oil is sold "as is"or is further processed by refining, bleaching, and deodorizing into salad oils. Salad oils can be furtherprocessed by hydrogenating and/or interesterifying into margarine, shortening, and other food products. Partiallyrefined oil is sold for use in chemicals, paints, and other industrial products. Refined oil can be further processedfor use in the production of biodiesel. Oilseed meals are primary ingredients used in the manufacture ofcommercial livestock and poultry feeds. Oilseeds Processing includes activities related to the production ofnatural health and nutrition products and the production of other specialty food and feed ingredients. Thissegment also includes activities related to the Company’s interests in unconsolidated affiliates in Asia,principally Wilmar International Limited.
The Corn Processing segment includes activities related to the production of sweeteners, starches, dextrose, andsyrups primarily for the food and beverage industry as well as activities related to the production, byfermentation, of bioproducts such as ethanol, amino acids, and other food, feed and industrial products.
The Agricultural Services segment utilizes the Company’s extensive grain elevator and transportation network tobuy, store, clean, and transport agricultural commodities, such as oilseeds, corn, wheat, milo, oats, barley, andedible beans, and resells or processes these commodities primarily as food and feed ingredients for theagricultural processing industry. Agricultural Services’ grain sourcing and transportation network providesreliable and efficient services to the Company’s agricultural processing operations. Also included in AgriculturalServices are the activities of A.C. Toepfer International, a global merchandiser of agricultural commodities andprocessed products.
Other includes the Company’s remaining processing operations, consisting of activities related to processingagricultural commodities into food ingredient products such as wheat into wheat flour, cocoa into chocolate andcocoa products, and barley into malt. Other also includes financial activities related to banking, captiveinsurance, private equity fund investments, and futures commission merchant activities.
Intersegment sales have been recorded at amounts approximating market. Operating profit for each segment isbased on net sales less identifiable operating expenses, including an interest charge related to working capitalusage. Also included in segment operating profit are equity in earnings of affiliates based on the equity methodof accounting. General corporate expenses, investment income, unallocated interest expense, marketablesecurities transactions, FIFO to LIFO inventory adjustments and minority interest eliminations have beenexcluded from segment operations and classified as Corporate.

69
Note 14. Segment and Geographic Information (Continued)
Segment Information2008 2007 2006
(In millions)Sales to external customers
Oilseeds Processing $ 23,279 $ 13,943 $ 11,893Corn Processing 7,137 5,825 5,256Agricultural Services 33,968 20,419 16,155Other 5,432 3,831 3,292Total $ 69,816 $ 44,018 $ 36,596
Intersegment salesOilseeds Processing $ 535 $ 328 $ 58Corn Processing 99 50 49Agricultural Services 2,965 1,833 1,202Other 140 125 115Total $ 3,739 $ 2,336 $ 1,424
Net salesOilseeds Processing $ 23,814 $ 14,271 $ 11,951Corn Processing 7,236 5,875 5,305Agricultural Services 36,933 22,252 17,357Other 5,572 3,956 3,407Intersegment elimination (3,739) (2,336) (1,424)Total $ 69,816 $ 44,018 $ 36,596
DepreciationOilseeds Processing $ 202 $ 190 $ 189Corn Processing 293 285 266Agricultural Services 92 91 91Other 114 112 87Corporate 20 23 24Total $ 721 $ 701 $ 657
Asset abandonments and write-downsOilseeds Processing $ 28 $ 6 $ 31Corn Processing 2 15 6Agricultural Services – – 31Other 2 – 3Total $ 32 $ 21 $ 71
Interest expenseOilseeds Processing $ 186 $ 136 $ 91Corn Processing 49 46 33Agricultural Services 170 133 74Other 119 134 99Corporate (47) (15) 68Total $ 477 $ 434 $ 365
Archer Daniels Midland Company
Notes to Consolidated Financial Statements (Continued)
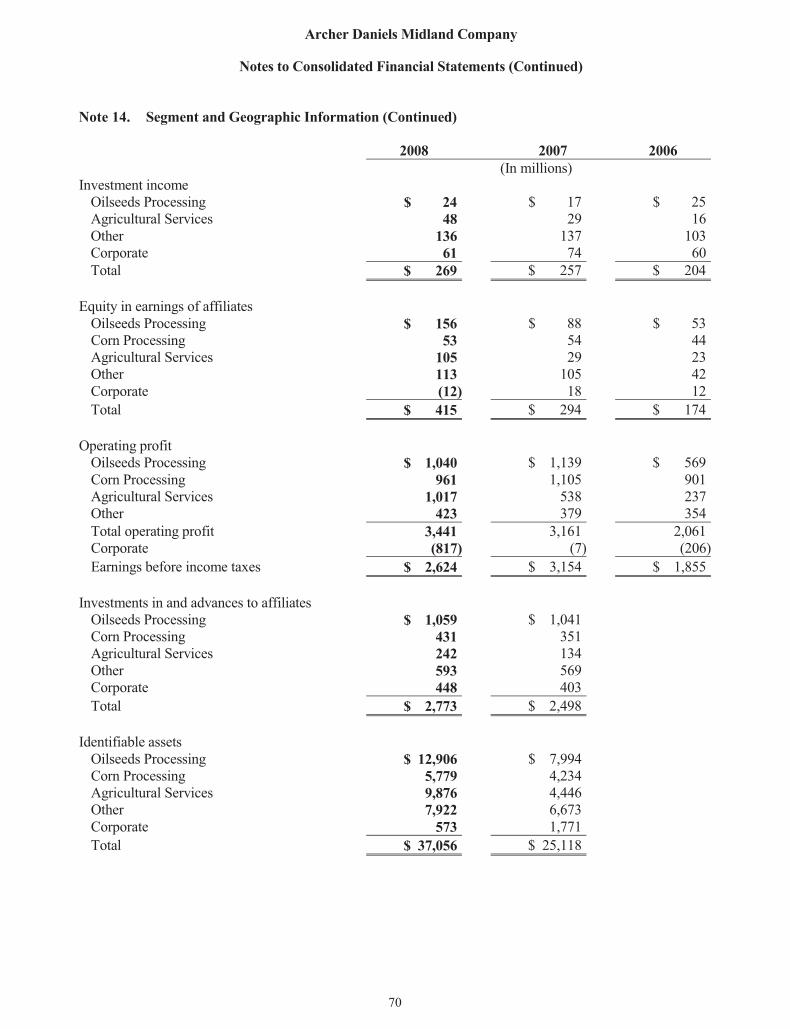
70
Archer Daniels Midland Company
Notes to Consolidated Financial Statements (Continued)
Note 14. Segment and Geographic Information (Continued)
2008 2007 2006(In millions)
Investment incomeOilseeds Processing $ 24 $ 17 $ 25Agricultural Services 48 29 16Other 136 137 103Corporate 61 74 60Total $ 269 $ 257 $ 204
Equity in earnings of affiliatesOilseeds Processing $ 156 $ 88 $ 53Corn Processing 53 54 44Agricultural Services 105 29 23Other 113 105 42Corporate (12) 18 12Total $ 415 $ 294 $ 174
Operating profitOilseeds Processing $ 1,040 $ 1,139 $ 569Corn Processing 961 1,105 901Agricultural Services 1,017 538 237Other 423 379 354Total operating profit 3,441 3,161 2,061Corporate (817) (7) (206)Earnings before income taxes $ 2,624 $ 3,154 $ 1,855
Investments in and advances to affiliatesOilseeds Processing $ 1,059 $ 1,041Corn Processing 431 351Agricultural Services 242 134Other 593 569Corporate 448 403Total $ 2,773 $ 2,498
Identifiable assetsOilseeds Processing $ 12,906 $ 7,994Corn Processing 5,779 4,234Agricultural Services 9,876 4,446Other 7,922 6,673Corporate 573 1,771Total $ 37,056 $ 25,118

71
Archer Daniels Midland Company
Notes to Consolidated Financial Statements (Continued)
Note 14. Segment and Geographic Information (Continued)
2008 2007(In millions)
Gross additions to property, plant, and equipmentOilseeds Processing $ 190 $ 281Corn Processing 979 666Agricultural Services 166 123Other 405 299Corporate 49 35Total $ 1,789 $ 1,404
Geographic information: The following geographic area data include net sales and other operating incomeattributed to the countries based on the location of the subsidiary making the sale and long-lived assets based onphysical location. Long-lived assets represent the sum of the net book value of property, plant, and equipmentplus goodwill related to consolidated businesses.
2008 2007 2006(In millions)
Net sales and other operating incomeUnited States $ 37,466 $ 24,244 $20,358Germany 8,335 6,569 5,396Other foreign 24,015 13,205 10,842
$ 69,816 $ 44,018 $36,596
Long-lived assetsUnited States $ 5,554 $ 4,515Foreign 1,817 1,729
$ 7,371 $ 6,244
Note 15. Guarantees and Commitments
The Company has entered into agreements, primarily debt guarantee agreements related to equity-methodinvestees, which could obligate the Company to make future payments if the primary entity fails to perform itscontractual obligations. The Company has not recorded a liability for payment of these contingent obligations,as the Company believes the fair value of these contingent obligations is immaterial. The Company hascollateral for a portion of these contingent obligations. These contingent obligations totaled $135 million at June30, 2008. Amounts outstanding for the primary entity under these contingent obligations were $62 million atJune 30, 2008.
As of June 30, 2008, the Company has under construction new ethanol, propylene/ethylene glycol, PHA, cocoaproduction facilities, and two cogeneration facilities. As of that date, the Company has entered into purchasecommitments totaling $557 million with third parties related to construction of those facilities.

72
Archer Daniels Midland Company
Notes to Consolidated Financial Statements (Continued)
Note 16. Quarterly Financial Data (Unaudited)
QuarterFirst Second Third Fourth Year
(In millions, except per share amounts)Fiscal 2008
Net Sales $12,828 $16,496 $18,708 $21,784 $69,816Gross Profit 930 948 1,157 807 3,842Net Earnings 441 473 517 372 1,802Basic Earnings PerCommon Share 0.68 0.74 0.80 0.58 2.80
Diluted Earnings PerCommon Share 0.68 0.73 0.80 0.58 2.79
Fiscal 2007Net Sales $ 9,447 $10,976 $11,381 $12,214 $44,018Gross Profit 865 908 746 718 3,237Net Earnings 403 441 363 955 2,162Basic Earnings PerCommon Share 0.61 0.67 0.56 1.48 3.32
Diluted Earnings PerCommon Share 0.61 0.67 0.56 1.47 3.30
Net earnings for the three months and year ended June 30, 2007, include credits to other income for gains of$440 million ($286 million after tax, equal to $0.44 per share) related to exchanging shares of certainunconsolidated affiliates for shares in WIL, $357 million ($225 million after tax, equal to $0.34 per share)related to the Company’s sale of equity securities of Tyson Foods Inc. and Overseas Shipholding Group, Inc.,and $157 million ($99 million after tax, equal to $0.15 per share) related to the sale of businesses. Net earningsfor the three months and year ended June 30, 2007, also includes a charge to other income of $46 million ($29million after tax, equal to $0.04 per share) related to the repurchase of $400 million of the Company’soutstanding debentures and a charge to cost of products sold of $19 million ($12 million after tax, equal to $0.02per share) related to abandonment and write-down of long-lived assets. For the year ended June 30, 2007, netearnings include a credit to other income of $209 million ($132 million after tax, equal to $0.20 per share)related to the sale of businesses.
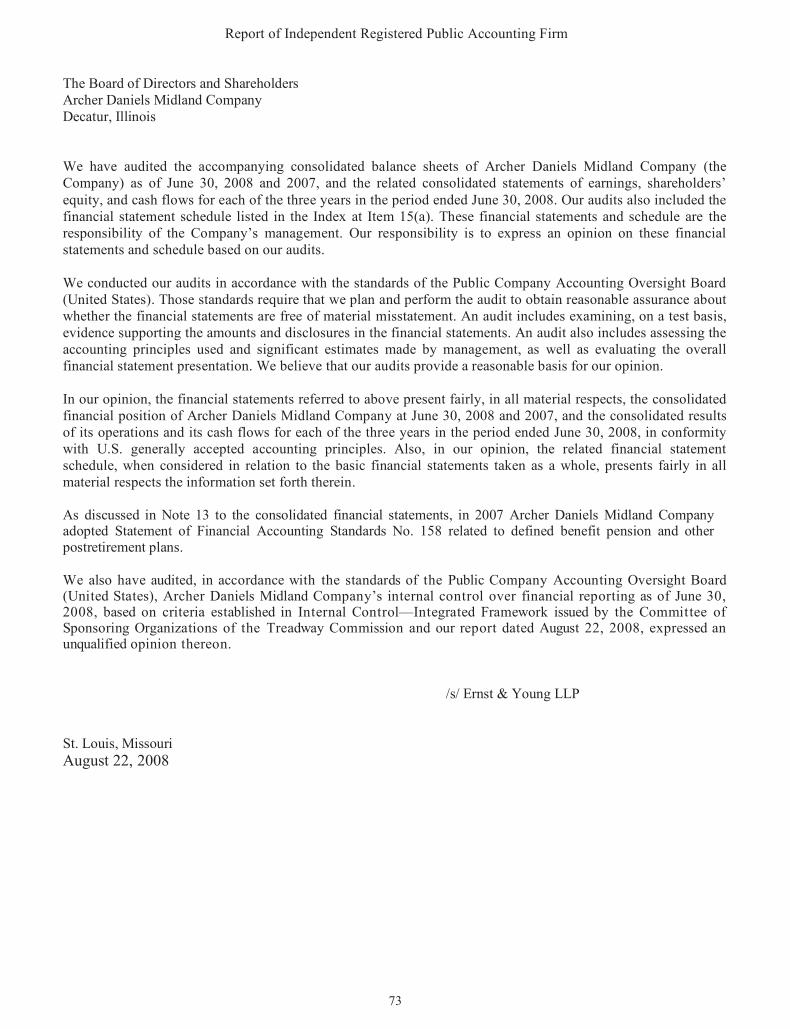
73
Report of Independent Registered Public Accounting Firm
The Board of Directors and Shareholders
Archer Daniels Midland Company
Decatur, Illinois
We have audited the accompanying consolidated balance sheets of Archer Daniels Midland Company (the
Company) as of June 30, 2008 and 2007, and the related consolidated statements of earnings, shareholdersÕ
equity, and cash flows for each of the three years in the period ended June 30, 2008. Our audits also included the
financial statement schedule listed in the Index at Item 15(a). These financial statements and schedule are the
responsibility of the CompanyÕs management. Our responsibility is to express an opinion on these financial
statements and schedule based on our audits.
We conducted our audits in accordance with the standards of the Public Company Accounting Oversight Board
(United States). Those standards require that we plan and perform the audit to obtain reasonable assurance about
whether the financial statements are free of material misstatement. An audit includes examining, on a test basis,
evidence supporting the amounts and disclosures in the financial statements. An audit also includes assessing the
accounting principles used and significant estimates made by management, as well as evaluating the overall
financial statement presentation. We believe that our audits provide a reasonable basis for our opinion.
In our opinion, the financial statements referred to above present fairly, in all material respects, the consolidated
financial position of Archer Daniels Midland Company at June 30, 2008 and 2007, and the consolidated results
of its operations and its cash flows for each of the three years in the period ended June 30, 2008, in conformity
with U.S. generally accepted accounting principles. Also, in our opinion, the related financial statement
schedule, when considered in relation to the basic financial statements taken as a whole, presents fairly in all
material respects the information set forth therein.
As discussed in Note 13 to the consolidated financial statements, in 2007 Archer Daniels Midland Company
adopted Statement of Financial Accounting Standards No. 158 related to defined benefit pension and other
postretirement plans.
We also have audited, in accordance with the standards of the Public Company Accounting Oversight Board
(United States), Archer Daniels Midland CompanyÕs internal control over financial reporting as of June 30,
2008, based on criteria established in Internal ControlÑIntegrated Framework issued by the Committee of
Sponsoring Organizations of the Treadway Commission and our report dated August 22, 2008, expressed an
unqualified opinion thereon.
/s/ Ernst & Young LLP
St. Louis, Missouri
August 22, 2008

Report of Independent Registered Public Accounting Firm
The Board of Directors and Shareholders
Archer Daniels Midland Company
Decatur, Illinois
We have audited Archer Daniels Midland CompanyÕs internal control over financial reporting as of June 30,
2008, based on criteria established in Internal ControlÑIntegrated Framework issued by the Committee of
Sponsoring Organizations of the Treadway Commission (the COSO criteria). Archer Daniels Midland
CompanyÕs management is responsible for maintaining effective internal control over financial reporting, and for
its assessment of the effectiveness of internal control over financial reporting included in the accompanying
ManagementÕs Report on Internal Control Over Financial Reporting. Our responsibility is to express an opinion
on the companyÕs internal control over financial reporting based on our audit.
We conducted our audit in accordance with the standards of the Public Company Accounting Oversight Board
(United States). Those standards require that we plan and perform the audit to obtain reasonable assurance about
whether effective internal control over financial reporting was maintained in all material respects. Our audit
included obtaining an understanding of internal control over financial reporting, assessing the risk that a material
weakness exists, testing and evaluating the design and operating effectiveness of internal control based on the
assessed risk, and performing such other procedures as we considered necessary in the circumstances. We
believe that our audit provides a reasonable basis for our opinion.
A companyÕs internal control over financial reporting is a process designed to provide reasonable assurance
regarding the reliability of financial reporting and the preparation of financial statements for external purposes in
accordance with generally accepted accounting principles. A companyÕs internal control over financial reporting
includes those policies and procedures that (1) pertain to the maintenance of records that, in reasonable detail,
accurately and fairly reflect the transactions and dispositions of the assets of the company; (2) provide
reasonable assurance that transactions are recorded as necessary to permit preparation of financial statements in
accordance with generally accepted accounting principles, and that receipts and expenditures of the company are
being made only in accordance with authorizations of management and directors of the company; and (3)
provide reasonable assurance regarding prevention or timely detection of unauthorized acquisition, use, or
disposition of the companyÕs assets that could have a material effect on the financial statements.
Because of its inherent limitations, internal control over financial reporting may not prevent or detect
misstatements. Also, projections of any evaluation of effectiveness to future periods are subject to the risk that
controls may become inadequate because of changes in conditions, or that the degree of compliance with the
policies or procedures may deteriorate.
In our opinion, Archer Daniels Midland Company maintained, in all material respects, effective internal control
over financial reporting as of June 30, 2008, based on the COSO criteria.
We also have audited, in accordance with the standards of the Public Company Accounting Oversight Board
(United States), the consolidated balance sheets of Archer Daniels Midland Company as of June 30, 2008 and
2007, and the related consolidated statements of earnings, shareholdersÕ equity, and cash flows for each of the
three years in the period ended June 30, 2008, of Archer Daniels Midland Company and our report dated
August 22, 2008, expressed an unqualified opinion thereon.
/s/ Ernst & Young LLP
St. Louis, Missouri
August 22, 2008
74
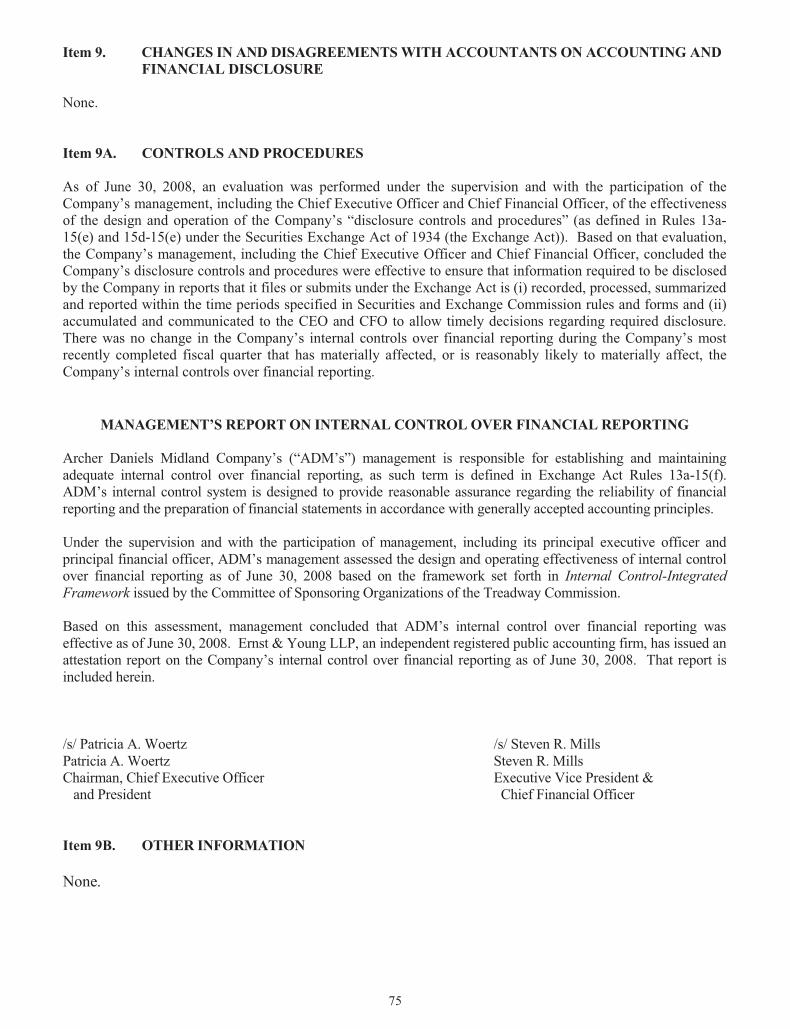
75
Item 9. CHANGES IN AND DISAGREEMENTS WITH ACCOUNTANTS ON ACCOUNTING ANDFINANCIAL DISCLOSURE
None.
Item 9A. CONTROLS AND PROCEDURES
As of June 30, 2008, an evaluation was performed under the supervision and with the participation of theCompany’s management, including the Chief Executive Officer and Chief Financial Officer, of the effectivenessof the design and operation of the Company’s “disclosure controls and procedures” (as defined in Rules 13a-15(e) and 15d-15(e) under the Securities Exchange Act of 1934 (the Exchange Act)). Based on that evaluation,the Company’s management, including the Chief Executive Officer and Chief Financial Officer, concluded theCompany’s disclosure controls and procedures were effective to ensure that information required to be disclosedby the Company in reports that it files or submits under the Exchange Act is (i) recorded, processed, summarizedand reported within the time periods specified in Securities and Exchange Commission rules and forms and (ii)accumulated and communicated to the CEO and CFO to allow timely decisions regarding required disclosure.There was no change in the Company’s internal controls over financial reporting during the Company’s mostrecently completed fiscal quarter that has materially affected, or is reasonably likely to materially affect, theCompany’s internal controls over financial reporting.
MANAGEMENT’S REPORT ON INTERNAL CONTROL OVER FINANCIAL REPORTING
Archer Daniels Midland Company’s (“ADM’s”) management is responsible for establishing and maintainingadequate internal control over financial reporting, as such term is defined in Exchange Act Rules 13a-15(f).ADM’s internal control system is designed to provide reasonable assurance regarding the reliability of financialreporting and the preparation of financial statements in accordance with generally accepted accounting principles.
Under the supervision and with the participation of management, including its principal executive officer andprincipal financial officer, ADM’s management assessed the design and operating effectiveness of internal controlover financial reporting as of June 30, 2008 based on the framework set forth in Internal Control-IntegratedFramework issued by the Committee of Sponsoring Organizations of the Treadway Commission.
Based on this assessment, management concluded that ADM’s internal control over financial reporting waseffective as of June 30, 2008. Ernst & Young LLP, an independent registered public accounting firm, has issued anattestation report on the Company’s internal control over financial reporting as of June 30, 2008. That report isincluded herein.
/s/ Patricia A. Woertz /s/ Steven R. MillsPatricia A. Woertz Steven R. MillsChairman, Chief Executive Officer Executive Vice President &
and President Chief Financial Officer
OTHER INFORMATIONItem 9B.
None.

76
PART III
Item 10. DIRECTORS, EXECUTIVE OFFICERS AND CORPORATE GOVERNANCE
Information with respect to directors, executive officers, code of conduct, audit committee and audit committeefinancial experts of the Company, and Section 16(a) beneficial ownership reporting compliance is set forth in“Proposal No. 1 - Election of Directors for a One-Year Term,” “Code of Conduct,” “Information ConcerningCommittees and Meetings – Audit Committee,” “Report of the Audit Committee,” and “Section 16(a) BeneficialOwnership Reporting Compliance,” of the definitive proxy statement for the Company’s annual meeting ofstockholders to be held on November 6, 2008 and is incorporated herein by reference.
Information with respect to executive officers and certain significant employees of the Company is set forth below.Except as otherwise indicated, all positions are with the Company.
Name Title Age
Ronald S. Bandler Assistant Treasurer from January 1998. Manager ofTreasury Operations from 1989 to January 1998.
47
Lewis W. Batchelder Senior Vice President from December 2001. Group VicePresident from July 1997 to December 2001. President ofGrain Operations from March 2001 to August 2006.
63
Mark A. Bemis Vice President from February 2005. President of ADMCocoa from September 2001. Vice President and GeneralManager, North American Division-ADM Cocoa fromMarch 1999 to September 2001. Various merchandisingand management positions from 1983 to March 1999.
47
Mark J. Cheviron Vice President from July 1997. Vice President of CorporateSecurity and Administrative Services since May 1997.Director of Security since 1980.
59
Michael D’Ambrose Senior Vice President from October 2006. IndependentConsultant from 2005 to October 2006. Executive VicePresident, Human Resources at First Data from 2003 to2005. Executive Vice President, Human Resources for ToysR Us from 2001 to 2003.
51
Edward A. Harjehausen Senior Vice President from February 2005. Group VicePresident from March 2002 to February 2005. President ofADM Bioproducts and Feed Division from March 2002 toJune 2005. President of ADM Corn Processing Divisionfrom July 2000 to June 2005. Vice President from October1992 to March 2002. President of ADM Bioproducts andFood Additives from October 1999 to July 2000.
58
Shannon Herzfeld Vice President from February 2005. Senior Vice President-International Affairs with Pharmaceutical Research andManufacturers of America (PhRMA) trade association fromJanuary 1998 to December 2004. Director-InternationalTrade Services with Akin, Gump, Strauss, Hauer & Feld,L.L.P from 1985 to 1997.
56

77
Item 10. DIRECTORS, EXECUTIVE OFFICERS AND CORPORATE GOVERNANCE(Continued)
Craig E. Huss Vice President from January 2001. President of ADMTransportation from 1999. Various grain elevator andmerchandising management positions from 1976 to 1999.
56
Matthew J. Jansen Vice President from January 2003. President-Grain Operationsfrom August 2006. President, South American OilseedProcessing Division from April 2000 to August 2006. VicePresident, South American Oilseed Processing Division fromAugust 1999 to April 2000. Various merchandisingmanagement positions from 1989 to 1999.
42
Michael Lusk Vice President from November 1999. Senior Vice Presidentwith AON/ International Risk Management Company, Inc.from 1989 to November 1999.
59
Vikram Luthar Vice President and Treasurer from November 2004. Varioustreasury positions with General Motors Corporation from 1993to 2004.
41
Steven R. Mills Executive Vice President and Chief Financial Officer fromMarch 2008. Senior Vice President from December 2006 toFebruary 2008. Group Vice President and Controller fromJanuary 2002 to December 2006. Vice President fromFebruary 2000 to January 2002. Controller from October 1994to December 2006.
53
Victoria Podesta Vice President from May 2007. Corporate communicationsconsultant for various global companies from 1989 to May2007.
52
John D. Rice Executive Vice President from February 2005. Senior VicePresident from February 2000 to February 2005. Group VicePresident and President, North American Oilseed ProcessingDivision from February 1999 to February 2000. VicePresident from 1993 to February 1999. President of ADMFood Oils Division from December 1996 to February 2000.
54
Dennis C. Riddle Vice President from May 2006. President ADM CornProcessing Division from June 2005. Senior Vice President –Sweeteners & Starches from May 2004 to June 2005. VicePresident, Sales & Marketing for ADM Corn ProcessingDivision from April 1999 to May 2004.
61
Scott A. Roberts Assistant Secretary and Assistant General Counsel from July1997. Member of the Law Department since 1985.
48
Ismael Roig Vice President from December 2004. Various finance andcontrol positions with General Motors Corporation from 1993to 2004.
41

78
Item 10. DIRECTORS, EXECUTIVE OFFICERS AND CORPORATE GOVERNANCE(Continued)
Scott A. Roney Vice President from April 2001. Member of the LawDepartment from 1991 to April 2001.
44
David J. Smith Executive Vice President, Secretary and General Counselfrom January 2003. Senior Vice President, Secretary andGeneral Counsel from January 2002 to January 2003. VicePresident, Secretary and General Counsel from July 1997 toJanuary 2002. Assistant General Counsel from 1995 to July1997. Assistant Secretary from 1988 to July 1997.
53
John P. Stott Vice President and Controller from December 2006.Operations Controller from July 2005 to December 2006.Finance Director-Europe from January 2001 to July 2005.Various financial and treasury positions from 1992 to 2001.
41
Patricia A. Woertz Chairman of the Board of Directors from February 2007.Chief Executive Officer & President from May 2006.Executive Vice President Downstream at ChevronCorporation from October 2001 to March 2006. VicePresident at Chevron Corporation from 1998 to 2001.President of Chevron Products Company from 1998 to 2001.
55
Mark N. Zenuk Vice President from August 2005. Managing Director-ADMInternational, Ltd. from June 2005 to September 2007.Various merchandising management positions from 2000 to2005.
41
Officers of the Company are elected by the Board of Directors for terms of one year and untiltheir successors are duly elected and qualified.
Item 11. EXECUTIVE COMPENSATION
Information responsive to this Item is set forth in “Compensation Discussion and Analysis,”“Compensation/Succession Committee Report,” “Compensation/Succession Committee Interlocks and InsiderParticipation,” “Summary Compensation Table,” “Grants of Plan-Based Awards During Fiscal 2008,”“Outstanding Equity Awards at Fiscal 2008 Year-End,” “Option Exercises and Stock Vested During Fiscal 2008,”“Pension Benefits,” “Nonqualified Deferred Compensation,” “Termination of Employment and Change-in-ControlArrangements” and “Director Compensation for Fiscal 2008” of the definitive proxy statement for the Company’sannual meeting of stockholders to be held on November 6, 2008, and is incorporated herein by reference.
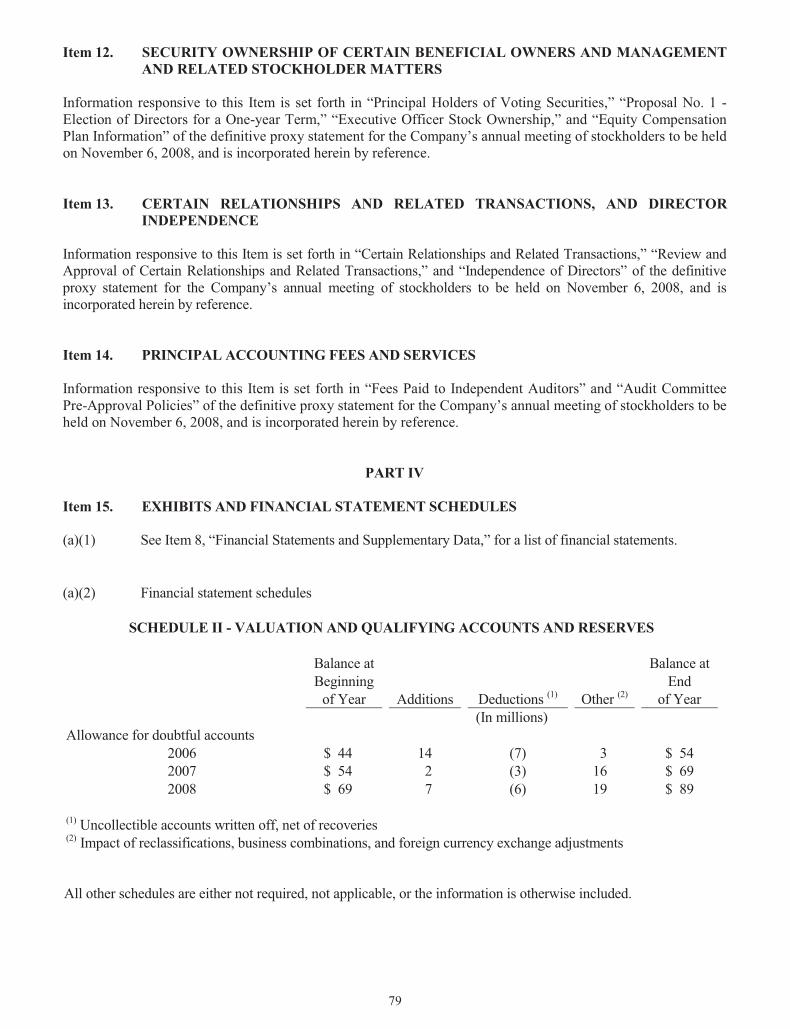
79
Item 12. SECURITY OWNERSHIP OF CERTAIN BENEFICIAL OWNERS AND MANAGEMENTAND RELATED STOCKHOLDER MATTERS
Information responsive to this Item is set forth in “Principal Holders of Voting Securities,” “Proposal No. 1 -Election of Directors for a One-year Term,” “Executive Officer Stock Ownership,” and “Equity CompensationPlan Information” of the definitive proxy statement for the Company’s annual meeting of stockholders to be heldon November 6, 2008, and is incorporated herein by reference.
Item 13. CERTAIN RELATIONSHIPS AND RELATED TRANSACTIONS, AND DIRECTORINDEPENDENCE
Information responsive to this Item is set forth in “Certain Relationships and Related Transactions,” “Review andApproval of Certain Relationships and Related Transactions,” and “Independence of Directors” of the definitiveproxy statement for the Company’s annual meeting of stockholders to be held on November 6, 2008, and isincorporated herein by reference.
Item 14. PRINCIPAL ACCOUNTING FEES AND SERVICES
Information responsive to this Item is set forth in “Fees Paid to Independent Auditors” and “Audit CommitteePre-Approval Policies” of the definitive proxy statement for the Company’s annual meeting of stockholders to beheld on November 6, 2008, and is incorporated herein by reference.
PART IV
Item 15. EXHIBITS AND FINANCIAL STATEMENT SCHEDULES
(a)(1) See Item 8, “Financial Statements and Supplementary Data,” for a list of financial statements.
(a)(2) Financial statement schedules
SCHEDULE II - VALUATION AND QUALIFYING ACCOUNTS AND RESERVES
Balance at Balance atBeginning End
of Year Additions Deductions (1) Other (2) of Year(In millions)
Allowance for doubtful accounts2006 $ 44 14 (7) 3 $ 542007 $ 54 2 (3) 16 $ 692008 $ 69 7 (6) 19 $ 89
(1) Uncollectible accounts written off, net of recoveries(2) Impact of reclassifications, business combinations, and foreign currency exchange adjustments
All other schedules are either not required, not applicable, or the information is otherwise included.

80
Item 15. EXHIBITS AND FINANCIAL STATEMENT SCHEDULES (Continued)
(a)(3) LIST OF EXHIBITS
(3) (i) Composite Certificate of Incorporation, as amended, filed on November 13, 2001, as Exhibit (3)(i)to Form 10-Q for the quarter ended September 30, 2001 (File No. 1-44), is incorporated herein byreference.
(ii) Bylaws, as amended, filed on February 6, 2007, as Exhibit 3(ii) to Form 8-K (File No. 1-44), areincorporated herein by reference.
(4) Instruments defining the rights of security holders, including:
(i) Indenture dated June 1, 1986, between the registrant and JPMorgan Chase (formerly known as, orsuccessor to, The Chase Manhattan Bank, Chemical Bank, and Manufacturers Hanover TrustCompany), as Trustee (incorporated by reference to Exhibit 4(a) to Registration Statement No. 33-6721), and Supplemental Indenture dated as of August 1, 1989 between the registrant andJPMorgan Chase (formerly known as, or successor to, The Chase Manhattan Bank, ChemicalBank and Manufacturers Hanover Trust Company), as Trustee (incorporated by reference toExhibit 4(c) to Post-Effective Amendment No. 3 to Registration Statement No. 33-6721), relatingto:
the $300,000,000 – 8 7/8% Debentures due April 15, 2011,the $300,000,000 – 8 3/8% Debentures due April 15, 2017,the $300,000,000 – 8 1/8% Debentures due June 1, 2012,the $250,000,000 – 7 1/8% Debentures due March 1, 2013,the $350,000,000 – 7 1/2% Debentures due March 15, 2027,the $200,000,000 – 6 3/4% Debentures due December 15, 2027,the $250,000,000 – 6 7/8% Debentures due December 15, 2097,the $196,210,000 – 5 7/8% Debentures due November 15, 2010,the $300,000,000 – 6 5/8% Debentures due May 1, 2029,the $400,000,000 – 7% Debentures due February 1, 2031,the $500,000,000 – 5.935% Debentures due October 1, 2032, andthe $600,000,000 – 5.375% Debentures due September 15, 2035.
(ii) Indenture dated September 20, 2006, between the Company and The Bank of New York, asTrustee (incorporated by reference to Exhibit 4 to Registration Statement on Form S-3,Registration No. 333-137541), relating to:
the $500,000,000 – 6.45% Debentures due January 15, 2038,the $700,000,000 – 5.45% Notes due March 15, 2015, andthe $1,750,000,000 – 4.70% Debentures due June 1, 2041.
(iii) Indenture dated February 22, 2007, between the Company and The Bank of New York, as Trustee,including form of 0.875% Convertible Senior Notes due 2014 (incorporated by reference toExhibit 4.1 to Form 8-K (File No. 1-44) filed on February 22, 2007).
(iv) Registration Rights Agreement, dated February 22, 2007, among the Company, Citigroup GlobalMarkets Inc., J.P. Morgan Securities Inc., Merrill Lynch & Co., Merrill Lynch, Pierce, Fenner &Smith Incorporated, Banc of America Securities LLC, Barclays Capital Inc., BNP ParibasSecurities Corp., Deutsche Bank Securities Inc., Goldman, Sachs & Co. and HSBC Securities(USA) Inc. (incorporated by reference to Exhibit 4.2 to Form 8-K (File No. 1-44) filed onFebruary 22, 2007).

81
Item 15. EXHIBITS AND FINANCIAL STATEMENT SCHEDULES (Continued)
Copies of constituent instruments defining rights of holders of long-term debt of the Company andSubsidiaries, other than the Indentures specified herein, are not filed herewith, pursuant toInstruction (b)(4)(iii)(A) to Item 601 of Regulation S-K, because the total amount of securitiesauthorized under any such instrument does not exceed 10% of the total assets of the Company andSubsidiaries on a consolidated basis. The registrant hereby agrees that it will, upon request by theSEC, furnish to the SEC a copy of each such instrument.
(v) Purchase Contract and Pledge Agreement, dated as of June 3, 2008, among ADM, The Bank ofNew York as Purchase Contract Agent, and the Bank of New York as Collateral Agent, CustodialAgent, and Securities Intermediary, including form of Corporate Units, form of Treasury Unitsand form of Remarketing Agreement (incorporated by reference to Exhibit 4.1 to Form 8-K (FileNo. 1-44) filed on June 3, 2008.
(10) Material Contracts - Copies of the Company’s stock option and stock unit plans, deferred compensationplan, and savings and investment plans, pursuant to Instruction (b)(10)(iii)(A) to Item 601 of RegulationS-K, each of which is a management contract or compensation plan or arrangement required to be filedas an exhibit pursuant to Item 15(b) of Form 10-K, are incorporated herein by reference as follows:
(i) Exhibits 4(c) and 4(d) to Registration Statement No. 33-49409 on Form S-8 dated March 15,1993, relating to the Archer Daniels Midland 1991 Incentive Stock Option Plan and ArcherDaniels Midland Company Savings and Investment Plan.
(ii) Exhibits 4(c) and 4(d) to Registration Statement No. 333-39605 on Form S-8 dated November 5,1997, relating to the ADM Savings and Investment Plan for Salaried Employees and the ADMSavings and Investment Plan for Hourly Employees.
(iii) The Archer-Daniels-Midland 1996 Stock Option Plan (incorporated by reference to Exhibit A tothe Company’s Definitive Proxy Statement filed with the Securities and Exchange Commission onSeptember 25, 1996 (File No. 1-44)).
(iv) The Archer-Daniels-Midland Company Amended and Restated Stock Unit Plan for NonemployeeDirectors (incorporated by reference to Exhibit 99.3 to the Company’s Current Report on Form8-K filed with the Securities and Exchange Commission on December 23, 2004 (File No. 1-44)).
(v) Exhibits 4(c) and 4(d) to Registration Statement No. 333-75073 on Form S-8 dated March 26,1999, relating to the ADM Employee Stock Ownership Plan for Salaried Employees and the ADMEmployee Stock Ownership Plan for Hourly Employees.
(vi) The Archer-Daniels-Midland Company Incentive Compensation Plan (incorporated by referenceto Exhibit A to the Company’s Definitive Proxy Statement filed with the Securities and ExchangeCommission on September 15, 1999, (File No. 1-44)).
(vii) Exhibits 4.3 and 4.4 to Registration Statement No. 333-42612 on Form S-8 dated July 31, 2000,relating to the ADM 401(k) Plan for Salaried Employees and the ADM 401(k) Plan for HourlyEmployees, as amended by Post-Effective Amendment No. 1 to Registration Statement No. 333-42612 on Form S-8 dated August 8, 2000.
(viii) ADM Deferred Compensation Plan for Selected Management Employees II (as adopted as ofDecember 1, 2004) (incorporated by reference to Exhibit 99.1 to the Company’s Current Report onForm 8-K filed with the Securities and Exchange Commission on December 23, 2004 (File No. 1-44)).

82
Item 15. EXHIBITS AND FINANCIAL STATEMENT SCHEDULES (Continued)
(ix) ADM Supplemental Retirement Plan II (as adopted as of December 1, 2004) (incorporated byreference to Exhibit 99.2 to the Company’s Current Report on Form 8-K filed with the Securitiesand Exchange Commission on December 23, 2004 (File No. 1-44)).
(x) The Archer-Daniels-Midland 2002 Incentive Compensation Plan (incorporated by reference toExhibit A to the Company’s Definitive Proxy Statement filed with the Securities and ExchangeCommission on September 25, 2002 (File No. 1-44)).
(xi) Management Compensation Arrangements (incorporated by reference to Exhibit 10.1 to theCompany’s Quarterly Report on Form 10-Q for the quarter ended March 31, 2005 (File No. 1-44)).
(xii) Form of Stock Option Agreement (incorporated by reference to Exhibit 10.2 to the Company’sQuarterly Report on Form 10-Q for the quarter ended March 31, 2005 (File No. 1-44)).
(xiii) Form of Restricted Stock Agreement (incorporated by reference to Exhibit 10.3 to the Company’sQuarterly Report on Form 10-Q for the quarter ended March 31, 2005 (File No. 1-44)).
(xiv) Separation Agreement between Archer-Daniels-Midland Company and Paul B. Mulhollem datedSeptember 29, 2005, filed on September 30, 2005, as Exhibit 10 to the Company’s Current Reporton Form 8-K (File No. 1-44)
(xv) Agreement Regarding Terms of Employment dated April 27, 2006 with Patricia A. Woertz, filedon May 1, 2006, as Exhibit 10.1 to the Company’s Current Report on Form 8-K (File No. 1-44).
(xvi) Transition Agreement between Archer-Daniels-Midland Company and G. Allen Andreas datedMay 5, 2006 filed on May 8, 2006, as Exhibit 10.1 to the Company’s Current Report on Form 8-K(File No. 1-44).
(xvii) Annual Cash Incentive Program (incorporated by reference to description thereof included in Item5.02 of the Company’s Current Report on Form 8-K (File No. 1-44) filed on July 3, 2007).
(xviii) Separation Agreement dated as of November 26, 2007, between Archer-Daniels-MidlandCompany and William H. Camp, filed on November 30, 2007, as Exhibit 10.1 to the Company’sCurrent Report on Form 8-K (File No. 1-44).
(xix) Separation Agreement dated as of February 6, 2008, between Archer-Daniels-Midland Companyand Douglas J. Schmalz, filed on February 7, 2008, as Exhibit 10.1 to the Company’s CurrentReport on Form 8-K (File No. 1-44).
(21) Subsidiaries of the registrant.
(23) Consent of independent registered public accounting firm.
(24) Powers of attorney.
(31.1) Certification of Chief Executive Officer pursuant to Rule 13a–14(a) and Rule 15d–14(a) of theSecurities Exchange Act, as amended.
(31.2) Certification of Chief Financial Officer pursuant to Rule 13a–14(a) and Rule 15d–14(a) of theSecurities Exchange Act, as amended.
83
Item 15. EXHIBITS AND FINANCIAL STATEMENT SCHEDULES (Continued)
(32.1) Certification of Chief Executive Officer pursuant to 18 U.S.C. 1350, as adopted pursuant to Section 906of the Sarbanes-Oxley Act of 2002.
(32.2) Certification of Chief Financial Officer pursuant to 18 U.S.C. 1350, as adopted pursuant to Section 906of the Sarbanes-Oxley Act of 2002.

84
SIGNATURES
Pursuant to the requirements of Section 13 or 15(d) of the Securities Exchange Act of 1934, the Registrant has dulycaused this report to be signed on its behalf by the undersigned, thereunto duly authorized.
Date: August 28, 2008
ARCHER-DANIELS-MIDLAND COMPANY
By: /s/ D. J. SmithD. J. SmithExecutive Vice President, Secretaryand General Counsel
Pursuant to the requirements of the Securities Exchange Act of 1934, this report has been signed below onAugust 28, 2008, by the following persons on behalf of the Registrant and in the capacities indicated.
/s/ P. A. Woertz /s/ V. F. HaynesP. A. Woertz, V. F. Haynes *,Chairman, Chief Executive Officer, Presidentand Director
Director
(Principal Executive Officer)/s/ A. Maciel
/s/ S. R. Mills A. Maciel*,S. R. Mills DirectorExecutive Vice President andChief Financial Officer /s/ P. J. Moore(Principal Financial Officer) P. J. Moore*,
Director/s/ J. P. StottJ. P. Stott /s/ M. B. MulroneyVice President and Controller M. B. Mulroney*,(Controller) Director
/s/ A. L. Boeckmann /s/ T. F. O’NeillA. L. Boeckmann*, T. F. O’Neill*,Director Director
/s/ G. W. Buckley /s/ K. R. WestbrookG. W. Buckley*, K. R. Westbrook*,Director Director
/s/ M. H. Carter /s/ D. J. SmithM. H. Carter*, Attorney-in-FactDirector
*Powers of Attorney authorizing S. R. Mills, J. P. Stott, and D. J. Smith, and each of them, to sign the Form 10-Kon behalf of the above-named officers and directors of the Company, copies of which are being filed with theSecurities and Exchange Commission.

Copies of the Company’s annual report to the Securities and Exchange Commission on Form 10-K will be available to
Stockholders without charge upon written request to the Investor Relations Department.
Archer Daniels Midland Company is an equal opportunity employer.
Notice of ANNuAl MeetiNg
The Annual Meeting of Stockholders of the Company will be held at the
James R. Randall Research Center at 1001 Brush College Road in Decatur,
IL, on Thursday, November 6, 2008, commencing at 10:30 a.m. Proxies will
be requested by Management on or about September 25, 2008, at which
time a Proxy Statement and Form of Proxy will be sent to Stockholders.
executive certificAtioNs
The Company’s 2008 Annual Report on Form 10-K filed with the Securities
and Exchange Commission includes, as Exhibit 31, certifications of the
Company’s Chief Executive Officer and Chief Financial Officer as required by
Section 302 of the Sarbanes-Oxley Act of 2002. On November 26, 2007,
the Company submitted to the New York Stock Exchange (NYSE)
a certificate of the Chief Executive Officer certifying that she is not
aware of any violation by the Company of the NYSE corporate governance
listing standards.
stockholder INFORMATION
stock exchANges
Archer Daniels Midland Company
common stock is listed and traded
on the New York Stock Exchange
and the Frankfurt Stock Exchange.
Ticker Symbol: ADM.
trANsfer AgeNt ANd registrAr
Hickory Point Bank and Trust, fsb
1099 W. Wood St., Suite G
Decatur, IL 62522
888.740.5512
iNdepeNdeNt Auditors
Ernst & Young L.L.P., St. Louis, MO
sAfe hArbor stAteMeNt The annual report contains forward - looking information that is subject to certain risks and uncertainties, which could cause actual results to differ materially from those projected, expressed or implied by such forward - looking information. In some cases, you can identify forward - looking statements by our use of words such as “may, will, should, anticipates, believes, expects, plans, future, intends, could, estimate, predict, potential or contingent,” the negative of these terms, or other, similar expressions. The Company’s actual results could differ materially from those discussed or implied herein. Factors that could cause or contribute to such differences include, but are not limited to, those discussed in the Company’s Form 10 - K for the fiscal year ended June 30, 2008. Among these risks are legislative acts, changes in the prices of food, feed and other commodities, including gasoline, and macroeconomic conditions in various parts of the world. To the extent permitted under applicable law, the Company assumes no obligation to update any forward - looking statements as a result of new information or future events.
MAiliNg Address
Archer Daniels Midland Company
P.O. Box 1470
Decatur, IL 62525
U.S.A.
phoNe NuMber
Investor Relations
217.424.4647
iNterNet
www.admworld.com
priNted oN Mohawk Options
and Domtar Lynx Opaque
ADM BELIEvES Agriculture HAS ANswers TO SOME OF THE MOST PRESSING chAlleNges FACING OUR PLANET AND ITS PEOPLE.
As one of the world’s leading agricultural processors, ADM benefits from unrivaled global reach, strong relationships with farmers, and an extraordinary range of logistical, analytical and technological assets that enable us to serve thousands of customers efficiently and profitably.
IN SHORT, we’re vitAl to the world. And by continuing to evolve and diversify in response to changing global needs, ADM believes our vital role in the agricultural processing value chain will only grow over time.
That’s why our 27,600 employees are hard at work transforming corn, oilseeds, cocoa, wheat and other crops into food, feed, fuel and industrial products needed to sustain a rapidly growing and increasingly prosperous global population.
DE
SIG
N:
vS
A P
AR
TNE
RS
, C
HIC
AG
O
PR
INC
IPA
L P
HO
TOG
RA
PH
Y: J
EFF
CO
RW
IN,
HO
WA
RD
BJO
RN
SO
N
PR
INTI
NG
: TH
E H
EN
NEG
AN
CO
MPA
NY,
A C
ON
SO
LID
ATE
D G
RA
PH
ICS
CO
MPA
NY

Archer Daniels Midland Company 2008 Annual Report
nouRishMent
ConneCtion
eneRgy
pRogRess
vital
the world
tonouRishMent
ConneCtion
eneRgy
pRogRess
Archer D
aniels Midland C
ompany
20
08
Annual R
eportvitA
l to th
e wo
RlD