Embed Size (px)
DESCRIPTION
Citation preview
2Q11 2Q11 ConferenceConference CallCallJuly 29, 2011July 29, 2011
DISCLAIMER
This presentation contains forward-looking statements regarding the
prospects of the business, estimates for operating and financial results, and
those regarding Cia. Hering's growth prospects. These are merely projections
and, as such, are based exclusively on the expectations of Cia. Hering
management concerning the future of the business and its continued access
This presentation contains forward-looking statements regarding the
prospects of the business, estimates for operating and financial results, and
those regarding Cia. Hering's growth prospects. These are merely projections
and, as such, are based exclusively on the expectations of Cia. Hering
management concerning the future of the business and its continued accessmanagement concerning the future of the business and its continued access
to capital to fund the Company’s business Plan. Such forward-looking
statements depend, substantially, on changes in market conditions,
government regulations, competitive pressures, the performance of the
Brazilian economy and the industry, among other factors and risks disclosed
in Cia. Hering’s filed disclosure documents and are, therefore, subject to
change without prior notice.
management concerning the future of the business and its continued access
to capital to fund the Company’s business Plan. Such forward-looking
statements depend, substantially, on changes in market conditions,
government regulations, competitive pressures, the performance of the
Brazilian economy and the industry, among other factors and risks disclosed
in Cia. Hering’s filed disclosure documents and are, therefore, subject to
change without prior notice.
AGENDAAGENDA
HighlightsHighlights
2Q11 2Q11 OperationalOperational
3
2Q11 2Q11 OperationalOperationalPerformancePerformance
OutlooksOutlooks
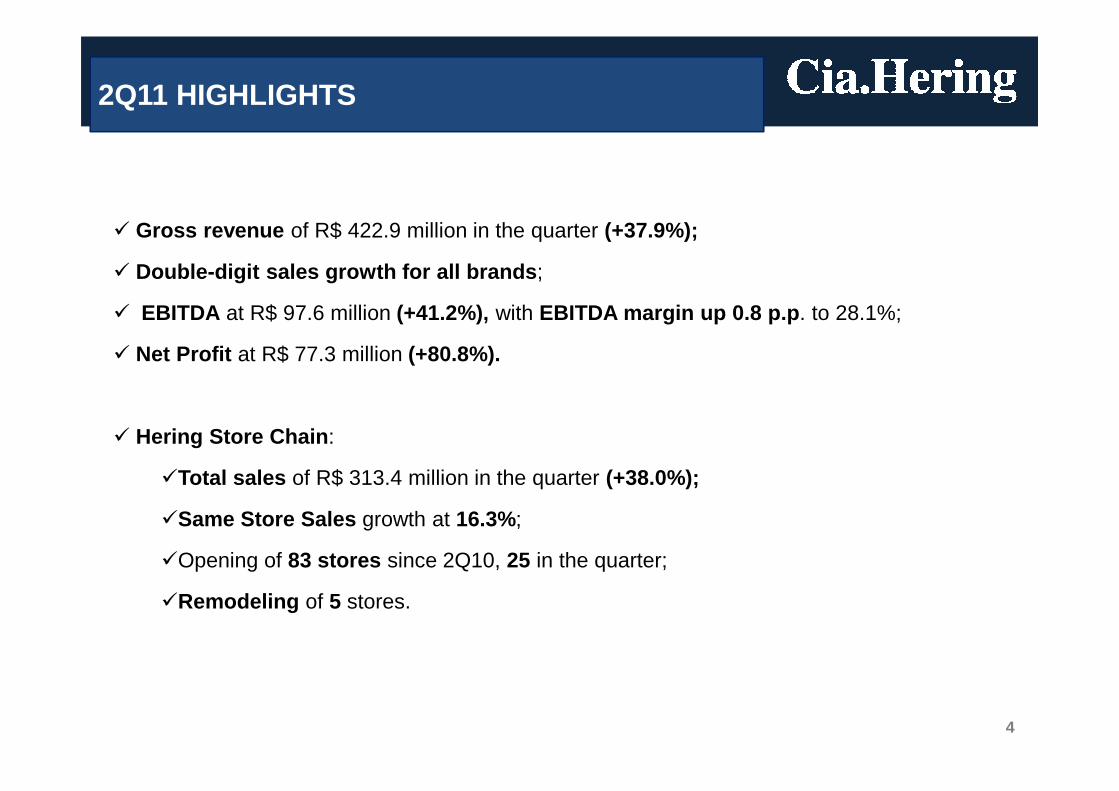
2Q11 HIGHLIGHTS
� Gross revenue of R$ 422.9 million in the quarter (+37.9%);
� Double-digit sales growth for all brands ;
� EBITDA at R$ 97.6 million (+41.2%), with EBITDA margin up 0.8 p.p . to 28.1%;
� Net Profit at R$ 77.3 million (+80.8%).
4
� Hering Store Chain :
�Total sales of R$ 313.4 million in the quarter (+38.0%);
�Same Store Sales growth at 16.3%;
�Opening of 83 stores since 2Q10, 25 in the quarter;
�Remodeling of 5 stores.
AGENDAAGENDA
HighlightsHighlights
2Q11 2Q11 OperationalOperational2Q11 2Q11 OperationalOperationalPerformancePerformance
OutlooksOutlooks
4.6
5.8
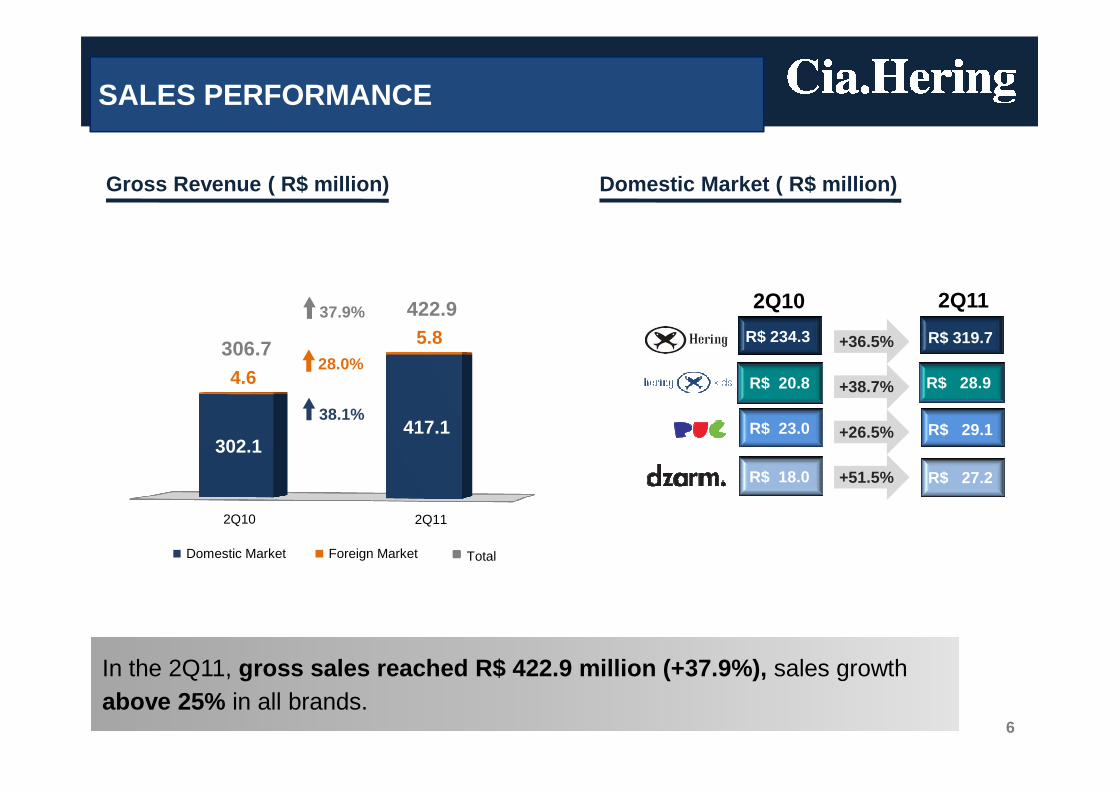
Gross Revenue ( R$ million)
SALES PERFORMANCE
Domestic Market ( R$ million)
R$ 234.3 R$ 319.7+36.5%
R$ 20.8 R$ 28.9+38.7%
2Q10 2Q11
306.7
422.937.9%
28.0%
302.1 417.1
6
In the 2Q11, gross sales reached R$ 422.9 million (+37.9%), sales growthabove 25% in all brands.
Domestic Market Foreign Market Total
R$ 23.0
R$ 18.0
R$ 29.1
R$ 27.2
+26.5%
+51.5%
38.1%
2Q10 2Q11
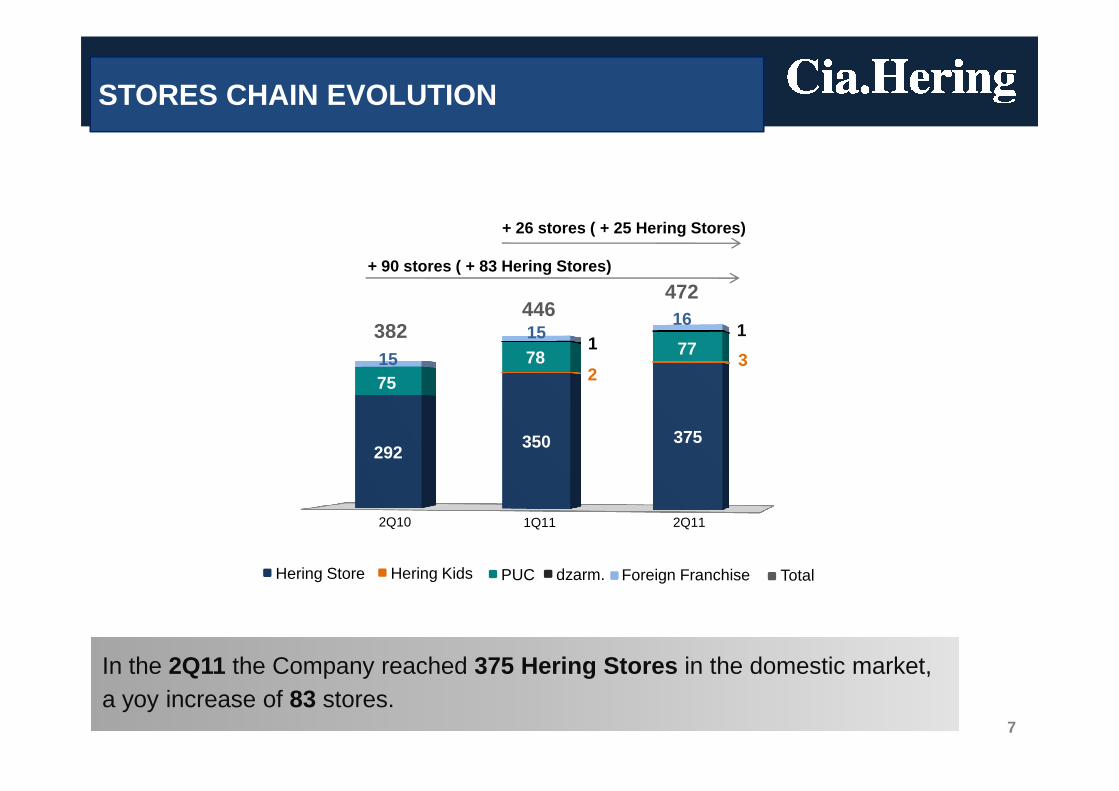
STORES CHAIN EVOLUTION
23
7578 771
1
15
1516
472
382446
+ 26 stores ( + 25 Hering Stores)
+ 90 stores ( + 83 Hering Stores)
7
In the 2Q11 the Company reached 375 Hering Stores in the domestic market, a yoy increase of 83 stores.
292350 375
Hering Store Hering Kids PUC dzarm. Foreign Franchise Total
2Q10 2Q111Q11
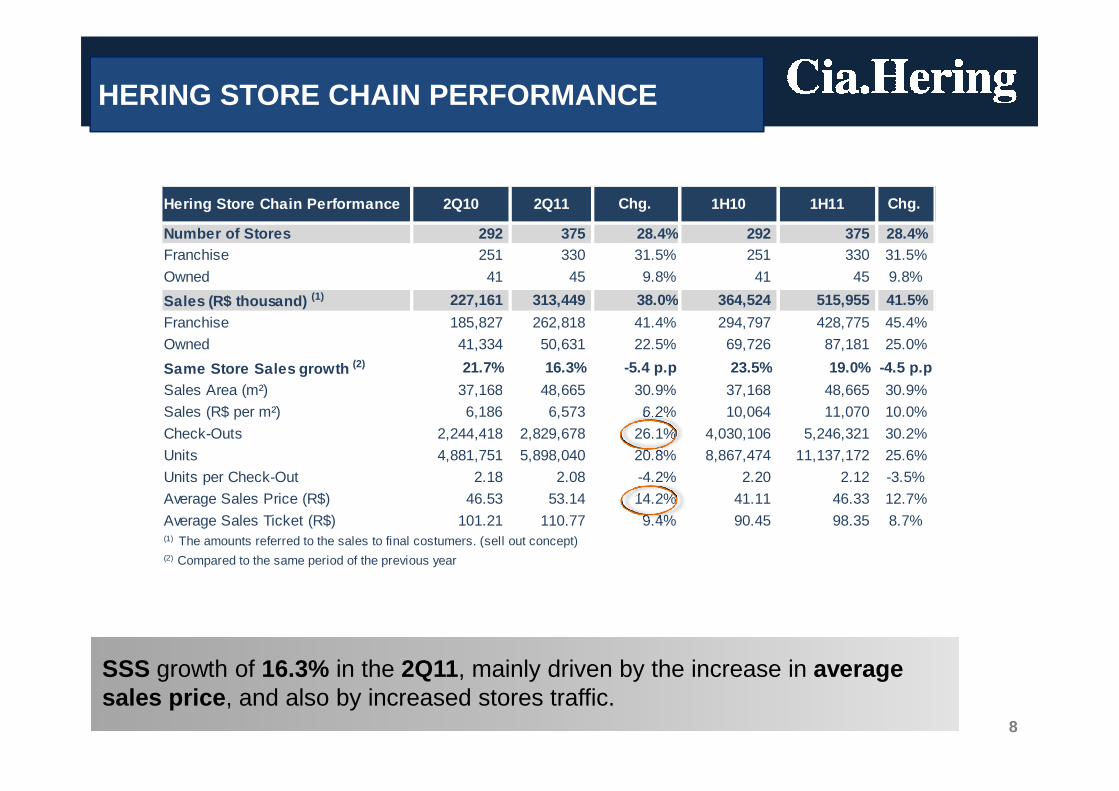
Hering Store Chain Performance 2Q10 2Q11 Chg. 1H10 1H11 Chg.
Number of Stores 292 375 28.4% 292 375 28.4%Franchise 251 330 31.5% 251 330 31.5%
Owned 41 45 9.8% 41 45 9.8%
Sales (R$ thousand) (1) 227,161 313,449 38.0% 364,524 515,955 41.5%
Franchise 185,827 262,818 41.4% 294,797 428,775 45.4%
Owned 41,334 50,631 22.5% 69,726 87,181 25.0%
Same Store Sales growth (2) 21.7% 16.3% -5.4 p.p 23.5% 19.0% -4.5 p.p
Sales Area (m²) 37,168 48,665 30.9% 37,168 48,665 30.9%
HERING STORE CHAIN PERFORMANCE
Sales Area (m²) 37,168 48,665 30.9% 37,168 48,665 30.9%
Sales (R$ per m²) 6,186 6,573 6.2% 10,064 11,070 10.0%
Check-Outs 2,244,418 2,829,678 26.1% 4,030,106 5,246,321 30.2%
Units 4,881,751 5,898,040 20.8% 8,867,474 11,137,172 25.6%
Units per Check-Out 2.18 2.08 -4.2% 2.20 2.12 -3.5%
Average Sales Price (R$) 46.53 53.14 14.2% 41.11 46.33 12.7%
Average Sales Ticket (R$) 101.21 110.77 9.4% 90.45 98.35 8.7%(1) The amounts referred to the sales to final costumers. (sell out concept)(2) Compared to the same period of the previous year
8
SSS growth of 16.3% in the 2Q11, mainly driven by the increase in averagesales price , and also by increased stores traffic.
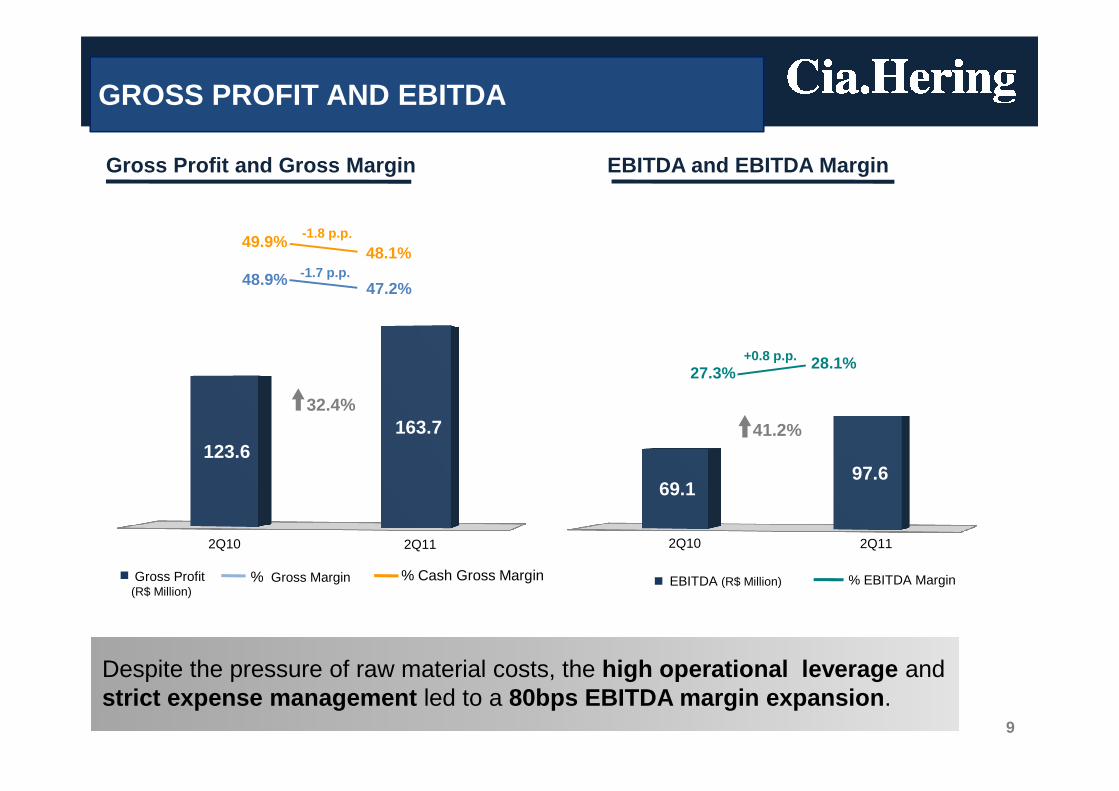
GROSS PROFIT AND EBITDA
Gross Profit and Gross Margin EBITDA and EBITDA Margin
48.9% 47.2%
49.9%48.1%
-1.7 p.p.
-1.8 p.p....
27.3%28.1%+0.8 p.p.
32.4%
69.1 97.6
123.6 163.7
9
Despite the pressure of raw material costs, the high operational leverage andstrict expense management led to a 80bps EBITDA margin expansion .
% Cash Gross Margin% Gross MarginGross Profit (R$ Million)
% EBITDA Margin EBITDA (R$ Million)
32.4%41.2%
2Q10 2Q11 2Q10 2Q11
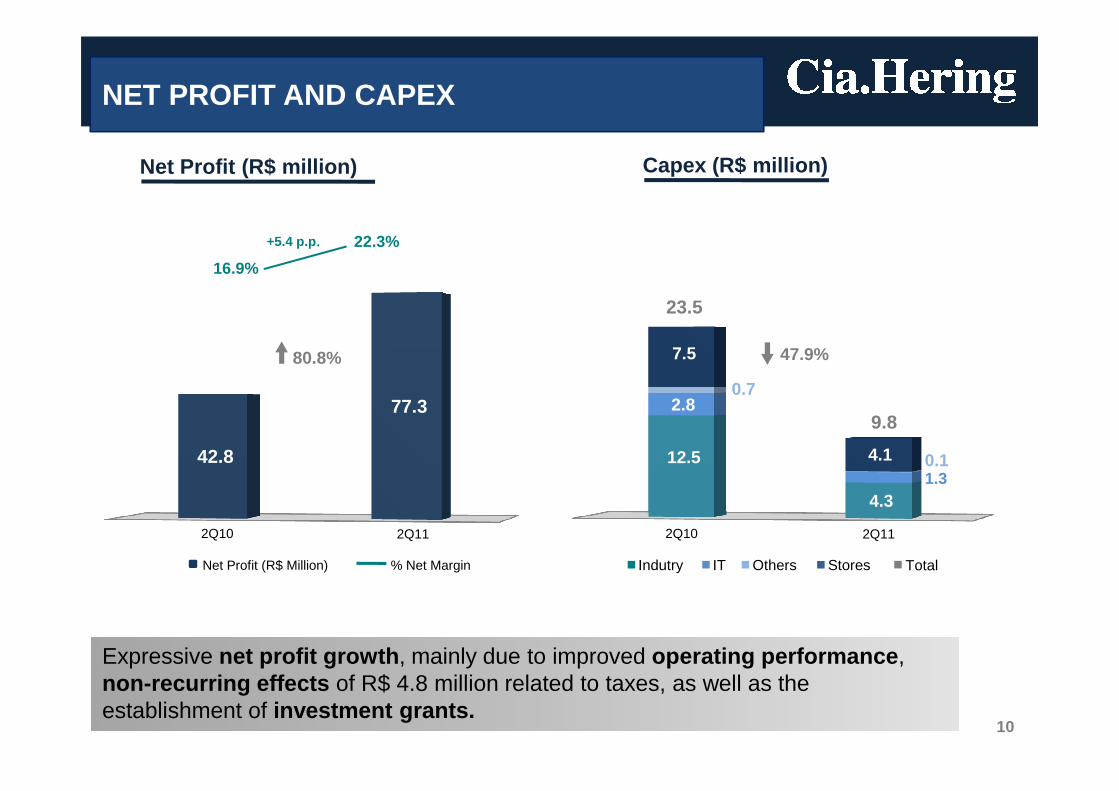
2.8 0.7
7.5
77.3
NET PROFIT AND CAPEX
80.8%
16.9%
22.3%+5.4 p.p....
47.9%
23.5
Capex (R$ million)Net Profit (R$ million)
12.5
4.3
2.8
1.3
0.7
0.1 4.1 42.8
77.3
10
Expressive net profit growth , mainly due to improved operating performance , non-recurring effects of R$ 4.8 million related to taxes, as well as the establishment of investment grants.
% Net MarginNet Profit (R$ Million)
9.8
TotalIndutry IT Others Stores
2Q10 2Q11 2Q10 2Q11
CASH FLOW
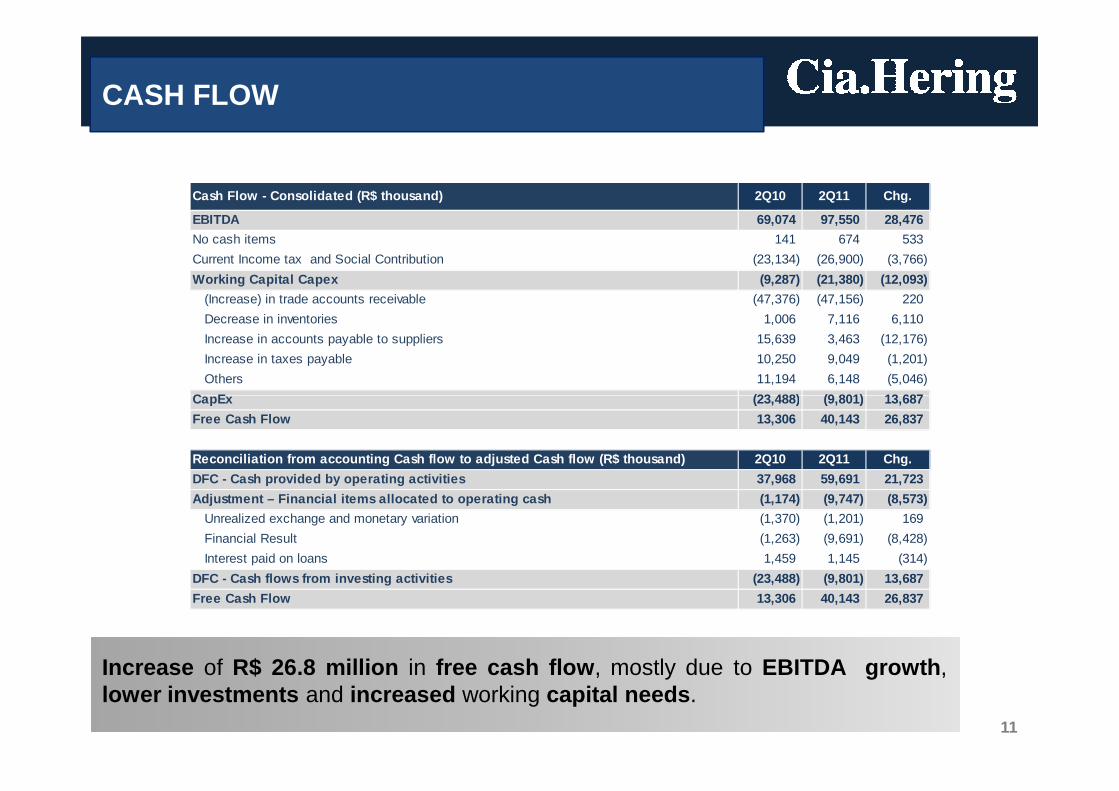
Cash Flow - Consolidated (R$ thousand) 2Q10 2Q11 Chg.
EBITDA 69,074 97,550 28,476
No cash items 141 674 533
Current Income tax and Social Contribution (23,134) (26,900) (3,766)
Working Capital Capex (9,287) (21,380) (12,093)
(Increase) in trade accounts receivable (47,376) (47,156) 220
Decrease in inventories 1,006 7,116 6,110
Increase in accounts payable to suppliers 15,639 3,463 (12,176)
Increase in taxes payable 10,250 9,049 (1,201)
Others 11,194 6,148 (5,046)
CapEx (23,488) (9,801) 13,687
11
Increase of R$ 26.8 million in free cash flow , mostly due to EBITDA growth ,lower investments and increased working capital needs .
CapEx (23,488) (9,801) 13,687
Free Cash Flow 13,306 40,143 26,837
Reconciliation from accounting Cash flow to adjuste d Cash flow (R$ thousand) 2Q10 2Q11 Chg.
DFC - Cash provided by operating activities 37,968 59,691 21,723
Adjustment – Financial items allocated to operating cash (1,174) (9,747) (8,573)
Unrealized exchange and monetary variation (1,370) (1,201) 169
Financial Result (1,263) (9,691) (8,428)
Interest paid on loans 1,459 1,145 (314)
DFC - Cash flows from investing activities (23,488) (9,801) 13,687
Free Cash Flow 13,306 40,143 26,837
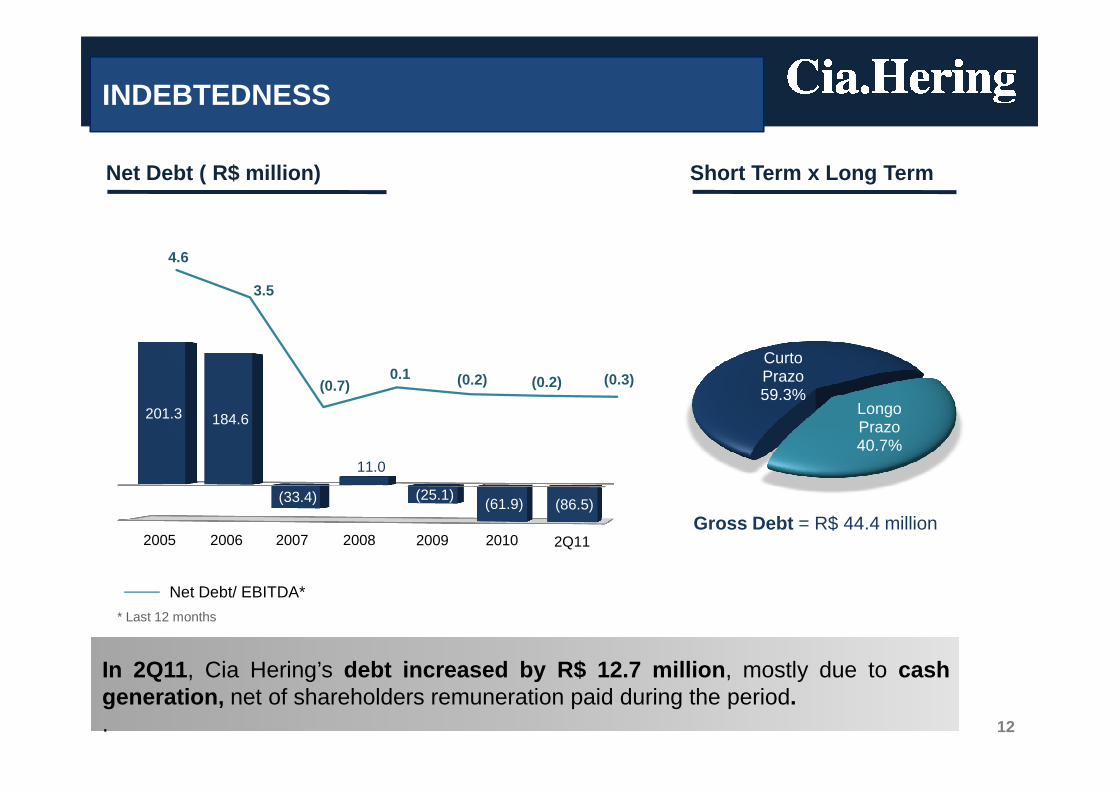
Net Debt ( R$ million) Short Term x Long Term
INDEBTEDNESS
CurtoPrazo59.3%
4.6
3.5
(0.7)0.1 (0.2) (0.2) (0.3)
201.3 184.6
(33.4)
11.0
(25.1)(61.9) (86.5)
Gross Debt = R$ 44.4 million
12
* Last 12 months
Net Debt/ EBITDA*
In 2Q11, Cia Hering’s debt increased by R$ 12.7 million , mostly due to cashgeneration, net of shareholders remuneration paid during the period..
59.3%Longo Prazo40.7%
2005 2006 2007 2008 2009 2010 2Q11
AGENDAAGENDA
HighlightsHighlights
2Q11 2Q11 OperationalOperational
13
2Q11 2Q11 OperationalOperationalPerformancePerformance
OutlooksOutlooks
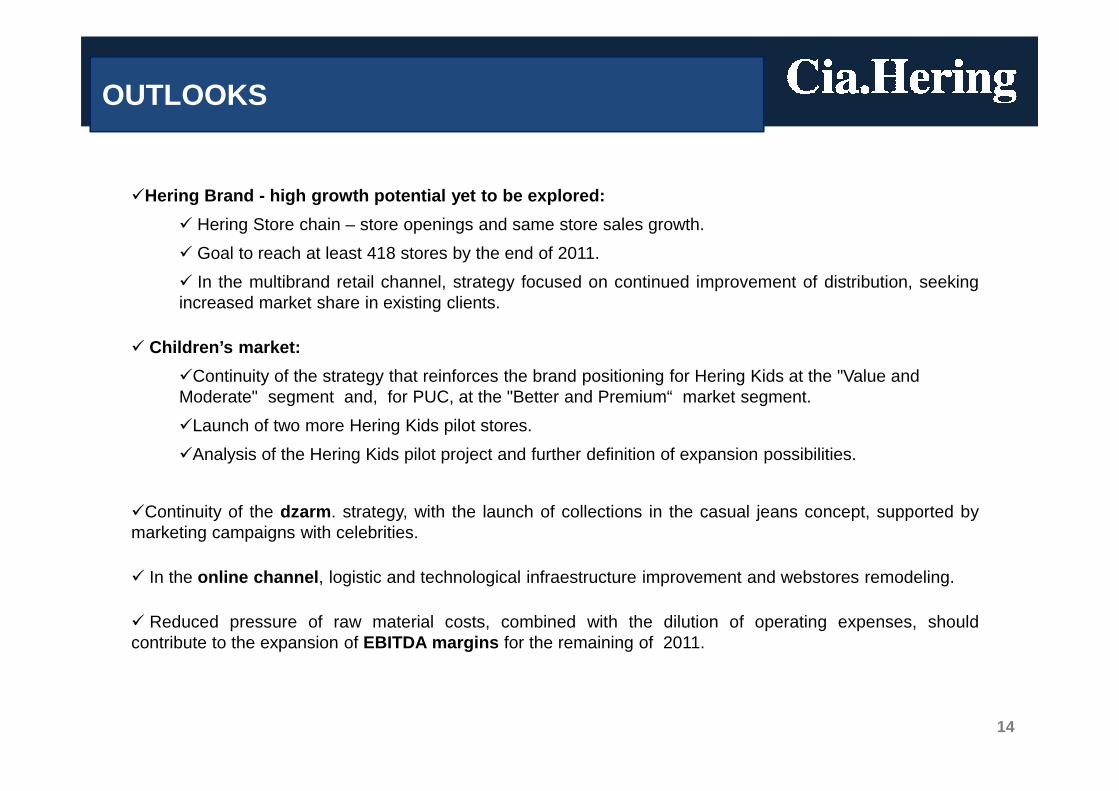
�Hering Brand - high growth potential yet to be explored:
� Hering Store chain – store openings and same store sales growth.
� Goal to reach at least 418 stores by the end of 2011.
� In the multibrand retail channel, strategy focused on continued improvement of distribution, seekingincreased market share in existing clients.
� Children’s market:
�Continuity of the strategy that reinforces the brand positioning for Hering Kids at the "Value and Moderate" segment and, for PUC, at the "Better and Premium“ market segment.
OUTLOOKS
14
Moderate" segment and, for PUC, at the "Better and Premium“ market segment.
�Launch of two more Hering Kids pilot stores.
�Analysis of the Hering Kids pilot project and further definition of expansion possibilities.
�Continuity of the dzarm . strategy, with the launch of collections in the casual jeans concept, supported bymarketing campaigns with celebrities.
� In the online channel , logistic and technological infraestructure improvement and webstores remodeling.
� Reduced pressure of raw material costs, combined with the dilution of operating expenses, shouldcontribute to the expansion of EBITDA margins for the remaining of 2011.

INVESTOR RELATIONS TEAMINVESTOR RELATIONS TEAM
Fabio Hering – CEOFrederico Oldani – CFO and IRO
Karina Koerich – IR ManagerAdmar A. Topazio Junior – IR Analyst
Tel. +55 (47) 3321-3469E-mail: [email protected]
Website: www.ciahering.com.br/ir