Embed Size (px)
Citation preview
Factbase
Conducted by Navigate Australia
Dairy Globalization: 2011 Update
Commissioned by Lion Nathan Australia
FINAL May 21, 2011
Contents
•Project objectives and summary findings
•Geography-specific findings
-Net importers
-Net exporters
•Global dairy buyers’ perspectives on Australian dairy
•Other wildcards
-Commodity price outlook
-Fat consumption trends
-Food spend analysis, currency outlook
•Summary
3
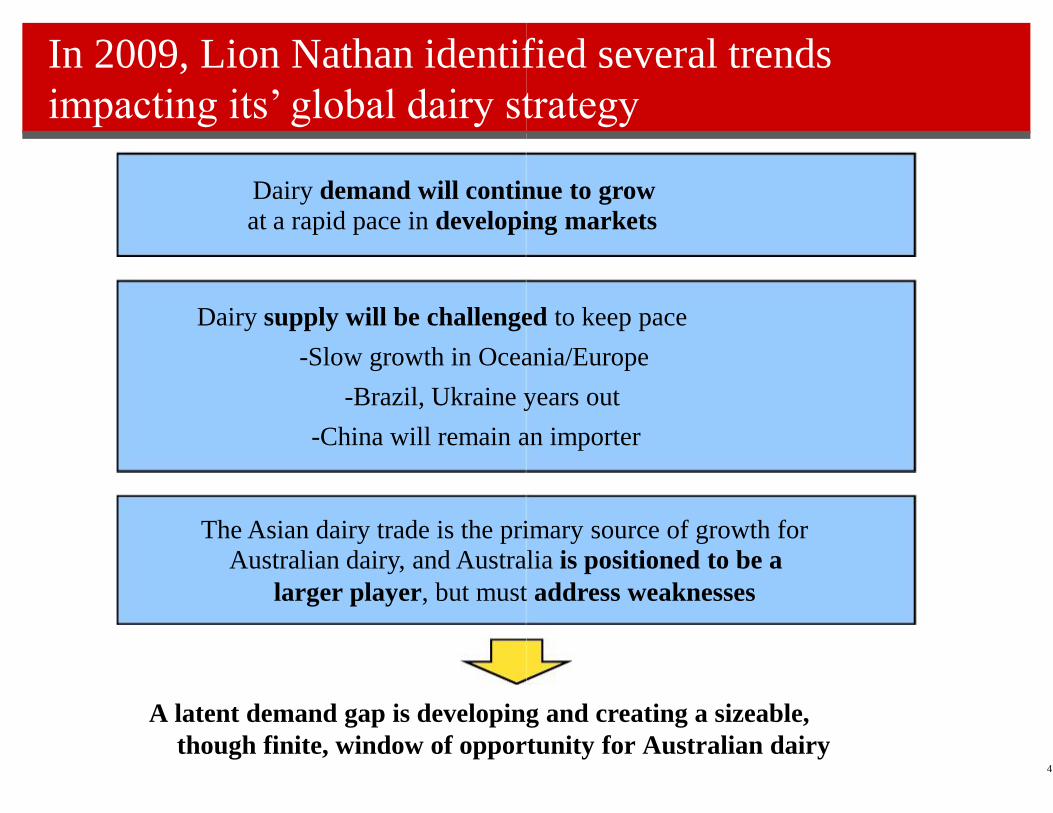
In 2009, Lion Nathan identified several trends
impacting its’ global dairy strategy
Dairy demand will continue to grow
at a rapid pace in developing markets
-Slow growth in Oceania/Europe
-China will remain an importer
A latent demand gap is developing and creating a sizeable,
though finite, window of opportunity for Australian dairy 4
Dairy supply will be challenged to keep pace
-Brazil, Ukraine years out
The Asian dairy trade is the primary source of growth for
Australian dairy, and Australia is positioned to be a
larger player, but must address weaknesses
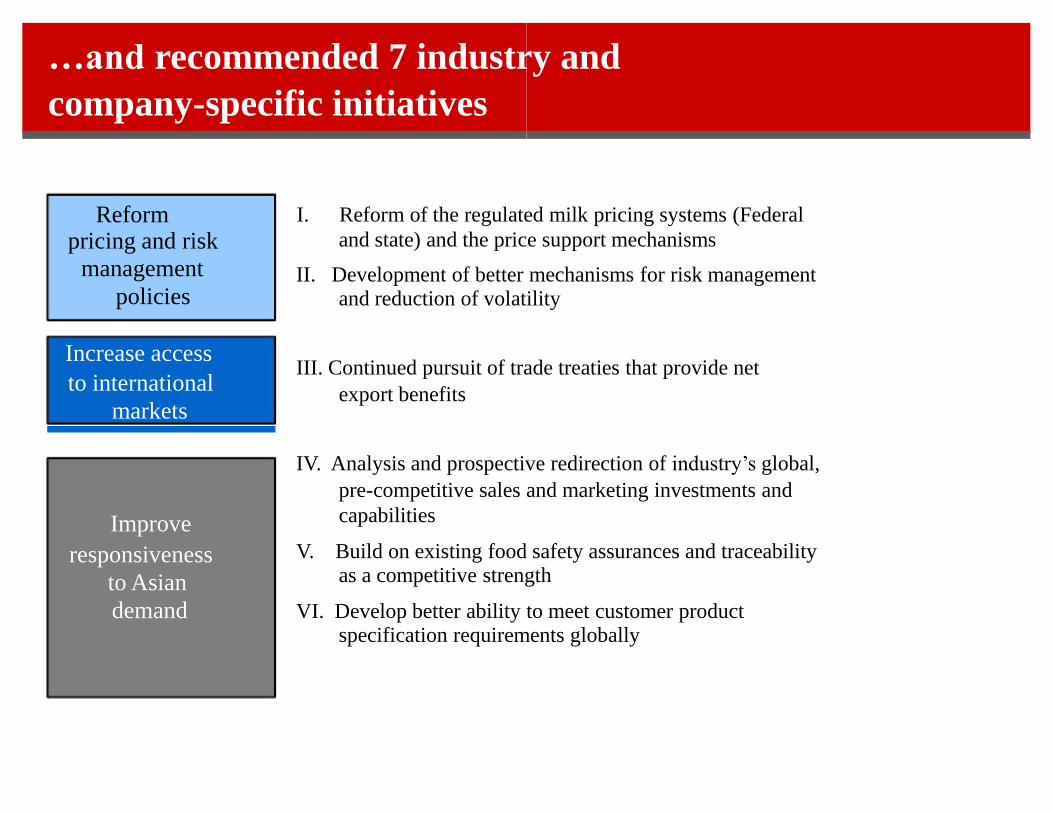
…and recommended 7 industry and
company-specific initiatives
Reform pricing and risk
management
policies Increase access
to international
markets
Improve
responsiveness
to Asian
demand
I. Reform of the regulated milk pricing systems (Federal
and state) and the price support mechanisms II. Development of better mechanisms for risk management and reduction of volatility III. Continued pursuit of trade treaties that provide net
export benefits IV. Analysis and prospective redirection of industry’s global,
pre-competitive sales and marketing investments and
capabilities V. Build on existing food safety assurances and traceability as a competitive strength VI. Develop better ability to meet customer product specification requirements globally
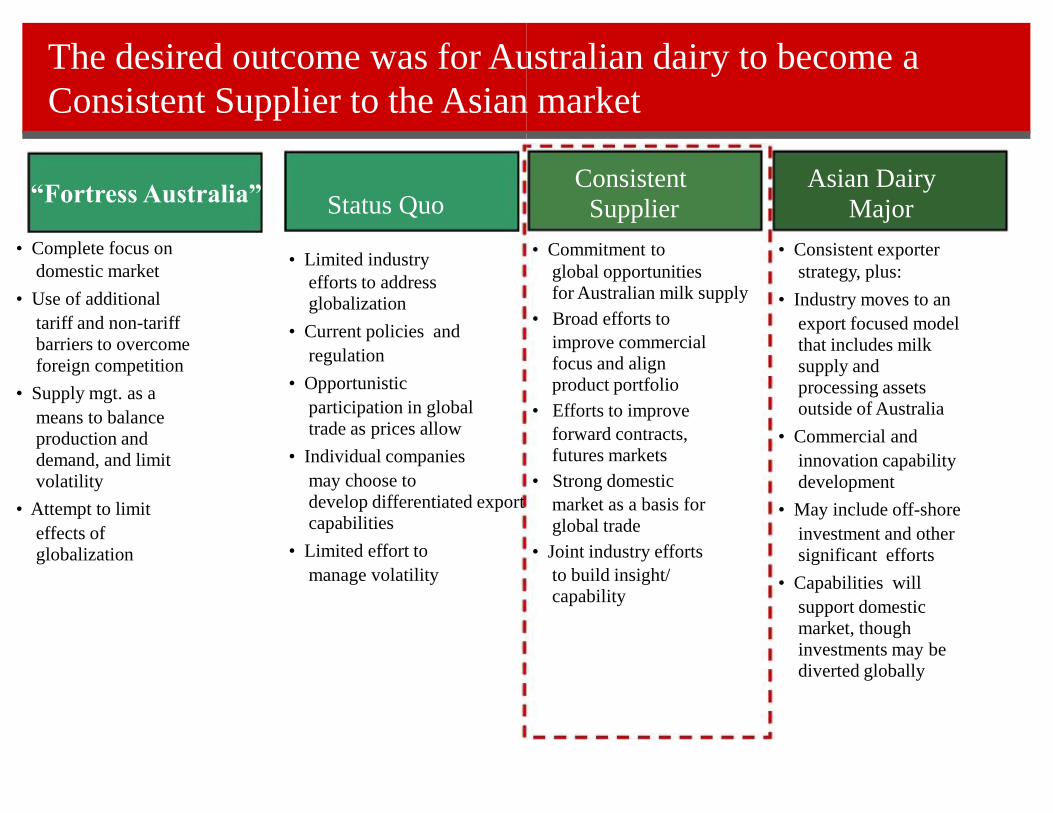
The desired outcome was for Australian dairy to become a
Consistent Supplier to the Asian market
Status Quo • Limited industry
efforts to address
globalization
• Current policies and
regulation
• Opportunistic
participation in global
trade as prices allow
• Individual companies
may choose to
develop differentiated export
capabilities
• Limited effort to
manage volatility
Consistent
Supplier • Commitment to
global opportunities
for Australian milk supply
• Broad efforts to
improve commercial
focus and align
product portfolio
• Efforts to improve
forward contracts,
futures markets
• Strong domestic
market as a basis for
global trade
• Joint industry efforts
to build insight/
capability
Asian Dairy
Major • Consistent exporter
strategy, plus:
• Industry moves to an
export focused model
that includes milk
supply and
processing assets outside of Australia
• Commercial and
innovation capability
development
• May include off-shore
investment and other
significant efforts
• Capabilities will
support domestic
market, though
investments may be
diverted globally
“Fortress Australia” • Complete focus on
domestic market
• Use of additional
tariff and non-tariff
barriers to overcome
foreign competition
• Supply mgt. as a
means to balance
production and
demand, and limit
volatility
• Attempt to limit
effects of
globalization
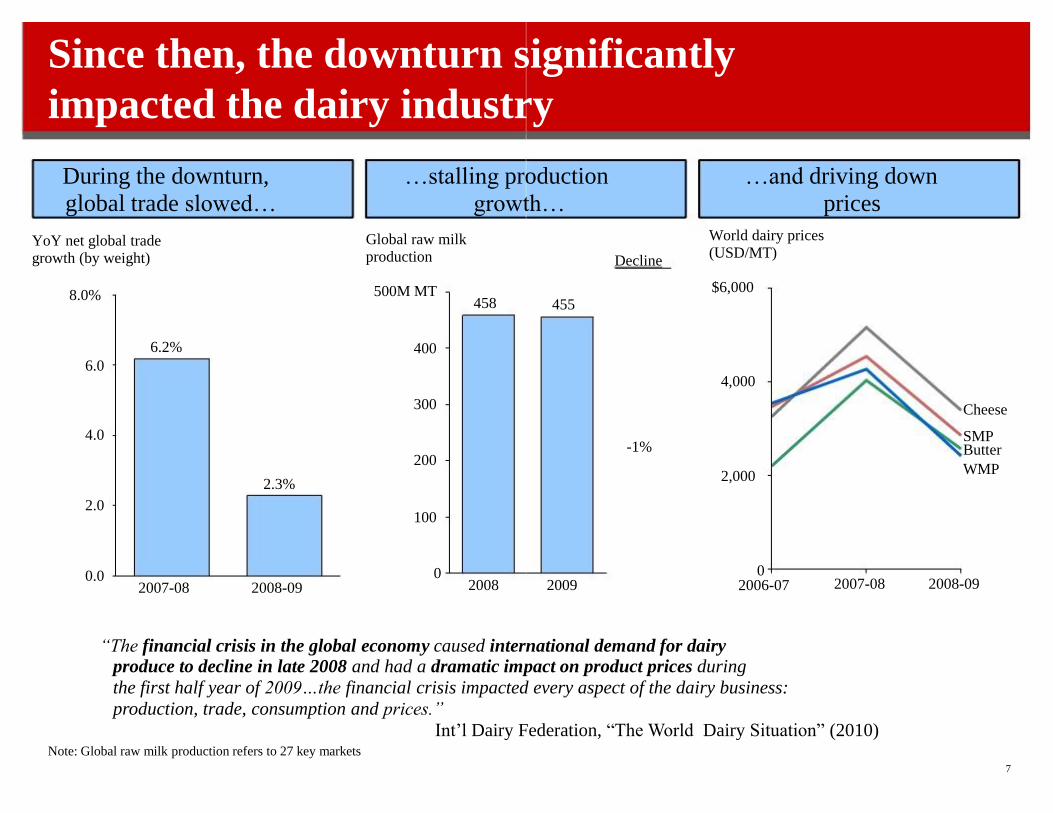
Since then, the downturn significantly
impacted the dairy industry
During the downturn,
global trade slowed…
…stalling production
growth…
0.0
2.0
4.0
8.0%
YoY net global trade growth (by weight)
2007-08
6.2%
2008-09
2.3%
0
100
200
300
400
500M MT
Global raw milk production
2008
458
7
…and driving down
prices
2009
455
-1%
Decline
2,000
6.0 4,000
$6,000
0 2006-07 2007-08 2008-09
World dairy prices (USD/MT)
Cheese
SMP Butter
WMP
“The financial crisis in the global economy caused international demand for dairy produce to decline in late 2008 and had a dramatic impact on product prices during
the first half year of 2009…the financial crisis impacted every aspect of the dairy business:
production, trade, consumption and prices.”
Int’l Dairy Federation, “The World Dairy Situation” (2010) Note: Global raw milk production refers to 27 key markets
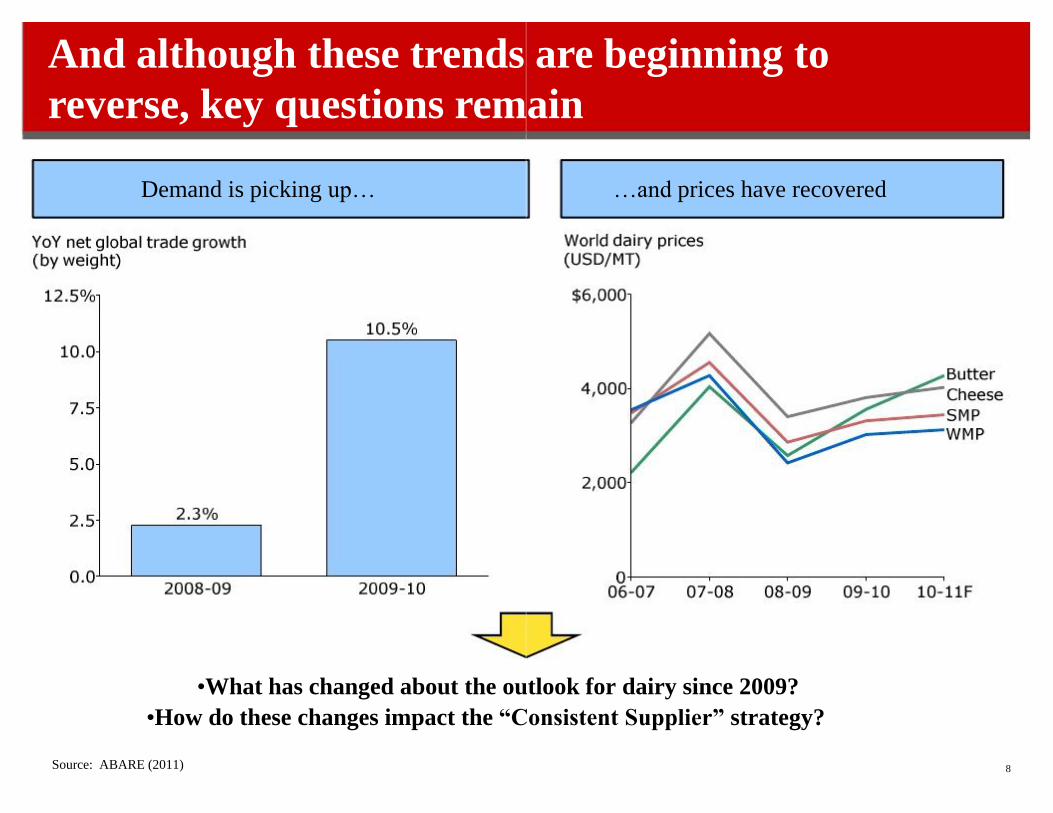
Demand is picking up…
•What has changed about the outlook for dairy since 2009?
•How do these changes impact the “Consistent Supplier” strategy?
And although these trends are beginning to
reverse, key questions remain
Source: ABARE (2011)
8
…and prices have recovered
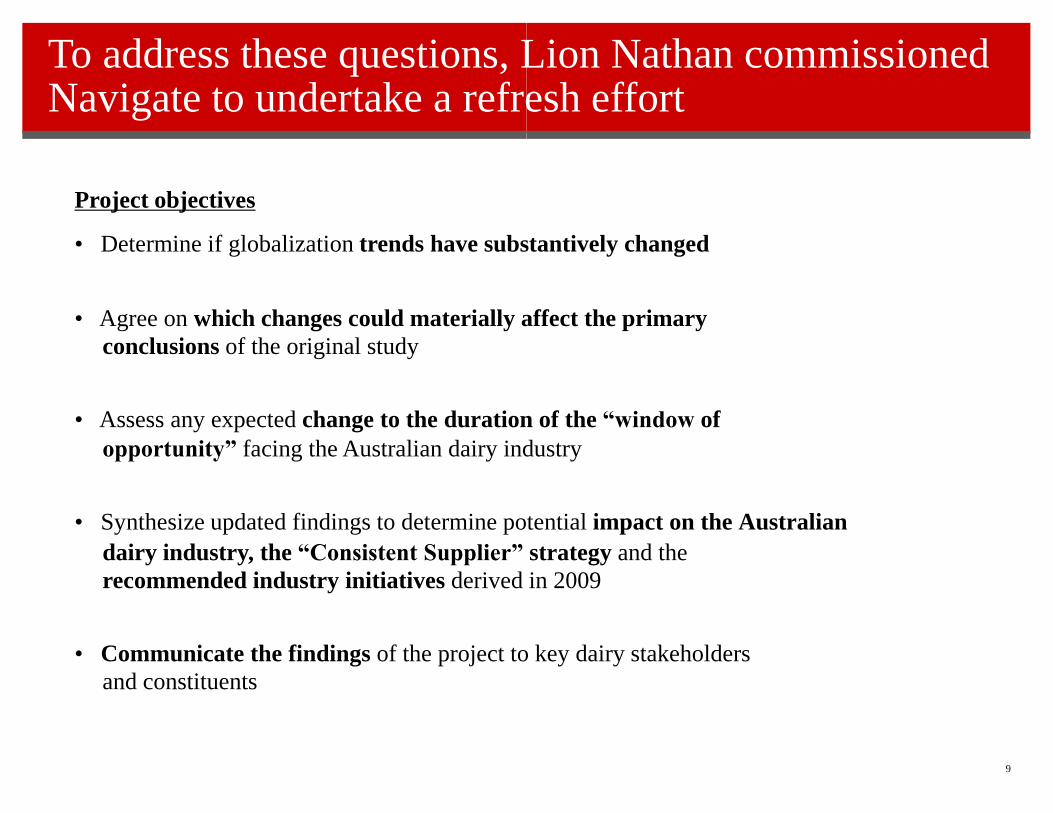
To address these questions, Lion Nathan commissioned Navigate to undertake a refresh effort
Project objectives
conclusions of the original study
• Assess any expected change to the duration of the “window of
opportunity” facing the Australian dairy industry
• Communicate the findings of the project to key dairy stakeholders
and constituents
9
• Determine if globalization trends have substantively changed
• Agree on which changes could materially affect the primary
• Synthesize updated findings to determine potential impact on the Australian
dairy industry, the “Consistent Supplier” strategy and the
recommended industry initiatives derived in 2009
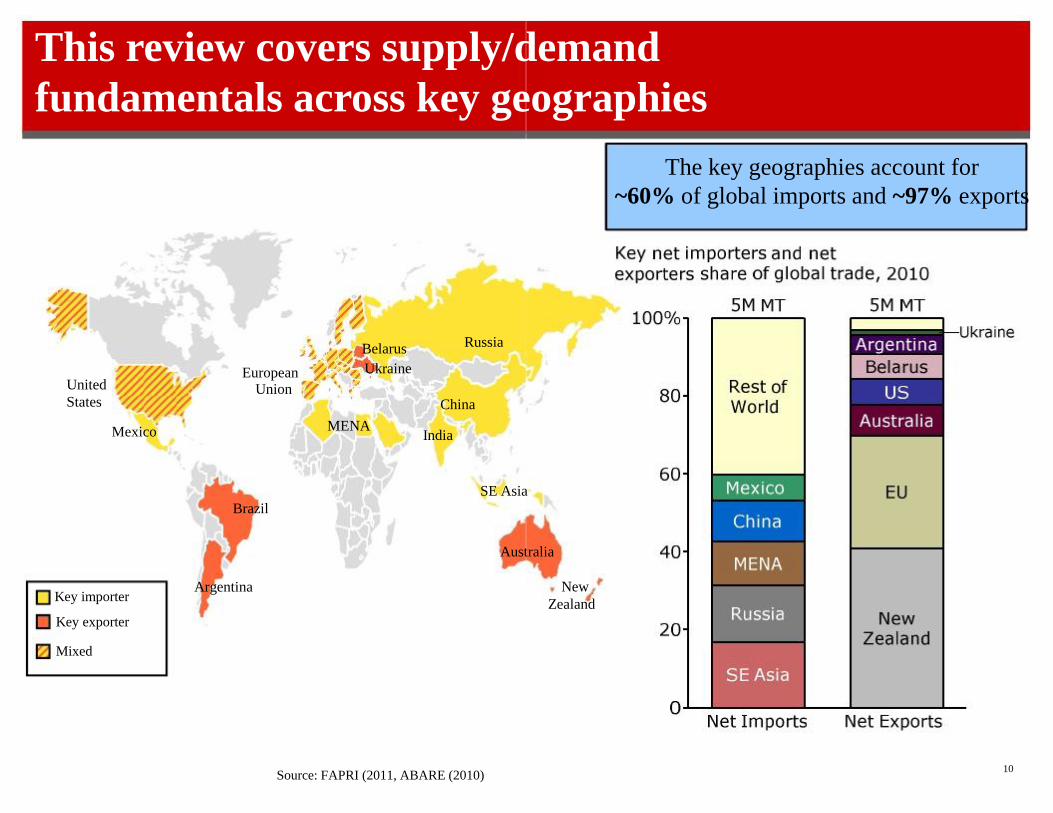
Key importer
United
States Mexico
European Union
Russia
SE Asia
Brazil Australia
Argentina
China India
Belarus
Ukraine MENA
Source: FAPRI (2011, ABARE (2010)
10
This review covers supply/demand
fundamentals across key geographies
New
Zealand
The key geographies account for
~60% of global imports and ~97% exports
Key exporter
Mixed
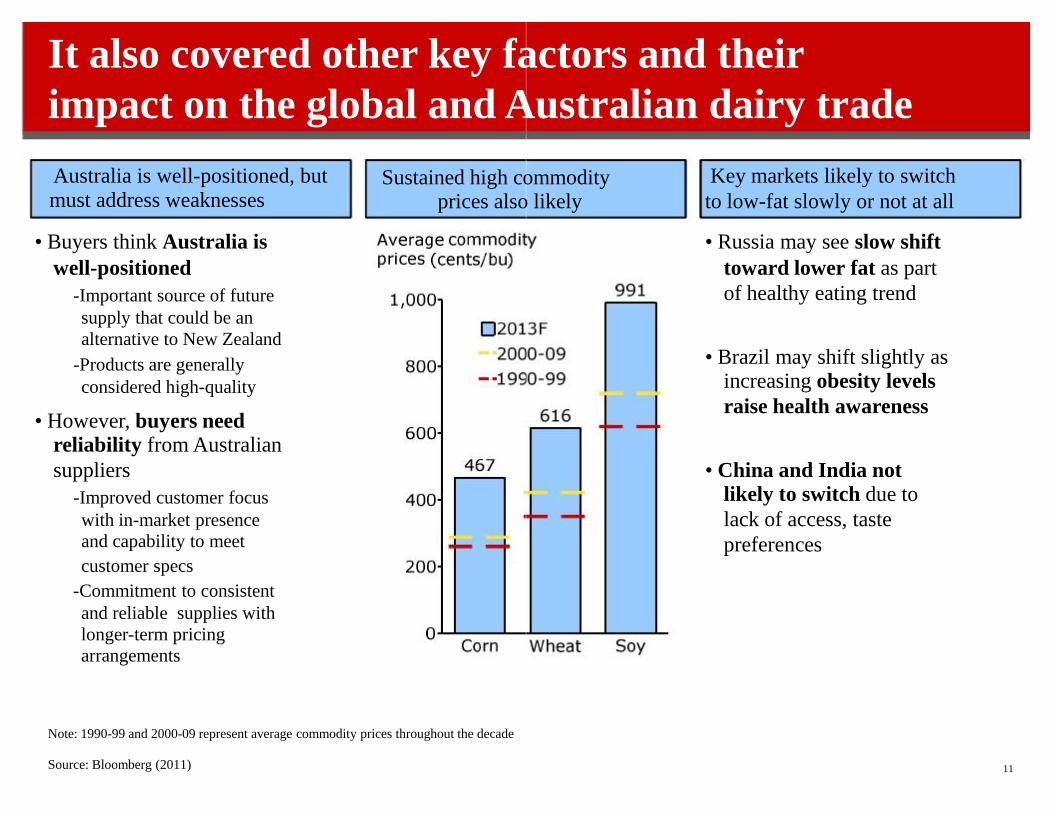
It also covered other key factors and their
impact on the global and Australian dairy trade
Sustained high commodity prices also likely
Australia is well-positioned, but must address weaknesses • Buyers think Australia is
well-positioned
-Important source of future
supply that could be an
alternative to New Zealand
-Products are generally
considered high-quality • However, buyers need
reliability from Australian
suppliers
-Improved customer focus
with in-market presence
and capability to meet
customer specs
-Commitment to consistent
and reliable supplies with
longer-term pricing
arrangements Note: 1990-99 and 2000-09 represent average commodity prices throughout the decade
Source: Bloomberg (2011)
11
Key markets likely to switch
to low-fat slowly or not at all • Russia may see slow shift
toward lower fat as part
of healthy eating trend • Brazil may shift slightly as increasing obesity levels
raise health awareness • China and India not
likely to switch due to
lack of access, taste
preferences
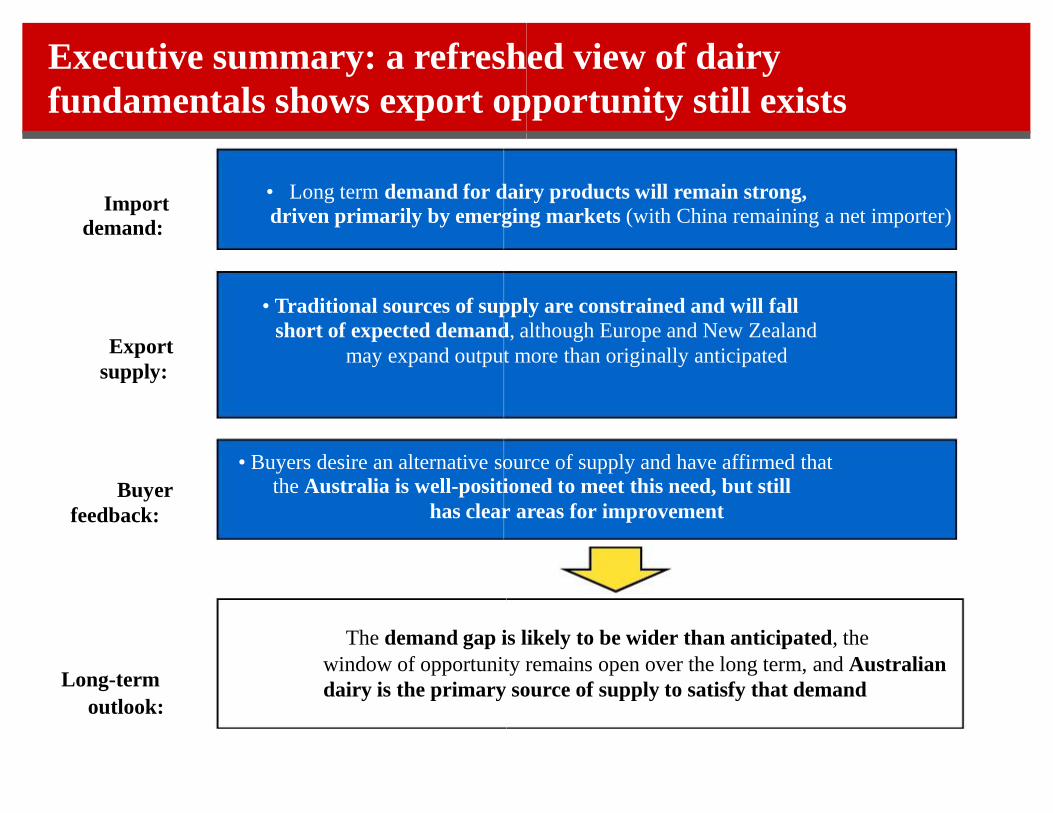
Executive summary: a refreshed view of dairy
fundamentals shows export opportunity still exists
Import
demand: Export
supply: Buyer
feedback: Long-term
outlook:
• Long term demand for dairy products will remain strong,
driven primarily by emerging markets (with China remaining a net importer) • Traditional sources of supply are constrained and will fall
short of expected demand, although Europe and New Zealand
may expand output more than originally anticipated • Buyers desire an alternative source of supply and have affirmed that the Australia is well-positioned to meet this need, but still
has clear areas for improvement
The demand gap is likely to be wider than anticipated, the
window of opportunity remains open over the long term, and Australian
dairy is the primary source of supply to satisfy that demand
Contents
•Project objectives and summary findings
•Global dairy buyers’ perspectives on Australian dairy
•Other wildcards
-Commodity price outlook
-Fat consumption trends
-Food spend analysis, currency outlook
•Summary
14
•Geography-specific findings – net importers
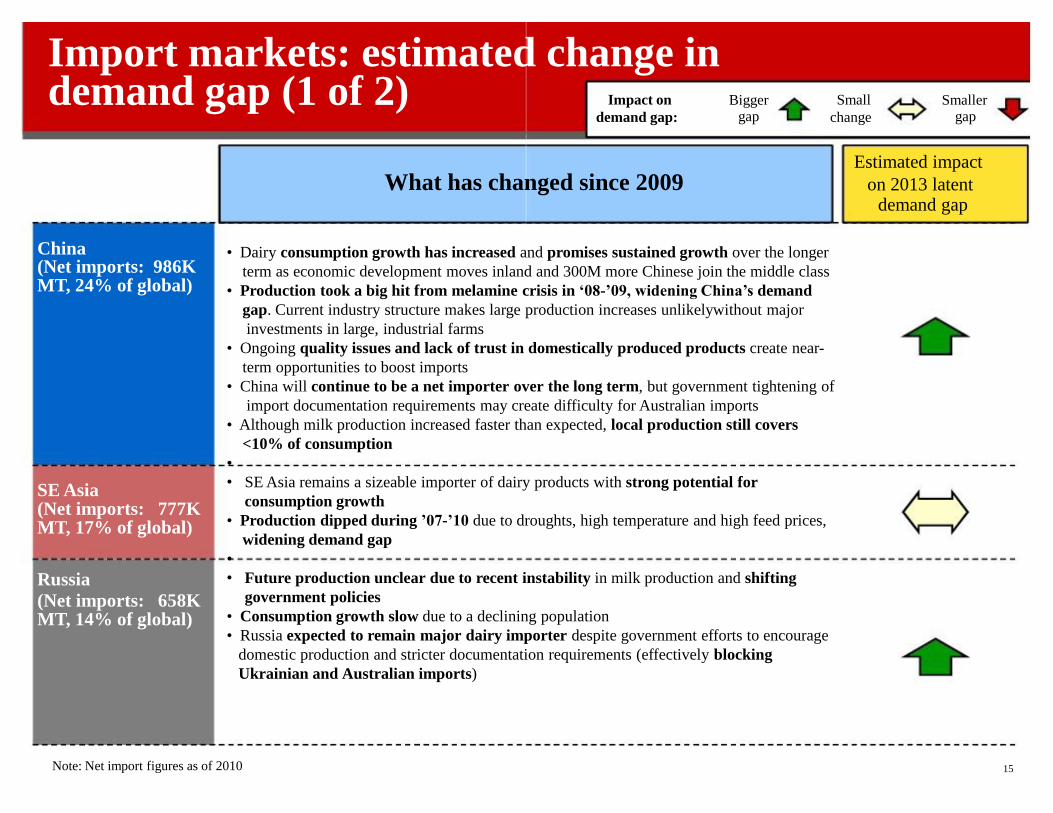
Import markets: estimated change in demand gap (1 of 2)
China (Net imports: 986K MT, 24% of global) SE Asia (Net imports: 777K MT, 17% of global) Russia
(Net imports: 658K MT, 14% of global)
What has changed since 2009
Note: Net import figures as of 2010
15
• Dairy consumption growth has increased and promises sustained growth over the longer
term as economic development moves inland and 300M more Chinese join the middle class
• Production took a big hit from melamine crisis in ‘08-’09, widening China’s demand
gap. Current industry structure makes large production increases unlikelywithout major
investments in large, industrial farms
• Ongoing quality issues and lack of trust in domestically produced products create near-
term opportunities to boost imports
• China will continue to be a net importer over the long term, but government tightening of
import documentation requirements may create difficulty for Australian imports
• Although milk production increased faster than expected, local production still covers
<10% of consumption
•
• SE Asia remains a sizeable importer of dairy products with strong potential for
consumption growth
• Production dipped during ’07-’10 due to droughts, high temperature and high feed prices,
widening demand gap
•
• Future production unclear due to recent instability in milk production and shifting
government policies
• Consumption growth slow due to a declining population
• Russia expected to remain major dairy importer despite government efforts to encourage
domestic production and stricter documentation requirements (effectively blocking
Ukrainian and Australian imports)
Estimated impact
on 2013 latent demand gap
Bigger gap
Small
change
Smaller gap
Impact on
demand gap:
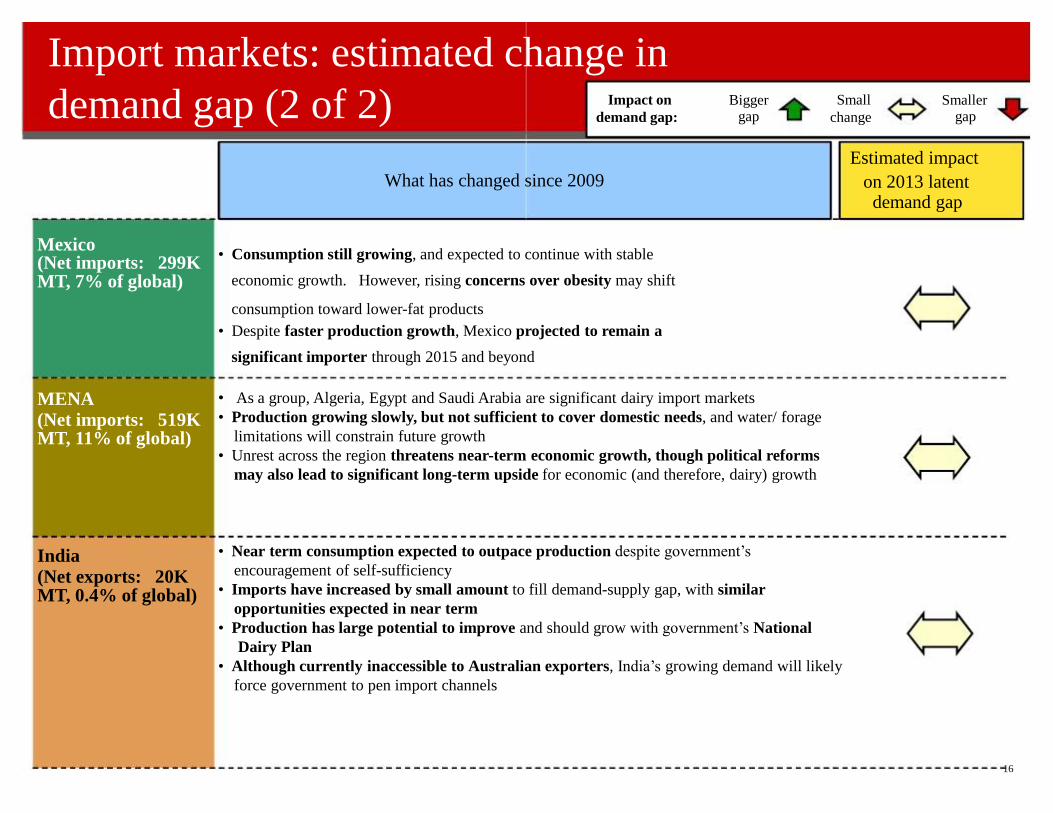
Import markets: estimated change in
demand gap (2 of 2)
Mexico (Net imports: 299K MT, 7% of global) MENA
(Net imports: 519K MT, 11% of global) India
(Net exports: 20K MT, 0.4% of global)
What has changed since 2009
16
• Consumption still growing, and expected to continue with stable
economic growth. However, rising concerns over obesity may shift
consumption toward lower-fat products
• Despite faster production growth, Mexico projected to remain a
significant importer through 2015 and beyond
• As a group, Algeria, Egypt and Saudi Arabia are significant dairy import markets
• Production growing slowly, but not sufficient to cover domestic needs, and water/ forage
limitations will constrain future growth
• Unrest across the region threatens near-term economic growth, though political reforms
may also lead to significant long-term upside for economic (and therefore, dairy) growth
• Near term consumption expected to outpace production despite government’s
encouragement of self-sufficiency
• Imports have increased by small amount to fill demand-supply gap, with similar
opportunities expected in near term
• Production has large potential to improve and should grow with government’s National
Dairy Plan
• Although currently inaccessible to Australian exporters, India’s growing demand will likely
force government to pen import channels
Estimated impact
on 2013 latent demand gap
Bigger gap
Small
change
Smaller gap
Impact on
demand gap:
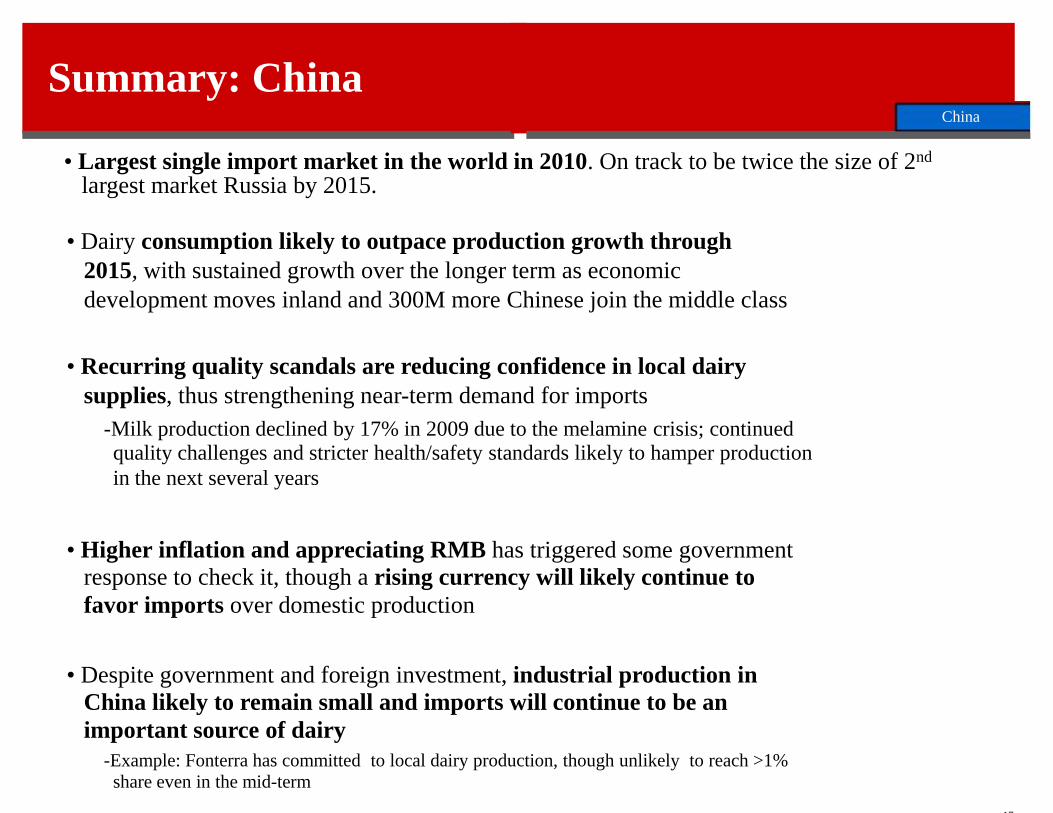
Summary: China
• Dairy consumption likely to outpace production growth through
2015, with sustained growth over the longer term as economic
development moves inland and 300M more Chinese join the middle class
• Recurring quality scandals are reducing confidence in local dairy
supplies, thus strengthening near-term demand for imports
-Milk production declined by 17% in 2009 due to the melamine crisis; continued quality challenges and stricter health/safety standards likely to hamper production
in the next several years
-Example: Fonterra has committed to local dairy production, though unlikely to reach >1%
share even in the mid-term
17
• Higher inflation and appreciating RMB has triggered some government
response to check it, though a rising currency will likely continue to
favor imports over domestic production
• Despite government and foreign investment, industrial production in
China likely to remain small and imports will continue to be an
important source of dairy
China
• Largest single import market in the world in 2010. On track to be twice the size of 2nd largest market Russia by 2015.
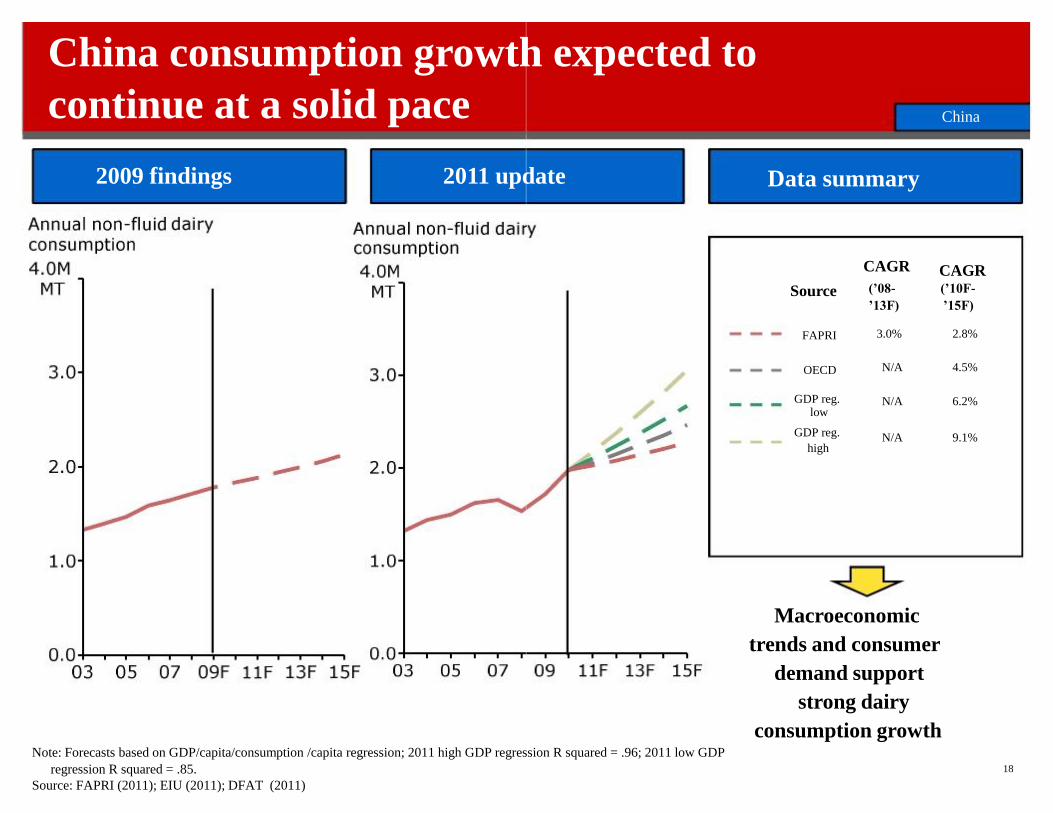
China consumption growth expected to
continue at a solid pace
2009 findings 2011 update
regression R squared = .85.
Source: FAPRI (2011); EIU (2011); DFAT (2011) 18
Data summary CAGR CAGR
Macroeconomic
trends and consumer
demand support
strong dairy
consumption growth Note: Forecasts based on GDP/capita/consumption /capita regression; 2011 high GDP regression R squared = .96; 2011 low GDP
Source FAPRI
OECD
GDP reg. low
GDP reg.
high
(’10F-
’15F) 2.8% 4.5%
6.2%
9.1%
(’08-
’13F) 3.0% N/A
N/A
N/A
China
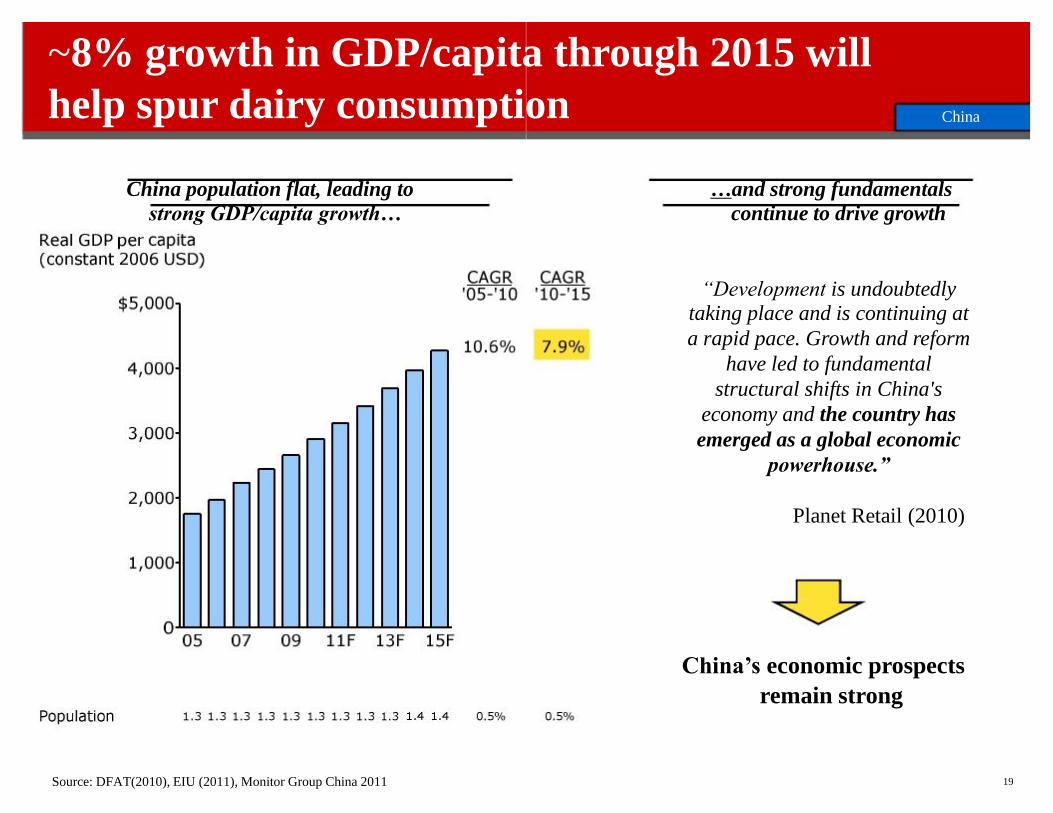
~8% growth in GDP/capita through 2015 will
help spur dairy consumption
China population flat, leading to
strong GDP/capita growth… Source: DFAT(2010), EIU (2011), Monitor Group China 2011
…and strong fundamentals
continue to drive growth
“Development is undoubtedly taking place and is continuing at
a rapid pace. Growth and reform
have led to fundamental
structural shifts in China's
economy and the country has
emerged as a global economic
powerhouse.” Planet Retail (2010)
China’s economic prospects
remain strong 19
China
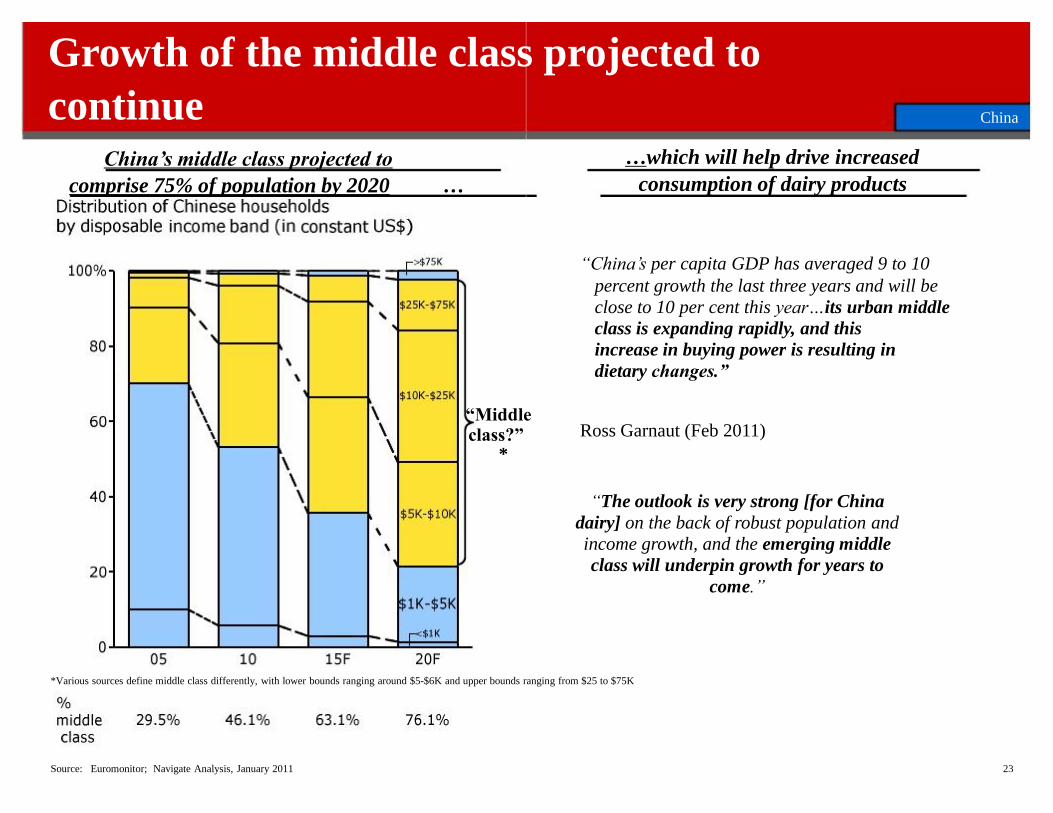
Growth of the middle class projected to
“Middle class?”
continue China’s middle class projected to
comprise 75% of population by 2020 …
Source: Euromonitor; Navigate Analysis, January 2011
23
Ross Garnaut (Feb 2011)
*
“The outlook is very strong [for China
dairy] on the back of robust population and
income growth, and the emerging middle
class will underpin growth for years to
come.” *Various sources define middle class differently, with lower bounds ranging around $5-$6K and upper bounds ranging from $25 to $75K
China …which will help drive increased
consumption of dairy products “China’s per capita GDP has averaged 9 to 10
percent growth the last three years and will be
close to 10 per cent this year…its urban middle
class is expanding rapidly, and this
increase in buying power is resulting in
dietary changes.”
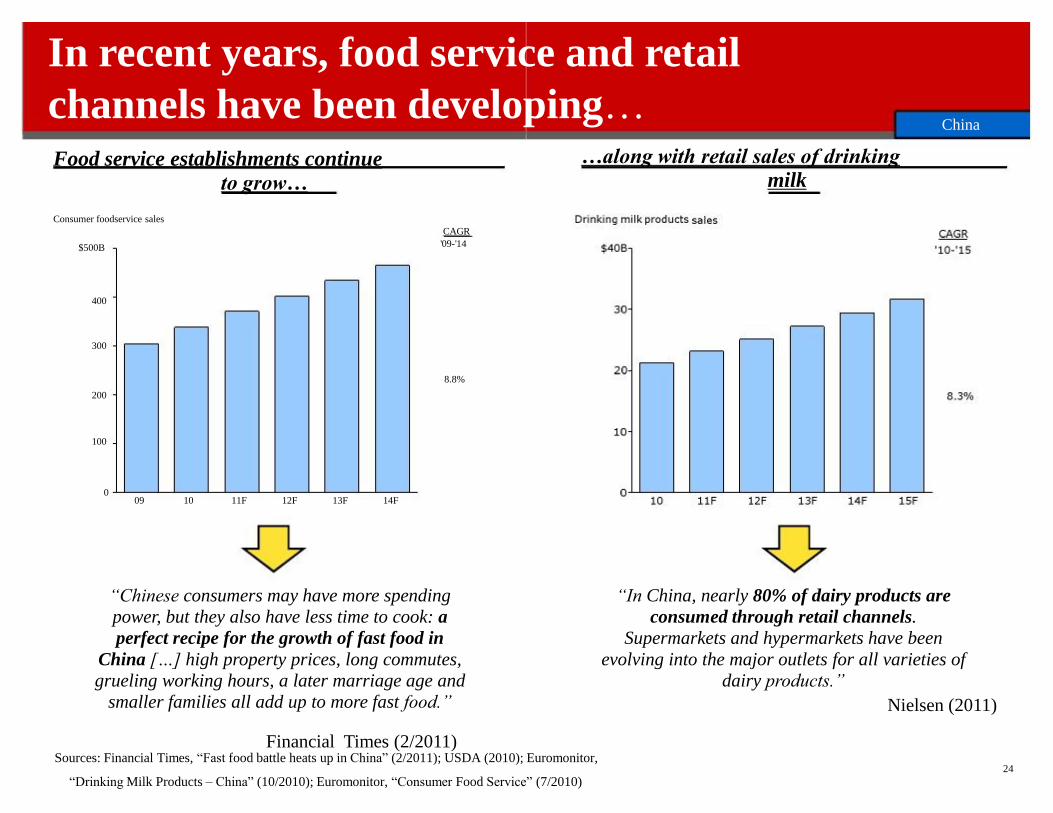
In recent years, food service and retail
channels have been developing…
“Chinese consumers may have more spending
power, but they also have less time to cook: a
perfect recipe for the growth of fast food in
China […] high property prices, long commutes,
grueling working hours, a later marriage age and
smaller families all add up to more fast food.”
Financial Times (2/2011) Sources: Financial Times, “Fast food battle heats up in China” (2/2011); USDA (2010); Euromonitor,
0
$500B
09 10 11F 12F 13F 14F
400
300
8.8%
200
100
'09-'14
Food service establishments continue
to grow… Consumer foodservice sales
CAGR
“Drinking Milk Products – China” (10/2010); Euromonitor, “Consumer Food Service” (7/2010) 24
“In China, nearly 80% of dairy products are
consumed through retail channels.
Supermarkets and hypermarkets have been
evolving into the major outlets for all varieties of
dairy products.”
Nielsen (2011)
…along with retail sales of drinking
milk
China
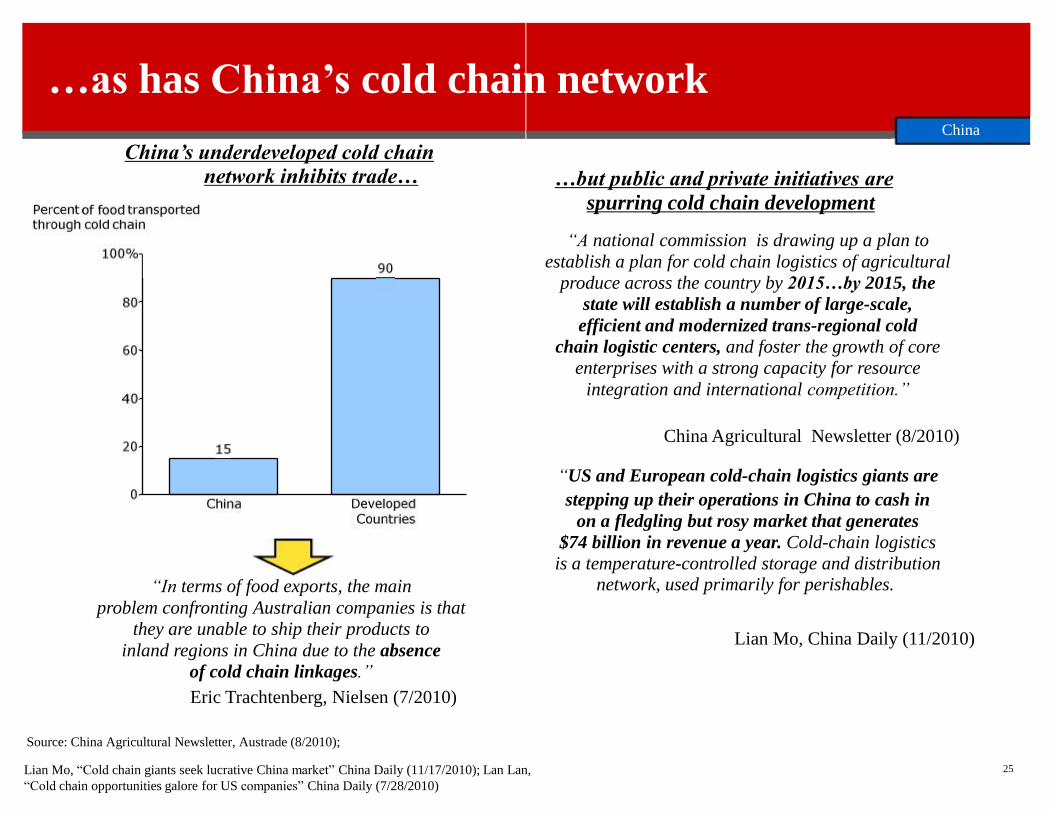
China’s underdeveloped cold chain
network inhibits trade…
“In terms of food exports, the main
problem confronting Australian companies is that
they are unable to ship their products to
inland regions in China due to the absence
of cold chain linkages.”
Eric Trachtenberg, Nielsen (7/2010)
Source: China Agricultural Newsletter, Austrade (8/2010);
Lian Mo, “Cold chain giants seek lucrative China market” China Daily (11/17/2010); Lan Lan,
“Cold chain opportunities galore for US companies” China Daily (7/28/2010) 25
…as has China’s cold chain network China
…but public and private initiatives are
spurring cold chain development
“A national commission is drawing up a plan to
establish a plan for cold chain logistics of agricultural
produce across the country by 2015…by 2015, the
state will establish a number of large-scale,
efficient and modernized trans-regional cold
chain logistic centers, and foster the growth of core
enterprises with a strong capacity for resource
integration and international competition.” China Agricultural Newsletter (8/2010)
“US and European cold-chain logistics giants are
stepping up their operations in China to cash in
on a fledgling but rosy market that generates
$74 billion in revenue a year. Cold-chain logistics
is a temperature-controlled storage and distribution network, used primarily for perishables.
Lian Mo, China Daily (11/2010)
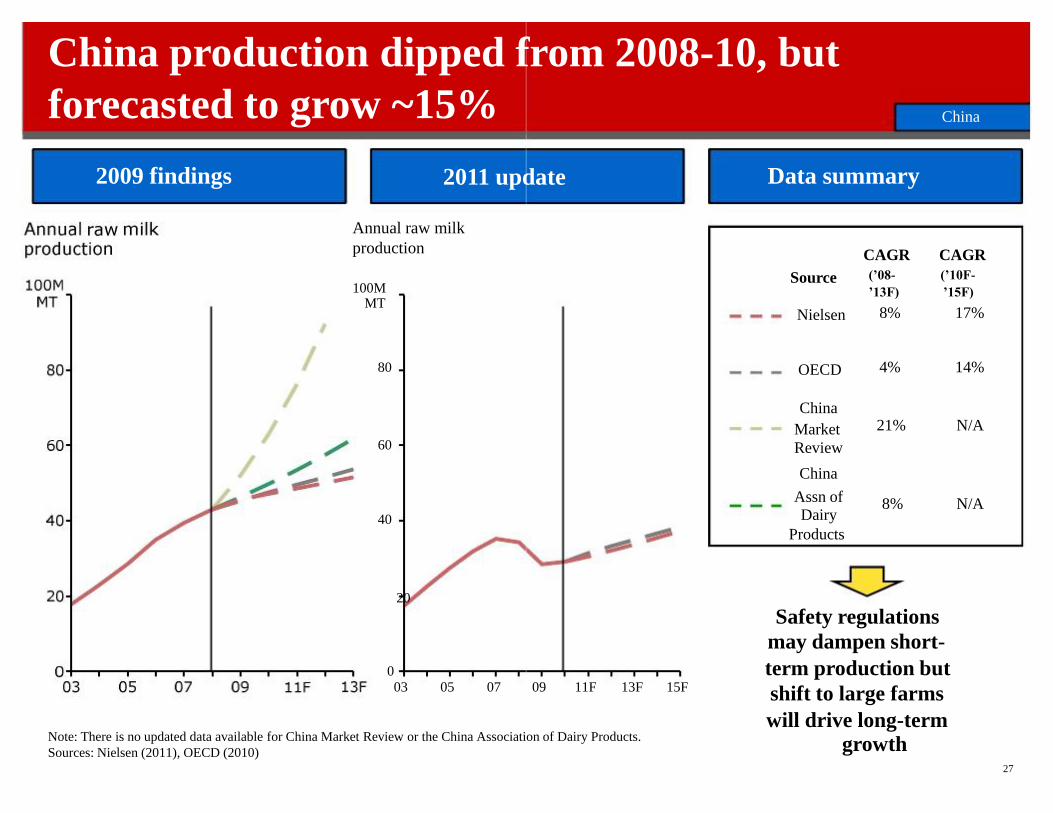
forecasted to grow ~15%
2009 findings
0
40
60
100M MT 80
2011 update Annual raw milk
production
03 05 07
Note: There is no updated data available for China Market Review or the China Association of Dairy Products.
Sources: Nielsen (2011), OECD (2010) 27
China production dipped from 2008-10, but
Data summary
CAGR CAGR
Source Nielsen OECD
(’10F-
’15F)
17% 14%
(’08-
’13F)
8% 4%
09 11F 13F 15F
20
Safety regulations
may dampen short-
term production but
shift to large farms
will drive long-term
growth
China N/A 21% Market
Review
China
Assn of Dairy
Products
N/A 8%
China
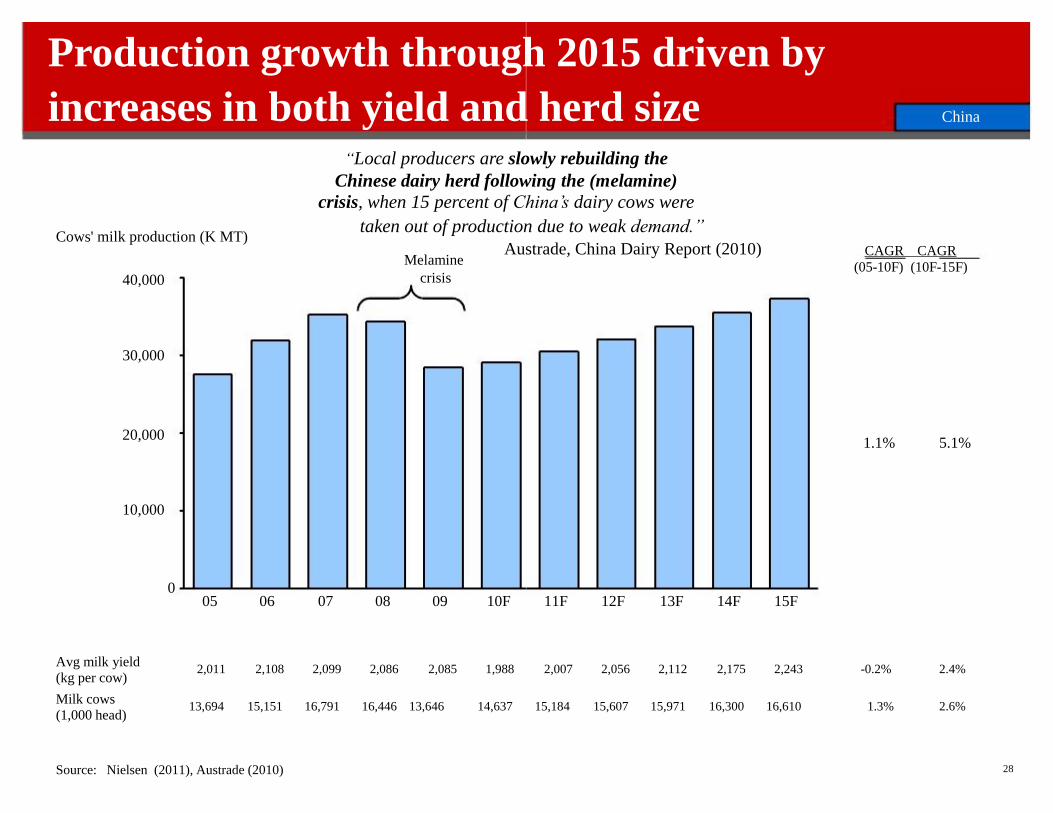
Austrade, China Dairy Report (2010)
0
20,000 10,000
Cows' milk production (K MT) 40,000 30,000
05 06 07 08 09 10F
2,011 2,108 2,099 2,086 2,085 1,988 Avg milk yield
(kg per cow)
13,694 15,151 16,791 16,446 13,646 14,637 Milk cows
(1,000 head)
Production growth through 2015 driven by
increases in both yield and herd size
“Local producers are slowly rebuilding the
Chinese dairy herd following the (melamine)
crisis, when 15 percent of China’s dairy cows were
taken out of production due to weak demand.” Melamine
crisis
Source: Nielsen (2011), Austrade (2010)
28
11F 12F 13F 14F 15F
1.1% 5.1%
CAGR CAGR
(05-10F) (10F-15F)
2,175 2,243 2,007 2,056 2,112
16,300 16,610 15,184 15,607 15,971 1.3%
-0.2%
2.6%
2.4%
China
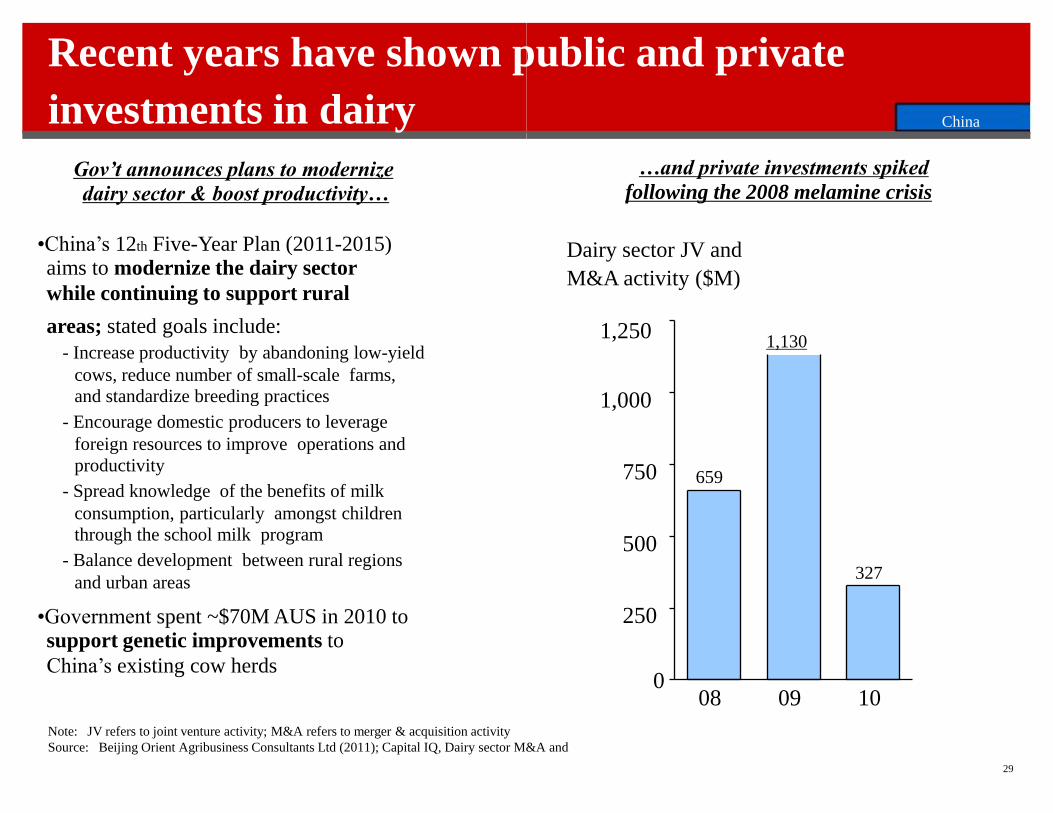
Recent years have shown public and private
Note: JV refers to joint venture activity; M&A refers to merger & acquisition activity
Source: Beijing Orient Agribusiness Consultants Ltd (2011); Capital IQ, Dairy sector M&A and
investments in dairy Gov’t announces plans to modernize
dairy sector & boost productivity… •China’s 12th Five-Year Plan (2011-2015) aims to modernize the dairy sector
while continuing to support rural
areas; stated goals include:
- Increase productivity by abandoning low-yield
cows, reduce number of small-scale farms,
and standardize breeding practices
- Encourage domestic producers to leverage
foreign resources to improve operations and
productivity
- Spread knowledge of the benefits of milk
consumption, particularly amongst children
through the school milk program
- Balance development between rural regions
and urban areas •Government spent ~$70M AUS in 2010 to support genetic improvements to
China’s existing cow herds
29
0
1,250 1,000 750 500 250
08
659
09
1,130
10
327
China
…and private investments spiked
following the 2008 melamine crisis Dairy sector JV and
M&A activity ($M)
Term Long
Term
2007
-2010 2011
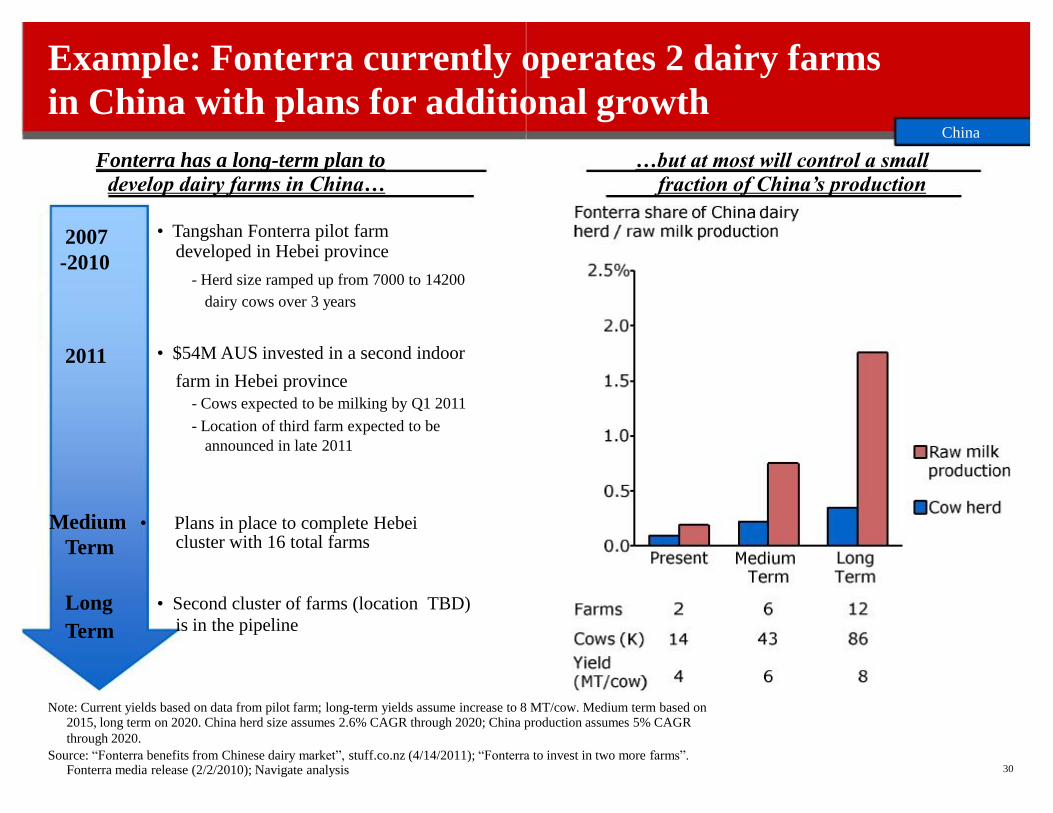
Fonterra has a long-term plan to
develop dairy farms in China…
• Tangshan Fonterra pilot farm developed in Hebei province
- Herd size ramped up from 7000 to 14200
dairy cows over 3 years • $54M AUS invested in a second indoor
farm in Hebei province
- Cows expected to be milking by Q1 2011
- Location of third farm expected to be
announced in late 2011 Medium • Plans in place to complete Hebei
cluster with 16 total farms • Second cluster of farms (location TBD)
is in the pipeline
Note: Current yields based on data from pilot farm; long-term yields assume increase to 8 MT/cow. Medium term based on 2015, long term on 2020. China herd size assumes 2.6% CAGR through 2020; China production assumes 5% CAGR
through 2020.
Source: “Fonterra benefits from Chinese dairy market”, stuff.co.nz (4/14/2011); “Fonterra to invest in two more farms”. Fonterra media release (2/2/2010); Navigate analysis 30
…but at most will control a small
fraction of China’s production
Example: Fonterra currently operates 2 dairy farms
in China with plans for additional growth China
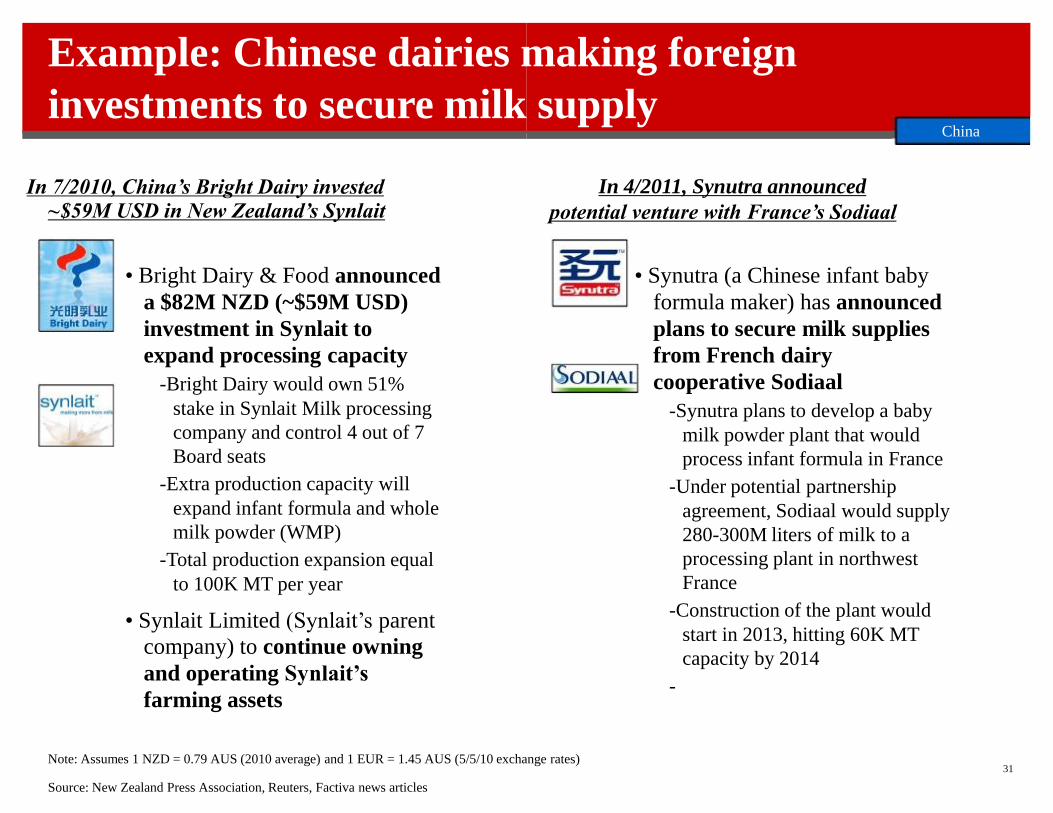
Example: Chinese dairies making foreign
investments to secure milk supply
In 7/2010, China’s Bright Dairy invested
~$59M USD in New Zealand’s Synlait • Bright Dairy & Food announced
a $82M NZD (~$59M USD)
investment in Synlait to
expand processing capacity
-Bright Dairy would own 51%
stake in Synlait Milk processing
company and control 4 out of 7
Board seats
-Extra production capacity will
expand infant formula and whole
milk powder (WMP)
-Total production expansion equal
to 100K MT per year • Synlait Limited (Synlait’s parent
company) to continue owning
and operating Synlait’s
farming assets
Source: New Zealand Press Association, Reuters, Factiva news articles
31
China
In 4/2011, Synutra announced
potential venture with France’s Sodiaal • Synutra (a Chinese infant baby
formula maker) has announced
plans to secure milk supplies
from French dairy
cooperative Sodiaal
-Synutra plans to develop a baby
milk powder plant that would
process infant formula in France
-Under potential partnership
agreement, Sodiaal would supply
280-300M liters of milk to a
processing plant in northwest
France
-Construction of the plant would
start in 2013, hitting 60K MT
capacity by 2014
-
Note: Assumes 1 NZD = 0.79 AUS (2010 average) and 1 EUR = 1.45 AUS (5/5/10 exchange rates)
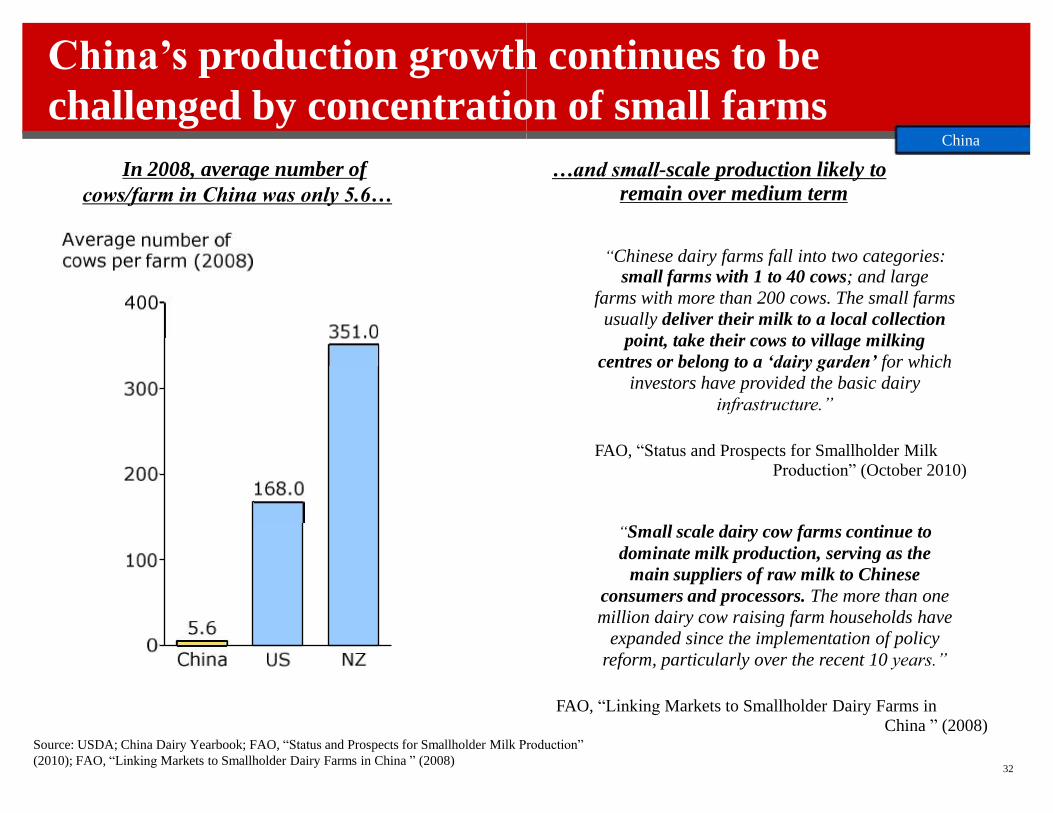
In 2008, average number of
cows/farm in China was only 5.6…
(2010); FAO, “Linking Markets to Smallholder Dairy Farms in China ” (2008)
32
“Chinese dairy farms fall into two categories: small farms with 1 to 40 cows; and large
farms with more than 200 cows. The small farms
usually deliver their milk to a local collection
point, take their cows to village milking
centres or belong to a ‘dairy garden’ for which
investors have provided the basic dairy
infrastructure.”
FAO, “Status and Prospects for Smallholder Milk
Production” (October 2010)
“Small scale dairy cow farms continue to
dominate milk production, serving as the
main suppliers of raw milk to Chinese
consumers and processors. The more than one
million dairy cow raising farm households have
expanded since the implementation of policy
reform, particularly over the recent 10 years.” FAO, “Linking Markets to Smallholder Dairy Farms in
China ” (2008) Source: USDA; China Dairy Yearbook; FAO, “Status and Prospects for Smallholder Milk Production”
…and small-scale production likely to
remain over medium term
China’s production growth continues to be
challenged by concentration of small farms China
Source: FAPRI (2011); Navigate analysis
33
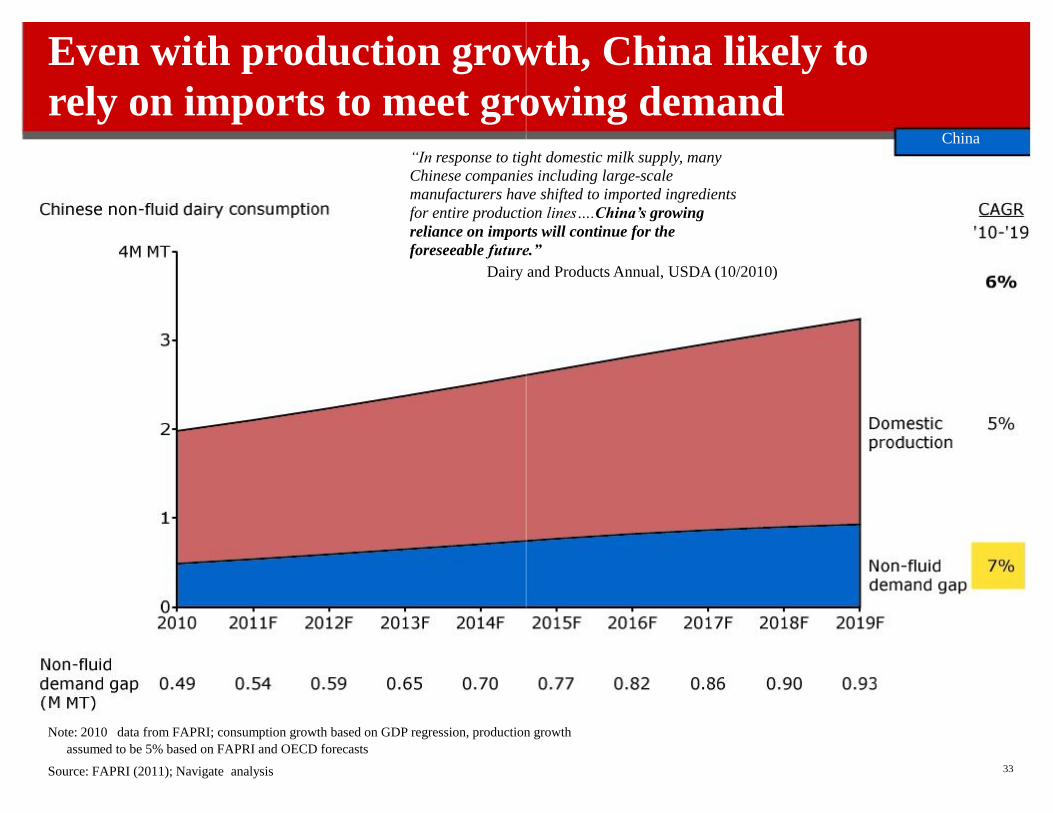
Even with production growth, China likely to
rely on imports to meet growing demand China
“In response to tight domestic milk supply, many
Chinese companies including large-scale
manufacturers have shifted to imported ingredients
for entire production lines….China’s growing
reliance on imports will continue for the
foreseeable future.”
Dairy and Products Annual, USDA (10/2010) Note: 2010 data from FAPRI; consumption growth based on GDP regression, production growth
assumed to be 5% based on FAPRI and OECD forecasts
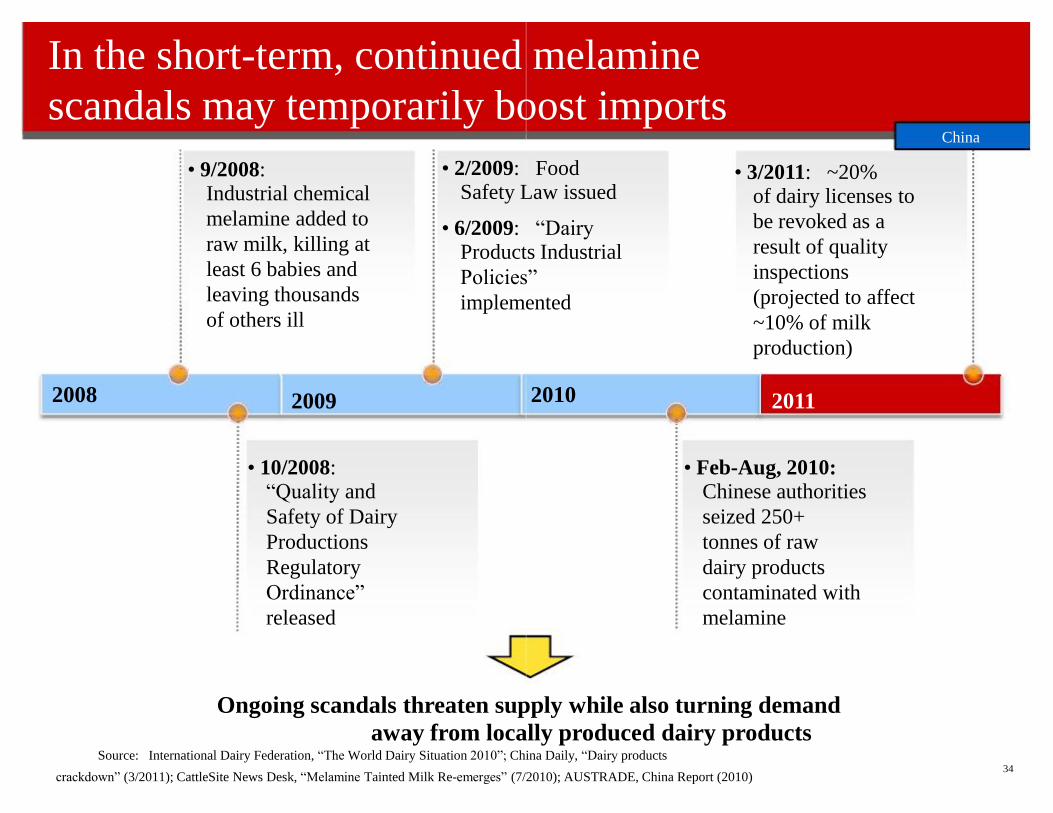
2008 2009 • 10/2008: “Quality and
Safety of Dairy
Productions
Regulatory
Ordinance”
released
• 9/2008: Industrial chemical
melamine added to
raw milk, killing at
least 6 babies and
leaving thousands
of others ill
34
2010
• 2/2009: Food Safety Law issued • 6/2009: “Dairy Products Industrial
Policies”
implemented
• 3/2011: ~20% of dairy licenses to
be revoked as a
result of quality
inspections
(projected to affect
~10% of milk
production)
2011 • Feb-Aug, 2010:
Chinese authorities
seized 250+
tonnes of raw
dairy products
contaminated with
melamine
crackdown” (3/2011); CattleSite News Desk, “Melamine Tainted Milk Re-emerges” (7/2010); AUSTRADE, China Report (2010)
In the short-term, continued melamine
scandals may temporarily boost imports China
Ongoing scandals threaten supply while also turning demand
away from locally produced dairy products Source: International Dairy Federation, “The World Dairy Situation 2010”; China Daily, “Dairy products
Contents
•Project objectives and summary findings
•Global dairy buyers’ perspectives on Australian dairy
•Other wildcards
-Commodity price outlook
-Fat consumption trends
-Food spend analysis, currency outlook
•Summary
83
•Geography-specific findings – net exporters
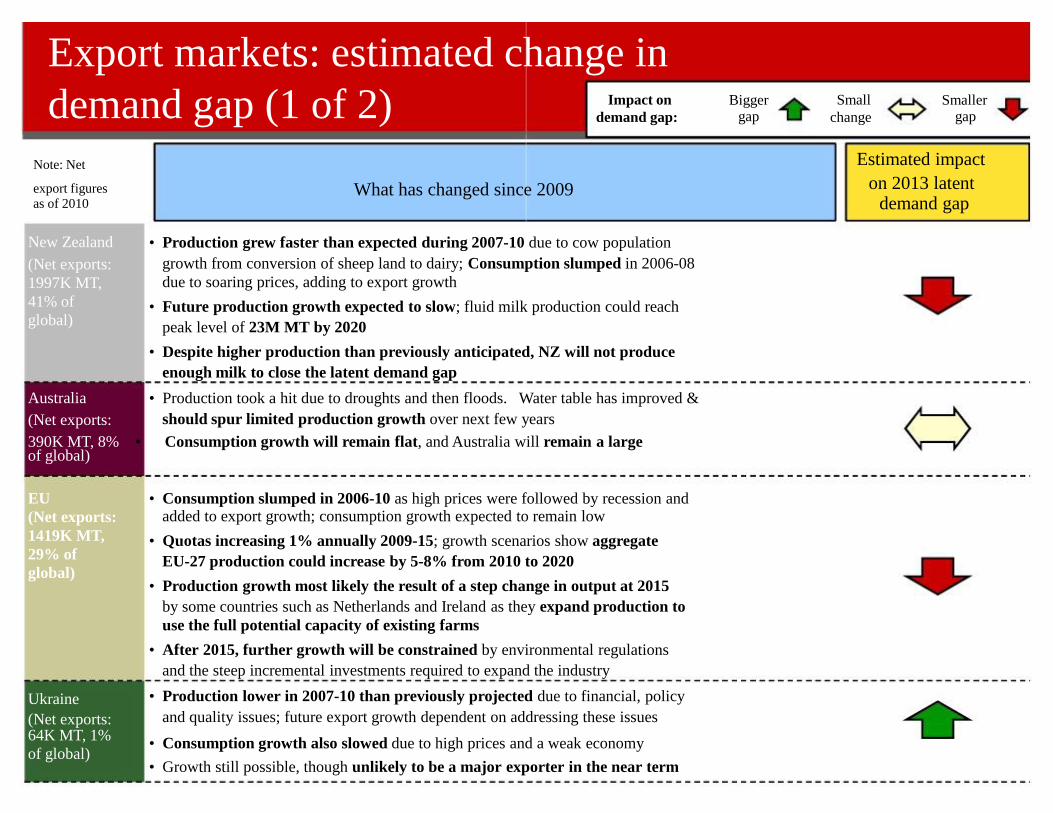
Export markets: estimated change in
demand gap (1 of 2)
EU
(Net exports:
1419K MT,
29% of
global) Ukraine
(Net exports: 64K MT, 1%
of global) • Consumption growth also slowed due to high prices and a weak economy
• Growth still possible, though unlikely to be a major exporter in the near term
Note: Net
export figures as of 2010 New Zealand
(Net exports:
1997K MT,
41% of
global) Australia
(Net exports:
What has changed since 2009 • Production grew faster than expected during 2007-10 due to cow population
growth from conversion of sheep land to dairy; Consumption slumped in 2006-08
due to soaring prices, adding to export growth
• Future production growth expected to slow; fluid milk production could reach
peak level of 23M MT by 2020
• Despite higher production than previously anticipated, NZ will not produce
enough milk to close the latent demand gap
• Production took a hit due to droughts and then floods. Water table has improved &
should spur limited production growth over next few years
390K MT, 8% • Consumption growth will remain flat, and Australia will remain a large of global)
• Consumption slumped in 2006-10 as high prices were followed by recession and added to export growth; consumption growth expected to remain low
• Quotas increasing 1% annually 2009-15; growth scenarios show aggregate
EU-27 production could increase by 5-8% from 2010 to 2020
• Production growth most likely the result of a step change in output at 2015
by some countries such as Netherlands and Ireland as they expand production to
use the full potential capacity of existing farms
• After 2015, further growth will be constrained by environmental regulations
and the steep incremental investments required to expand the industry
• Production lower in 2007-10 than previously projected due to financial, policy
and quality issues; future export growth dependent on addressing these issues
Estimated impact
on 2013 latent demand gap
Bigger gap
Small
change
Smaller gap
Impact on
demand gap:
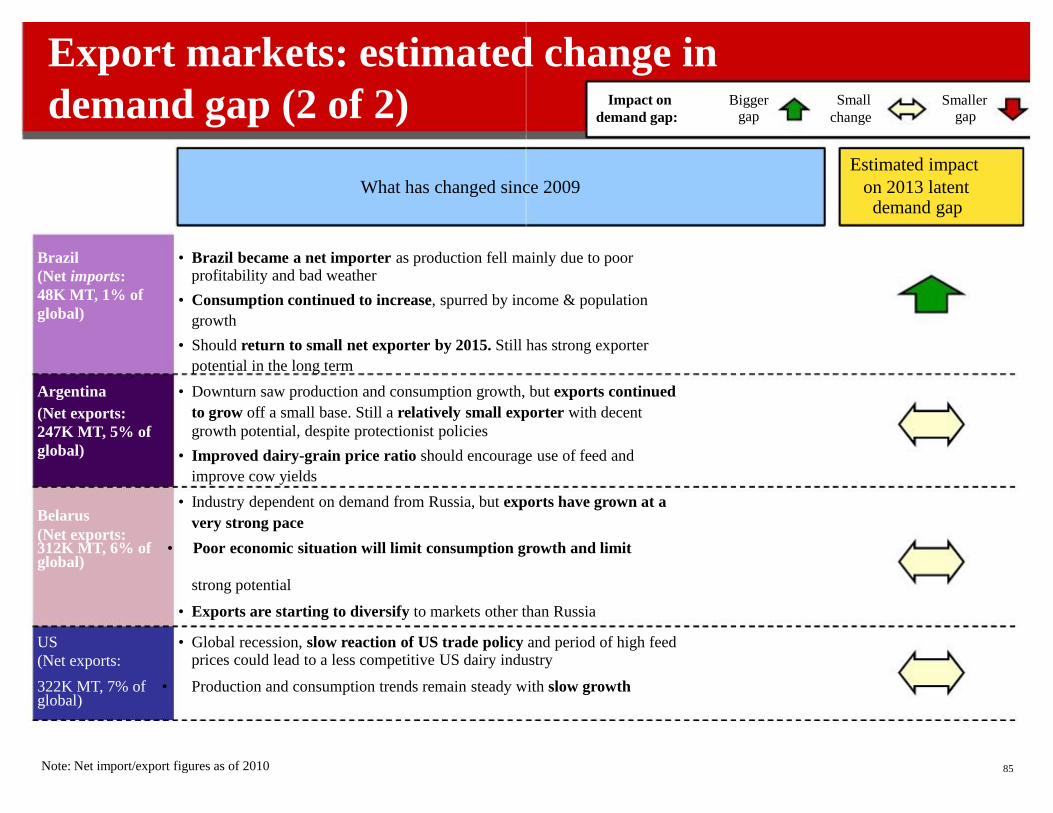
Export markets: estimated change in
demand gap (2 of 2)
Brazil
(Net imports:
48K MT, 1% of
global) Argentina
(Net exports:
247K MT, 5% of
global)
Belarus
(Net exports: 312K MT, 6% of • Poor economic situation will limit consumption growth and limit global)
strong potential
• Exports are starting to diversify to markets other than Russia
US
(Net exports:
What has changed since 2009
Note: Net import/export figures as of 2010
85
• Brazil became a net importer as production fell mainly due to poor profitability and bad weather
• Consumption continued to increase, spurred by income & population
growth
• Should return to small net exporter by 2015. Still has strong exporter
potential in the long term
• Downturn saw production and consumption growth, but exports continued
to grow off a small base. Still a relatively small exporter with decent
growth potential, despite protectionist policies
• Improved dairy-grain price ratio should encourage use of feed and
improve cow yields
• Industry dependent on demand from Russia, but exports have grown at a
very strong pace
• Global recession, slow reaction of US trade policy and period of high feed prices could lead to a less competitive US dairy industry
322K MT, 7% of • Production and consumption trends remain steady with slow growth global)
Estimated impact
on 2013 latent demand gap
Bigger gap
Small
change
Smaller gap
Impact on
demand gap:
Summary: New Zealand
population growth of 2% and an expected yield increase of ~1%
• Due largely to land conversion, raw milk production expected to approach
peak of 23M MT by 2020, with very slow to flat growth thereafter
-Estimated 2020 production implies 27% expansion above 2010 levels (~2% CAGR), which is dependent on environmental regulation remaining weak and continued strong
milk prices vs. competing sheep/beef prices to support land conversion
-Beyond 2020, yield improvements likely to be the sole source of production growth,
which is expected to be very slow to flat
prices, mostly on butter and cheese
86
• Mid-term production growth is expected at 2-3% CAGR, driven by cow
• Non-fluid consumption fell by nearly 25% from 2006-08 due to soaring
New Zealand
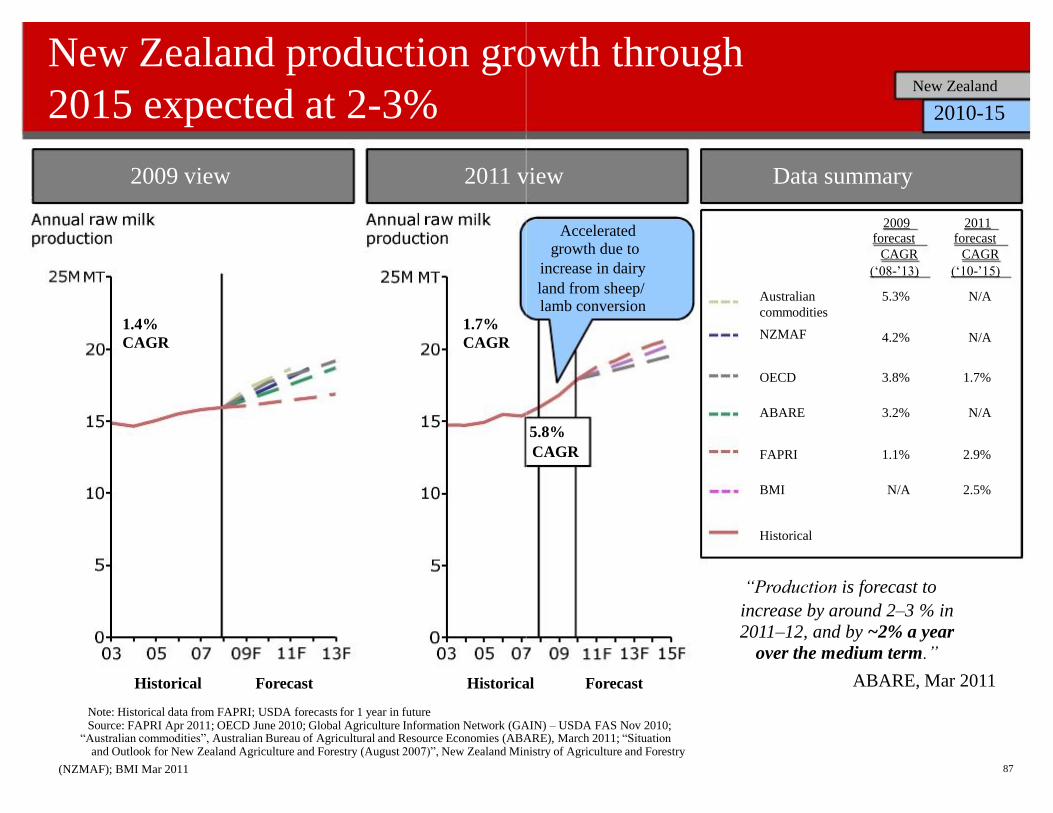
New Zealand production growth through
2015 expected at 2-3%
2009 view 2011 view
1.4%
CAGR
1.7%
CAGR
Forecast Historical Historical
(NZMAF); BMI Mar 2011
87
Note: Historical data from FAPRI; USDA forecasts for 1 year in future Source: FAPRI Apr 2011; OECD June 2010; Global Agriculture Information Network (GAIN) – USDA FAS Nov 2010;
“Australian commodities”, Australian Bureau of Agricultural and Resource Economies (ABARE), March 2011; “Situation and Outlook for New Zealand Agriculture and Forestry (August 2007)”, New Zealand Ministry of Agriculture and Forestry
Data summary
2009 forecast
CAGR
(‘08-’13)
2011 forecast
CAGR
(‘10-’15)
Australian
commodities
NZMAF
5.3% 4.2%
N/A N/A
OECD ABARE
3.8% 3.2%
1.7% N/A
FAPRI BMI
1.1% N/A
2.9% 2.5%
Forecast
5.8%
CAGR
New Zealand
2010-15
Accelerated growth due to
increase in dairy
land from sheep/ lamb conversion
Historical
“Production is forecast to
increase by around 2–3 % in
2011–12, and by ~2% a year
over the medium term.”
ABARE, Mar 2011
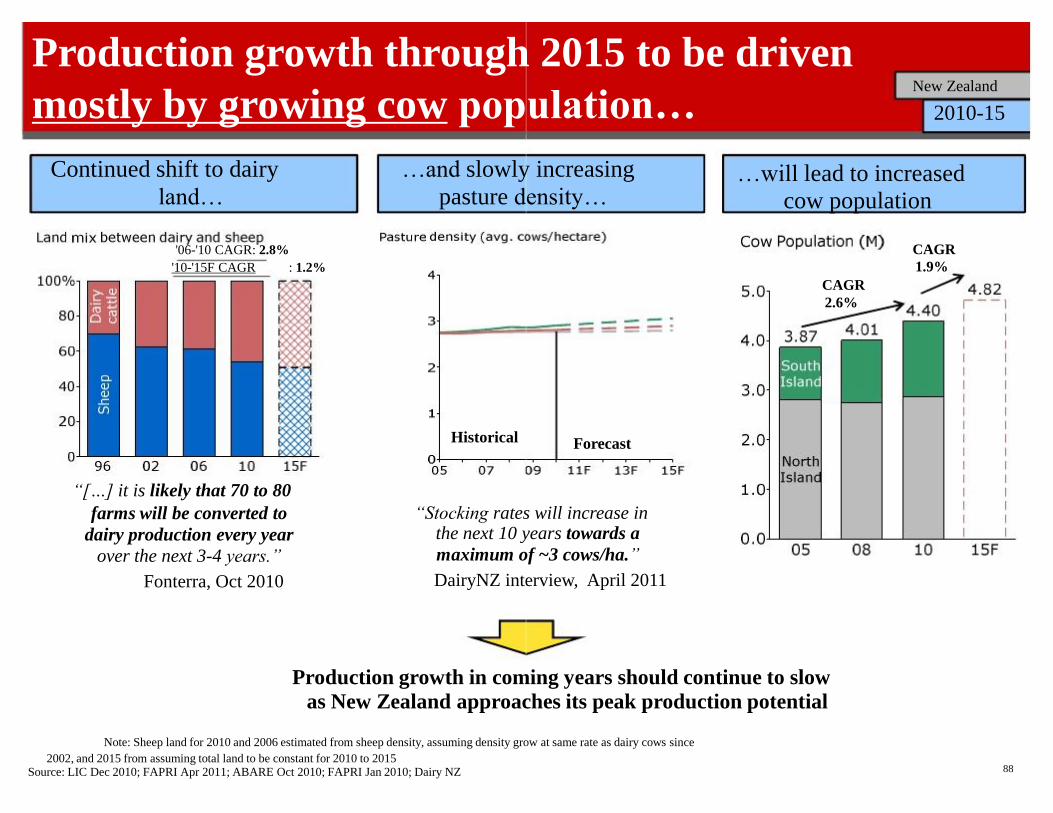
Production growth through 2015 to be driven
mostly by growing cow population…
Continued shift to dairy
land… '06-'10 CAGR: 2.8%
'10-'15F CAGR : 1.2%
“[…] it is likely that 70 to 80
farms will be converted to
dairy production every year
over the next 3-4 years.”
Fonterra, Oct 2010
Production growth in coming years should continue to slow
as New Zealand approaches its peak production potential
Note: Sheep land for 2010 and 2006 estimated from sheep density, assuming density grow at same rate as dairy cows since
2002, and 2015 from assuming total land to be constant for 2010 to 2015 Source: LIC Dec 2010; FAPRI Apr 2011; ABARE Oct 2010; FAPRI Jan 2010; Dairy NZ
88
…will lead to increased
cow population CAGR
1.9%
CAGR
2.6%
…and slowly increasing
pasture density… Historical Forecast
“Stocking rates will increase in the next 10 years towards a
maximum of ~3 cows/ha.”
DairyNZ interview, April 2011
New Zealand
2010-15
0
3 2
5MT
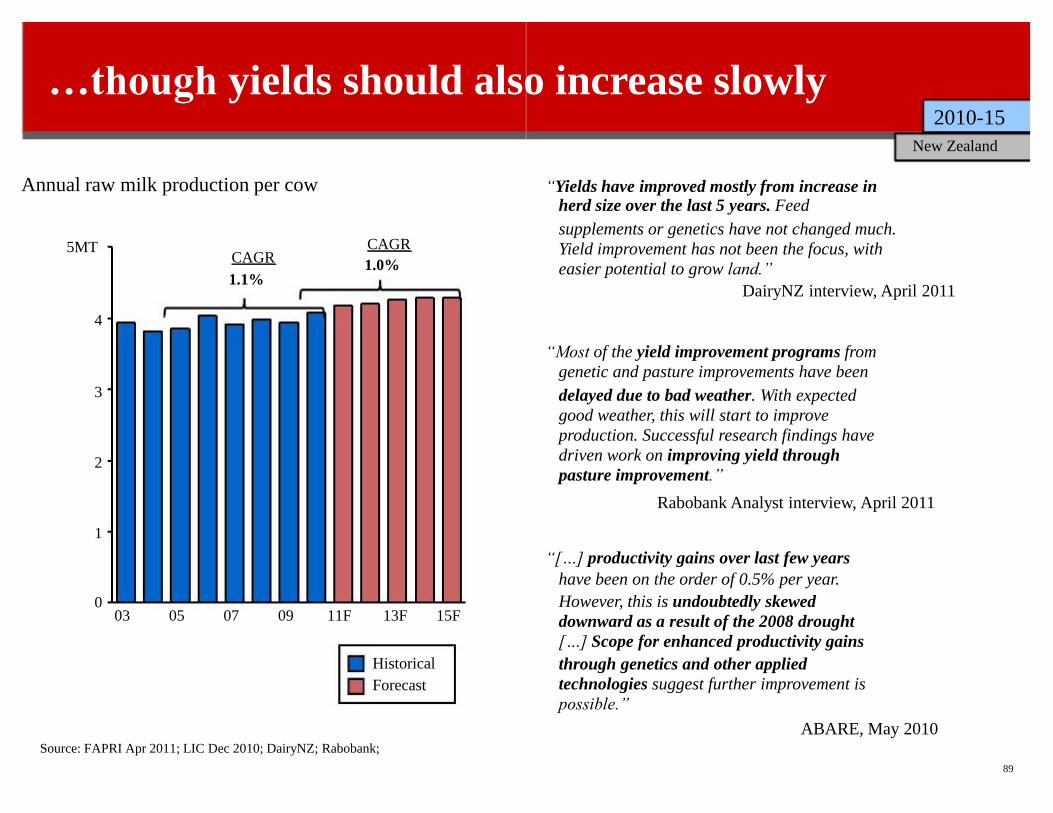
03 05 07 09 11F 13F 15F
Annual raw milk production per cow
CAGR
1.1%
CAGR
1.0%
Historical
Forecast
89
“Yields have improved mostly from increase in herd size over the last 5 years. Feed
supplements or genetics have not changed much.
Yield improvement has not been the focus, with
easier potential to grow land.”
DairyNZ interview, April 2011
4 “Most of the yield improvement programs from
genetic and pasture improvements have been
delayed due to bad weather. With expected
good weather, this will start to improve
production. Successful research findings have
driven work on improving yield through
pasture improvement.”
Rabobank Analyst interview, April 2011 1
“[…] productivity gains over last few years
have been on the order of 0.5% per year.
However, this is undoubtedly skewed
downward as a result of the 2008 drought
[…] Scope for enhanced productivity gains
through genetics and other applied
technologies suggest further improvement is
possible.”
ABARE, May 2010 Source: FAPRI Apr 2011; LIC Dec 2010; DairyNZ; Rabobank;
…though yields should also increase slowly 2010-15
New Zealand
Source: Fonterra; Navigate analysis
90
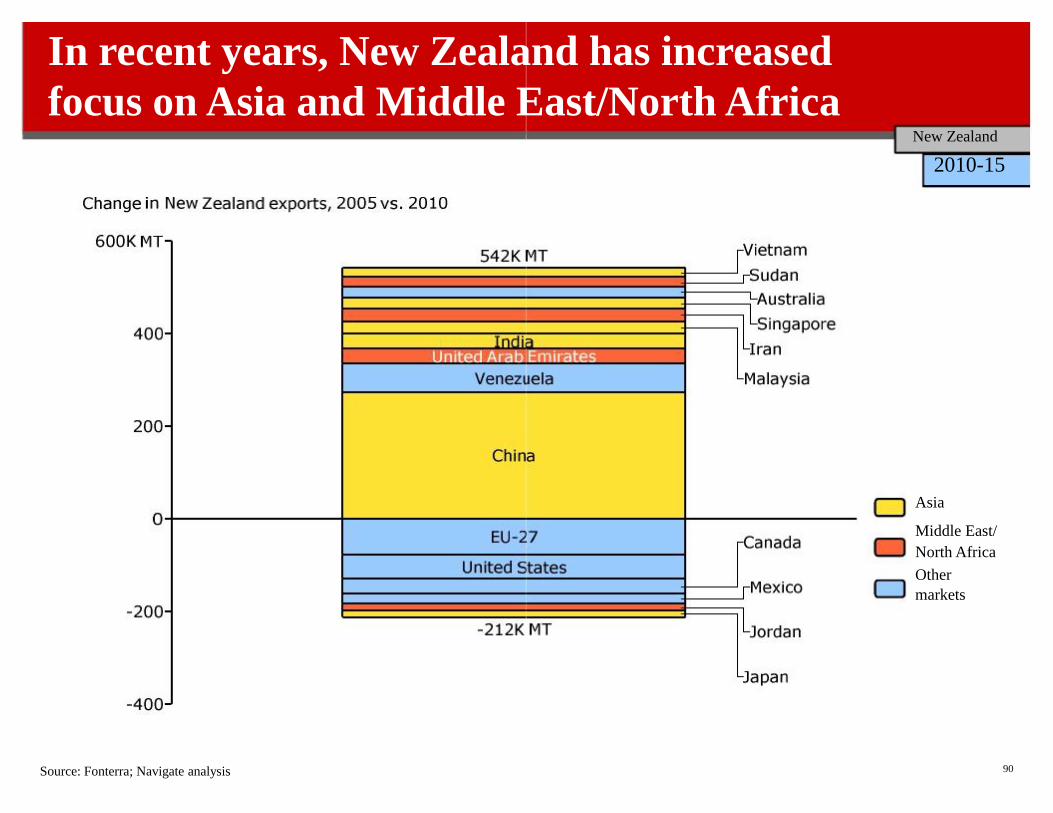
In recent years, New Zealand has increased
focus on Asia and Middle East/North Africa New Zealand
2010-15 Asia
Middle East/
North Africa
Other
markets
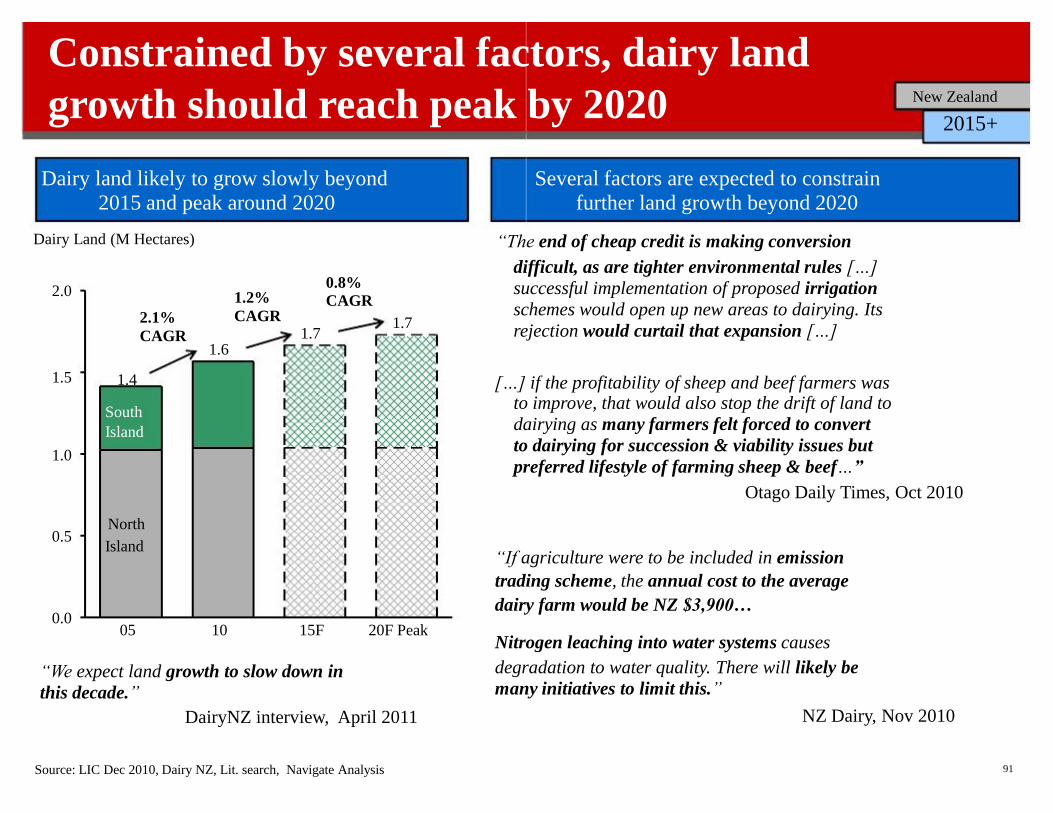
Constrained by several factors, dairy land
growth should reach peak by 2020
0.0
1.5 1.0 0.5
2.0
05
1.4 South
Island North
Island
10
1.6
15F 20F Peak
1.7
0.8%
CAGR 1.7
“We expect land growth to slow down in
this decade.”
DairyNZ interview, April 2011
Dairy land likely to grow slowly beyond 2015 and peak around 2020 Dairy Land (M Hectares)
1.2%
CAGR 2.1%
CAGR
Source: LIC Dec 2010, Dairy NZ, Lit. search, Navigate Analysis 91
difficult, as are tighter environmental rules […]
successful implementation of proposed irrigation
schemes would open up new areas to dairying. Its
rejection would curtail that expansion […]
New Zealand
2015+
Several factors are expected to constrain further land growth beyond 2020 “The end of cheap credit is making conversion
[…] if the profitability of sheep and beef farmers was to improve, that would also stop the drift of land to
dairying as many farmers felt forced to convert
to dairying for succession & viability issues but
preferred lifestyle of farming sheep & beef…”
Otago Daily Times, Oct 2010 “If agriculture were to be included in emission
trading scheme, the annual cost to the average
dairy farm would be NZ $3,900… Nitrogen leaching into water systems causes
degradation to water quality. There will likely be
many initiatives to limit this.”
NZ Dairy, Nov 2010
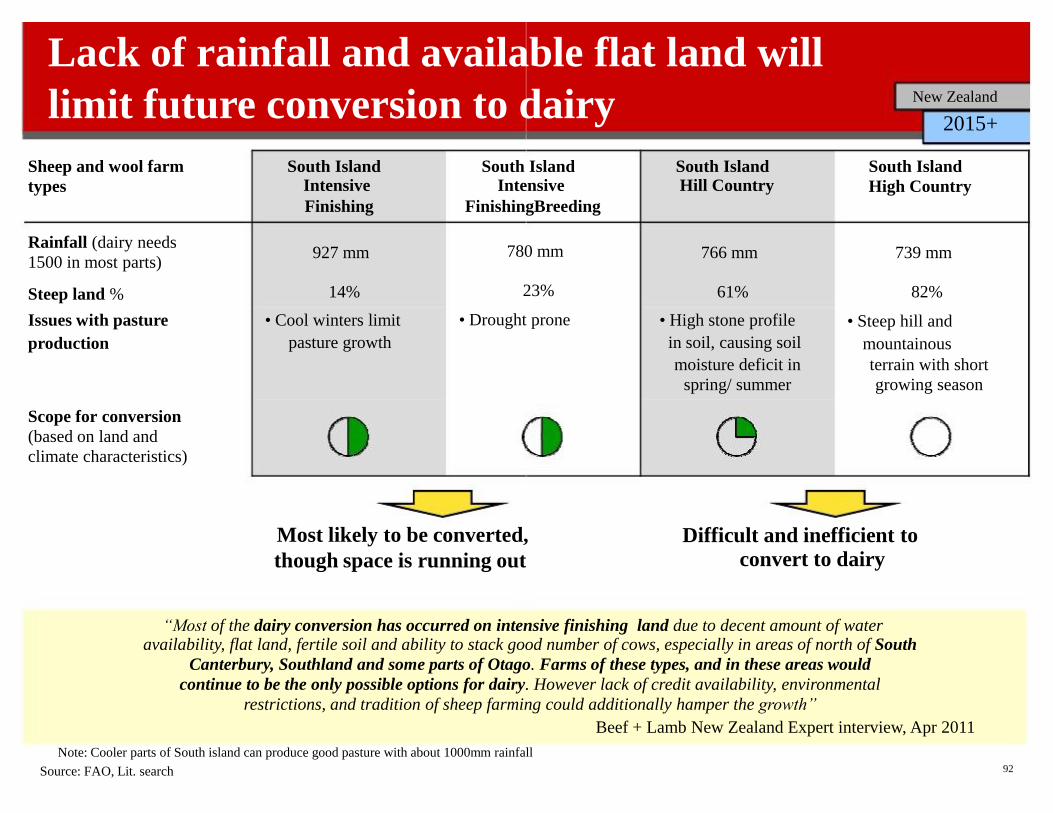
Sheep and wool farm
types
South Island Intensive
Finishing
South Island Intensive
FinishingBreeding
Rainfall (dairy needs
1500 in most parts) Steep land %
Issues with pasture
production
927 mm 14%
• Cool winters limit
pasture growth
780 mm 23%
• Drought prone
Scope for conversion
(based on land and
climate characteristics)
Source: FAO, Lit. search
92
Lack of rainfall and available flat land will
limit future conversion to dairy New Zealand
2015+
South Island Hill Country
South Island
High Country
766 mm 61%
• High stone profile
in soil, causing soil
moisture deficit in
spring/ summer
739 mm 82%
• Steep hill and
mountainous
terrain with short
growing season
“Most of the dairy conversion has occurred on intensive finishing land due to decent amount of water availability, flat land, fertile soil and ability to stack good number of cows, especially in areas of north of South
Canterbury, Southland and some parts of Otago. Farms of these types, and in these areas would
continue to be the only possible options for dairy. However lack of credit availability, environmental
restrictions, and tradition of sheep farming could additionally hamper the growth”
Beef + Lamb New Zealand Expert interview, Apr 2011
Note: Cooler parts of South island can produce good pasture with about 1000mm rainfall
Most likely to be converted,
though space is running out
Difficult and inefficient to
convert to dairy
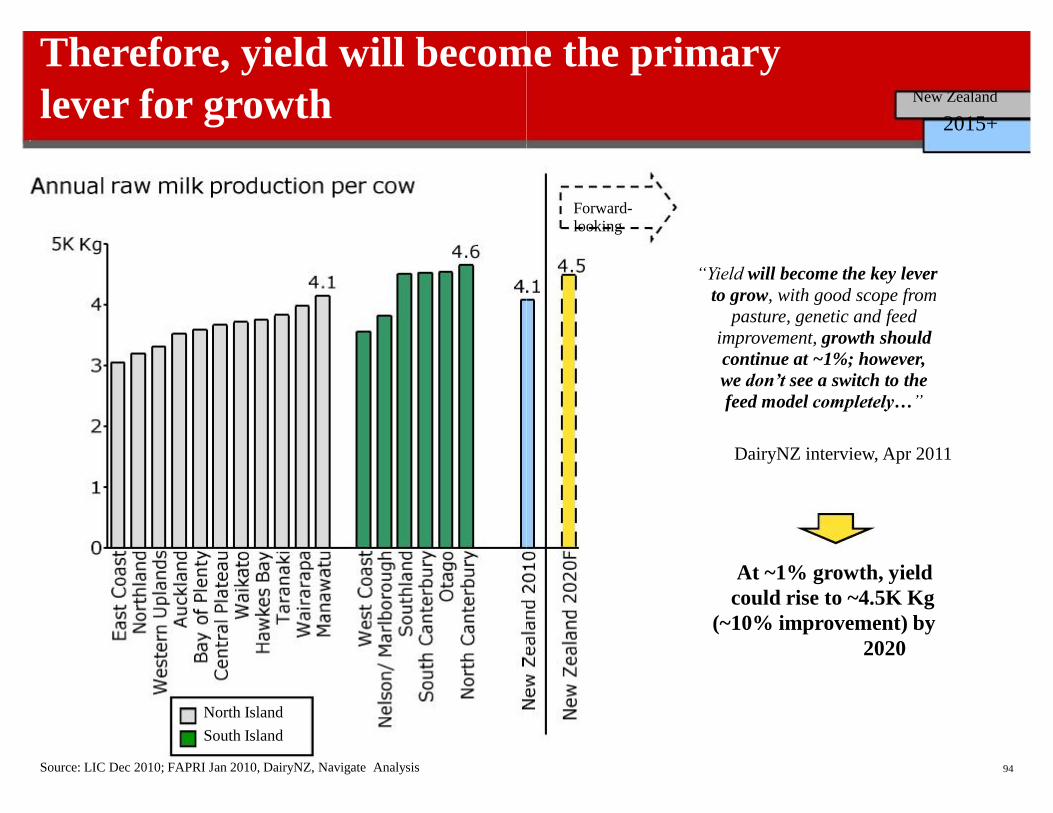
Therefore, yield will become the primary
lever for growth
Source: LIC Dec 2010; FAPRI Jan 2010, DairyNZ, Navigate Analysis
94
Forward- looking
“Yield will become the key lever
to grow, with good scope from
pasture, genetic and feed
improvement, growth should
continue at ~1%; however,
we don’t see a switch to the
feed model completely…” DairyNZ interview, Apr 2011
At ~1% growth, yield
could rise to ~4.5K Kg
(~10% improvement) by
2020 North Island
South Island
New Zealand
2015+
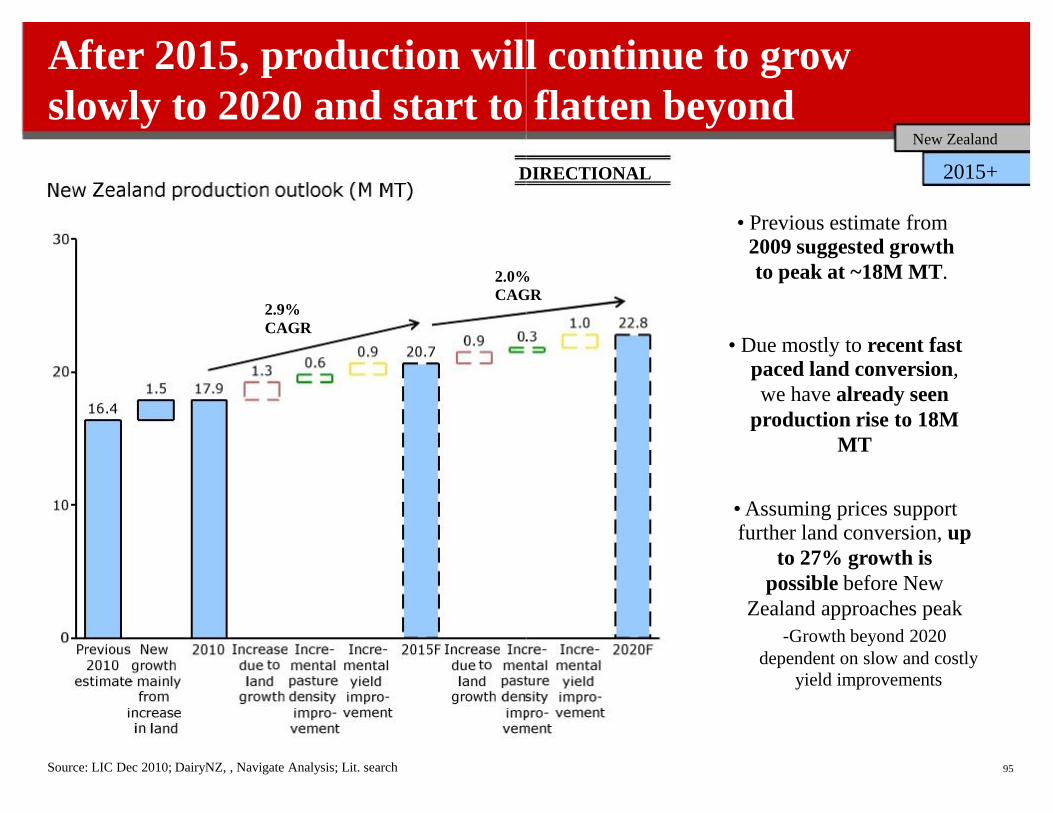
DIRECTIONAL 2.0%
CAGR 2.9%
CAGR
95 Source: LIC Dec 2010; DairyNZ, , Navigate Analysis; Lit. search
After 2015, production will continue to grow
slowly to 2020 and start to flatten beyond New Zealand
2015+
• Previous estimate from 2009 suggested growth
to peak at ~18M MT.
• Due mostly to recent fast
paced land conversion,
we have already seen
production rise to 18M
MT
• Assuming prices support further land conversion, up
to 27% growth is
possible before New
Zealand approaches peak
-Growth beyond 2020
dependent on slow and costly
yield improvements
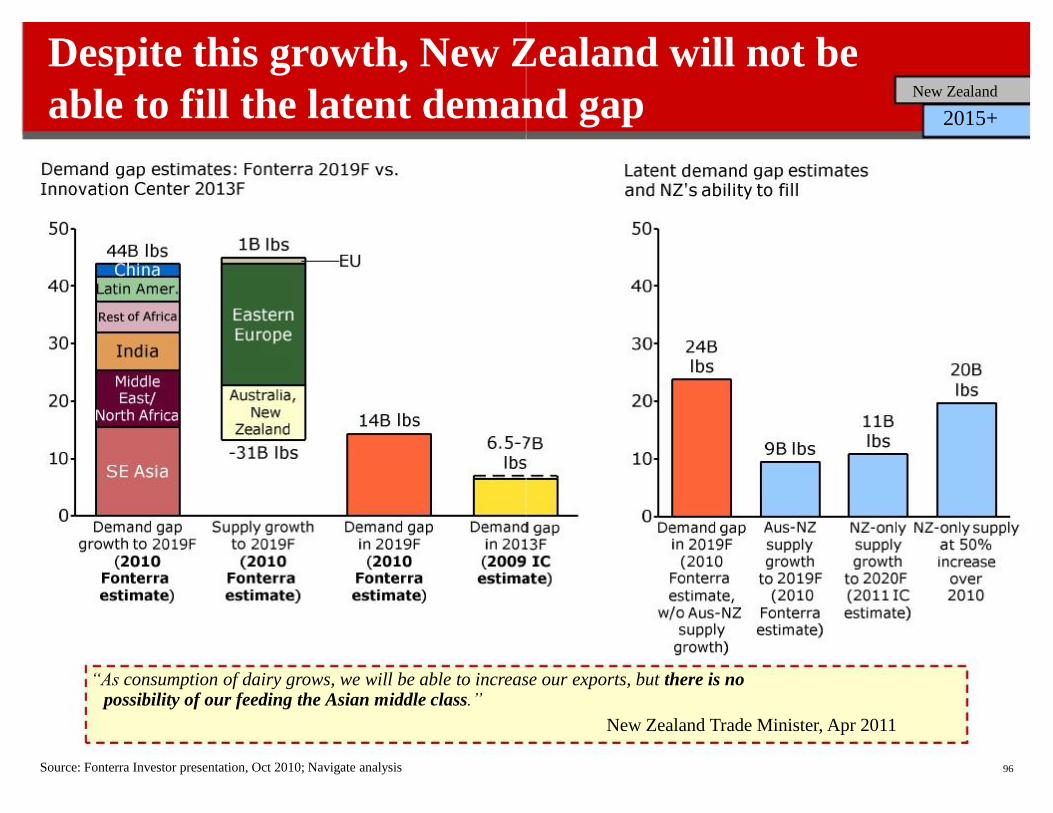
Despite this growth, New Zealand will not be
able to fill the latent demand gap
Source: Fonterra Investor presentation, Oct 2010; Navigate analysis
96
New Zealand
2015+
“As consumption of dairy grows, we will be able to increase our exports, but there is no possibility of our feeding the Asian middle class.”
New Zealand Trade Minister, Apr 2011
40 20
80K MT
Annual non-fluid dairy consumption
03 05 07 09F 11F 13F
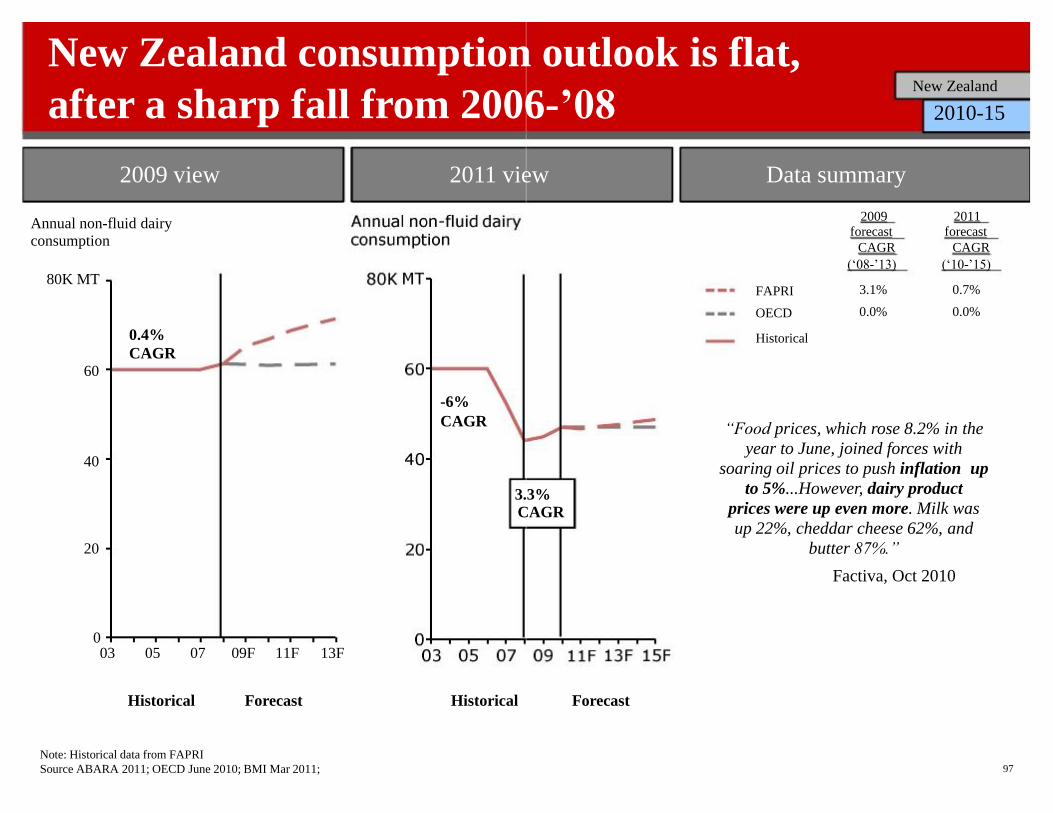
New Zealand consumption outlook is flat,
Note: Historical data from FAPRI
2009 view 2011 view
0.4%
CAGR 60 -6%
CAGR
Forecast Historical Historical
3.3% CAGR
Source ABARA 2011; OECD June 2010; BMI Mar 2011; 97
after a sharp fall from 2006-’08
Data summary
2009 forecast
CAGR
(‘08-’13)
2011 forecast
CAGR
(‘10-’15)
3.1%
0.0%
0.7%
0.0%
FAPRI
OECD
Historical
Forecast
“Food prices, which rose 8.2% in the
year to June, joined forces with
soaring oil prices to push inflation up
to 5%...However, dairy product
prices were up even more. Milk was
up 22%, cheddar cheese 62%, and
butter 87%.”
Factiva, Oct 2010 0
New Zealand
2010-15
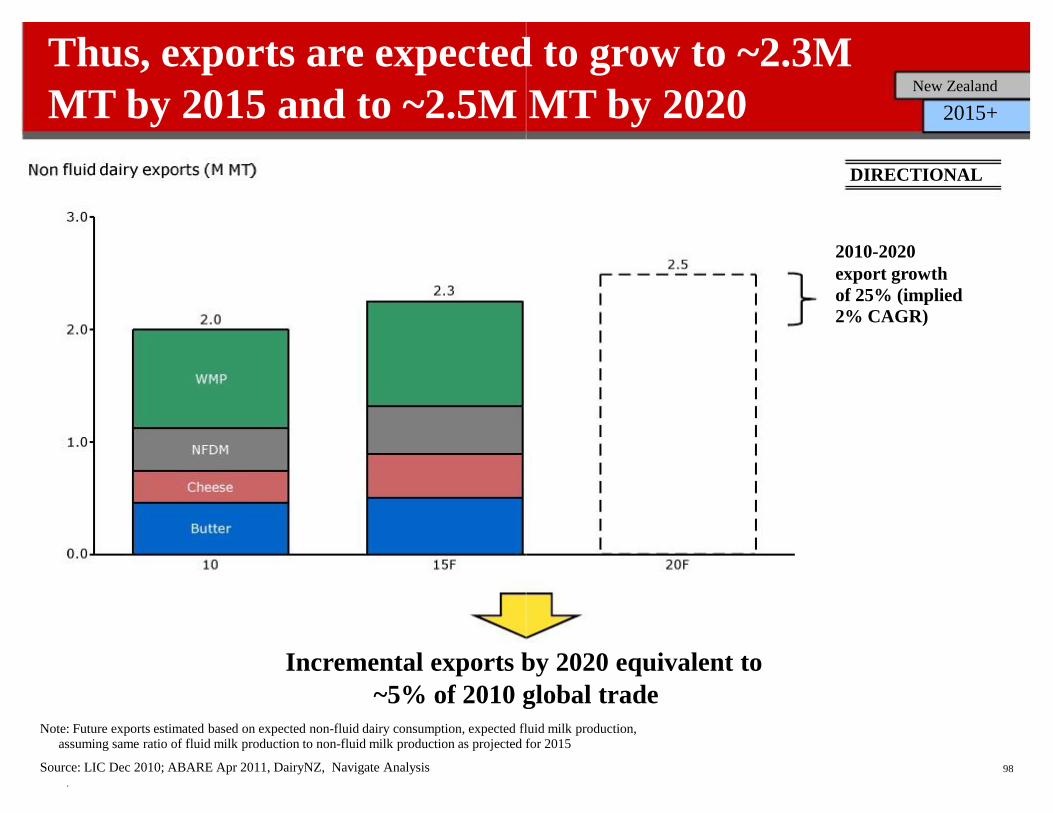
Thus, exports are expected to grow to ~2.3M
MT by 2015 and to ~2.5M MT by 2020
Source: LIC Dec 2010; ABARE Apr 2011, DairyNZ, Navigate Analysis .
98
DIRECTIONAL 2010-2020
export growth
of 25% (implied
2% CAGR) Incremental exports by 2020 equivalent to
~5% of 2010 global trade Note: Future exports estimated based on expected non-fluid dairy consumption, expected fluid milk production, assuming same ratio of fluid milk production to non-fluid milk production as projected for 2015
New Zealand
2015+
Summary: Australia
expected to grow at 1-2%
-Increments would be due to improved water availability in main dairying
regions from floods in 2010-2011
99
• Milk production declined during 2008-2010 by 1.3%, but is
-Milk production will be driven by increase in yield of ~1% p.a. driven by increased feeding of grains and forage crops, improved herd genetics as well
as advances in pasture management
• There is limited potential for Australia to grow beyond that due to
limited water, frequent bad weather spells and little potential to improve
yields
• Consumption has shown slight decline since ’08; expected to
grow slowly at ~1% in the future driven by population growth,
supported by growing incomes
Australia
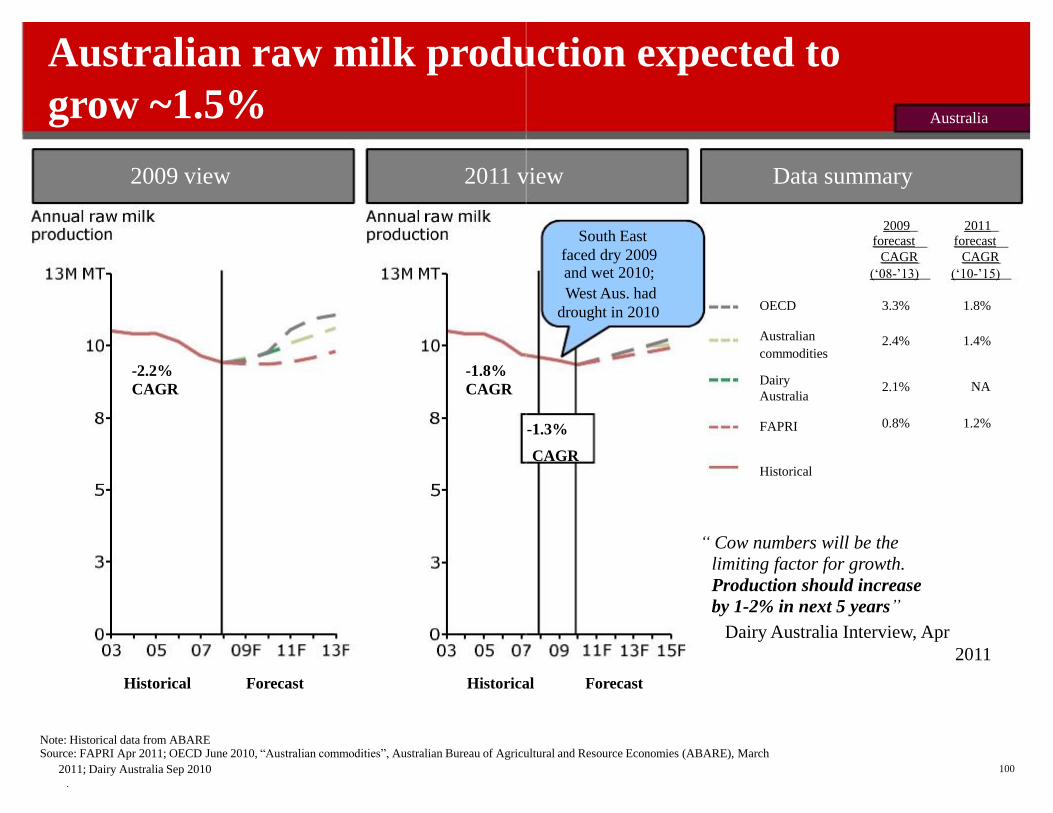
Australian raw milk production expected to
grow ~1.5%
Note: Historical data from ABARE Source: FAPRI Apr 2011; OECD June 2010, “Australian commodities”, Australian Bureau of Agricultural and Resource Economies (ABARE), March
2009 view 2011 view
-2.2%
CAGR
-1.8%
CAGR
Forecast Historical Historical
2011; Dairy Australia Sep 2010
.
100
Data summary
2009 forecast
CAGR
(‘08-’13)
2011 forecast
CAGR
(‘10-’15)
OECD Australian
commodities
3.3% 2.4%
1.8% 1.4%
Dairy
Australia FAPRI
2.1% 0.8%
NA 1.2%
Forecast
-1.3%
CAGR Historical “ Cow numbers will be the
limiting factor for growth.
Production should increase
by 1-2% in next 5 years”
Dairy Australia Interview, Apr
2011
South East
faced dry 2009 and wet 2010;
West Aus. had
drought in 2010
Australia
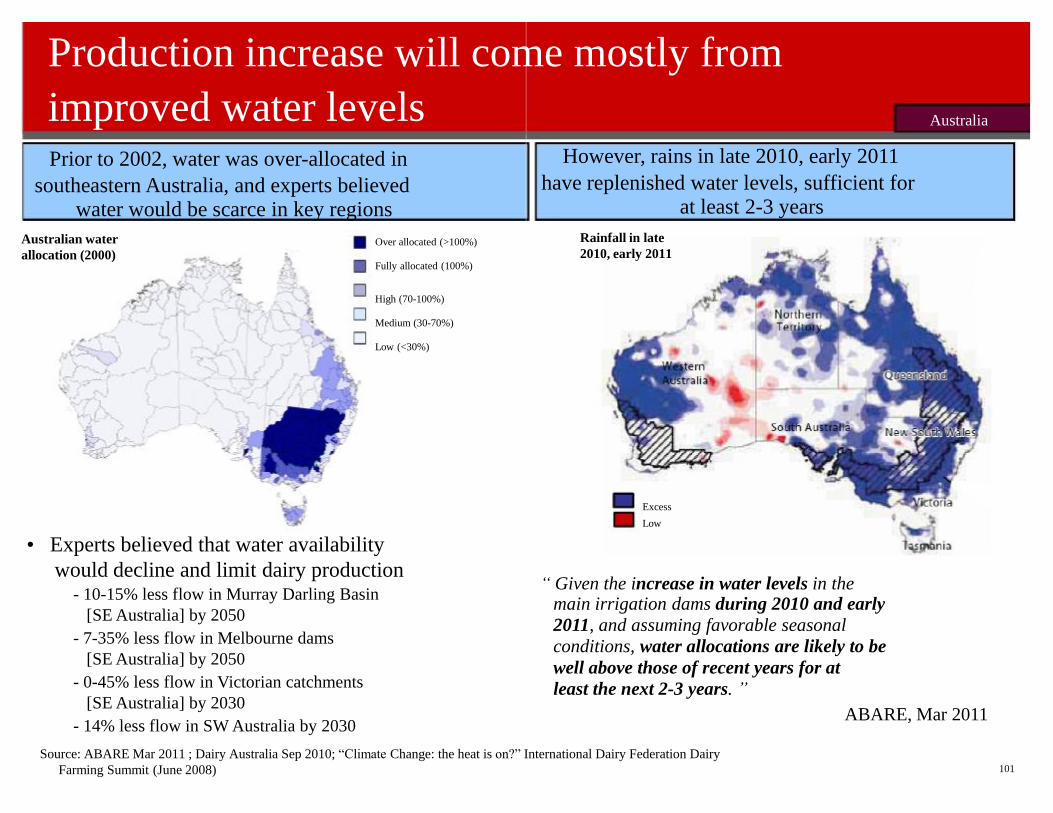
improved water levels Prior to 2002, water was over-allocated in
southeastern Australia, and experts believed water would be scarce in key regions
Australian water
allocation (2000) Over allocated (>100%)
Fully allocated (100%)
would decline and limit dairy production - 10-15% less flow in Murray Darling Basin
[SE Australia] by 2050
- 7-35% less flow in Melbourne dams
[SE Australia] by 2050
- 0-45% less flow in Victorian catchments
[SE Australia] by 2030
- 14% less flow in SW Australia by 2030
Farming Summit (June 2008)
101
Production increase will come mostly from
“ Given the increase in water levels in the main irrigation dams during 2010 and early
2011, and assuming favorable seasonal
conditions, water allocations are likely to be
well above those of recent years for at
least the next 2-3 years. ”
ABARE, Mar 2011
Source: ABARE Mar 2011 ; Dairy Australia Sep 2010; “Climate Change: the heat is on?” International Dairy Federation Dairy
High (70-100%)
Medium (30-70%)
Low (<30%)
Excess
Low
• Experts believed that water availability
Rainfall in late
2010, early 2011
Australia However, rains in late 2010, early 2011
have replenished water levels, sufficient for at least 2-3 years
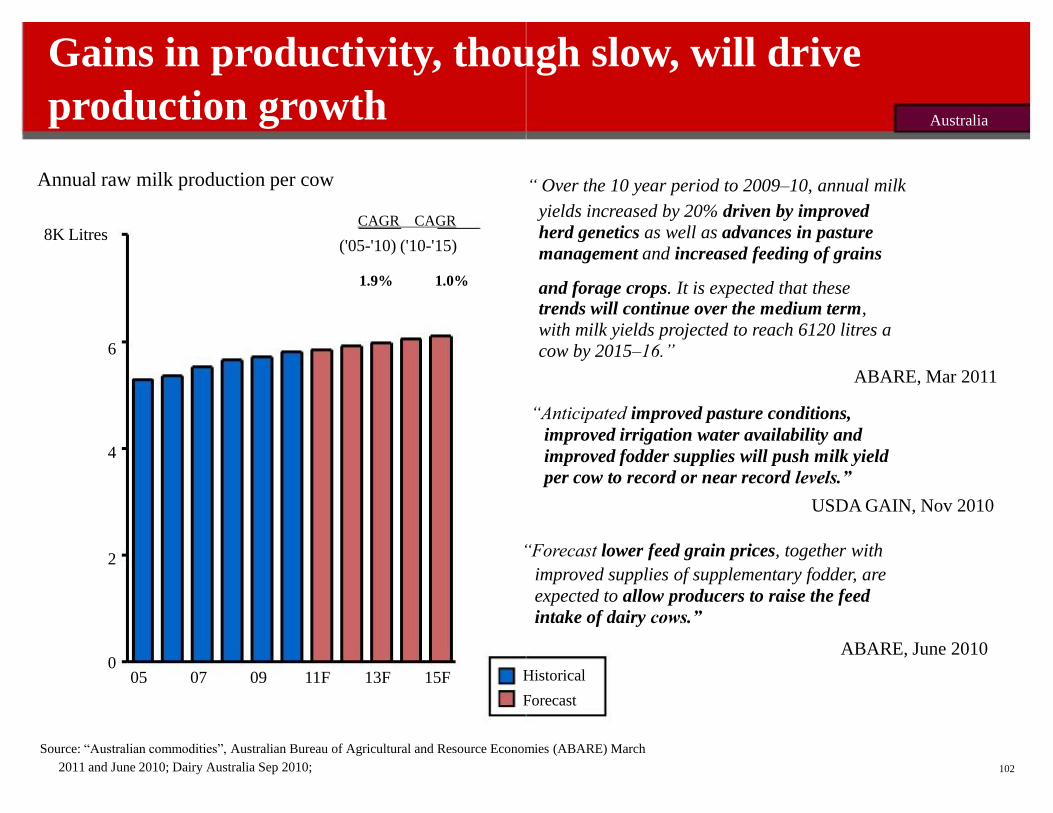
Gains in productivity, though slow, will drive
0
6 4 2
8K Litres
05 07 09 11F 13F 15F
production growth Annual raw milk production per cow
1.9% 1.0%
CAGR CAGR
('05-'10) ('10-'15)
Historical
Forecast Source: “Australian commodities”, Australian Bureau of Agricultural and Resource Economies (ABARE) March
2011 and June 2010; Dairy Australia Sep 2010; 102
yields increased by 20% driven by improved
herd genetics as well as advances in pasture
management and increased feeding of grains
ABARE, June 2010
and forage crops. It is expected that these trends will continue over the medium term,
with milk yields projected to reach 6120 litres a
cow by 2015–16.”
ABARE, Mar 2011 “Anticipated improved pasture conditions,
improved irrigation water availability and
improved fodder supplies will push milk yield
per cow to record or near record levels.”
USDA GAIN, Nov 2010 “Forecast lower feed grain prices, together with
improved supplies of supplementary fodder, are
expected to allow producers to raise the feed
intake of dairy cows.”
Australia “ Over the 10 year period to 2009–10, annual milk
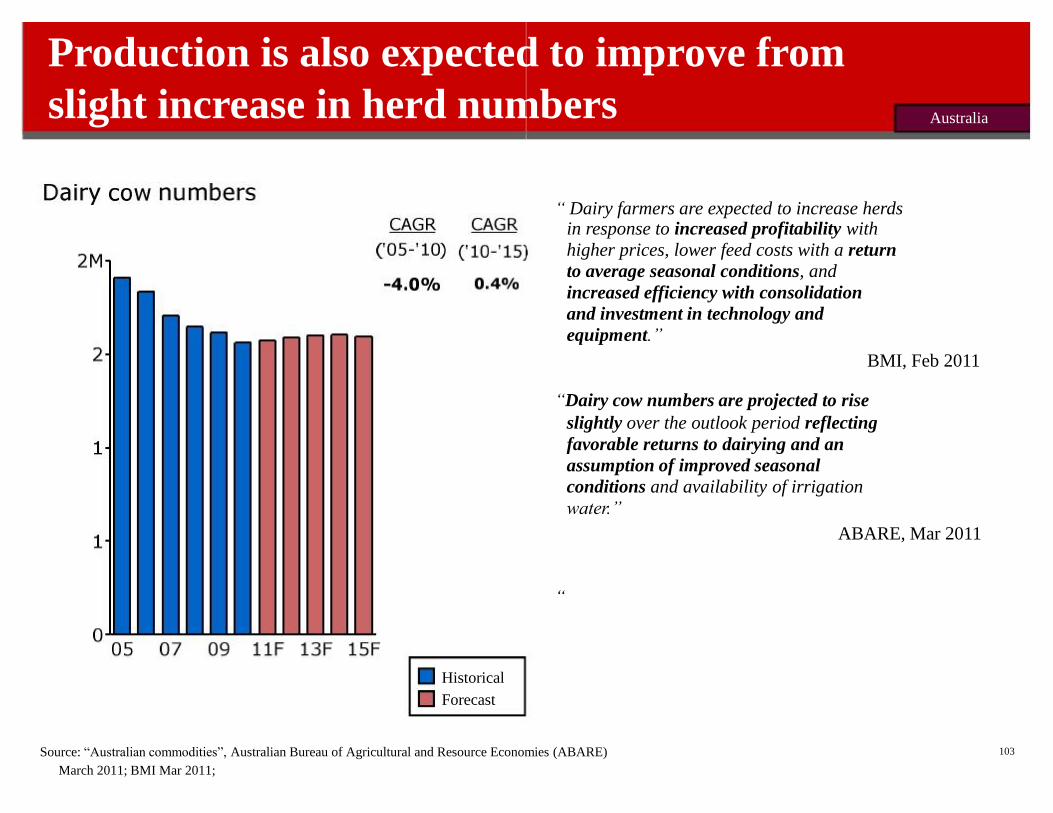
Production is also expected to improve from
slight increase in herd numbers
Historical
Forecast Source: “Australian commodities”, Australian Bureau of Agricultural and Resource Economies (ABARE)
March 2011; BMI Mar 2011;
“ Dairy farmers are expected to increase herds in response to increased profitability with
higher prices, lower feed costs with a return
to average seasonal conditions, and
increased efficiency with consolidation
and investment in technology and
equipment.”
BMI, Feb 2011 “Dairy cow numbers are projected to rise
slightly over the outlook period reflecting
favorable returns to dairying and an
assumption of improved seasonal
conditions and availability of irrigation
water.”
ABARE, Mar 2011 “
103
Australia
Dairy Australia Sep 2010; ABARE Nov 2010
104
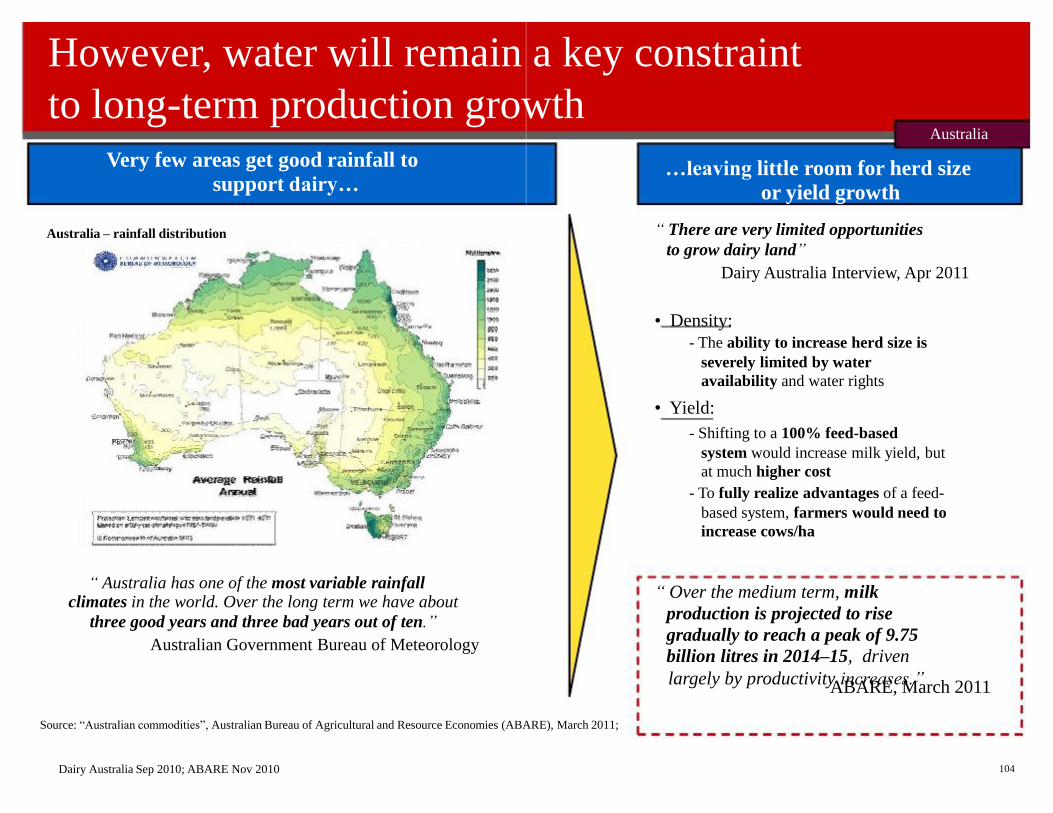
However, water will remain a key constraint
to long-term production growth
ABARE, March 2011 Source: “Australian commodities”, Australian Bureau of Agricultural and Resource Economies (ABARE), March 2011;
Very few areas get good rainfall to
support dairy… Australia – rainfall distribution
“ Australia has one of the most variable rainfall climates in the world. Over the long term we have about
three good years and three bad years out of ten.”
Australian Government Bureau of Meteorology
…leaving little room for herd size
or yield growth “ There are very limited opportunities
to grow dairy land”
Dairy Australia Interview, Apr 2011 • Density:
- The ability to increase herd size is
severely limited by water
availability and water rights
• Yield:
- Shifting to a 100% feed-based
system would increase milk yield, but
at much higher cost
- To fully realize advantages of a feed-
based system, farmers would need to
increase cows/ha “ Over the medium term, milk
production is projected to rise
gradually to reach a peak of 9.75
billion litres in 2014–15, driven
largely by productivity increases.”
Australia
200 100
300
Annual non-fluid dairy
consumption 400K MT
0 03 05 07 09F 11F 13F
Note: Historical data from ABARE
2009 view 2011 view
-1% CAGR
0.9%
CAGR
Forecast Historical Historical
Source: FAPRI Apr 2011; OECD June 2010; ABARE Mar 2011; Dairy Australia Sep 2010
105
Data summary
2009 forecast
CAGR
(‘08-’13)
2011 forecast
CAGR
(‘10-’15)
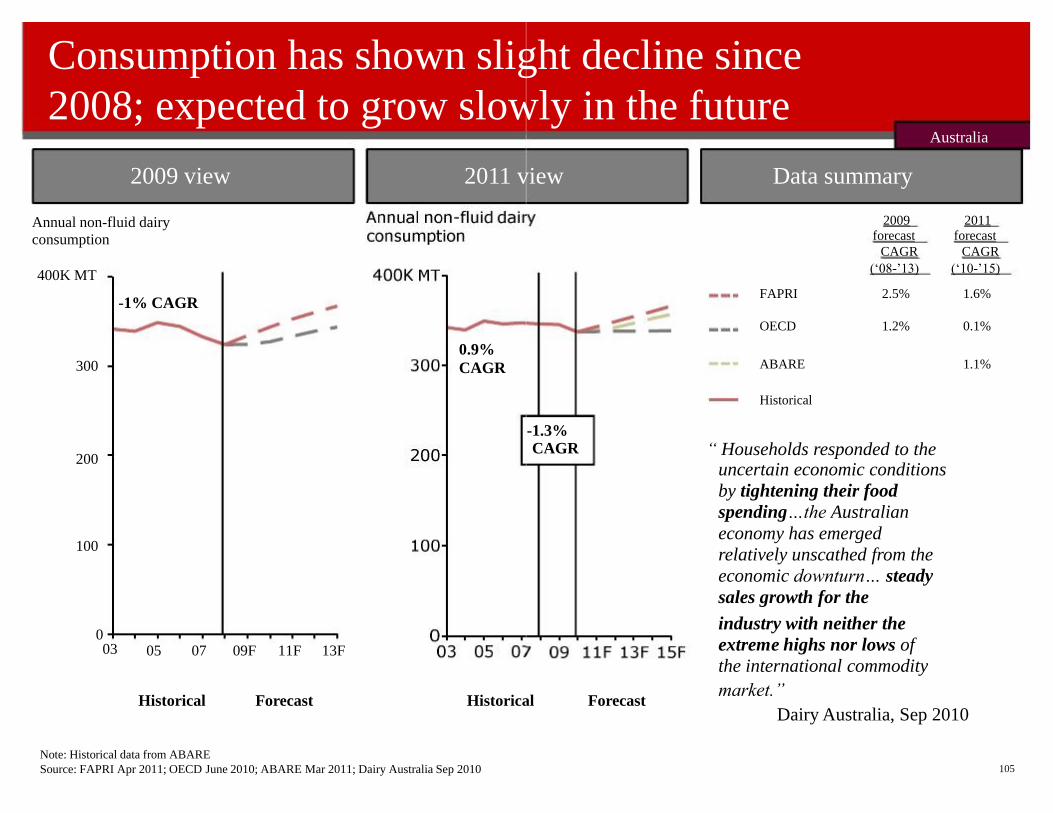
FAPRI OECD
2.5% 1.2%
1.6% 0.1%
ABARE 1.1%
Historical
Forecast
-1.3% CAGR “ Households responded to the
uncertain economic conditions
by tightening their food
spending…the Australian
economy has emerged
relatively unscathed from the
economic downturn… steady
sales growth for the
industry with neither the
extreme highs nor lows of
the international commodity
market.”
Dairy Australia, Sep 2010
Consumption has shown slight decline since
2008; expected to grow slowly in the future Australia
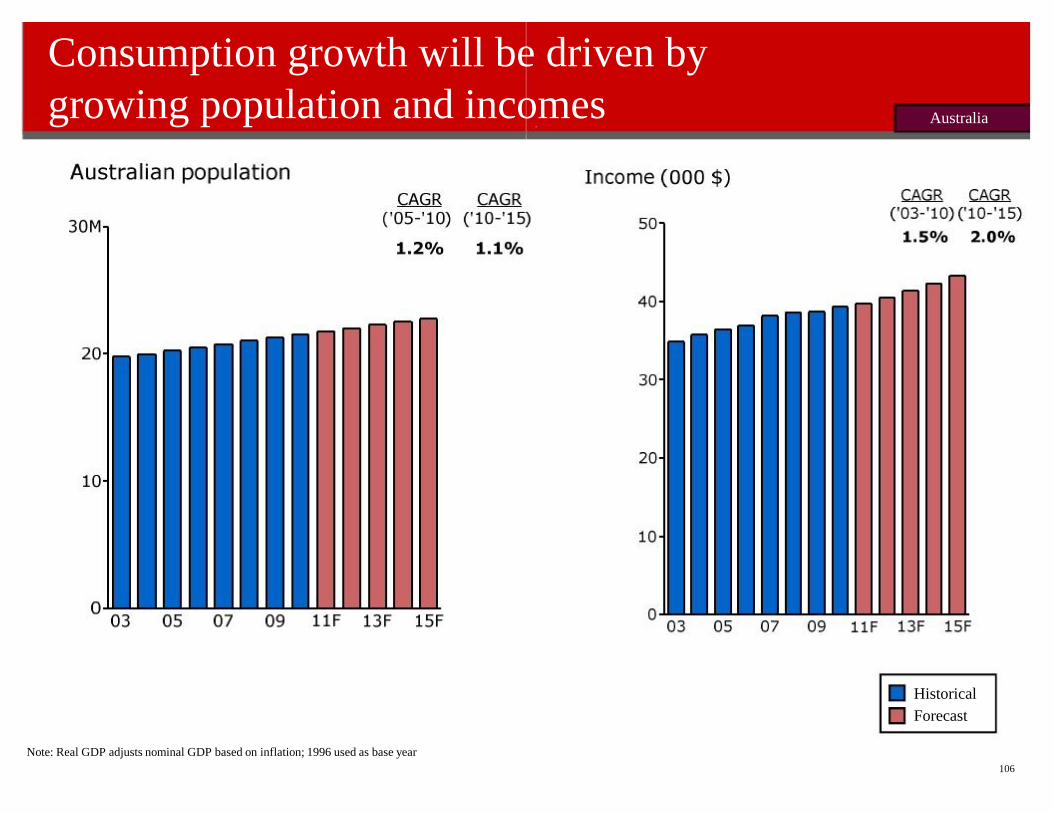
Consumption growth will be driven by
growing population and incomes
106
Historical
Forecast Note: Real GDP adjusts nominal GDP based on inflation; 1996 used as base year
Australia
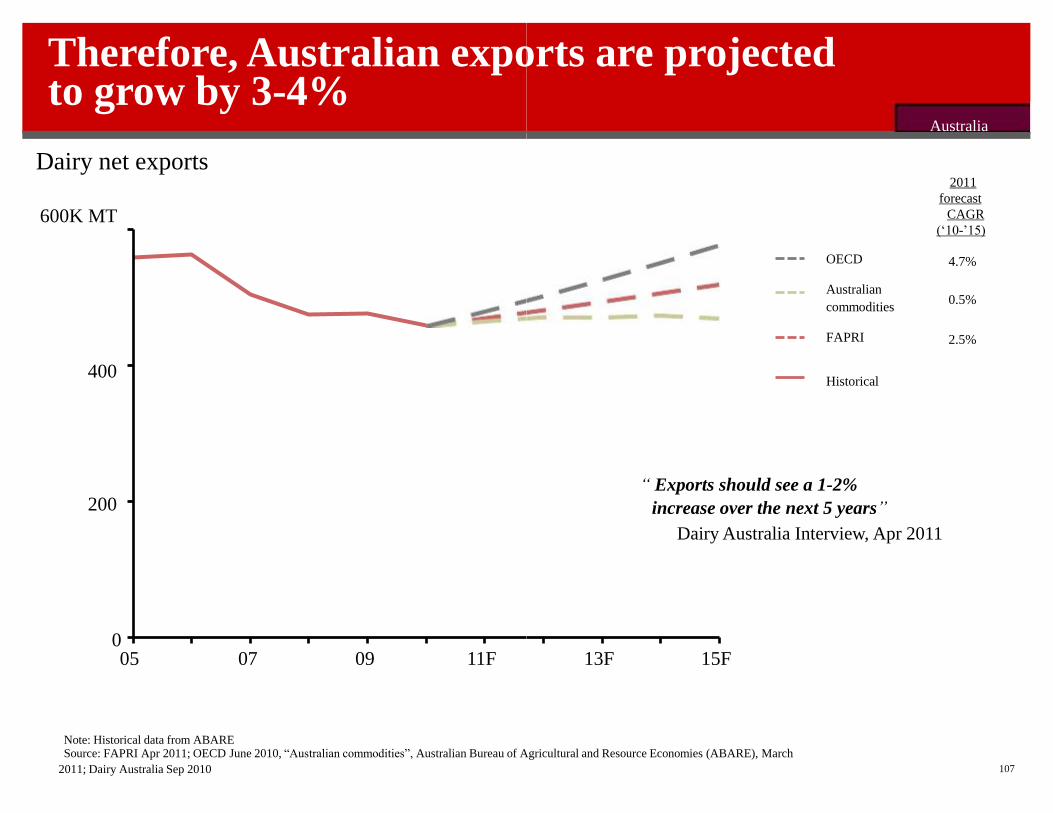
Therefore, Australian exports are projected
Note: Historical data from ABARE Source: FAPRI Apr 2011; OECD June 2010, “Australian commodities”, Australian Bureau of Agricultural and Resource Economies (ABARE), March
400 200
to grow by 3-4%
Dairy net exports 600K MT
0 05 07 09 11F
2011; Dairy Australia Sep 2010
107
13F 15F
OECD Australian
commodities FAPRI
Historical “ Exports should see a 1-2%
increase over the next 5 years”
Dairy Australia Interview, Apr 2011
Australia 2011
forecast
CAGR
(‘10-’15) 4.7% 0.5%
2.5%
Contents
•Project objectives and summary findings
•Geography-specific findings
-Net importers
-Net exporters
•Global dairy buyers’ perspectives on Australian dairy
•Other wildcards
-Commodity price outlook
-Fat consumption trends
-Food spend analysis, currency outlook
•Summary
180
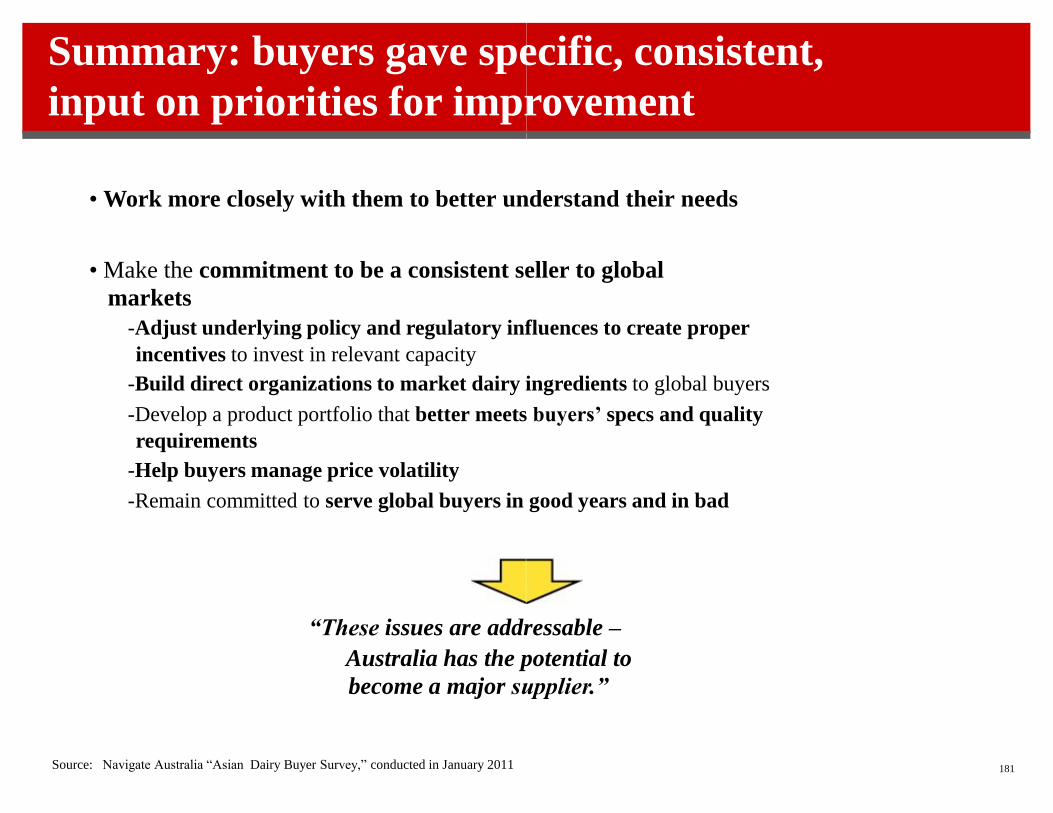
Source: Navigate Australia “Asian Dairy Buyer Survey,” conducted in January 2011
181
Summary: buyers gave specific, consistent,
input on priorities for improvement
• Work more closely with them to better understand their needs • Make the commitment to be a consistent seller to global
markets
-Adjust underlying policy and regulatory influences to create proper
incentives to invest in relevant capacity
-Build direct organizations to market dairy ingredients to global buyers
-Develop a product portfolio that better meets buyers’ specs and quality
requirements
-Help buyers manage price volatility
-Remain committed to serve global buyers in good years and in bad
“These issues are addressable –
Australia has the potential to
become a major supplier.”
182
Buyers view Australia as an important source
of future supply… Sample buyer feedback • “A few years ago we completed a study of future milk supply and it became apparent that Australia
has a major role to play. Whether or not they will step-up remains unclear.”
• “If the Australian industry wants to grow, the only long term strategy is the export markets.”
• “Geographically well positioned to serve Asia. They are a natural partner for SE & NE Asia.”
• “We desire to open portfolio and expand our supplier base beyond Fonterra. I would like to have
Australia as a supplier and they are a natural choice.”
• “Australia is missing a lot of opportunities.”
• “Fonterra and the EU guys likely to go to low cost countries and invest capital and expertise.
Australia needs to take action.”
Source: Navigate Australia “Asian Dairy Buyer Survey,” conducted in January 2011
183
…with the capacity to play a larger role with
products that are generally high quality
Sample buyer feedback • “Australia has the capacity and the infrastructure to fill any supply gap.”
• “Australian commercial capabilities are getting better. They still don’t think about how to best manage
freight and containerization, but they’re much better than in past years at the
documentation/regulation end of things.”
• “We see some developments in Australia on specification, with some producers investing in capacity to do
more than commodity product.
• “Australian customer service is getting better.”
• “Over the last 5-6 years, Australia has improved significantly (many companies weren’t familiar with
export requirements, but now they are much better at this – it has improved significantly).”
• “Australian Cheese is good quality. It has a little different profile that NZ or EU, but this isn’t a quality
issue. Australian quality is on par based on our experience.”
• “Domestic suppliers are very high quality and do a good job of delivering the right products here in
Australia, but we need innovation.”
Source: Navigate Australia “Asian Dairy Buyer Survey,” conducted in January 2011
Buyers are also looking for a credible
alternative to Fonterra/New Zealand Sample buyer feedback • “We are looking for someone besides Fonterra as a supplier.”
• “Fonterra used to be the best out there, but there is also an opportunity. Fonterra’s size has
made them arrogant and that has led to less customer attention and a sense of arrogance.”
•
•
•
•
•
“Why can’t Australia make it work – we don’t want to buy just from Fonterra.”
“Nobody can match Fonterra in Asia, but Australia could be a natural second.”
“We shouldn’t buy just from Fonterra – we now have a monster of our own creation.”
“We desire to expand our supplier base beyond Fonterra. I would like to have Australia as a
supplier. They are a natural choice.”
184 Source: Navigate Australia “Asian Dairy Buyer Survey,” conducted in January 2011
185
However, Australia must signal to buyers a long-
term commitment to the global market Sample buyer feedback • “The problem is that Australian supply is uncertain which makes it hard to rely on them as a primary
supply in Asia.”
• “Until now, their large domestic market means they focus on local market and aren’t a regular, reliable
source. This creates problems.”
• “They need to get better at in-market presence. They don’t have the right touch points locally.”
• “Supply is uncertain – they want to play when price works but can’t be sure they will be there. It
works for spot buys, but not for consistent, twice- -monthly deliveries. We need suppliers who are
committed.”
• “We are afraid to contract with the Australia because we can’t ensure that they will meet the
commitment. That means I have to bear the risk.”
• “I’m looking for a real partner, someone who will be there when times are good and times are bad.
I need to know that they will be there.”
• “Build long term relationships – honor supply relationships. Stability should be valuable to the
industry.”
Source: Navigate Australia “Asian Dairy Buyer Survey,” conducted in January 2011
186
This commitment requires Australian suppliers to
focus on meeting customer needs (1 of 2) Sample buyer feedback • “Most importantly, the Australia needs to figure out how to be more customer focused. Build to my requirements.”
• “If I can’t be sure that Australia will be a consistent source of supply, there is no way I can take the
risk of buying strategic inputs from them.”
• “Suppliers needs to have some responsibility in understanding and managing the market – very
reactive.”
• “Australia is friendly and well-intentioned, but struggle to deliver.”
• “Australia lacks product flexibility – hard to get Australian suppliers to make a unique spec.
Source: Navigate Australia “Asian Dairy Buyer Survey,” conducted in January 2011
187
This commitment requires Australian suppliers
focus on meeting customer needs (2 of 2) Sample buyer feedback
• “Dairy producers need to realize that branded companies are in the business of meeting consumer
needs, and therefore, they need to think about helping us meet these needs.”
• “Every week I have Fonterra contacting me with innovative solutions. They have ingredient innovation groups that are
focused on meeting the needs of global food companies. We are apt to use them where we can.”
• “Fonterra is super customer focused – they are predictable in terms of their production plans. Australia
however, has massive swings in what they do. For example, huge emphasis on Milk Powders then
a switch to high value products. These shifts are difficult for us.”
• More co-ops and dairies are adjusting to make products that customers want. It is slow, but
moving in the right direction.”
• Make it easier for us to have a relationship. I go to Australia every 3-6 months for a few days but if
there was a local sales office it would be easier for me to develop relationships and it would prove to me they are
committed to the Chinese market”
Source: Navigate Australia “Asian Dairy Buyer Survey,” conducted in January 2011
189
…as well as pricing and risk management,
which also present an opportunity Sample buyer feedback
• “We can lock in prices for 12 months with EU and New Zealand. Hard to get Australian suppliers to lock in
even 6 months. This shows a lack of commitment.”
• “We need longer term pricing (when we launch a product with CostCo or Carrefour we need to be able to lock
in price). I don’t think the Australian’s really understand the rigidity of the hypermarkets and big box suppliers likes
Wal Mart, Carrefour, Yinfan and Lotus in China. They’re not used to that scale”
•
Source: Navigate Australia “Asian Dairy Buyer Survey,” conducted in January 2011
Contents
•Project objectives and summary findings
•Geography-specific findings
-Net importers
-Net exporters
•Global dairy buyers’ perspectives on Australian dairy
•Other wildcards
-Commodity price outlook
-Fat consumption trends
-Food spend analysis, currency outlook
•Summary
190
Summary: Other wildcards
likely to continue through at least 2013
-Feed prices have risen aggressively over the past decade and rising demand in
emerging markets likely to keep prices high
-High oil prices and demand for ethanol will also keep feed prices high
-Dairy farmers dependent on feed must look to operational efficiencies to maintain
their relative cost position in global markets
• The BRIC countries have not historically shown a tendency to shift to lower
fat, and any shift will likely occur slowly over time
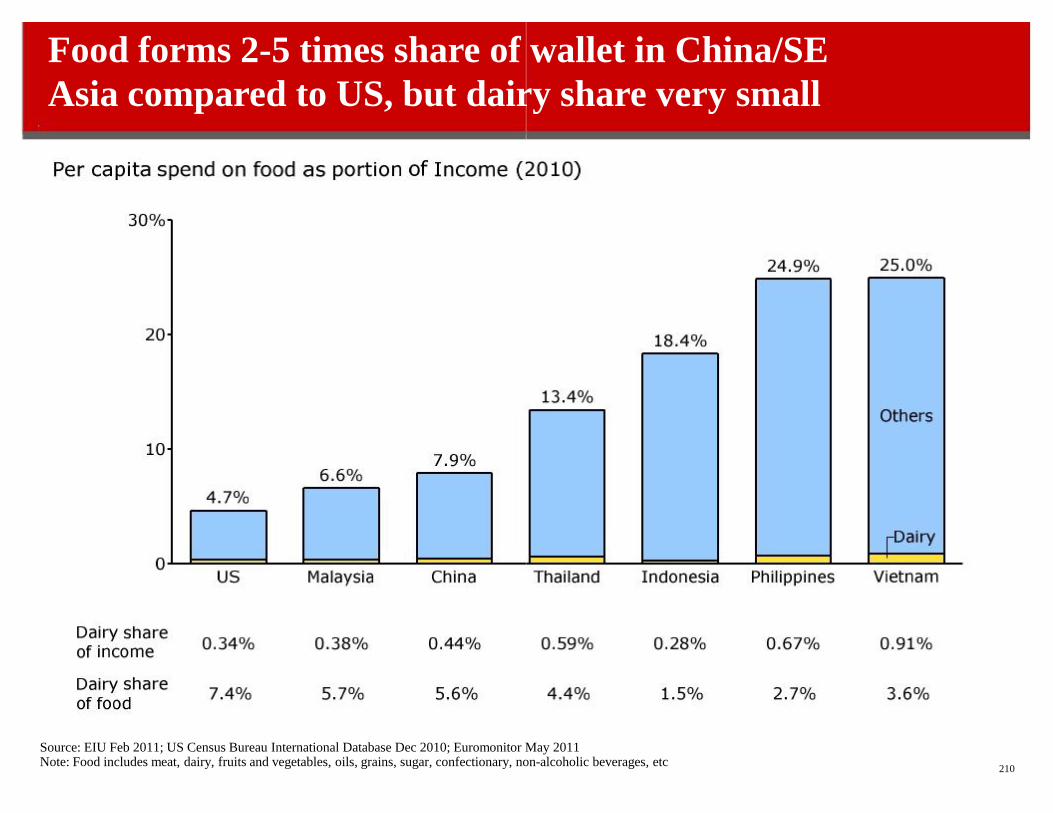
• Although a few of the SE Asian countries spend up to 25% of their income
on food, dairy represents a small share of total food spend
191
• Commodity price movements indicate that higher commodity prices are
• Appreciating currencies of key import countries such as China may bolster purchasing power, helping spur demand for dairy products
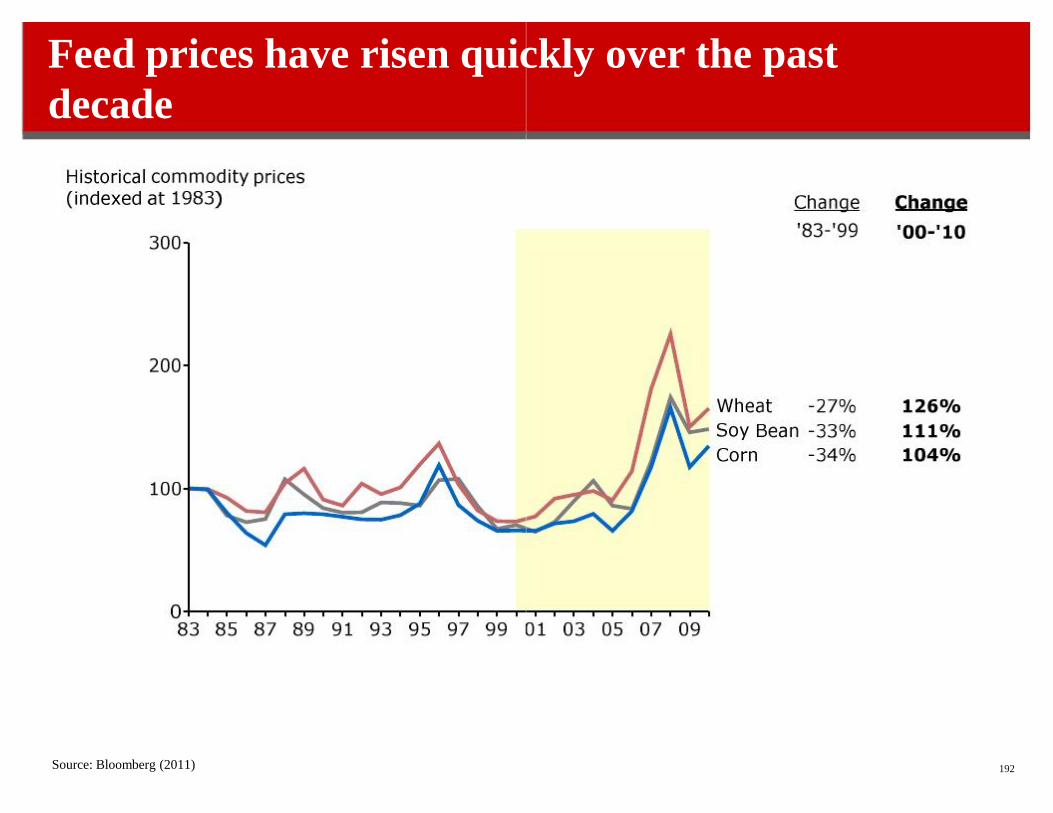
Feed prices have risen quickly over the past
decade
Source: Bloomberg (2011)
192
Sta
rtin
g c
ost
(US
D/M
T)
Cost
incr
ease
du
e
to f
eed
% c
ash
cost
s fr
om
feed
2011F
aver
age
cost
s
Cost
incr
ease
du
e to
fee
d
% c
ash
cost
s fr
om
feed
2011F
larg
e fa
rm
cost
s
Sta
rtin
g
cost
(US
D/M
T)
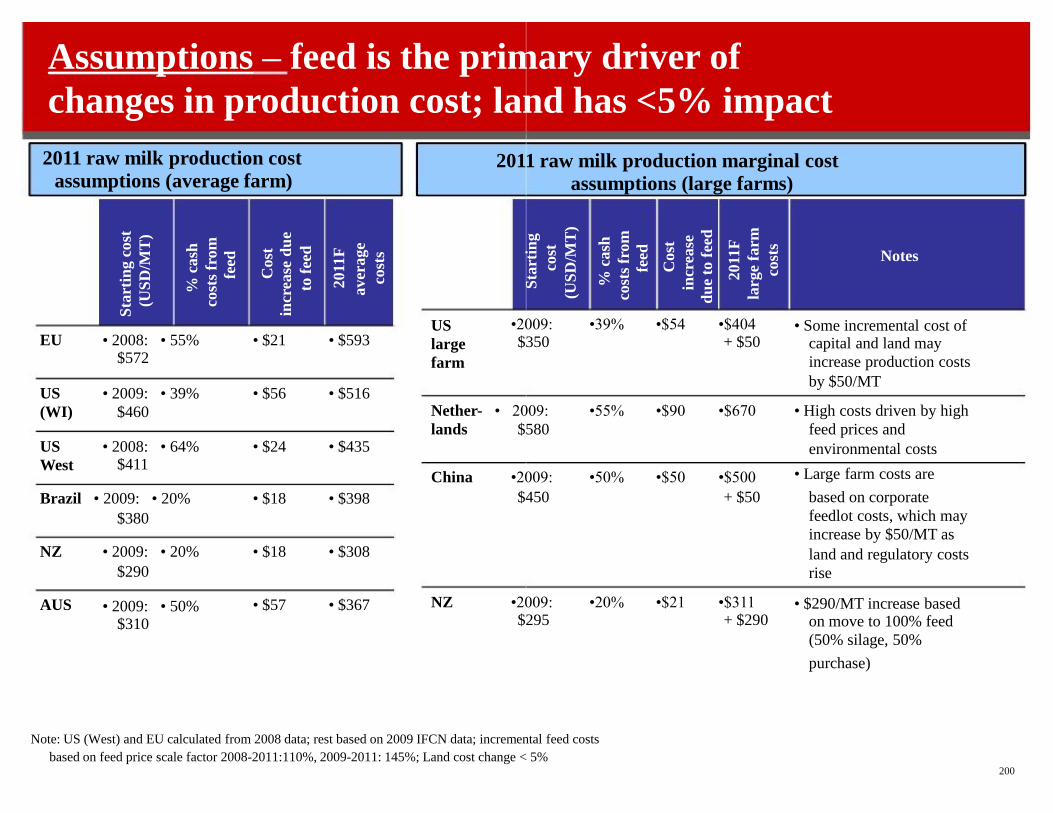
Assumptions – feed is the primary driver of
changes in production cost; land has <5% impact
EU • 2008: • 55% $572
• $21 • $593
US
(WI) $460
• 2009: • 39% • $56 • $516
US
West
• 2008: • 64% $411
• $24 • $435
$380
Brazil • 2009: • 20% • $18 • $398
NZ
$290
• 2009: • 20% • $18 • $308
AUS • 2009: • 50% $310
• $57 • $367
2011 raw milk production cost
assumptions (average farm)
US
large
farm
•2009: $350
lands
Nether- • 2009:
$580
China •2009:
$450
NZ •2009: $295
2011 raw milk production marginal cost
assumptions (large farms) Notes
•39% •$54 •$404 + $50
• Some incremental cost of capital and land may
increase production costs
by $50/MT
•55% •$90 •$670 • High costs driven by high
feed prices and
•50% •$50 •$500
+ $50
environmental costs
• Large farm costs are
based on corporate
feedlot costs, which may
increase by $50/MT as
land and regulatory costs
rise
•20% •$21 •$311 + $290
• $290/MT increase based on move to 100% feed
(50% silage, 50%
purchase) Note: US (West) and EU calculated from 2008 data; rest based on 2009 IFCN data; incremental feed costs
based on feed price scale factor 2008-2011:110%, 2009-2011: 145%; Land cost change < 5% 200
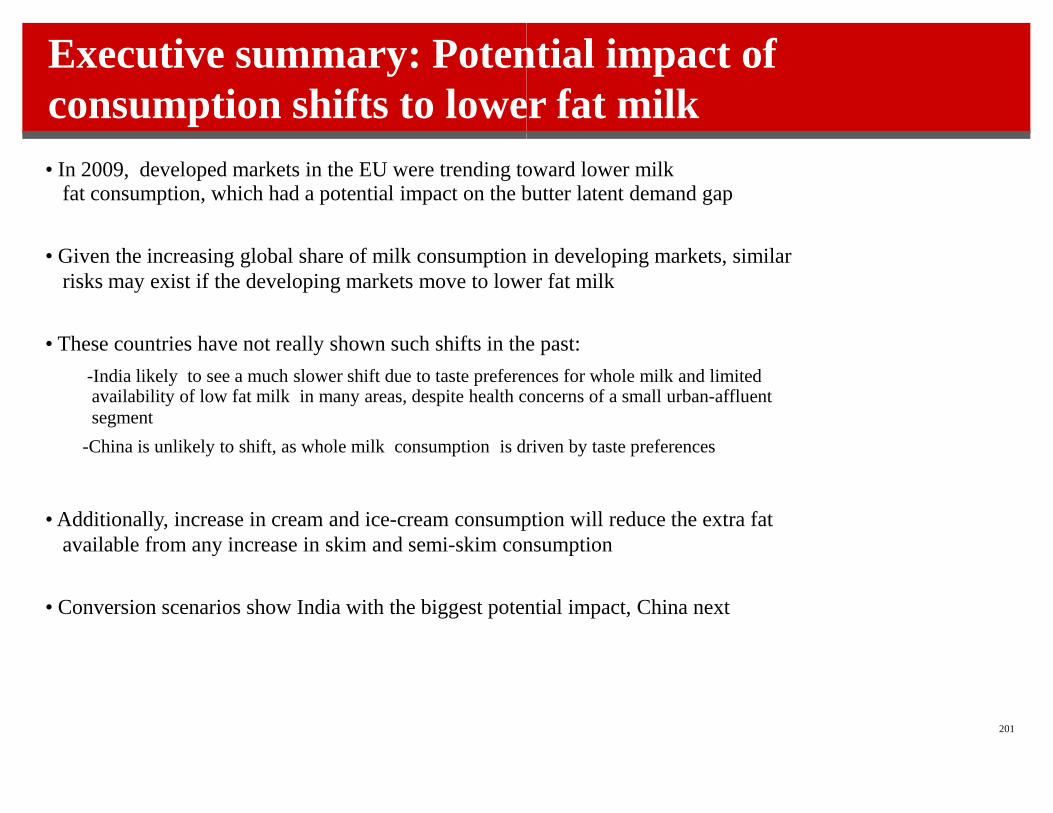
Executive summary: Potential impact of
consumption shifts to lower fat milk
• In 2009, developed markets in the EU were trending toward lower milk fat consumption, which had a potential impact on the butter latent demand gap
• Given the increasing global share of milk consumption in developing markets, similar
risks may exist if the developing markets move to lower fat milk
• These countries have not really shown such shifts in the past:
-China is unlikely to shift, as whole milk consumption is driven by taste preferences
• Additionally, increase in cream and ice-cream consumption will reduce the extra fat
• Conversion scenarios show India with the biggest potential impact, China next
201
-India likely to see a much slower shift due to taste preferences for whole milk and limited availability of low fat milk in many areas, despite health concerns of a small urban-affluent
segment
available from any increase in skim and semi-skim consumption
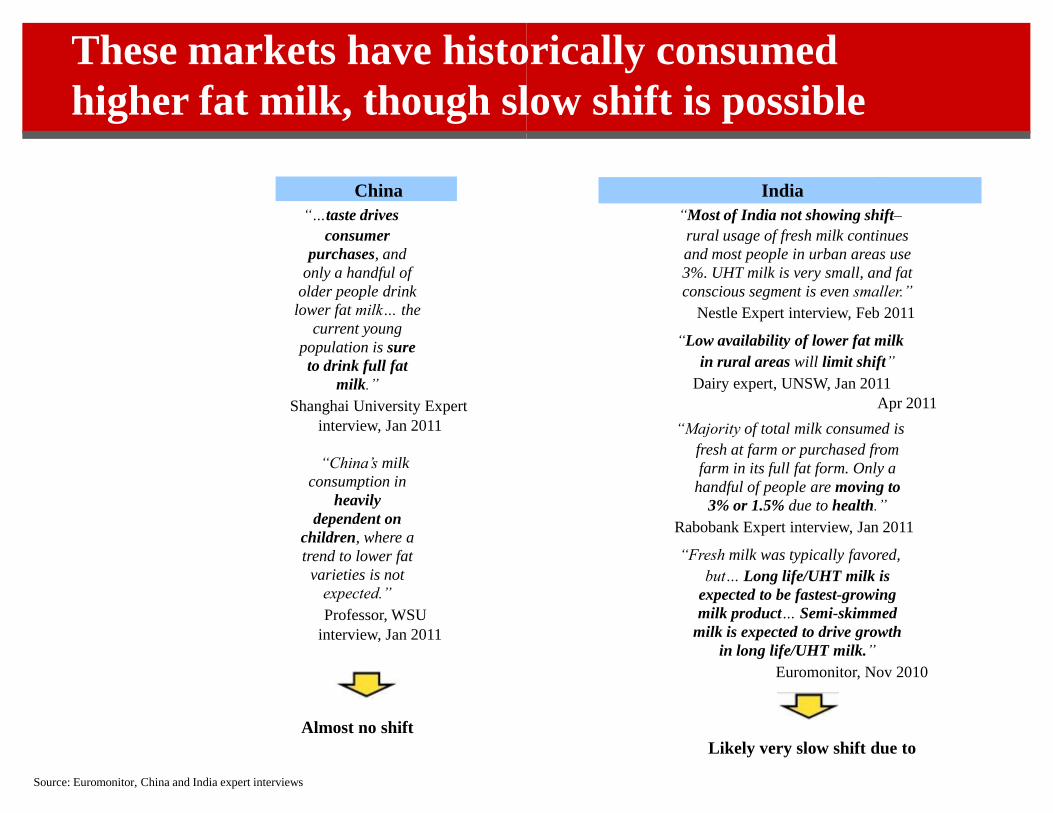
China
“…taste drives
consumer
purchases, and
only a handful of
older people drink
lower fat milk… the
current young
population is sure
to drink full fat
milk.”
Shanghai University Expert
interview, Jan 2011
“China’s milk
consumption in
heavily
dependent on
children, where a
trend to lower fat
varieties is not
expected.”
Professor, WSU
interview, Jan 2011 Almost no shift
These markets have historically consumed
higher fat milk, though slow shift is possible
Source: Euromonitor, China and India expert interviews
India
“Most of India not showing shift–
rural usage of fresh milk continues
and most people in urban areas use
3%. UHT milk is very small, and fat
conscious segment is even smaller.”
Nestle Expert interview, Feb 2011
“Low availability of lower fat milk
in rural areas will limit shift”
Dairy expert, UNSW, Jan 2011
Apr 2011
“Majority of total milk consumed is
fresh at farm or purchased from
farm in its full fat form. Only a
handful of people are moving to
3% or 1.5% due to health.”
Rabobank Expert interview, Jan 2011
“Fresh milk was typically favored,
but… Long life/UHT milk is
expected to be fastest-growing
milk product… Semi-skimmed
milk is expected to drive growth
in long life/UHT milk.”
Euromonitor, Nov 2010
Likely very slow shift due to
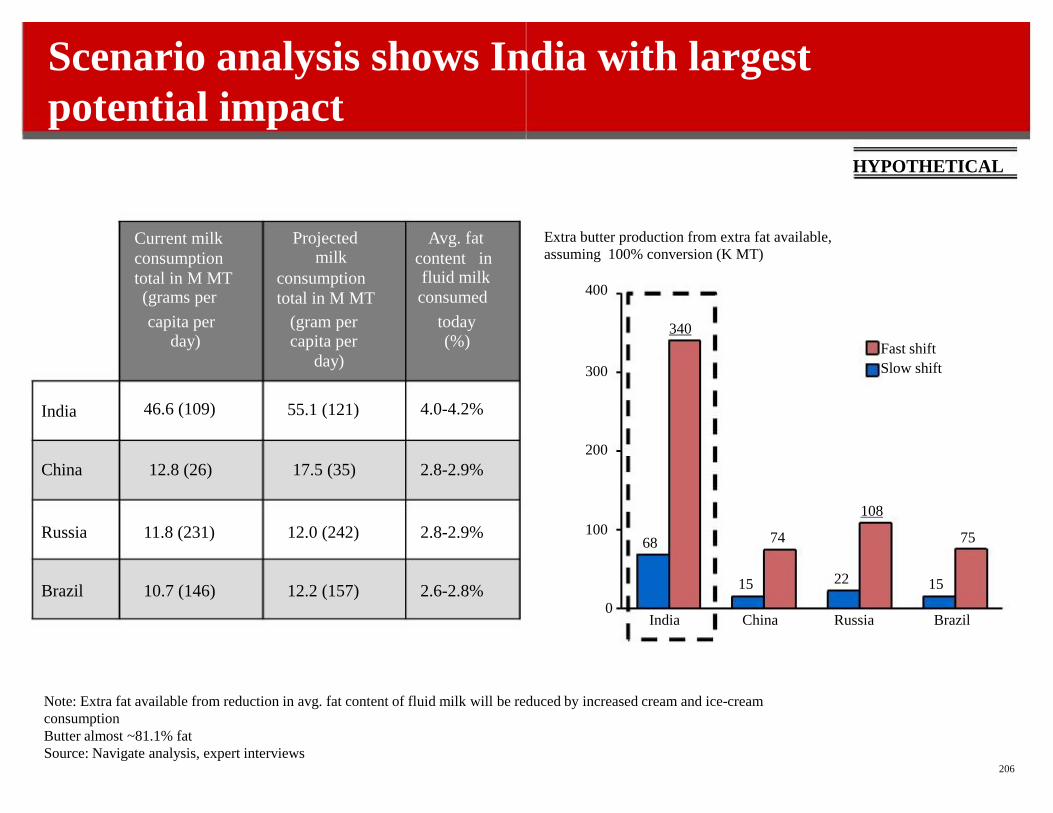
Current milk
consumption
total in M MT (grams per
Projected milk
consumption
total in M MT
Avg. fat
content in fluid milk
consumed
India
capita per day) 46.6 (109)
(gram per capita per
day) 55.1 (121)
today (%) 4.0-4.2%
China 12.8 (26) 17.5 (35) 2.8-2.9%
Russia Brazil
11.8 (231) 10.7 (146)
12.0 (242) 12.2 (157)
2.8-2.9% 2.6-2.8%
Note: Extra fat available from reduction in avg. fat content of fluid milk will be reduced by increased cream and ice-cream
consumption
Butter almost ~81.1% fat
Source: Navigate analysis, expert interviews 206
Scenario analysis shows India with largest
potential impact HYPOTHETICAL
0
100
200
300
Extra butter production from extra fat available,
assuming 100% conversion (K MT) 400
India
68
340
China
15
74
Russia
22
108
Brazil
15
75
Fast shift
Slow shift
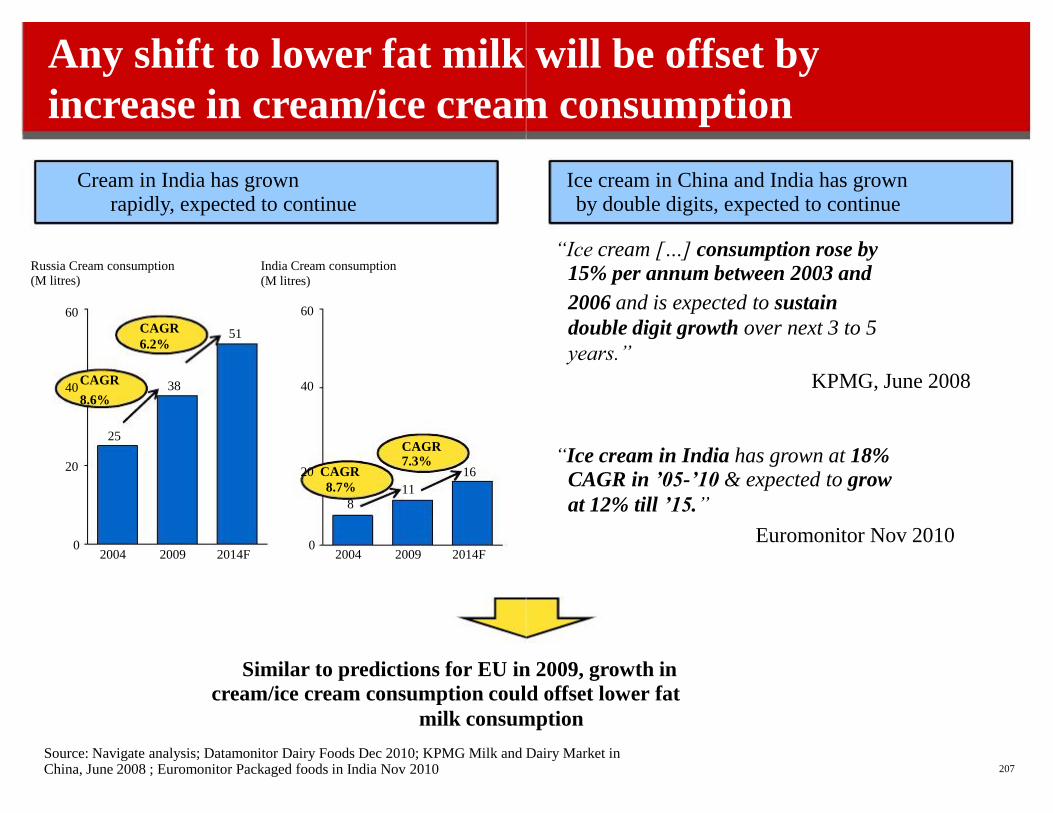
CAGR
Any shift to lower fat milk will be offset by
increase in cream/ice cream consumption
0
20
2004
25
2009 2014F
51
Russia Cream consumption (M litres)
60 40 8.6%
CAGR
6.2% 38
Similar to predictions for EU in 2009, growth in
cream/ice cream consumption could offset lower fat
milk consumption Source: Navigate analysis; Datamonitor Dairy Foods Dec 2010; KPMG Milk and Dairy Market in
0
60 40
2004 2009 2014F
16
India Cream consumption
(M litres)
20 CAGR
8.7%
8
CAGR 7.3% 11
Cream in India has grown rapidly, expected to continue
China, June 2008 ; Euromonitor Packaged foods in India Nov 2010
207
“Ice cream […] consumption rose by
15% per annum between 2003 and
2006 and is expected to sustain
double digit growth over next 3 to 5
years.”
KPMG, June 2008
“Ice cream in India has grown at 18%
CAGR in ’05-’10 & expected to grow
at 12% till ’15.”
Euromonitor Nov 2010
Ice cream in China and India has grown by double digits, expected to continue
Fluid
milk Cream/
Ice -
cream
Source: Navigate analysis; Expert interviews
208
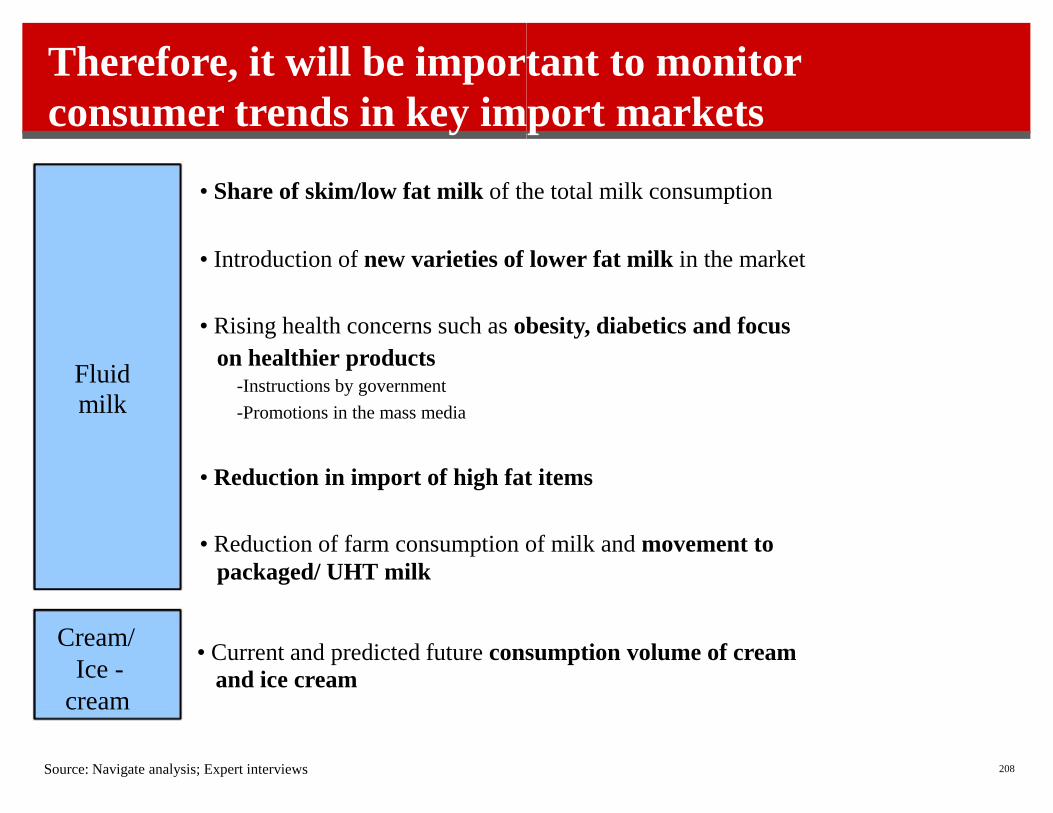
Therefore, it will be important to monitor
consumer trends in key import markets • Share of skim/low fat milk of the total milk consumption • Introduction of new varieties of lower fat milk in the market • Rising health concerns such as obesity, diabetics and focus
on healthier products -Instructions by government
-Promotions in the mass media • Reduction in import of high fat items • Reduction of farm consumption of milk and movement to
packaged/ UHT milk • Current and predicted future consumption volume of cream
and ice cream
Source: EIU Feb 2011; Euromonitor May 2011
209
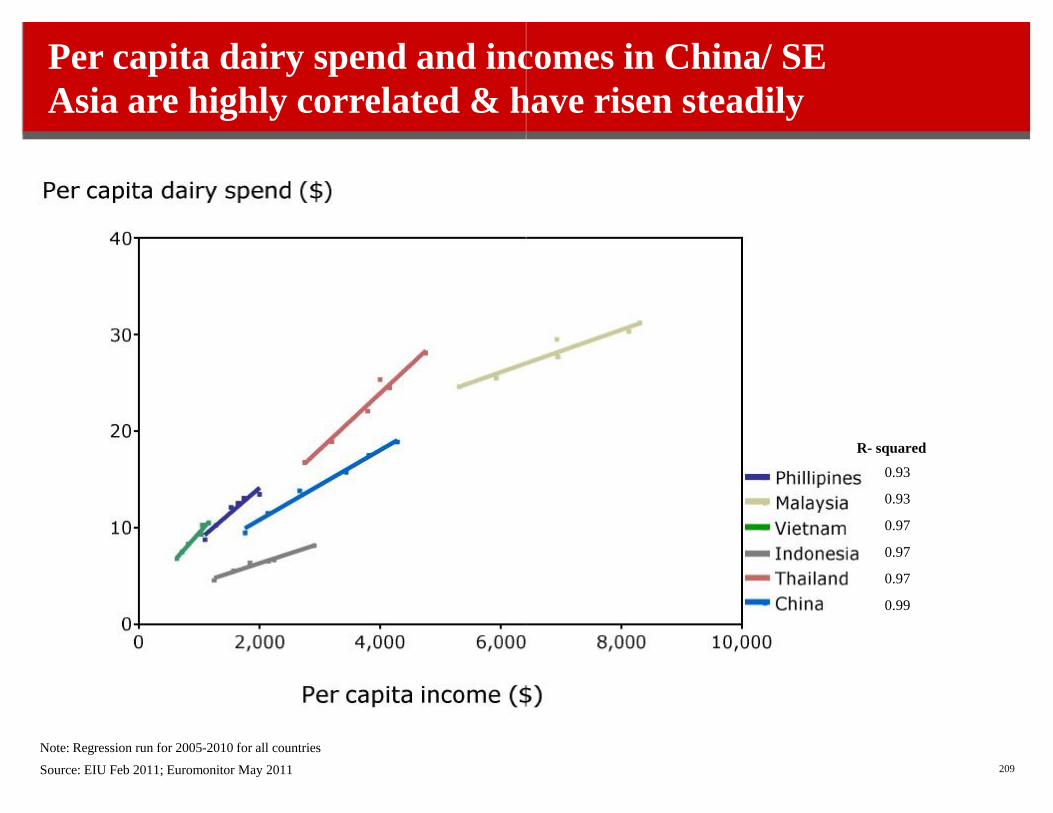
Per capita dairy spend and incomes in China/ SE
Asia are highly correlated & have risen steadily R- squared
0.93
0.93
0.97
0.97
0.97
0.99 Note: Regression run for 2005-2010 for all countries
Source: EIU Feb 2011; US Census Bureau International Database Dec 2010; Euromonitor May 2011
210
Food forms 2-5 times share of wallet in China/SE
Asia compared to US, but dairy share very small Note: Food includes meat, dairy, fruits and vegetables, oils, grains, sugar, confectionary, non-alcoholic beverages, etc
Contents
•Project objectives and summary findings
•Geography-specific findings
-Net importers
-Net exporters
•Global dairy buyers’ perspectives on Australian dairy
•Other wildcards
-Commodity price outlook
-Fat consumption trends
-Food spend analysis, currency outlook
•Summary
213
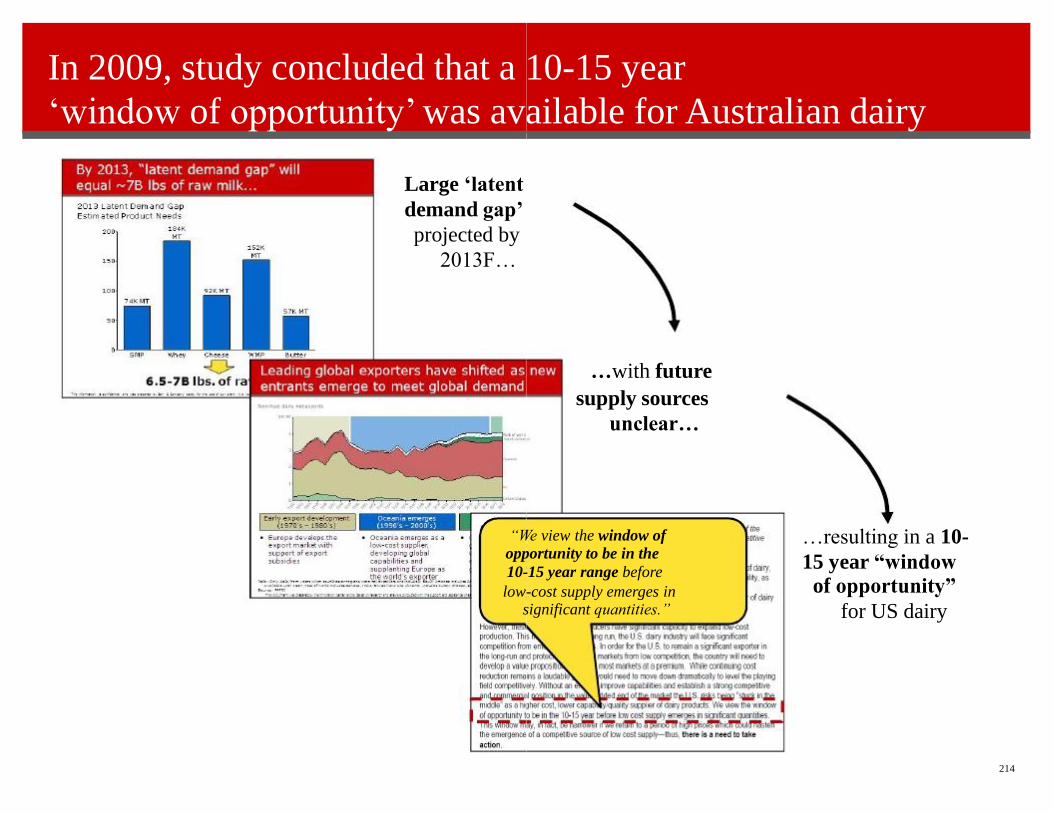
214
In 2009, study concluded that a 10-15 year
‘window of opportunity’ was available for Australian dairy Large ‘latent
demand gap’
projected by
2013F… …with future
supply sources
unclear…
…resulting in a 10-
15 year “window
of opportunity”
for US dairy
“We view the window of
opportunity to be in the
10-15 year range before
low-cost supply emerges in significant quantities.”
Imp
ort
ers
Ex
po
rter
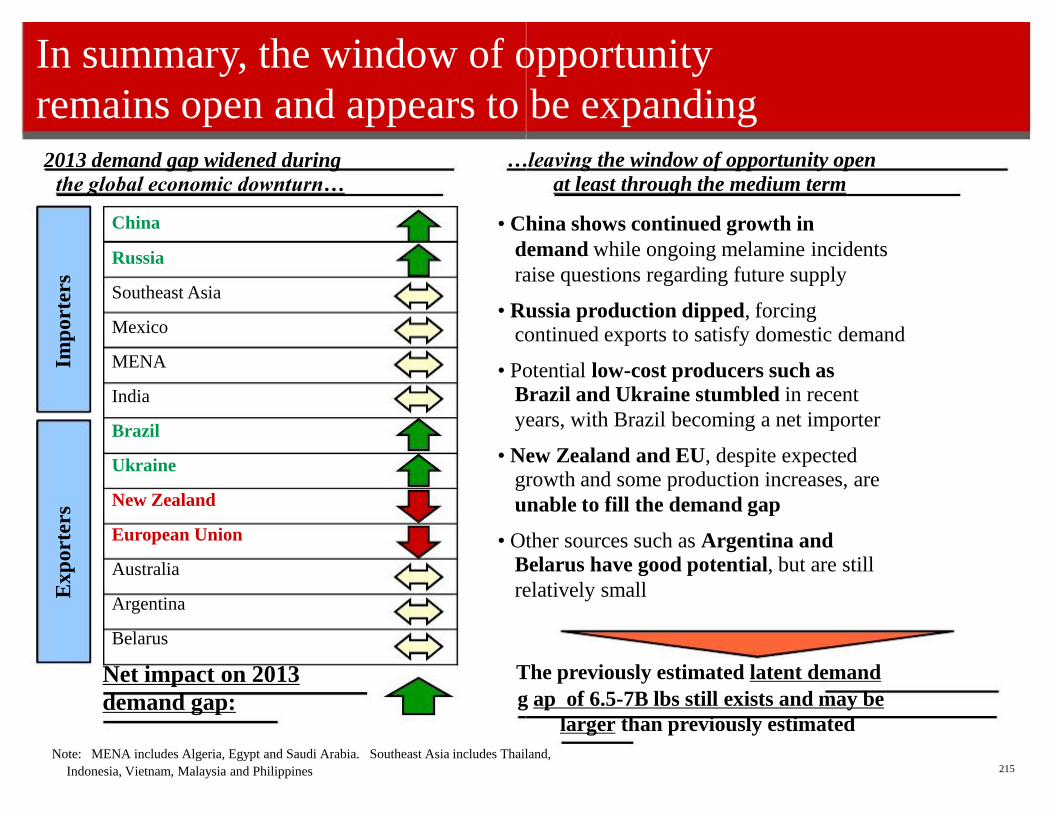
s In summary, the window of opportunity
remains open and appears to be expanding
2013 demand gap widened during
the global economic downturn… China Russia Southeast Asia Mexico MENA India Brazil Ukraine New Zealand European Union Australia Argentina Belarus Net impact on 2013
demand gap:
Note: MENA includes Algeria, Egypt and Saudi Arabia. Southeast Asia includes Thailand,
Indonesia, Vietnam, Malaysia and Philippines 215
…leaving the window of opportunity open
at least through the medium term • China shows continued growth in
demand while ongoing melamine incidents
raise questions regarding future supply • Russia production dipped, forcing continued exports to satisfy domestic demand • Potential low-cost producers such as
Brazil and Ukraine stumbled in recent
years, with Brazil becoming a net importer • New Zealand and EU, despite expected growth and some production increases, are
unable to fill the demand gap • Other sources such as Argentina and
Belarus have good potential, but are still
relatively small The previously estimated latent demand
g ap of 6.5-7B lbs still exists and may be
larger than previously estimated
demand: Export
supply: Policy
reforms:
216
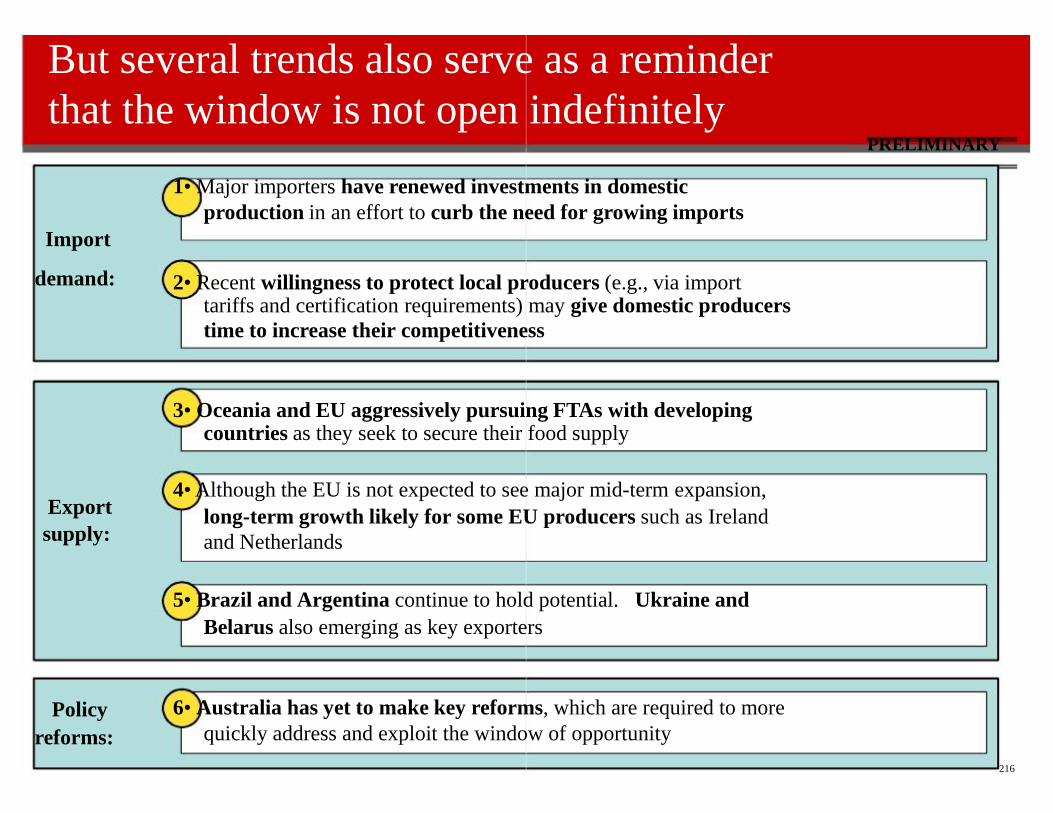
But several trends also serve as a reminder
that the window is not open indefinitely PRELIMINARY 1• Major importers have renewed investments in domestic
production in an effort to curb the need for growing imports
Import
2• Recent willingness to protect local producers (e.g., via import tariffs and certification requirements) may give domestic producers
time to increase their competitiveness 3• Oceania and EU aggressively pursuing FTAs with developing countries as they seek to secure their food supply 4• Although the EU is not expected to see major mid-term expansion,
long-term growth likely for some EU producers such as Ireland
and Netherlands 5• Brazil and Argentina continue to hold potential. Ukraine and
Belarus also emerging as key exporters 6• Australia has yet to make key reforms, which are required to more
quickly address and exploit the window of opportunity
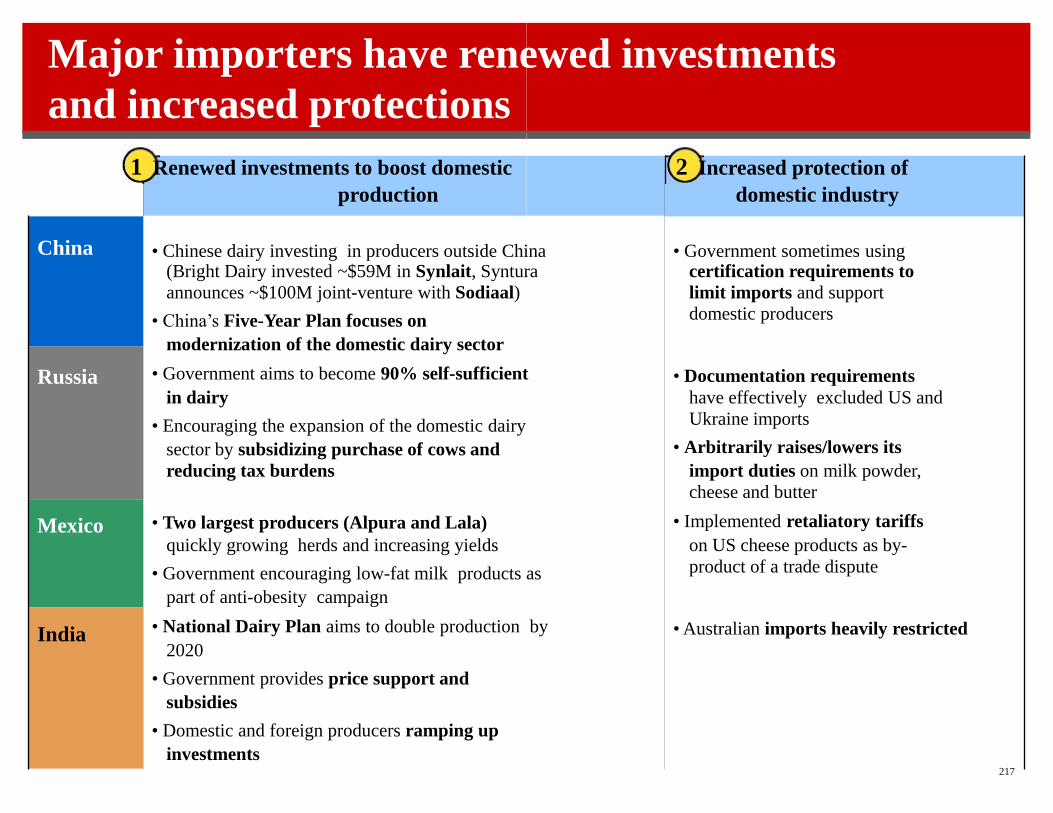
Major importers have renewed investments
and increased protections
China Russia Mexico India
1 Renewed investments to boost domestic
production
• Chinese dairy investing in producers outside China (Bright Dairy invested ~$59M in Synlait, Syntura
announces ~$100M joint-venture with Sodiaal)
• China’s Five-Year Plan focuses on
modernization of the domestic dairy sector
• Government aims to become 90% self-sufficient
in dairy
• Encouraging the expansion of the domestic dairy
sector by subsidizing purchase of cows and
reducing tax burdens • Two largest producers (Alpura and Lala)
quickly growing herds and increasing yields
• Government encouraging low-fat milk products as
part of anti-obesity campaign
• National Dairy Plan aims to double production by
2020
• Government provides price support and
subsidies
• Domestic and foreign producers ramping up
investments
• Government sometimes using certification requirements to
limit imports and support
domestic producers • Documentation requirements
have effectively excluded US and
Ukraine imports
• Arbitrarily raises/lowers its
import duties on milk powder,
cheese and butter
• Implemented retaliatory tariffs
on US cheese products as by-
product of a trade dispute • Australian imports heavily restricted 217
2 Increased protection of
domestic industry
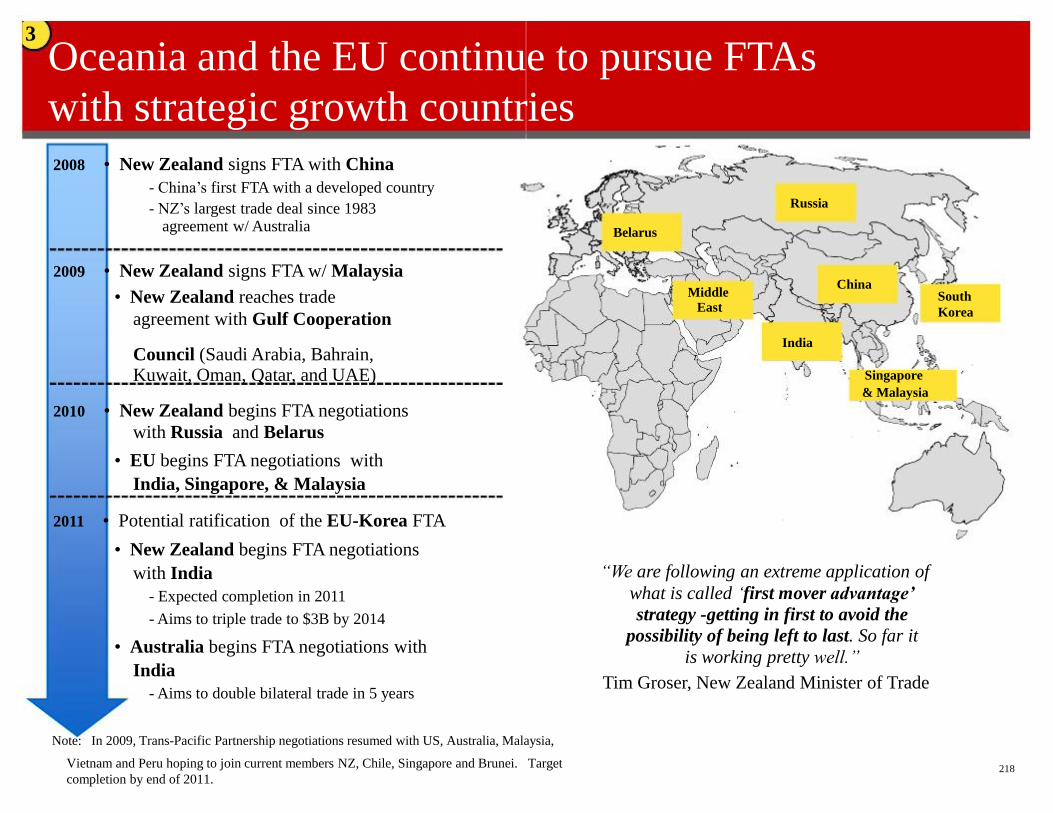
3
Oceania and the EU continue to pursue FTAs
with strategic growth countries 2008 • New Zealand signs FTA with China
- China’s first FTA with a developed country
- NZ’s largest trade deal since 1983 agreement w/ Australia
2009 • New Zealand signs FTA w/ Malaysia
• New Zealand reaches trade
agreement with Gulf Cooperation
Council (Saudi Arabia, Bahrain, Kuwait, Oman, Qatar, and UAE) 2010 • New Zealand begins FTA negotiations
with Russia and Belarus
• EU begins FTA negotiations with
India, Singapore, & Malaysia 2011 • Potential ratification of the EU-Korea FTA
• New Zealand begins FTA negotiations
with India
- Expected completion in 2011
- Aims to triple trade to $3B by 2014
• Australia begins FTA negotiations with
India
- Aims to double bilateral trade in 5 years
Note: In 2009, Trans-Pacific Partnership negotiations resumed with US, Australia, Malaysia,
218 Vietnam and Peru hoping to join current members NZ, Chile, Singapore and Brunei. Target
completion by end of 2011.
Belarus
Russia
China Middle
East
India Singapore
& Malaysia
“We are following an extreme application of
what is called ‘first mover advantage’
strategy -getting in first to avoid the
possibility of being left to last. So far it
is working pretty well.”
Tim Groser, New Zealand Minister of Trade
South
Korea
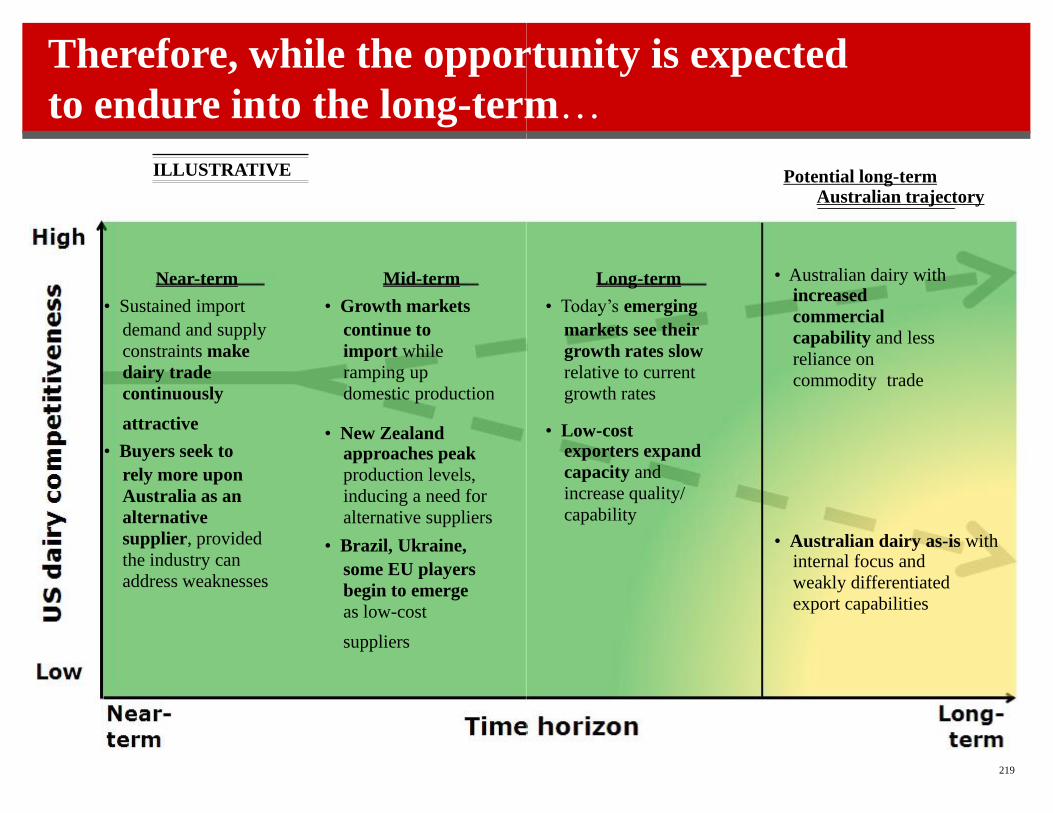
ILLUSTRATIVE
Near-term
• Sustained import
demand and supply
constraints make
dairy trade
continuously
attractive
• Buyers seek to
rely more upon
Australia as an
alternative
supplier, provided
the industry can
address weaknesses
Mid-term
• Growth markets
continue to
import while
ramping up
domestic production
• New Zealand approaches peak
production levels,
inducing a need for
alternative suppliers
• Brazil, Ukraine,
some EU players
begin to emerge
as low-cost
suppliers 219
Therefore, while the opportunity is expected
to endure into the long-term…
• Australian dairy with increased
commercial
capability and less
reliance on
commodity trade
• Australian dairy as-is with internal focus and
weakly differentiated
export capabilities
Long-term
• Today’s emerging
markets see their
growth rates slow
relative to current
growth rates
• Low-cost exporters expand
capacity and
increase quality/
capability
Potential long-term Australian trajectory
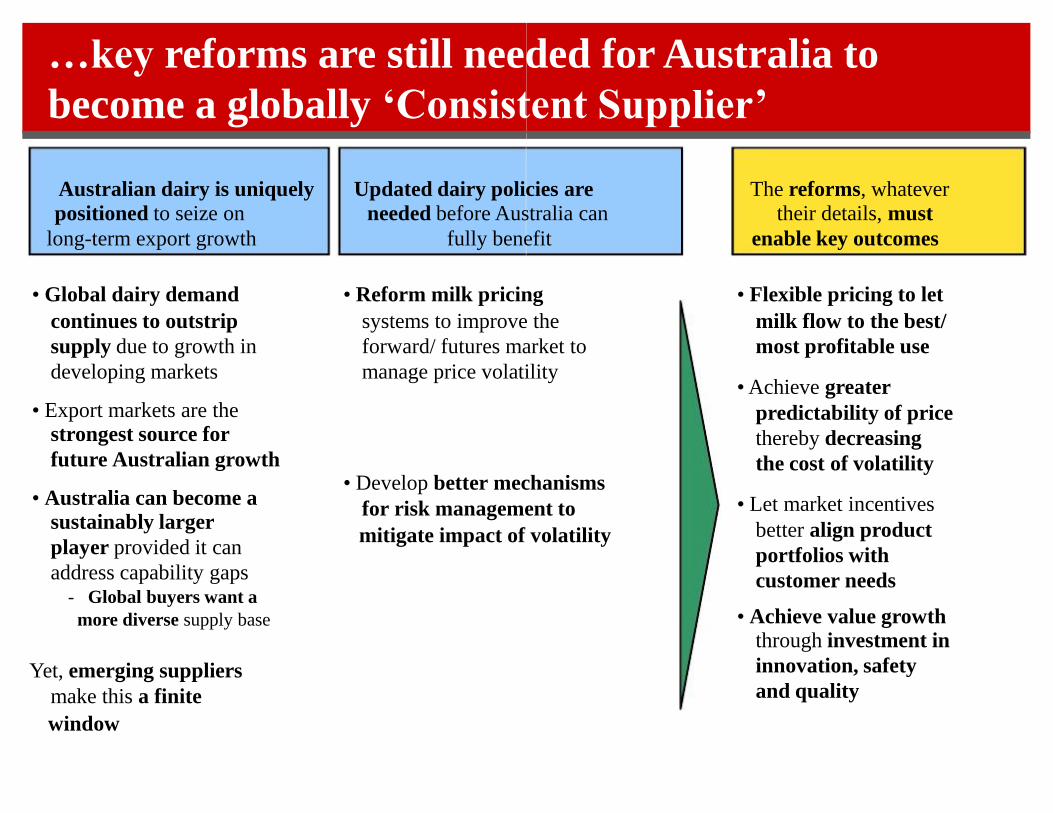
…key reforms are still needed for Australia to
become a globally ‘Consistent Supplier’
Australian dairy is uniquely
positioned to seize on
long-term export growth • Global dairy demand
continues to outstrip
supply due to growth in
developing markets • Export markets are the strongest source for
future Australian growth • Australia can become a
sustainably larger
player provided it can
address capability gaps - Global buyers want a more diverse supply base
Yet, emerging suppliers
make this a finite
window
The reforms, whatever their details, must
enable key outcomes • Flexible pricing to let
milk flow to the best/
most profitable use • Achieve greater
predictability of price
thereby decreasing
the cost of volatility • Let market incentives
better align product
portfolios with
customer needs
• Achieve value growth
through investment in
innovation, safety
and quality
Updated dairy policies are
needed before Australia can
fully benefit • Reform milk pricing
systems to improve the
forward/ futures market to
manage price volatility
• Develop better mechanisms
for risk management to
mitigate impact of volatility
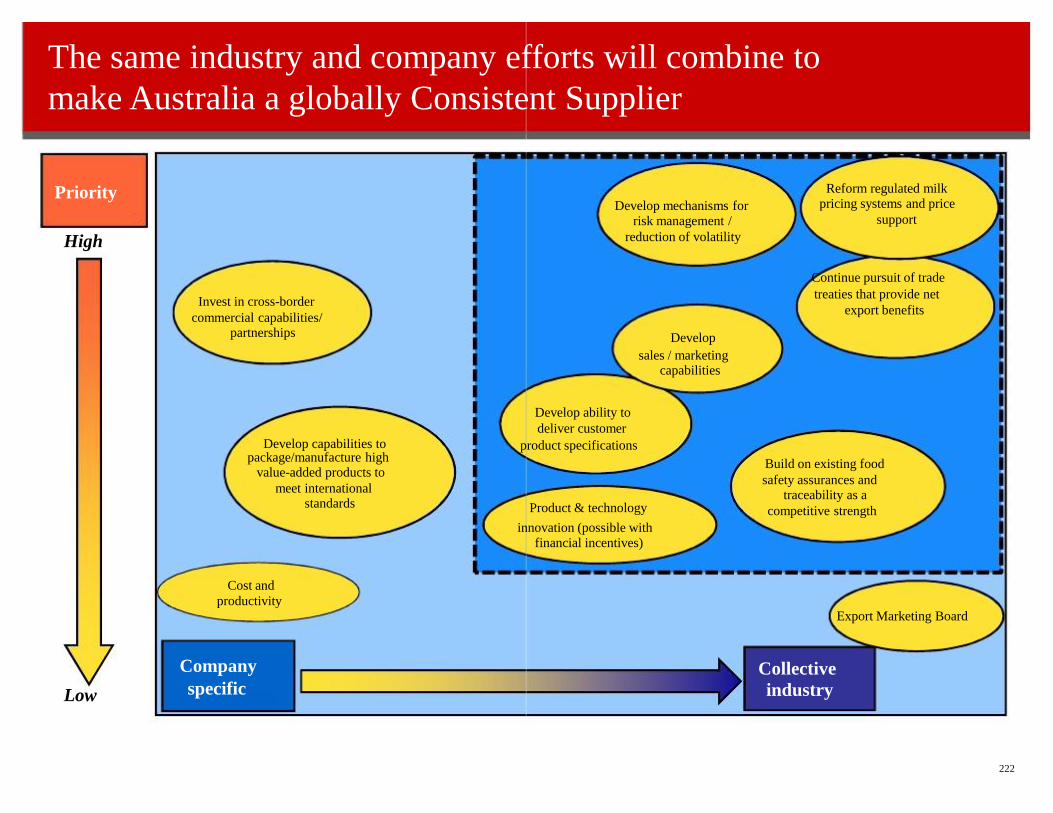
The same industry and company efforts will combine to
make Australia a globally Consistent Supplier
Company
specific
Priority High
Low
Invest in cross-border
commercial capabilities/ partnerships Develop capabilities to
package/manufacture high value-added products to
meet international standards
222
Collective
industry
Build on existing food
safety assurances and traceability as a
competitive strength
Reform regulated milk pricing systems and price
support Continue pursuit of trade
treaties that provide net
export benefits
Develop mechanisms for risk management /
reduction of volatility Develop
sales / marketing capabilities Develop ability to
deliver customer
product specifications
Product & technology
innovation (possible with financial incentives) Cost and
productivity Export Marketing Board
223
Lack of effective reform does not fundamentally
derail becoming a Consistent Supplier, yet…
Australia will retain many damaging elements of ‘Status Quo’
-Balancer of excess global supply
-Opportunistic exporter as a supplier of last resort
-Heightened impact of volatility
-Narrow product portfolio creates limited value growth
-Diminished returns will erode farm and processor equity
Australian competitive advantage is created, secured and driven
by market forces and will ultimately face distortion and
weakness from non-market related policies
The window of opportunity is not open indefinitely; our
actions will determine value available for Australian dairy over
A fairly short period
Backup and sources
224
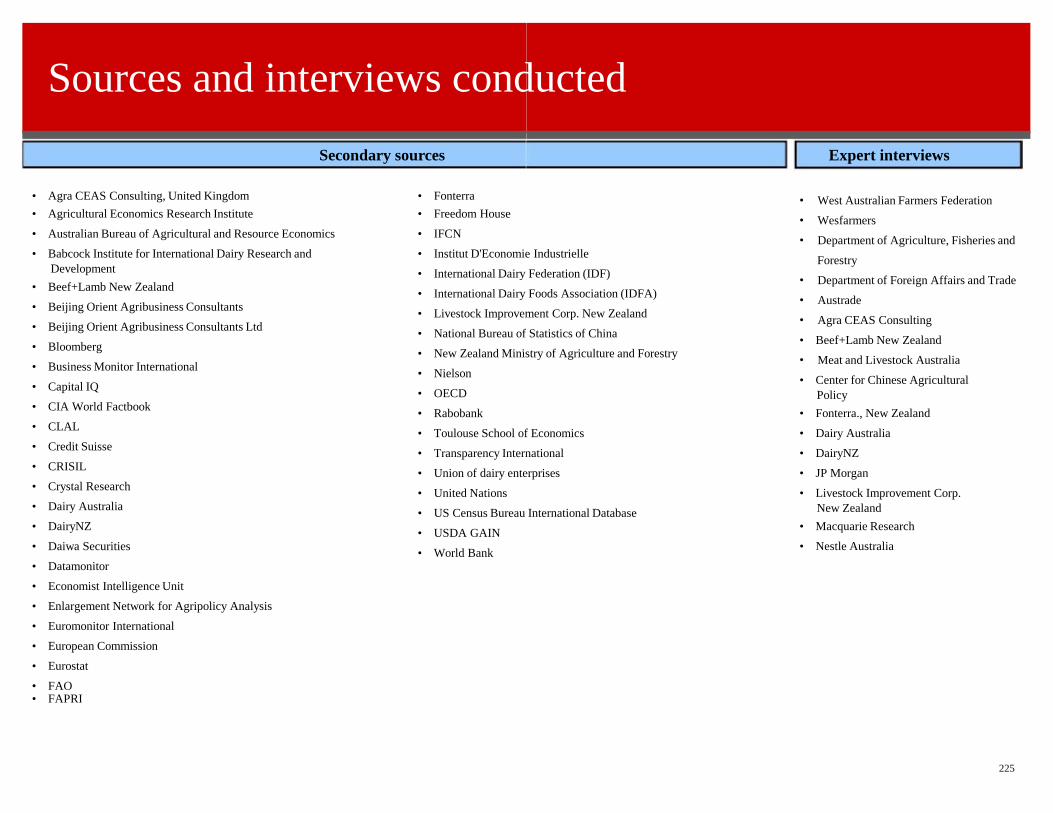
Sources and interviews conducted
• Agra CEAS Consulting, United Kingdom
• Agricultural Economics Research Institute
• Australian Bureau of Agricultural and Resource Economics
• Babcock Institute for International Dairy Research and
Development
• Beef+Lamb New Zealand
• Beijing Orient Agribusiness Consultants
• Beijing Orient Agribusiness Consultants Ltd
• Bloomberg
• Business Monitor International
• Capital IQ
• CIA World Factbook
• CLAL
• Credit Suisse
• CRISIL
• Crystal Research
• Dairy Australia
• DairyNZ
• Daiwa Securities
• Datamonitor
• Economist Intelligence Unit
• Enlargement Network for Agripolicy Analysis
• Euromonitor International
• European Commission
• Eurostat
• FAO
• Fonterra
• Freedom House
• IFCN
• Institut D'Economie Industrielle
• International Dairy Federation (IDF)
• International Dairy Foods Association (IDFA)
• Livestock Improvement Corp. New Zealand
• National Bureau of Statistics of China
• New Zealand Ministry of Agriculture and Forestry
• Nielson
• OECD
• Rabobank
• Toulouse School of Economics
• Transparency International
• Union of dairy enterprises
• United Nations
• US Census Bureau International Database
• USDA GAIN
• World Bank
Secondary sources
• FAPRI 225
Expert interviews
• West Australian Farmers Federation
• Wesfarmers
• Department of Agriculture, Fisheries and
Forestry
• Department of Foreign Affairs and Trade
• Austrade
• Agra CEAS Consulting
• Beef+Lamb New Zealand
• Meat and Livestock Australia
• Center for Chinese Agricultural
Policy
• Fonterra., New Zealand
• Dairy Australia
• DairyNZ
• JP Morgan
• Livestock Improvement Corp.
New Zealand
• Macquarie Research
• Nestle Australia