Embed Size (px)
Citation preview
Module 10/11Stream Surveys
Stream Surveys – February 2004Part 1 – Water Quality Assessment
Developed by: Updated: U5-m21a-s2
Objectives
Students will be able to:• describe techniques used to determine dissolved oxygen.• list factors that influence high turbidity and suspended
solids in streams.• explain methods used to determine total suspended solids.• evaluate the relationship between total suspended solids
and turbidity.• identify methods used to determine water clarity in streams.• assess habitat degradation by determining the degree of
sediment embeddedness in a stream.• analyze the impact of dissolved salts, pH and temperature
on streams.• describe accepted sampling methods used in stream
surveys.
Developed by: Updated: U5-m21a-s3
Stream assessments
• Water quality• Habitat• Hydrologic• Biological • Watershed
Developed by: Updated: U5-m21a-s4
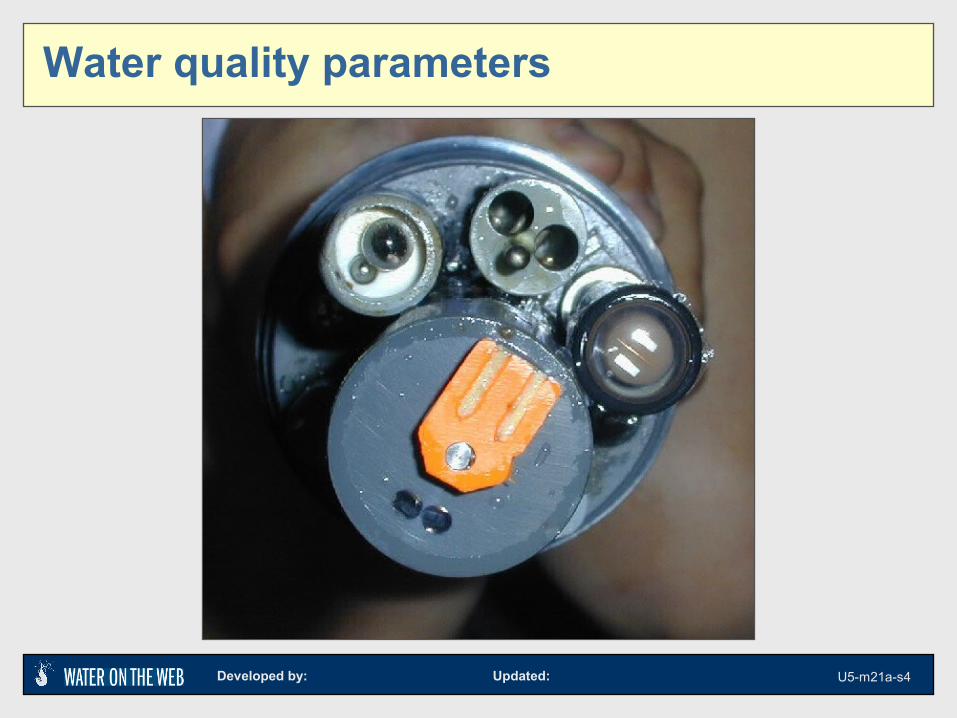
Water quality parameters
Developed by: Updated: U5-m21a-s5
Water Quality Parameters
• Dissolved oxygen• Suspended sediments (TSS) and turbidity• Specific conductivity (EC)• alkalinity• pH• Temperature• Major ions
• All of these parameters are presented in greater detail in Module 9 – Lake surveys
Developed by: Updated: U5-m21a-s6
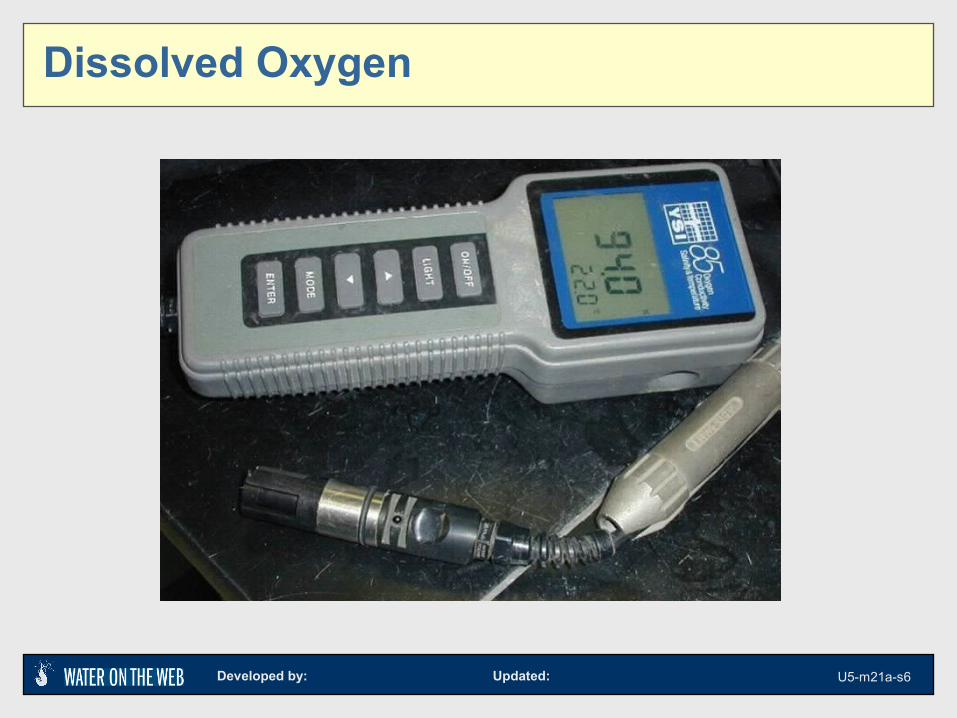
Dissolved Oxygen
Developed by: Updated: U5-m21a-s7
DO – importance and reporting
• Oxygen is produced during photosynthesis and consumed during respiration and decomposition.
• Generally < 3 mg/L is stressful to aquatic life.• Units of measurement are:
• Concentration: mg/L = ppm; concentrations range 0.0 to 20 mg/L
• % saturation – used to determine if water is fully saturated with oxygen at a particular temperature
Developed by: Updated: U5-m21a-s8
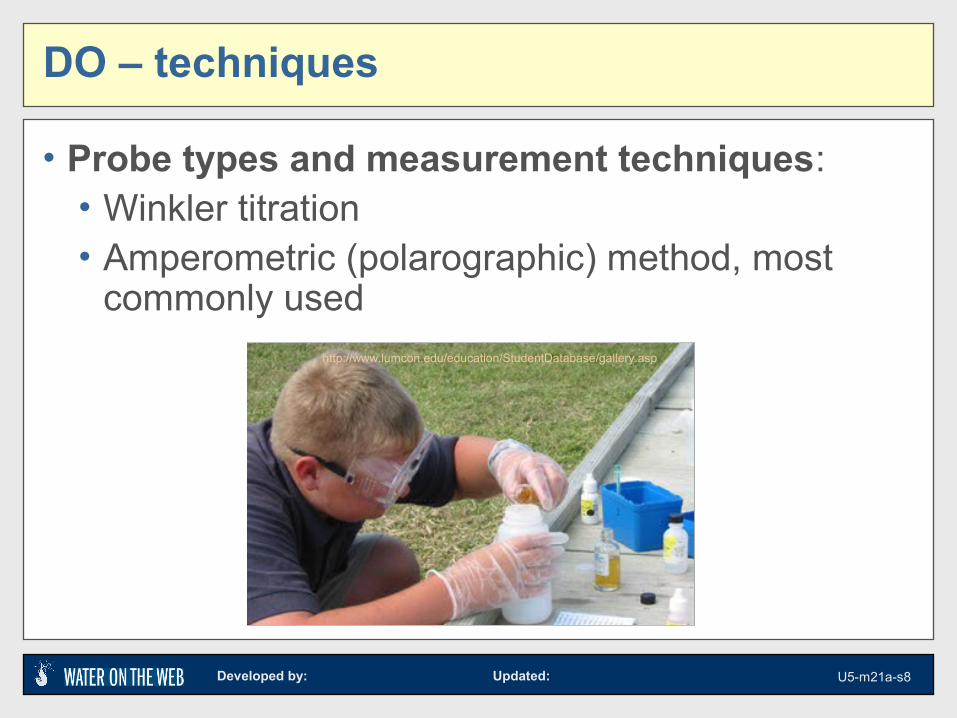
DO – techniques
• Probe types and measurement techniques:• Winkler titration• Amperometric (polarographic) method, most
commonly usedhttp://www.lumcon.edu/education/StudentDatabase/gallery.asp
Developed by: Updated: U5-m21a-s9
DO – probes
• Most common sensor is the temperature compensated polarographic membrane-type (amperometric)• Temperature sensitive (but virtually all are
compensated).• The probes actually consume O2 as they work so
measurements require moving water using either a built-in stirrer (typical in multiparameter sondes and BOD probes) or “hand jiggling” during the measurement.
• in situ sensors are prone to fouling by algal/bacterial slimes and by silt in streams.
Developed by: Updated: U5-m21a-s10
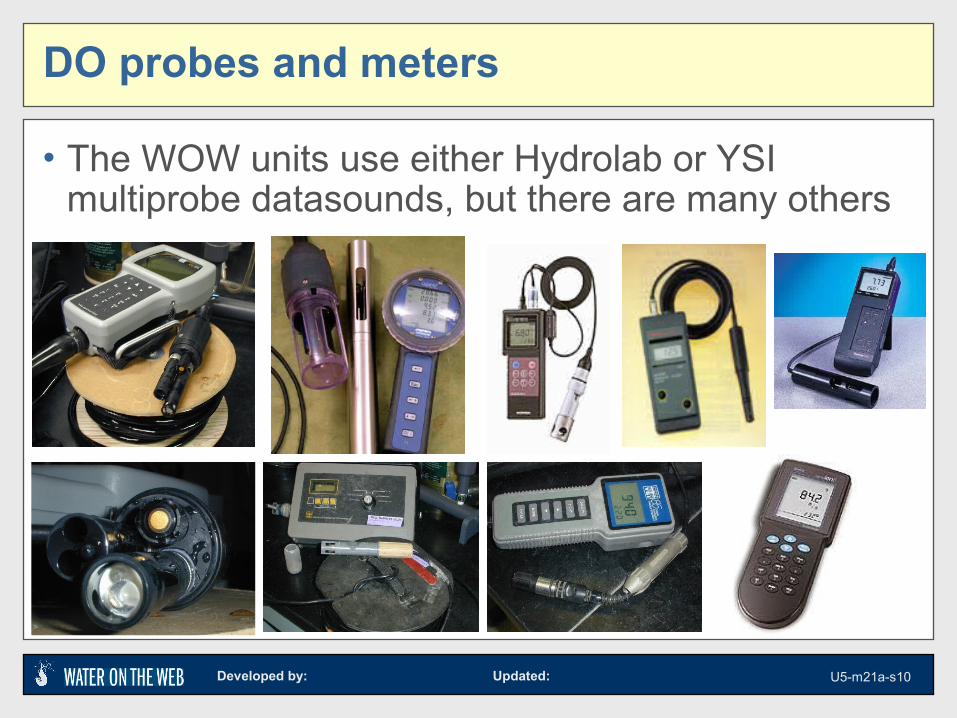
DO probes and meters
• The WOW units use either Hydrolab or YSI multiprobe datasounds, but there are many others
Developed by: Updated: U5-m21a-s11
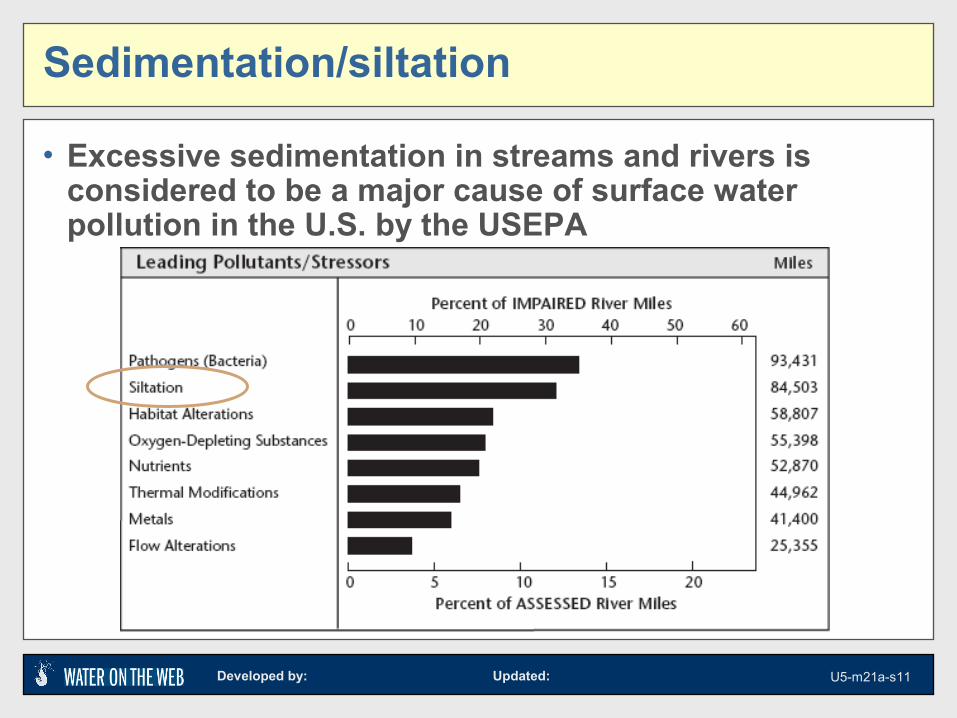
Sedimentation/siltation
• Excessive sedimentation in streams and rivers is considered to be a major cause of surface water pollution in the U.S. by the USEPA
Developed by: Updated: U5-m21a-s12
Measures of sedimentation
• Suspended sediments
• Turbidity
• Embededdness
Developed by: Updated: U5-m21a-s13
High turbidity and suspended solids
• Caused by many factors including: • soil erosion• domestic and industrial wastewater discharge • urban runoff• flooding• algal growth due to nutrient enrichment • dredging operations • channelization • removal of riparian vegetation and other stream
bank disturbances
Developed by: Updated: U5-m21a-s14
Total suspended solids and turbidity
• Both are indicators of the amount of solids suspended in the water • Mineral (e.g., soil particles)• Organic (e.g., algae, detritus)
• TSS measures the actual weight of material per volume of water (mg/L)
• Turbidity measures the amount of light scattered
• Therefore, TSS allows the determination of an actual concentration or quantity of material while turbidity does not
Developed by: Updated: U5-m21a-s15
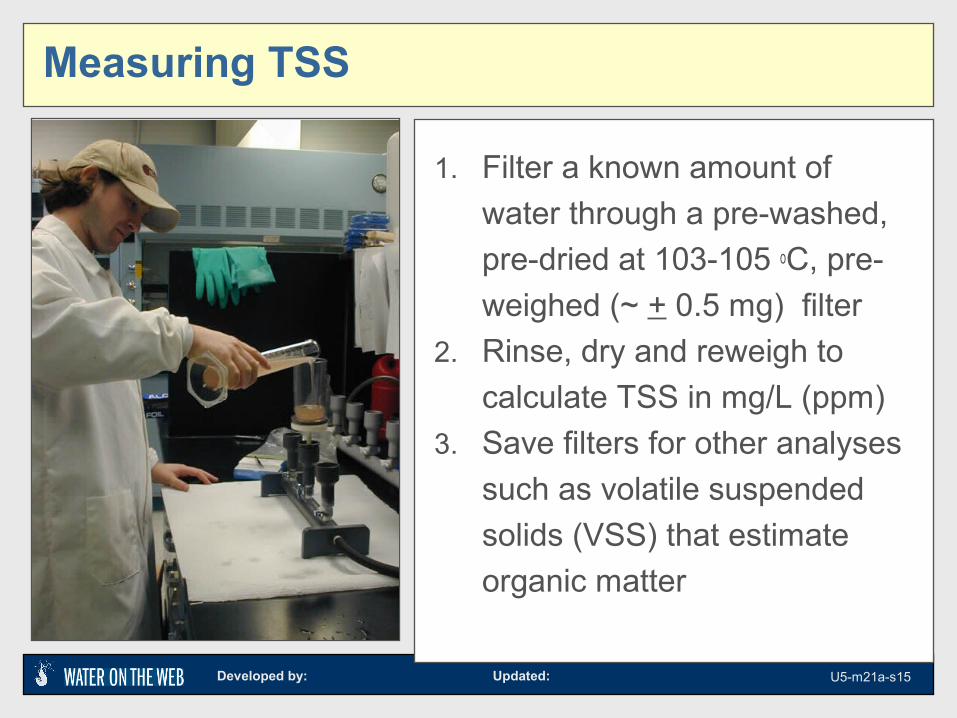
Measuring TSS
1. Filter a known amount of
water through a pre-washed,
pre-dried at 103-105 oC, pre-
weighed (~ + 0.5 mg) filter
2. Rinse, dry and reweigh to
calculate TSS in mg/L (ppm)
3. Save filters for other analyses
such as volatile suspended
solids (VSS) that estimate
organic matter
Developed by: Updated: U5-m21a-s16
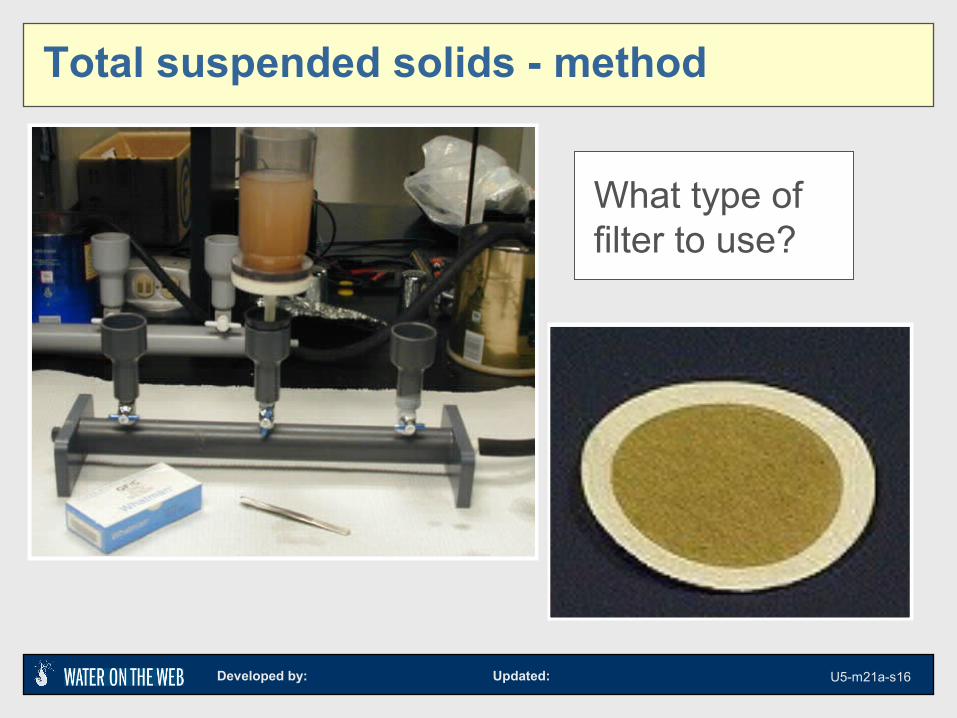
Total suspended solids - method
What type of filter to use?
Developed by: Updated: U5-m21a-s17
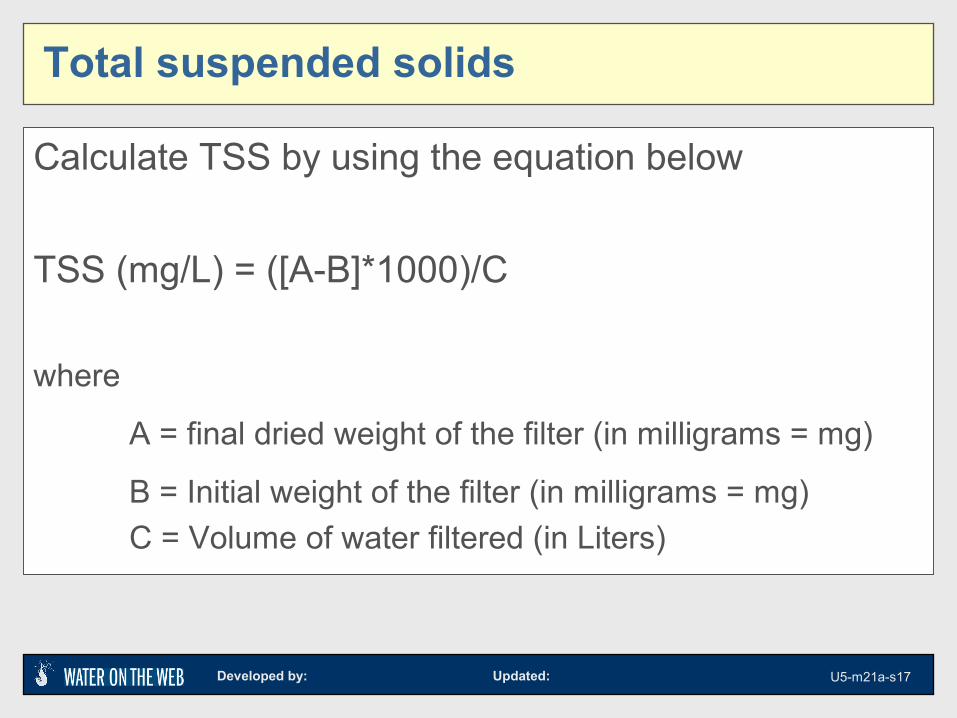
Calculate TSS by using the equation below
TSS (mg/L) = ([A-B]*1000)/C
where
A = final dried weight of the filter (in milligrams = mg)
B = Initial weight of the filter (in milligrams = mg)
C = Volume of water filtered (in Liters)
Total suspended solids
Developed by: Updated: U5-m21a-s18
TSS
• Range of results and what the results mean• Example:
Suspended solids concentrations at Slate Creek WA average 150.8 mg/l with a range of 50 to 327 mg/l. It is generally desired to maintain total suspended solid concentrations below 100 mg/l.
Developed by: Updated: U5-m21a-s19
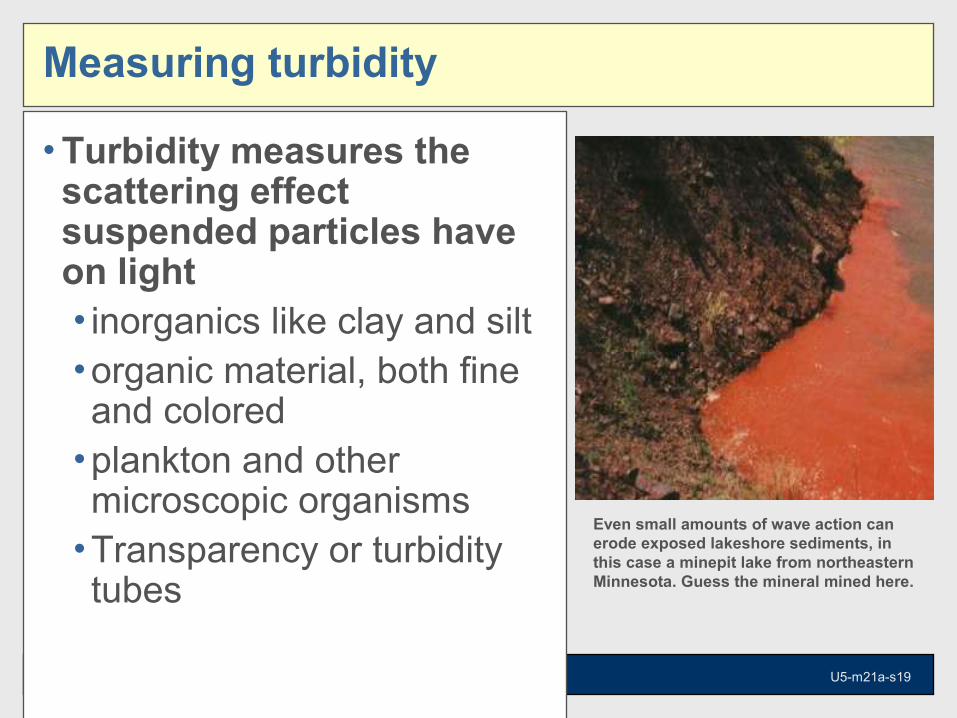
•Turbidity measures the scattering effect suspended particles have on light•inorganics like clay and silt•organic material, both fine and colored
•plankton and other microscopic organisms
•Transparency or turbidity tubes
Even small amounts of wave action can erode exposed lakeshore sediments, in this case a minepit lake from northeastern Minnesota. Guess the mineral mined here.
Measuring turbidity
Developed by: Updated: U5-m21a-s20
Turbidity
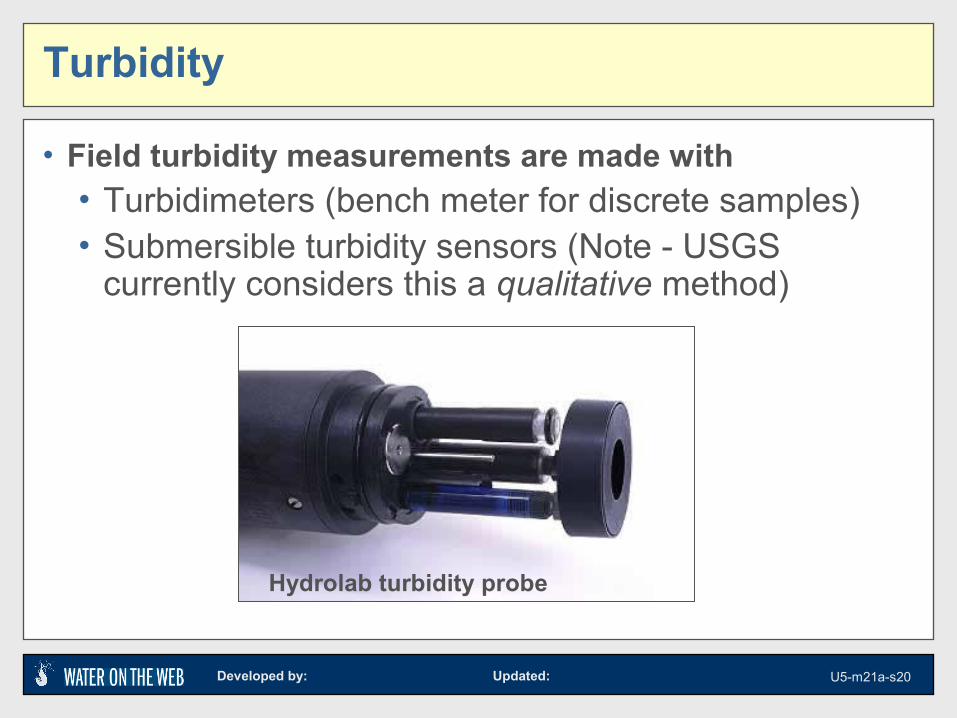
• Field turbidity measurements are made with • Turbidimeters (bench meter for discrete samples)• Submersible turbidity sensors (Note - USGS
currently considers this a qualitative method)
Hydrolab turbidity probe
Developed by: Updated: U5-m21a-s21
Turbidity - Nephelometric optics
• Nephelometric turbidity estimated by the scattering effect suspended particles have on light
• Detector is at 90o from the light source
Developed by: Updated: U5-m21a-s22
Turbidity – units and reporting
• Nephelometric Turbidity Units (NTU) standards are formazin or other certified material
• JTU’s are from an “older” technology in which a candle flame was viewed through a tube of water
1 NTU = 1 JTU (Jackson Turbidity Unit)
Developed by: Updated: U5-m21a-s23
Turbidity - standards
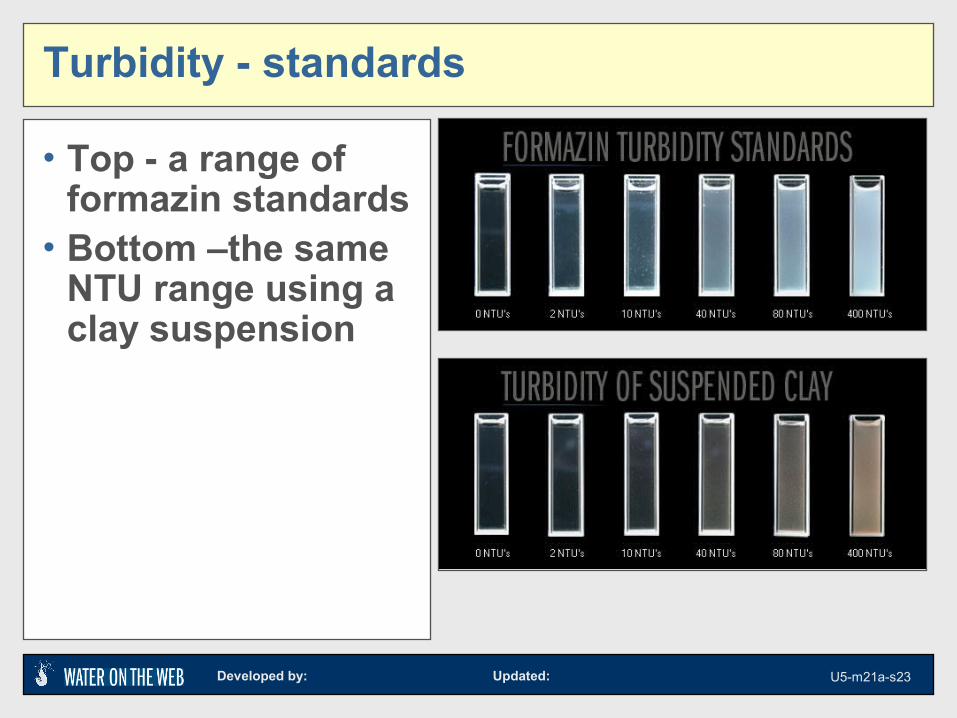
• Top - a range of formazin standards
• Bottom –the same NTU range using a clay suspension
Developed by: Updated: U5-m21a-s24
Turbidity
• Range of results and what the results mean• Ex: Salmon Creek Watershed (OR/WA border)
TMDL for turbidity is: "Turbidity shall not exceed 5 NTU over
background turbidity when the background turbidity is 50 NTU or less. Or more than a 10% increase in turbidity when the background turbidity is > 50 NTU”.
Developed by: Updated: U5-m21a-s25
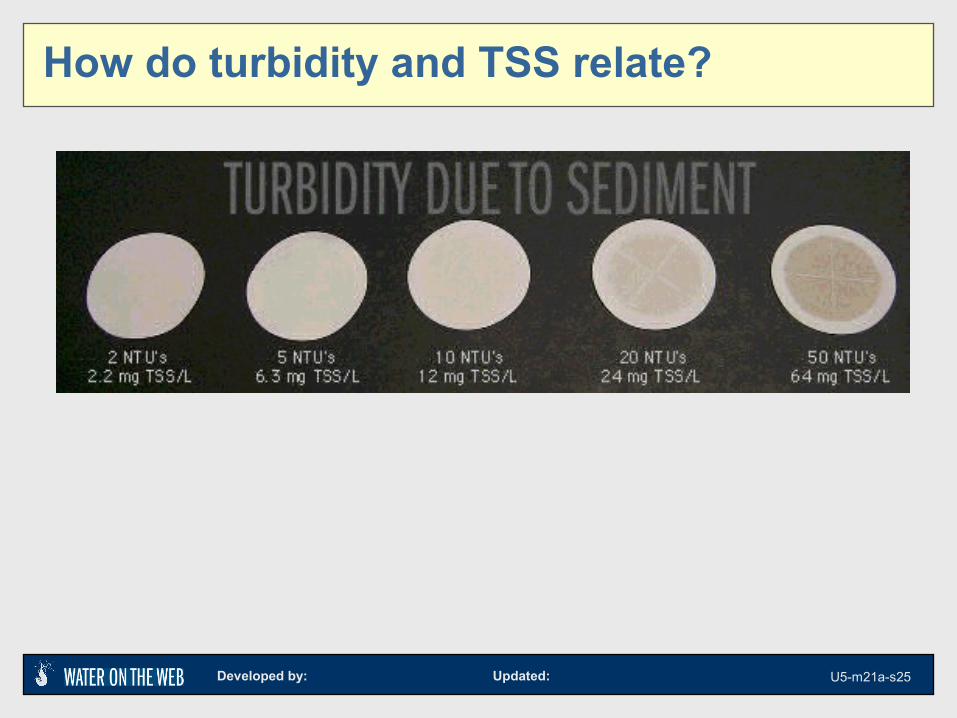
How do turbidity and TSS relate?
Developed by: Updated: U5-m21a-s26
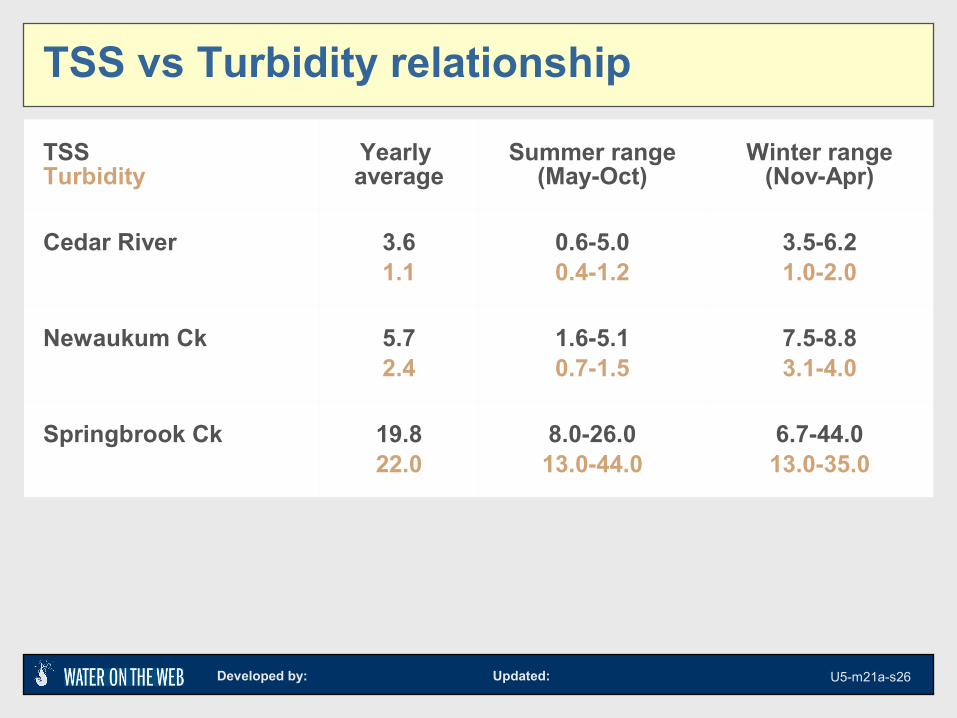
TSS vs Turbidity relationship
TSSTurbidity
Yearly average
Summer range (May-Oct)
Winter range (Nov-Apr)
Cedar River 3.61.1
0.6-5.00.4-1.2
3.5-6.21.0-2.0
Newaukum Ck 5.72.4
1.6-5.10.7-1.5
7.5-8.83.1-4.0
Springbrook Ck 19.822.0
8.0-26.013.0-44.0
6.7-44.013.0-35.0
Developed by: Updated: U5-m21a-s27
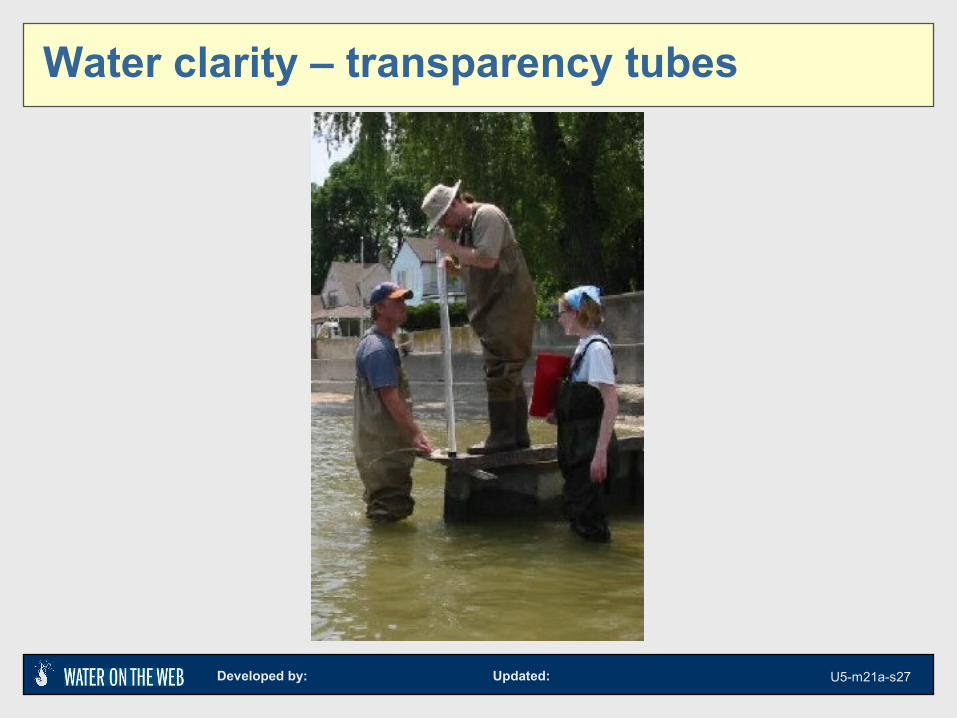
Water clarity – transparency tubes
Developed by: Updated: U5-m21a-s28
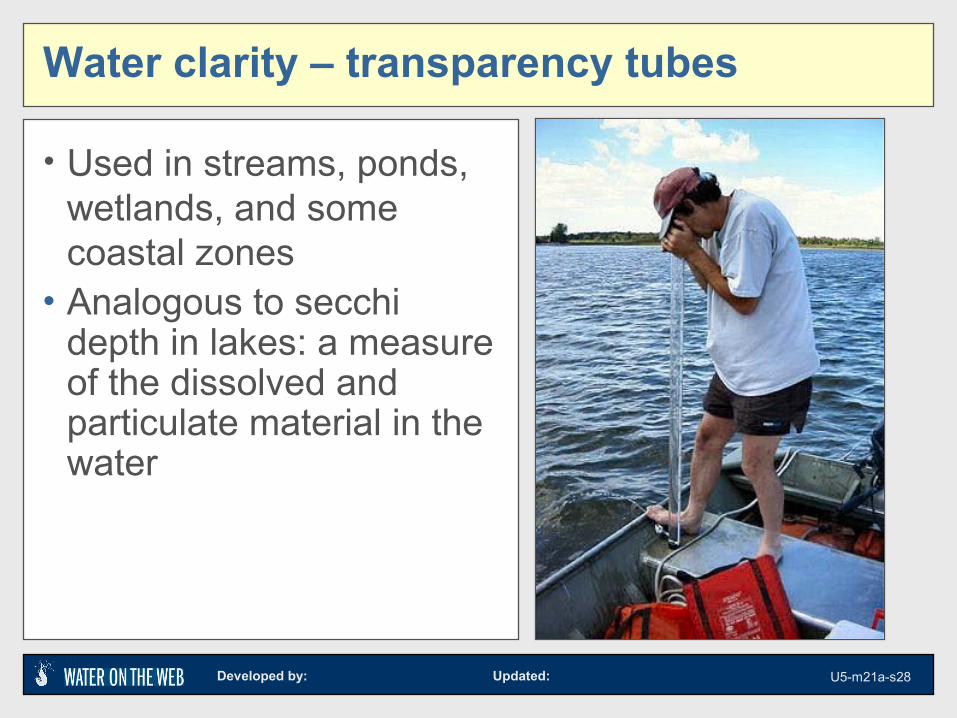
Water clarity – transparency tubes
• Used in streams, ponds, wetlands, and some coastal zones
• Analogous to secchi depth in lakes: a measure of the dissolved and particulate material in the water
Developed by: Updated: U5-m21a-s29
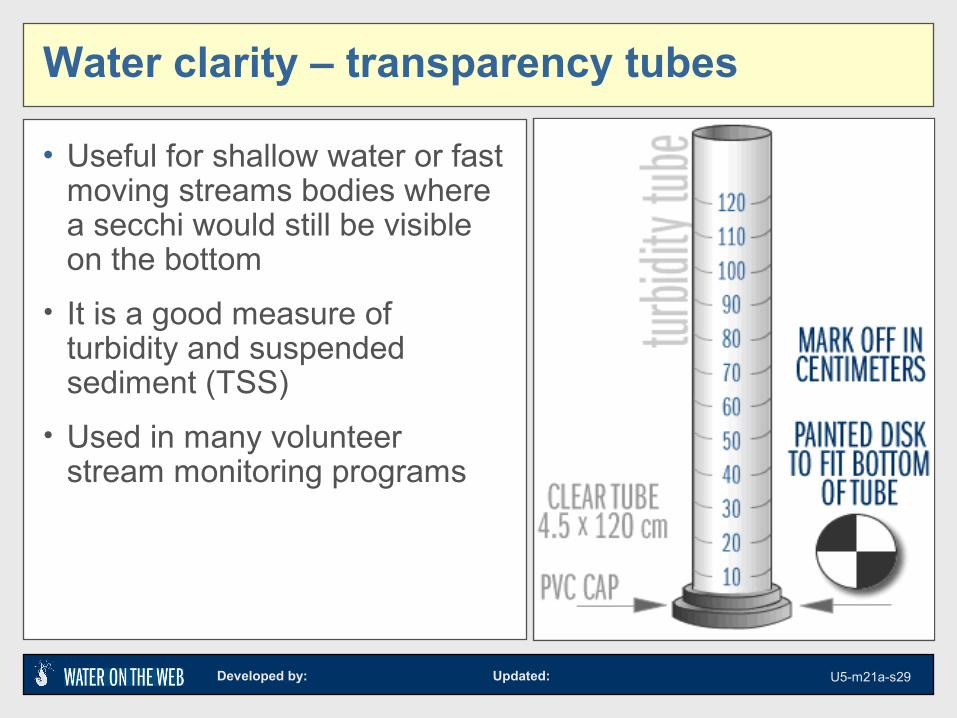
Water clarity – transparency tubes
• Useful for shallow water or fast moving streams bodies where a secchi would still be visible on the bottom
• It is a good measure of turbidity and suspended sediment (TSS)
• Used in many volunteer stream monitoring programs
Developed by: Updated: U5-m21a-s30
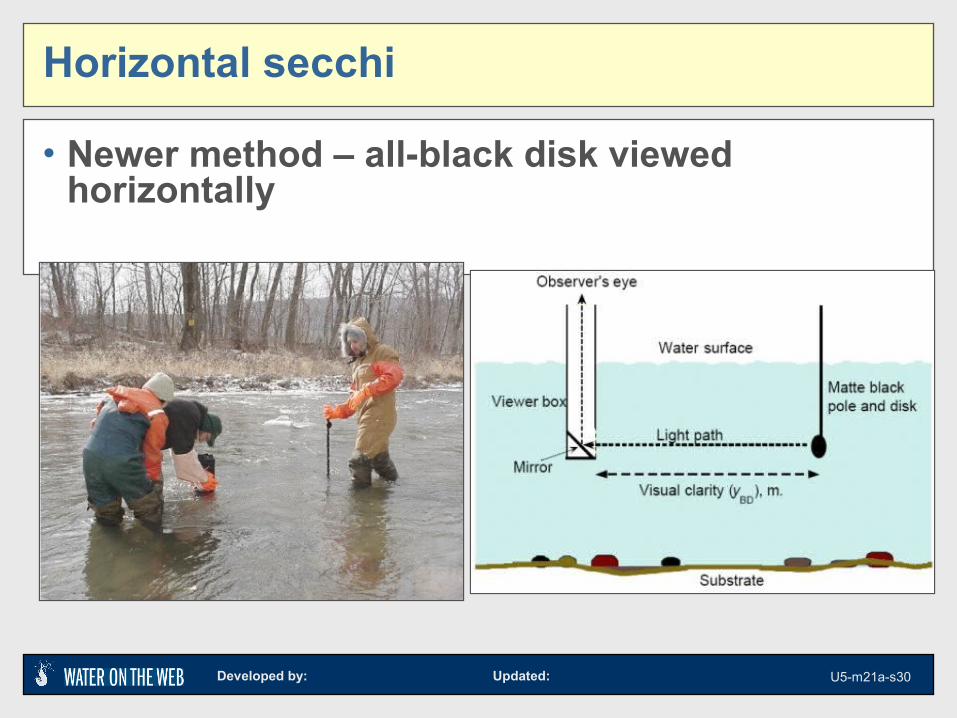
Horizontal secchi
• Newer method – all-black disk viewed horizontally
Developed by: Updated: U5-m21a-s31
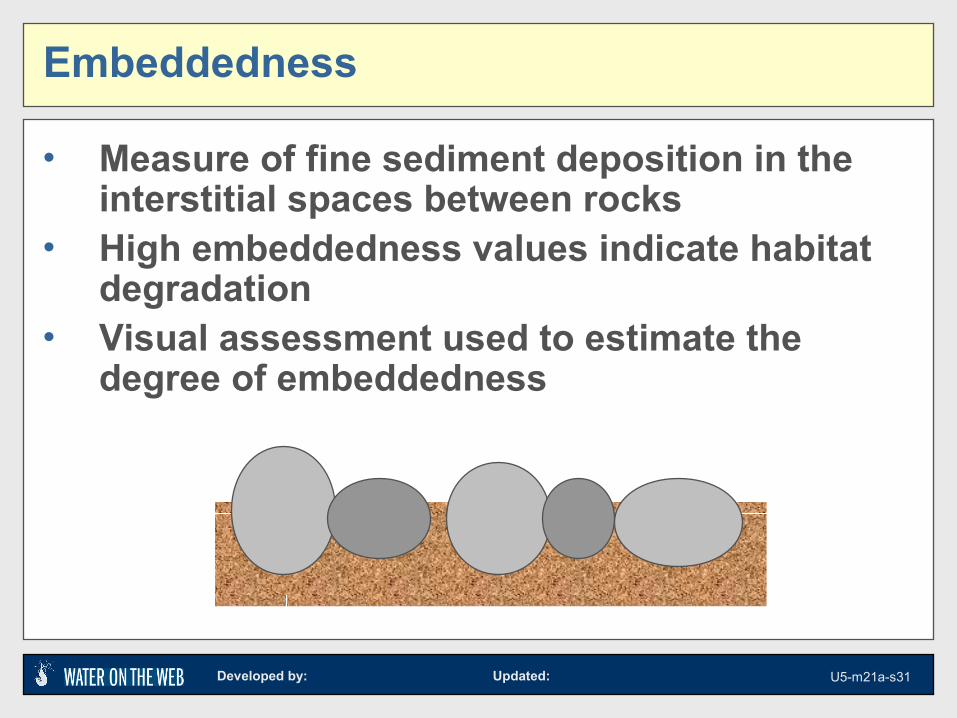
Embeddedness
• Measure of fine sediment deposition in the interstitial spaces between rocks
• High embeddedness values indicate habitat degradation
• Visual assessment used to estimate the degree of embeddedness
Developed by: Updated: U5-m21a-s32
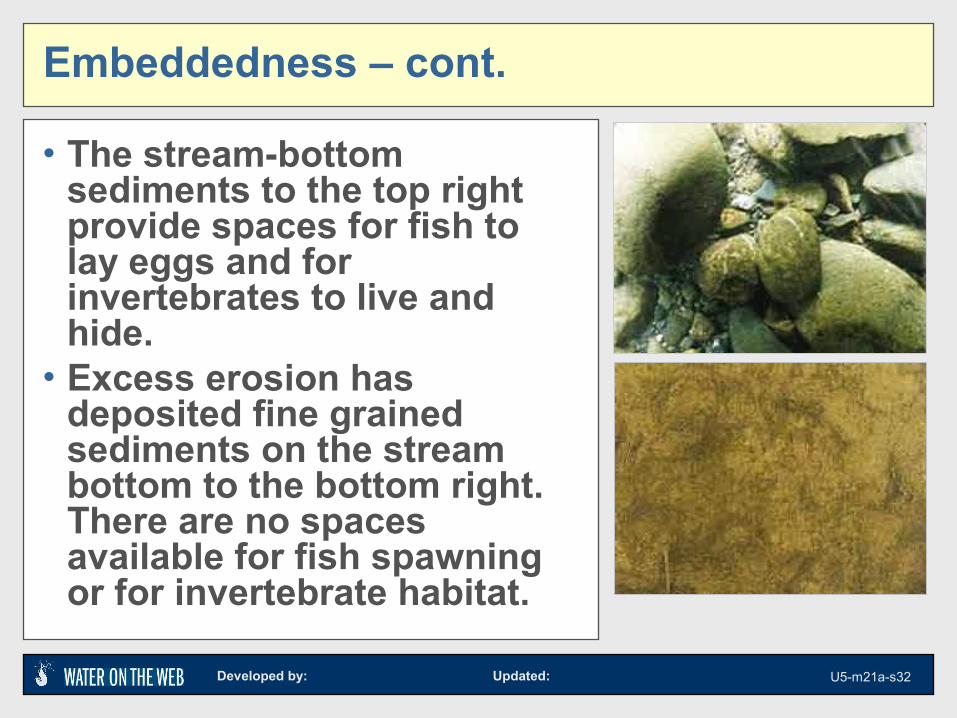
Embeddedness – cont.
• The stream-bottom sediments to the top right provide spaces for fish to lay eggs and for invertebrates to live and hide.
• Excess erosion has deposited fine grained sediments on the stream bottom to the bottom right. There are no spaces available for fish spawning or for invertebrate habitat.
Developed by: Updated: U5-m21a-s33
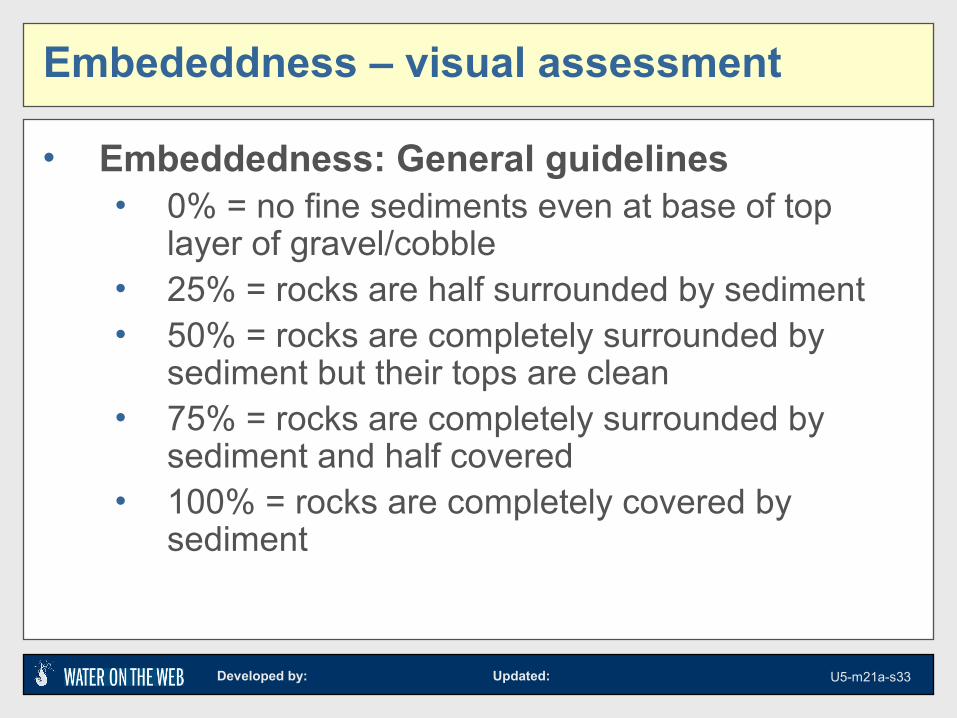
Embededdness – visual assessment
• Embeddedness: General guidelines• 0% = no fine sediments even at base of top
layer of gravel/cobble• 25% = rocks are half surrounded by sediment• 50% = rocks are completely surrounded by
sediment but their tops are clean• 75% = rocks are completely surrounded by
sediment and half covered• 100% = rocks are completely covered by
sediment
Developed by: Updated: U5-m21a-s34
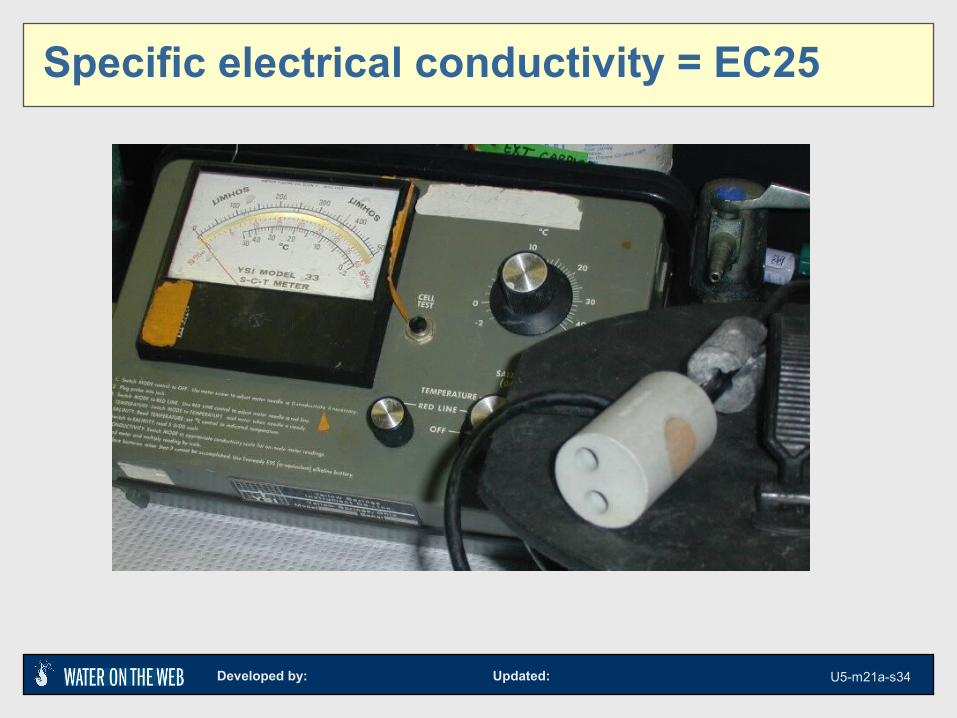
Specific electrical conductivity = EC25
Developed by: Updated: U5-m21a-s35
EC25 - importance
• Cheap, easy way to characterize the total dissolved salt concentration of a water sample
• For tracing water masses and defining mixing zones • Groundwater plumes• Stream flowing into another stream or into a lake or
reservoir
Developed by: Updated: U5-m21a-s36
EC25 – units and reporting
Principle of measurement
• A small voltage is applied between 2 parallel metal rod shaped electrodes, usually 1 cm apart
• Measured current flow is proportional to the dissolved ion content of the water
• If the sensor is temperature compensated to 25oC, EC is called “specific” EC (EC25)
Developed by: Updated: U5-m21a-s37
EC25 - units
• What in the world are microSiemens per centimeter (µS/cm)?
• Units for EC and EC25 are mS/cm or μS/cm @25oC. The WOW site reports it as EC @25oC (in μS/cm).
• Usually report to 2 or 3 significant figures (to + ~ 1-5 μS/cm)
• More details can be found in Module 9
Developed by: Updated: U5-m21a-s38
EC25
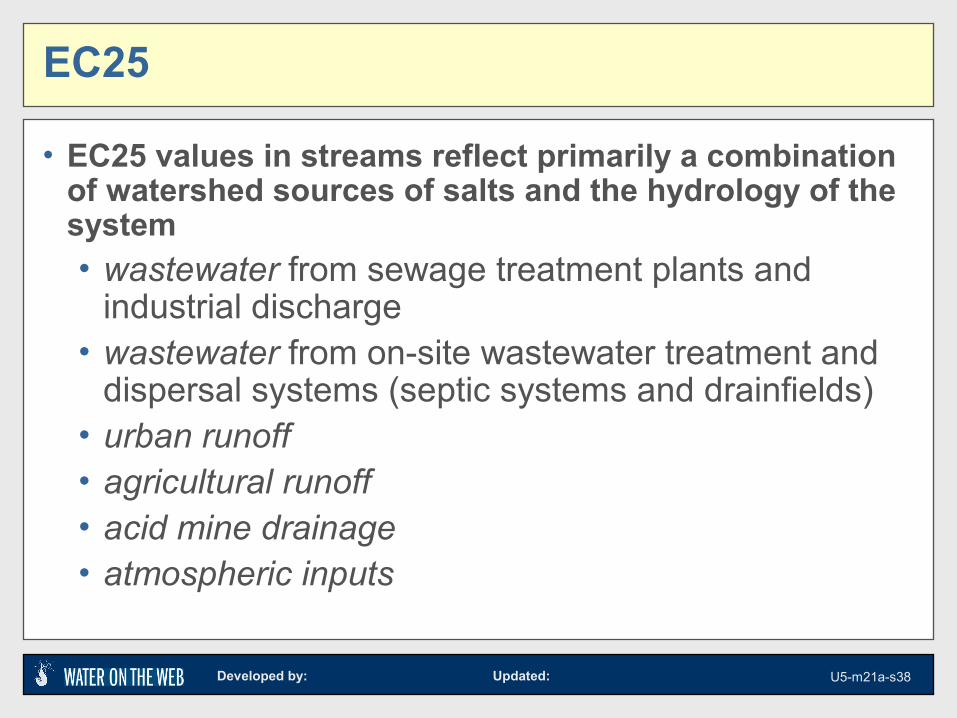
• EC25 values in streams reflect primarily a combination of watershed sources of salts and the hydrology of the system• wastewater from sewage treatment plants and
industrial discharge • wastewater from on-site wastewater treatment and
dispersal systems (septic systems and drainfields) • urban runoff • agricultural runoff • acid mine drainage • atmospheric inputs
Developed by: Updated: U5-m21a-s39
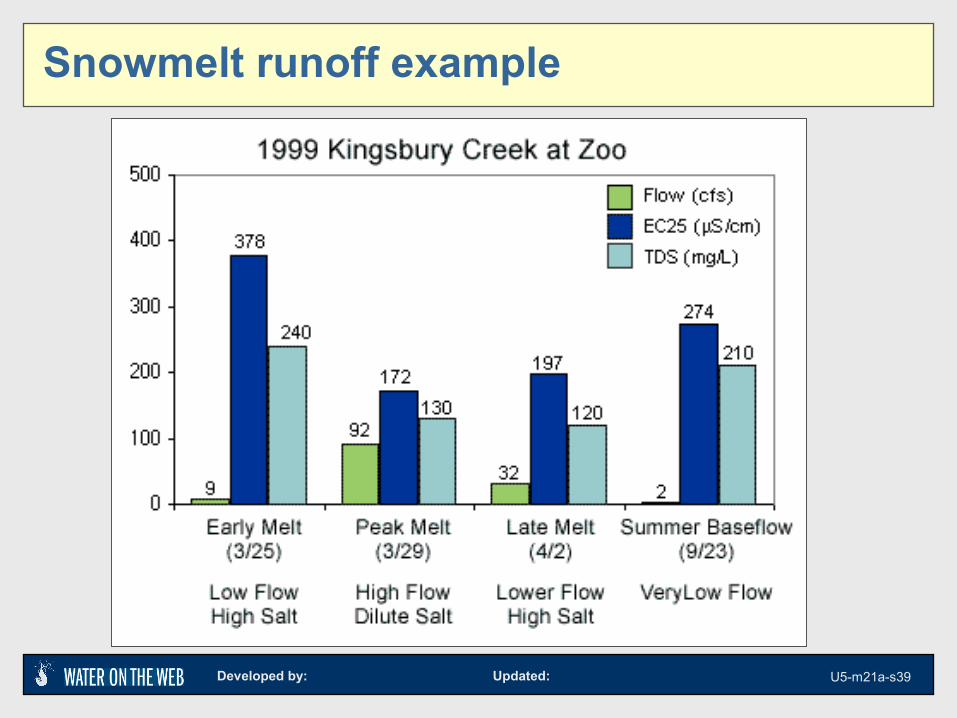
Snowmelt runoff example
Developed by: Updated: U5-m21a-s40
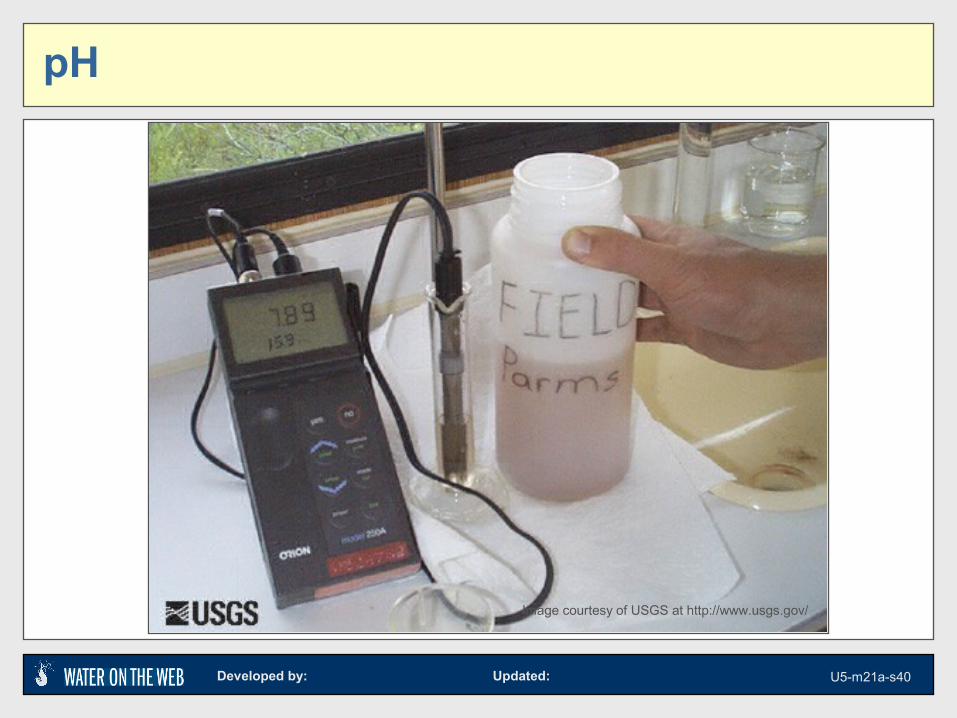
pH
Image courtesy of USGS at http://www.usgs.gov/
Developed by: Updated: U5-m21a-s41
pH – importance in aquatic systems
• The pH of a sample of water is a measure of the concentration of hydrogen ions.
• pH determines the solubility and biological availability of chemical constituents such as nutrients (phosphorus, nitrogen, and carbon) and heavy metals (lead, copper, cadmium, etc.).
Developed by: Updated: U5-m21a-s42
pH - reporting
• pH can be measured electrometrically or colorimetrically (pH paper) BUT ONLY the former technique is approved by the EPA and USGS for natural waters.
• The electrometric method uses a hydrogen ion electrode.
• pH meters require extensive care in handling and operation.
• Report to the nearest 0.1 standard pH unit
Developed by: Updated: U5-m21a-s43
pH – probes
• Field probe types:• Combination probes (e.g.YSI)
• Less expensive; more rugged design• Less precise• Shorter life because reference solution cannot be
replenished
• Separate reading and reference electrodes (e.g., Hydrolab)• Costs more• More precise; faster response time• Allows user maintenance; Teflon junction and electrolyte
can be replaced
Developed by: Updated: U5-m21a-s44
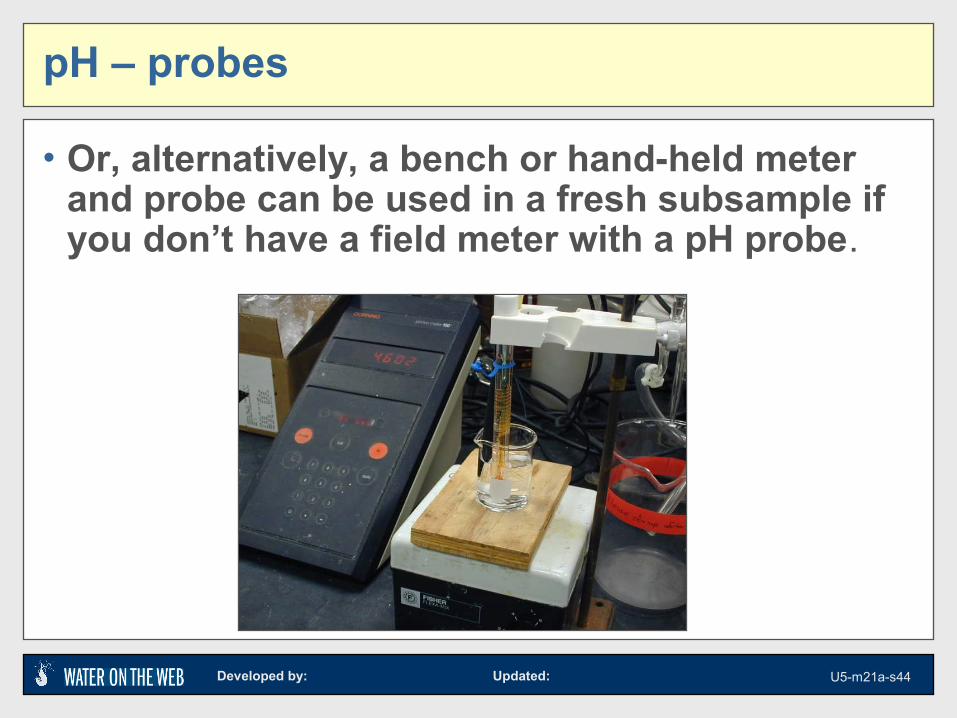
pH – probes
• Or, alternatively, a bench or hand-held meter and probe can be used in a fresh subsample if you don’t have a field meter with a pH probe.
Developed by: Updated: U5-m21a-s45
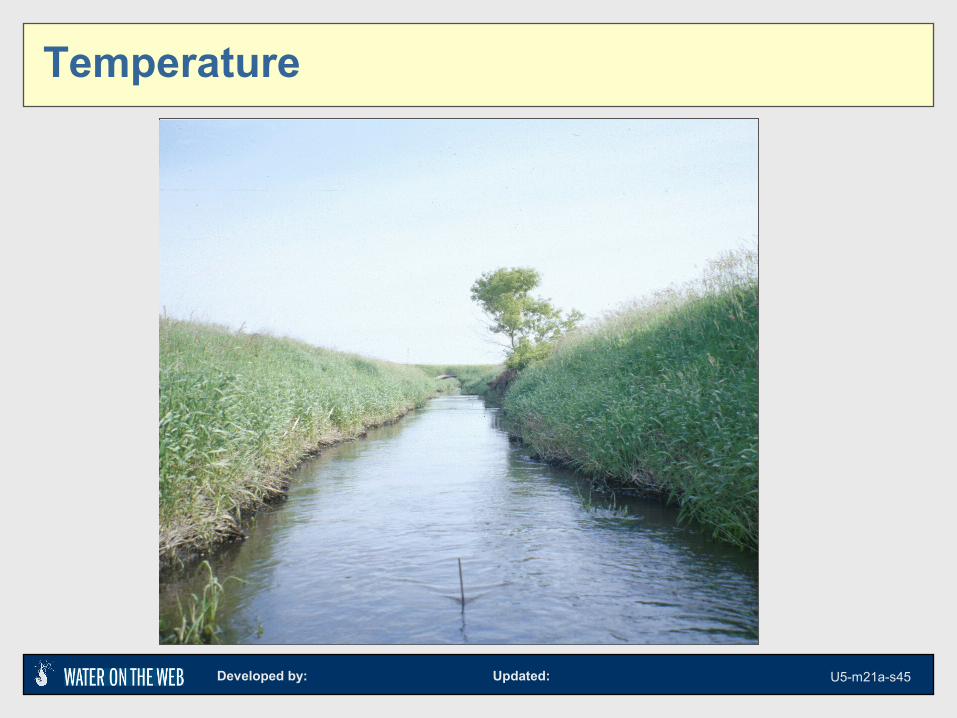
Temperature
Developed by: Updated: U5-m21a-s46
Temperature importance
• Temperature affects:• the oxygen content of the water (oxygen levels
become lower as temperature increases) • the rate of photosynthesis by aquatic plants• the metabolic rates of aquatic organisms• the sensitivity of organisms to toxic wastes,
parasites, and diseases
Developed by: Updated: U5-m21a-s47
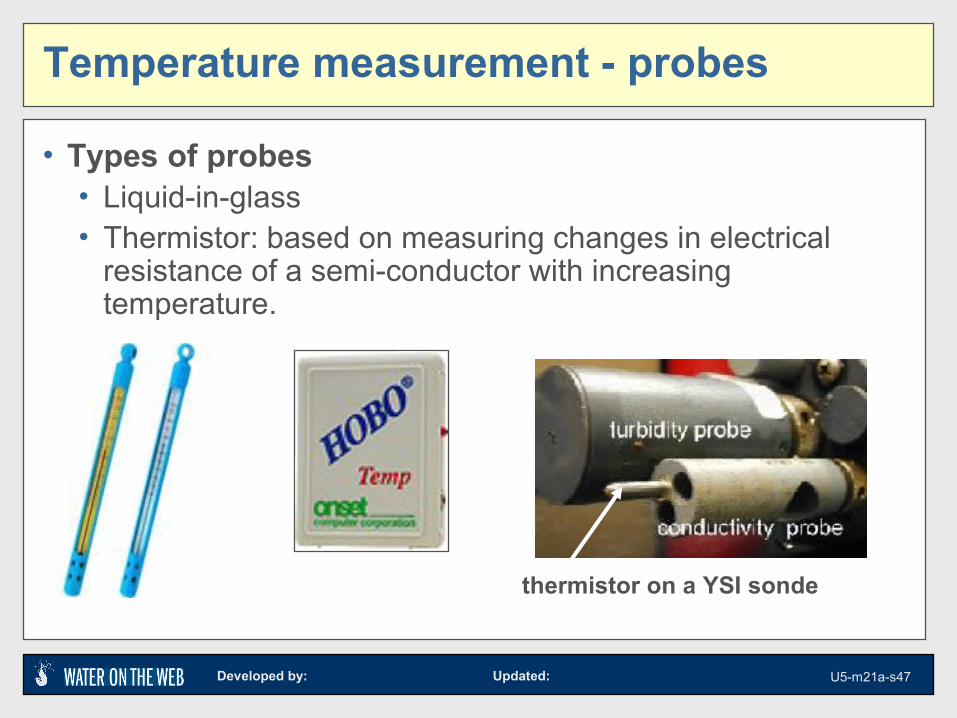
Temperature measurement - probes
• Types of probes• Liquid-in-glass• Thermistor: based on measuring changes in electrical
resistance of a semi-conductor with increasing temperature.
thermistor on a YSI sonde
Developed by: Updated: U5-m21a-s48
Temperature changes
• Causes of temperature change include:• weather• removal of shading streambank vegetation,• impoundments (a body of water confined by a
barrier, such as a dam) • discharge of cooling water• urban storm water• groundwater inflows to the stream
Developed by: Updated: U5-m21a-s49
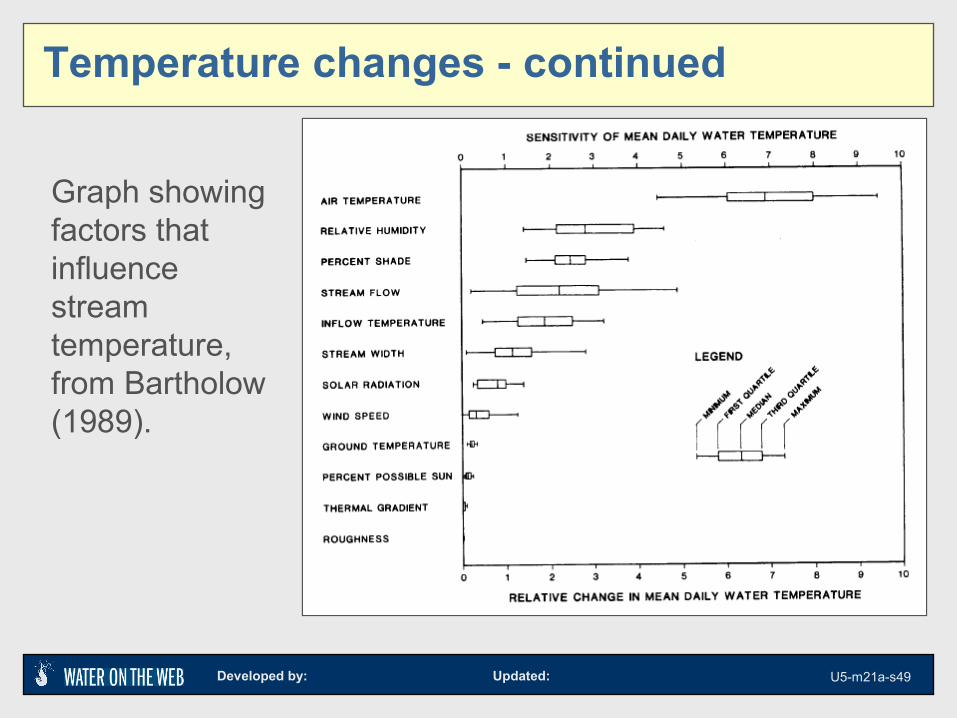
Temperature changes - continued
Graph showing factors that influence stream temperature, from Bartholow (1989).
Developed by: Updated: U5-m21a-s50
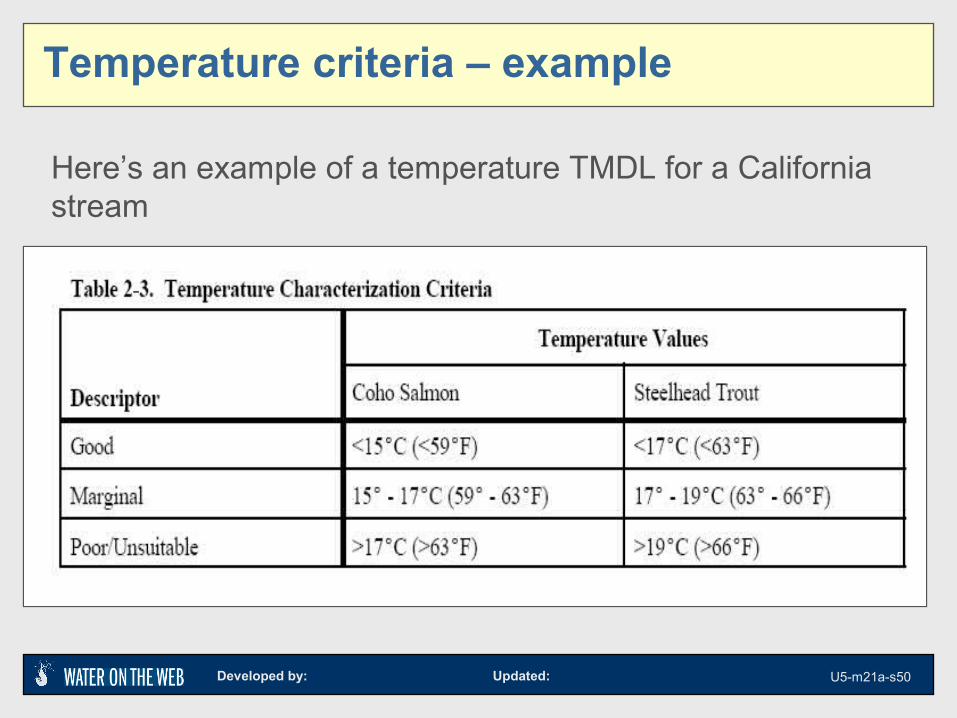
Temperature criteria – example
Here’s an example of a temperature TMDL for a California stream
Developed by: Updated: U5-m21a-s51
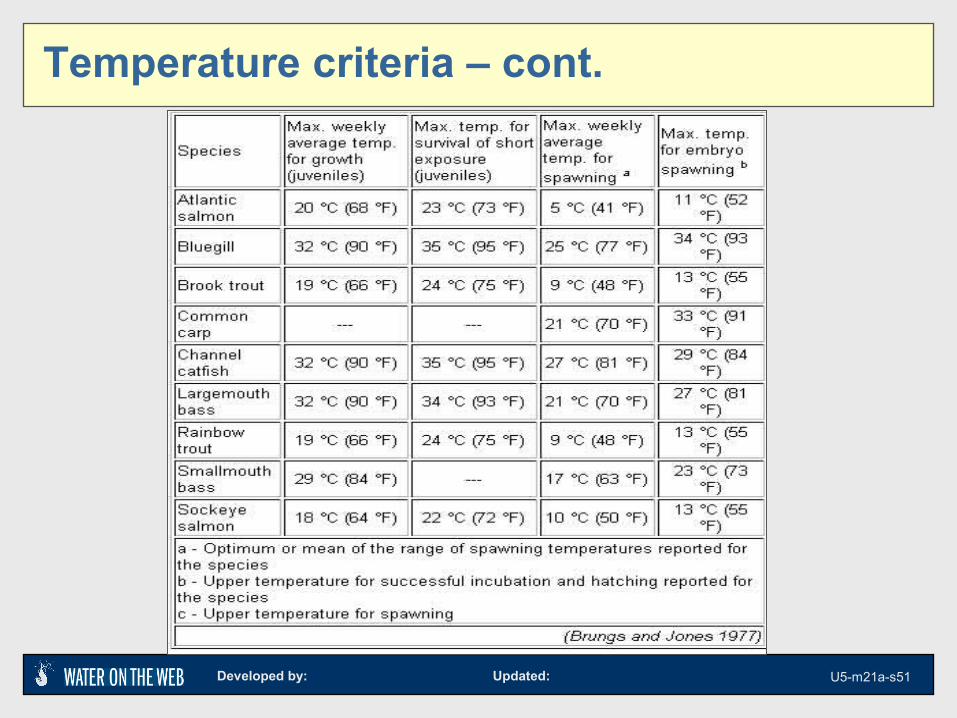
Temperature criteria – cont.
Developed by: Updated: U5-m21a-s52
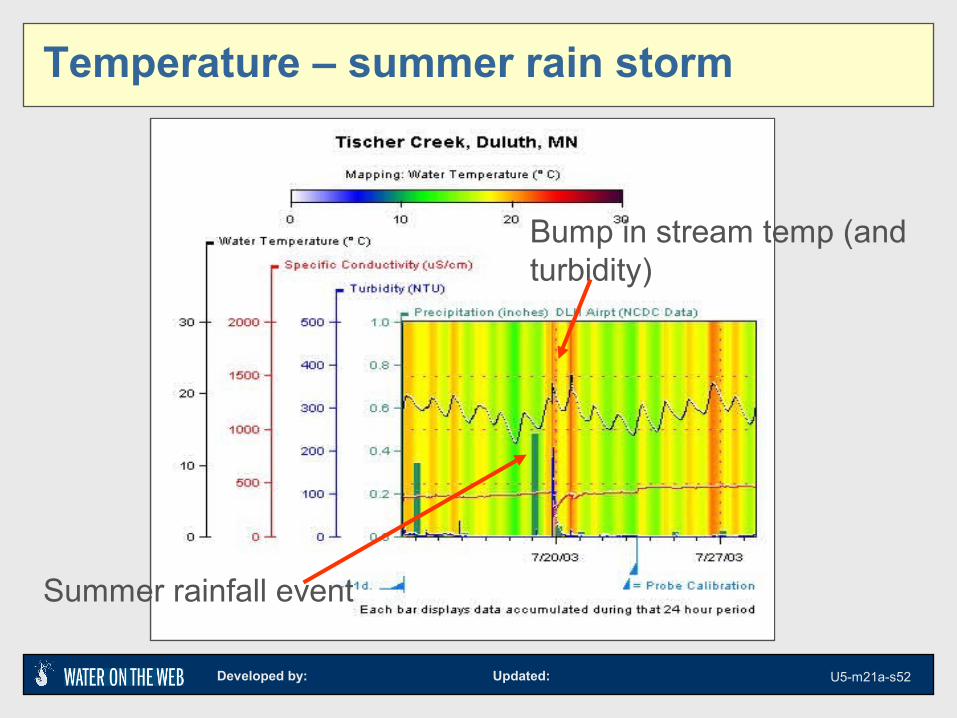
Temperature – summer rain storm
Summer rainfall event
Bump in stream temp (and turbidity)
Developed by: Updated: U5-m21a-s53
Other Water Quality Parameters
• Nutrients – nitrogen and phosphorus• Fecal coliforms• Biochemical oxygen demand (BOD)• Metals• Toxic contaminants
• Details on analyzing these parameters are in Module 9 – Lake Surveys
Developed by: Updated: U5-m21a-s54
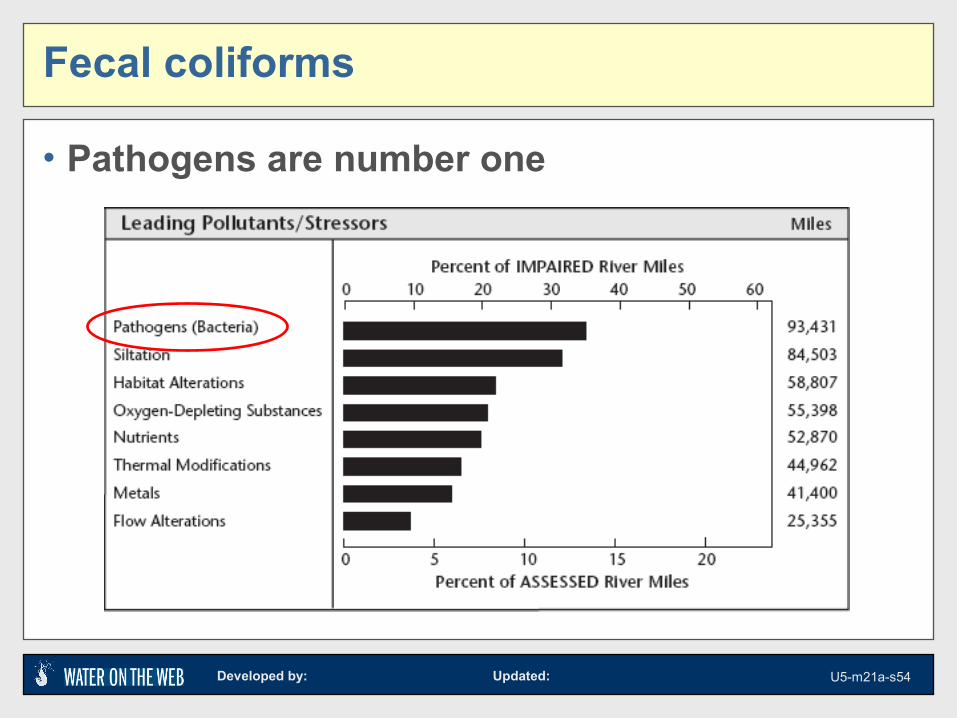
Fecal coliforms
• Pathogens are number one
Developed by: Updated: U5-m21a-s55
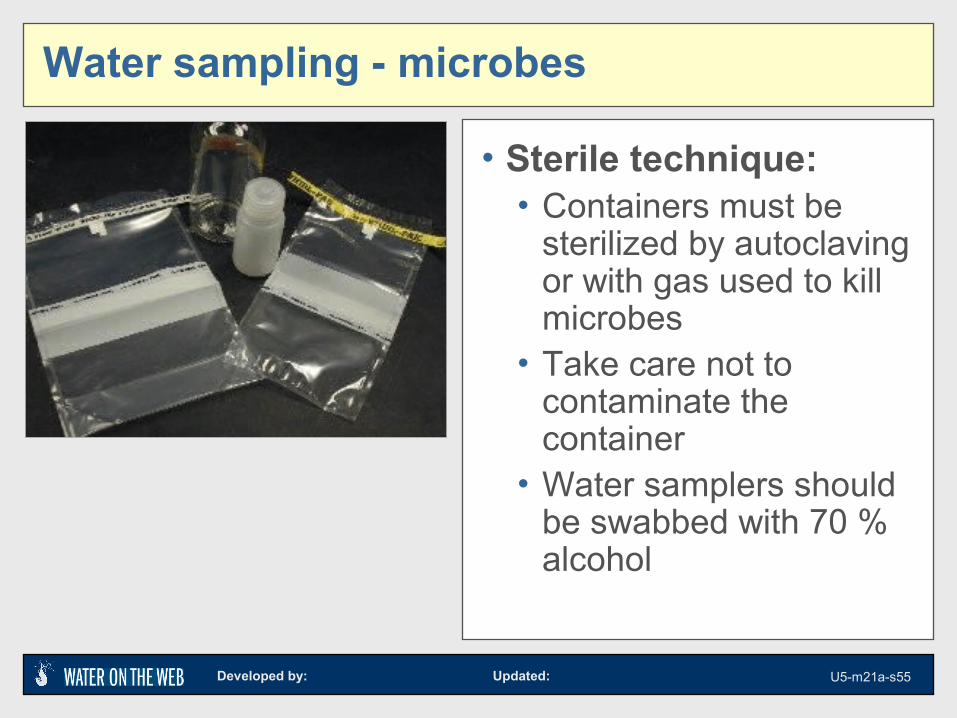
Water sampling - microbes
• Sterile technique:• Containers must be
sterilized by autoclaving or with gas used to kill microbes
• Take care not to contaminate the container
• Water samplers should be swabbed with 70 % alcohol
Developed by: Updated: U5-m21a-s56
Bacteria – E. coli and fecal coliforms
• Fecal bacteria are used as indicators of possible sewage contamination
• These bacteria indicate the possible presence of disease-causing bacteria, viruses, and protozoans that also live in human and animal digestive systems
• E. coli is currently replacing the fecal coliform assay in most beach monitoring programs
See Module 9 for a detailed discussion of measuring pathogens
Developed by: Updated: U5-m21a-s57
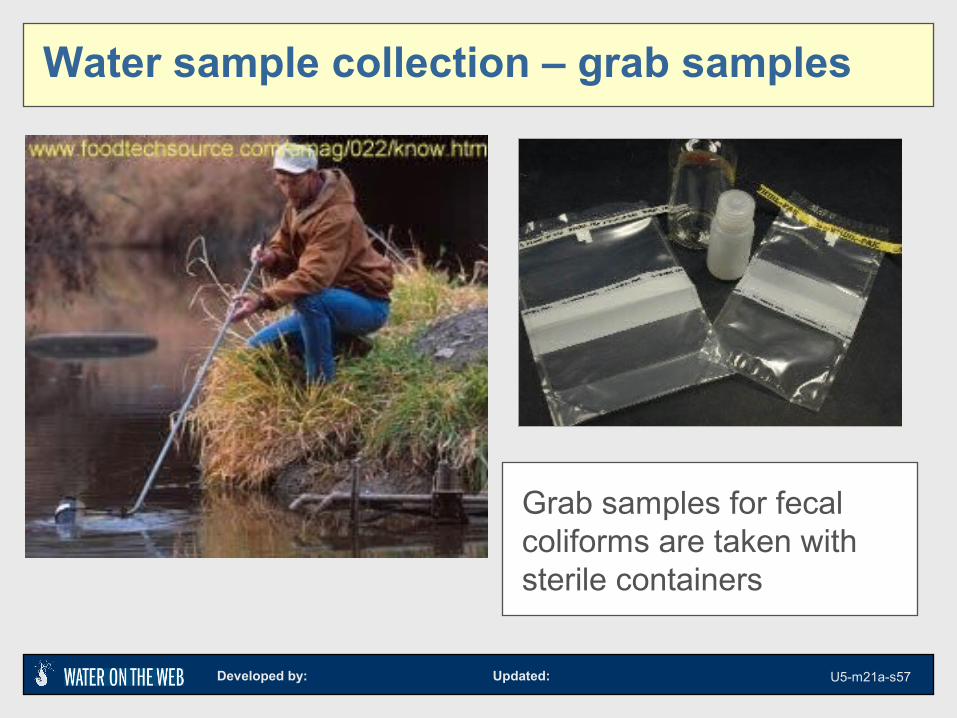
Water sample collection – grab samples
Grab samples for fecal coliforms are taken with sterile containers
Developed by: Updated: U5-m21a-s58
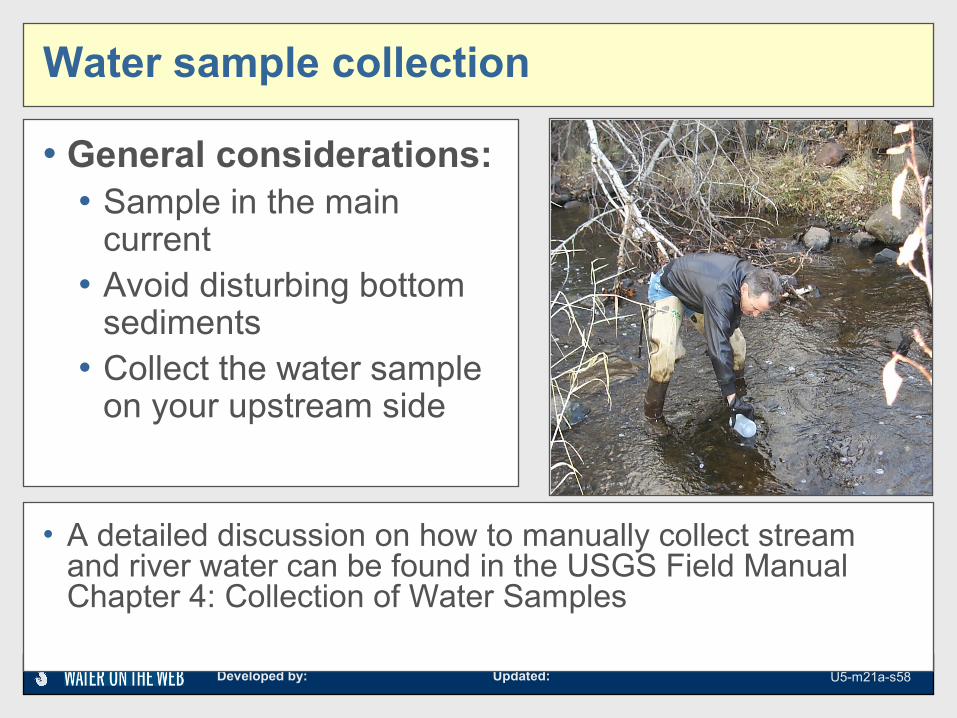
Water sample collection
• A detailed discussion on how to manually collect stream and river water can be found in the USGS Field Manual Chapter 4: Collection of Water Samples
• General considerations:• Sample in the main
current• Avoid disturbing bottom
sediments• Collect the water sample
on your upstream side
Developed by: Updated: U5-m21a-s59
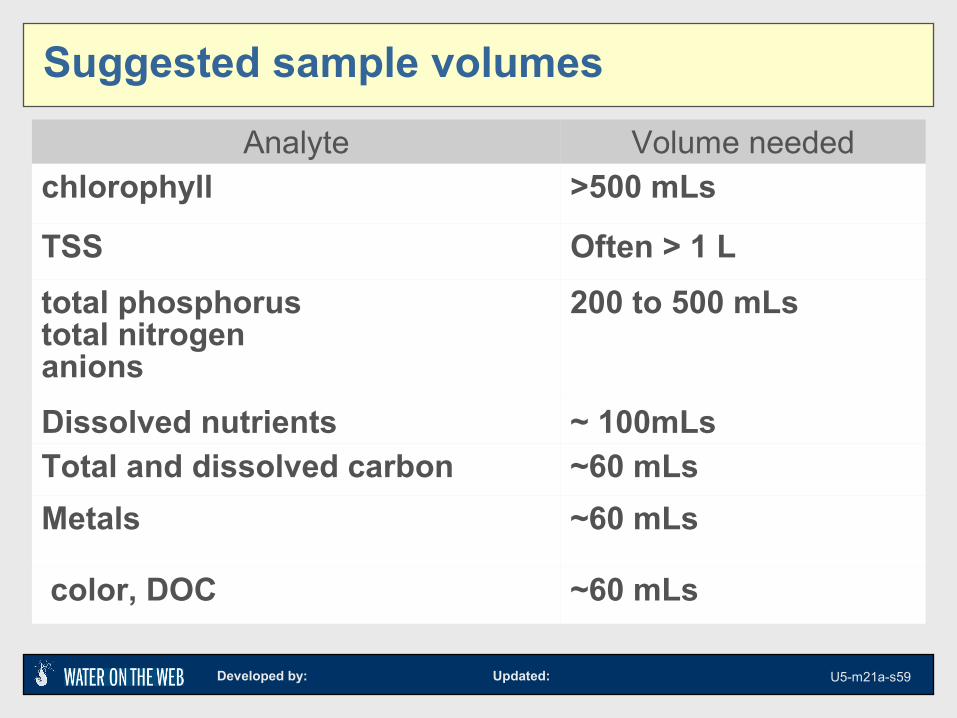
Analyte Volume neededchlorophyll >500 mLs
TSS Often > 1 L
total phosphorustotal nitrogenanions
200 to 500 mLs
Dissolved nutrients ~ 100mLsTotal and dissolved carbon ~60 mLs
Metals ~60 mLs
color, DOC ~60 mLs
Suggested sample volumes
Developed by: Updated: U5-m21a-s60
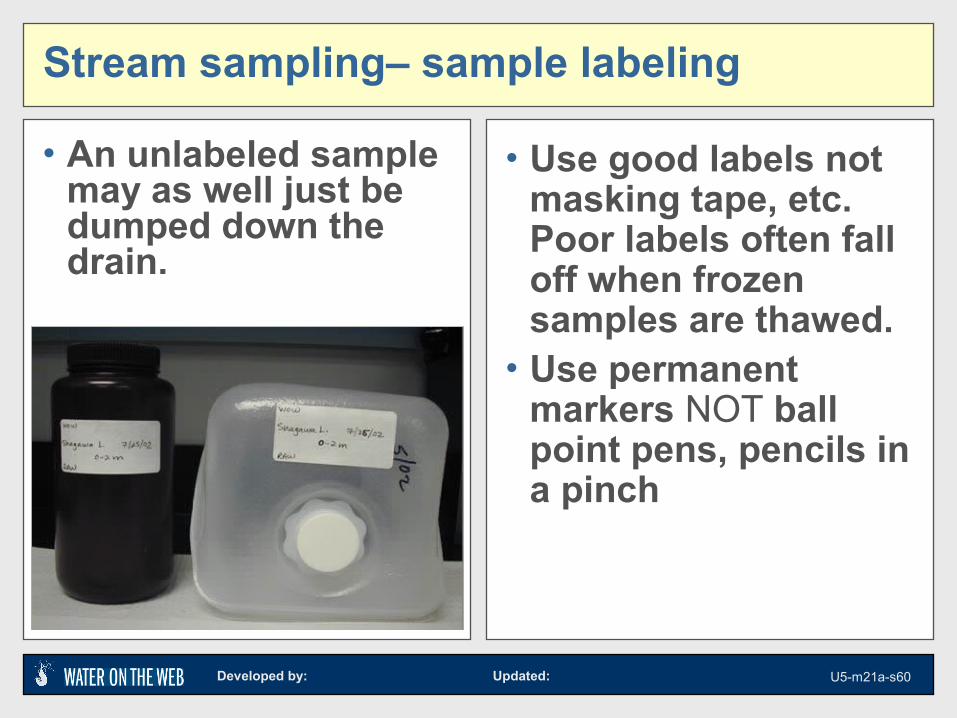
Stream sampling– sample labeling
• An unlabeled sample may as well just be dumped down the drain.
• Use good labels not masking tape, etc. Poor labels often fall off when frozen samples are thawed.
• Use permanent markers NOT ball point pens, pencils in a pinch
Developed by: Updated: U5-m21a-s61
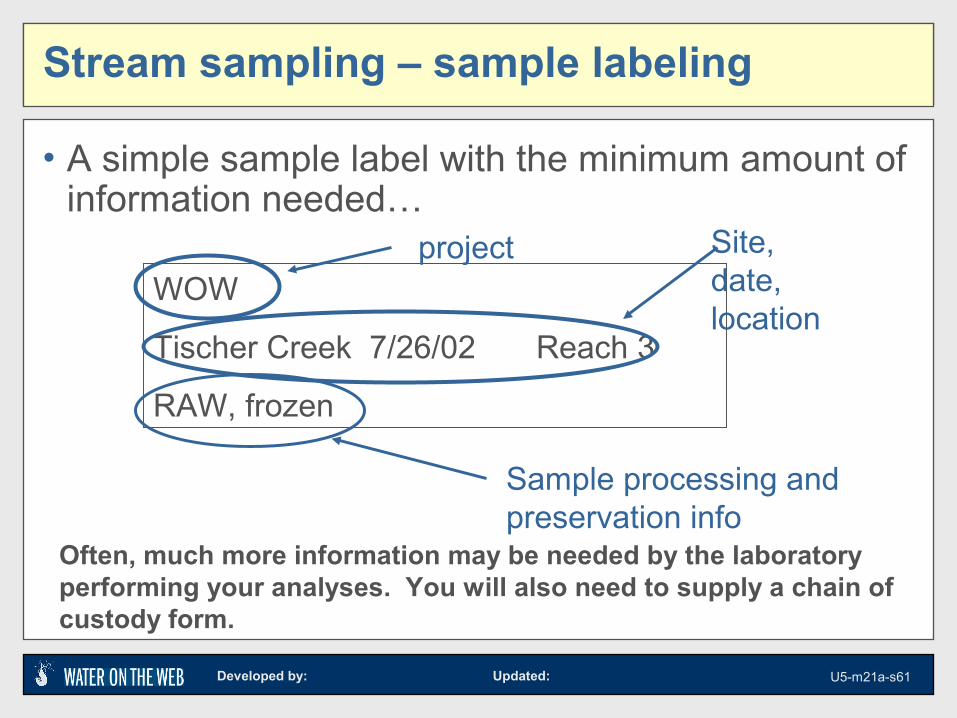
• A simple sample label with the minimum amount of information needed…
WOW
Tischer Creek 7/26/02 Reach 3
RAW, frozen
Lake sampling – sample labeling
Often, much more information may be needed by the laboratory performing your analyses. You will also need to supply a chain of custody form.
Stream sampling – sample labeling
project Site, date, location
Sample processing and preservation info
Developed by: Updated: U5-m21a-s62
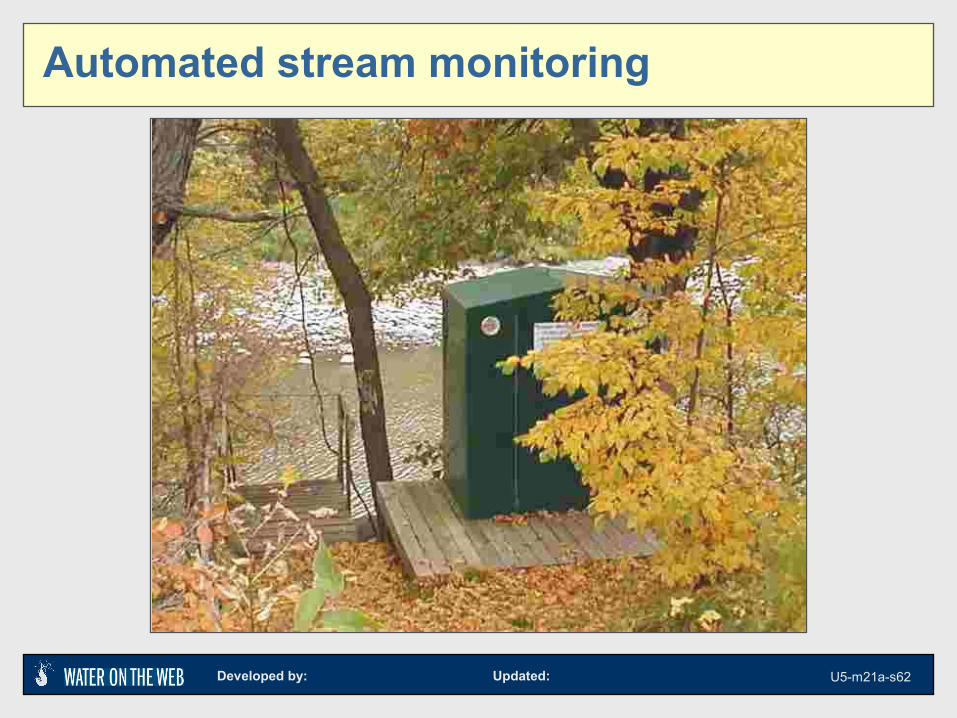
Automated stream monitoring
Developed by: Updated: U5-m21a-s63
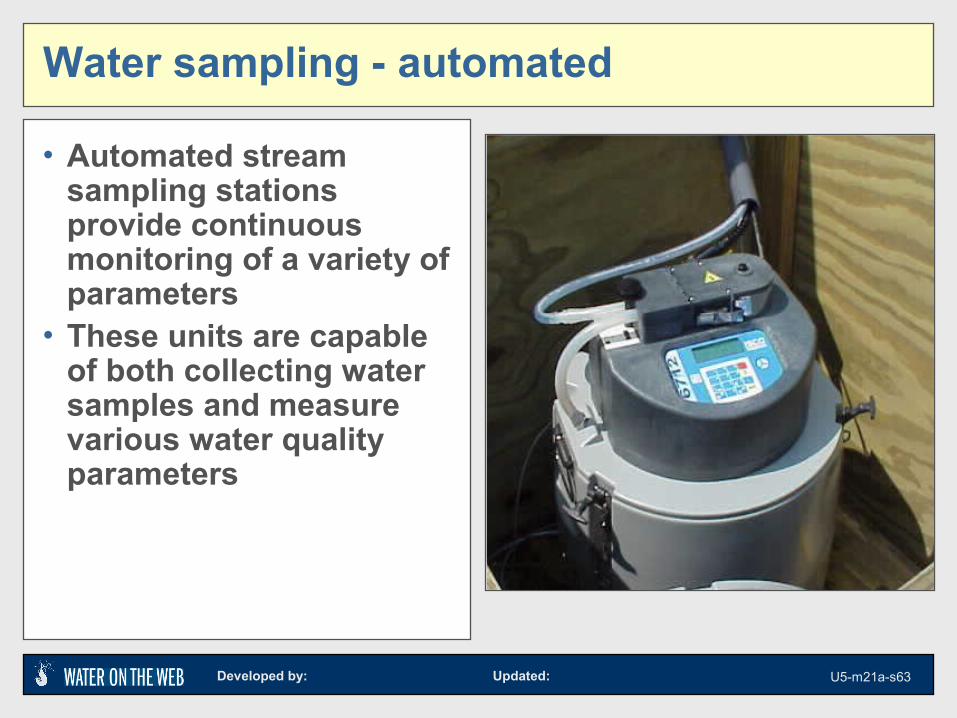
Water sampling - automated
• Automated stream sampling stations provide continuous monitoring of a variety of parameters
• These units are capable of both collecting water samples and measure various water quality parameters
Developed by: Updated: U5-m21a-s64
Automated stream samplers
• Flow weighted composites• Flow weighted discrete• Sampling triggered by predetermined set point
such as:• Flow• Precipitation• Any other parameter measured by in-stream
sensors
Developed by: Updated: U5-m21a-s65
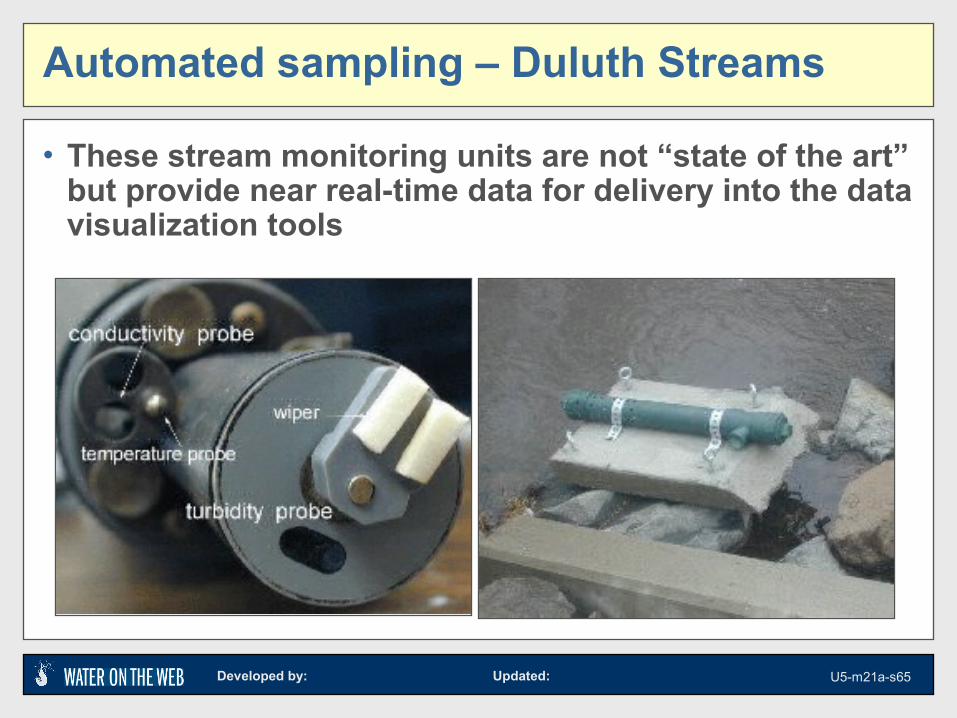
Automated sampling – Duluth Streams
• These stream monitoring units are not “state of the art” but provide near real-time data for delivery into the data visualization tools