Embed Size (px)
Citation preview
CAPITAL STRUCTURE ANALYSIS
OF INDIAN AUTOMOBILE
INDUSTRY
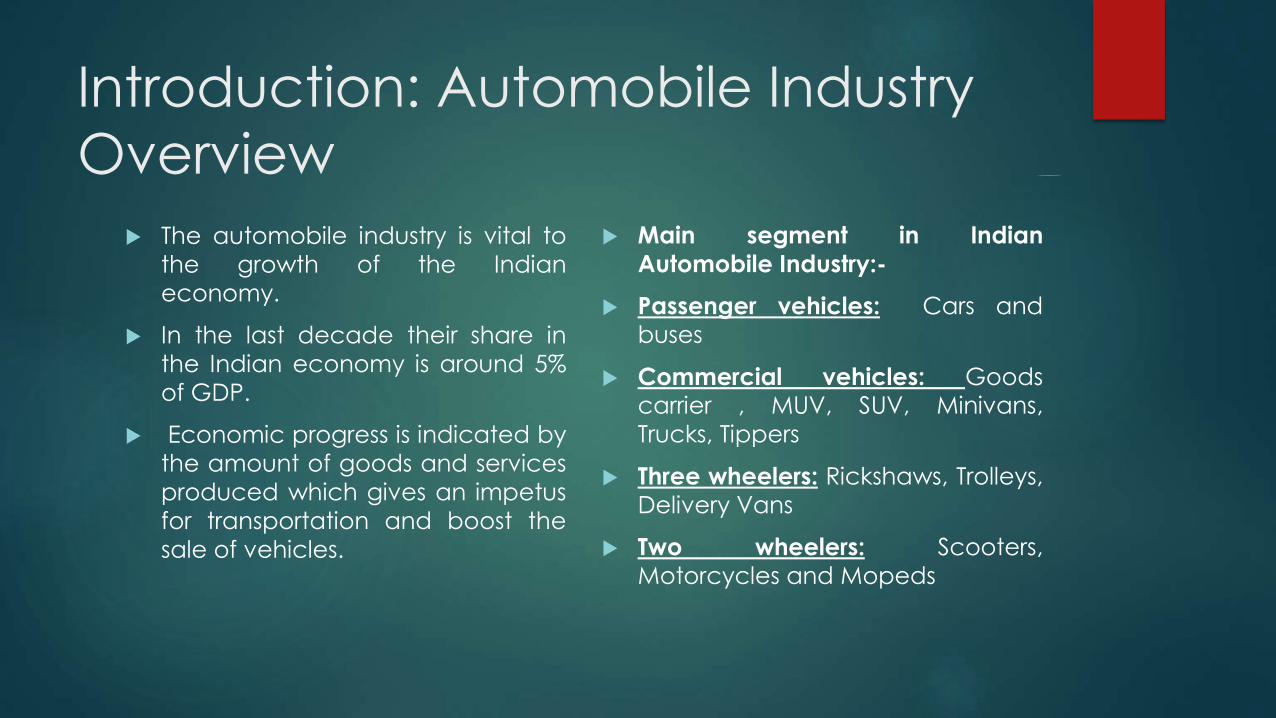
Introduction: Automobile Industry
Overview
The automobile industry is vital to
the growth of the Indian
economy.
In the last decade their share in
the Indian economy is around 5%
of GDP.
Economic progress is indicated by
the amount of goods and services
produced which gives an impetus
for transportation and boost the
sale of vehicles.
Main segment in Indian
Automobile Industry:-
Passenger vehicles: Cars and
buses
Commercial vehicles: Goodscarrier , MUV, SUV, Minivans,
Trucks, Tippers
Three wheelers: Rickshaws, Trolleys,
Delivery Vans
Two wheelers: Scooters,
Motorcycles and Mopeds
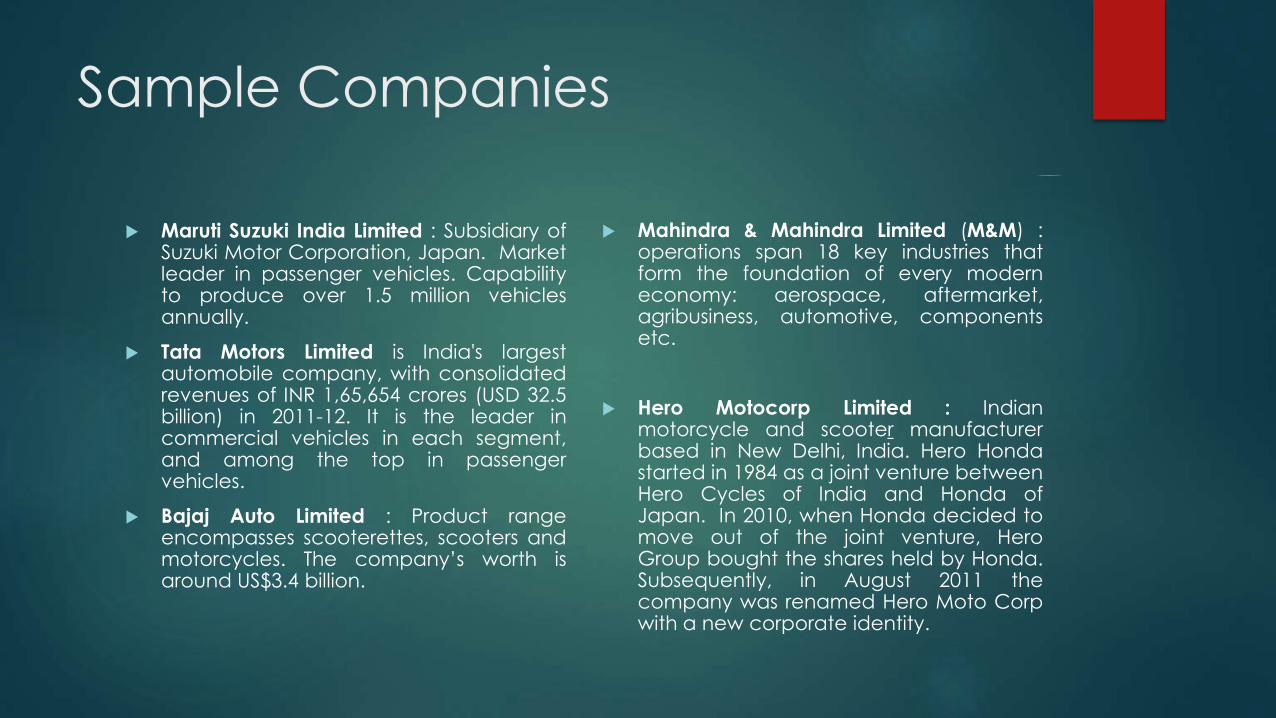
Sample Companies
Maruti Suzuki India Limited : Subsidiary ofSuzuki Motor Corporation, Japan. Marketleader in passenger vehicles. Capabilityto produce over 1.5 million vehiclesannually.
Tata Motors Limited is India's largestautomobile company, with consolidatedrevenues of INR 1,65,654 crores (USD 32.5billion) in 2011-12. It is the leader incommercial vehicles in each segment,and among the top in passengervehicles.
Bajaj Auto Limited : Product rangeencompasses scooterettes, scooters andmotorcycles. The company’s worth isaround US$3.4 billion.
Mahindra & Mahindra Limited (M&M) :operations span 18 key industries thatform the foundation of every moderneconomy: aerospace, aftermarket,agribusiness, automotive, componentsetc.
Hero Motocorp Limited : Indianmotorcycle and scooter manufacturerbased in New Delhi, India. Hero Hondastarted in 1984 as a joint venture betweenHero Cycles of India and Honda ofJapan. In 2010, when Honda decided tomove out of the joint venture, HeroGroup bought the shares held by Honda.Subsequently, in August 2011 thecompany was renamed Hero Moto Corpwith a new corporate identity.
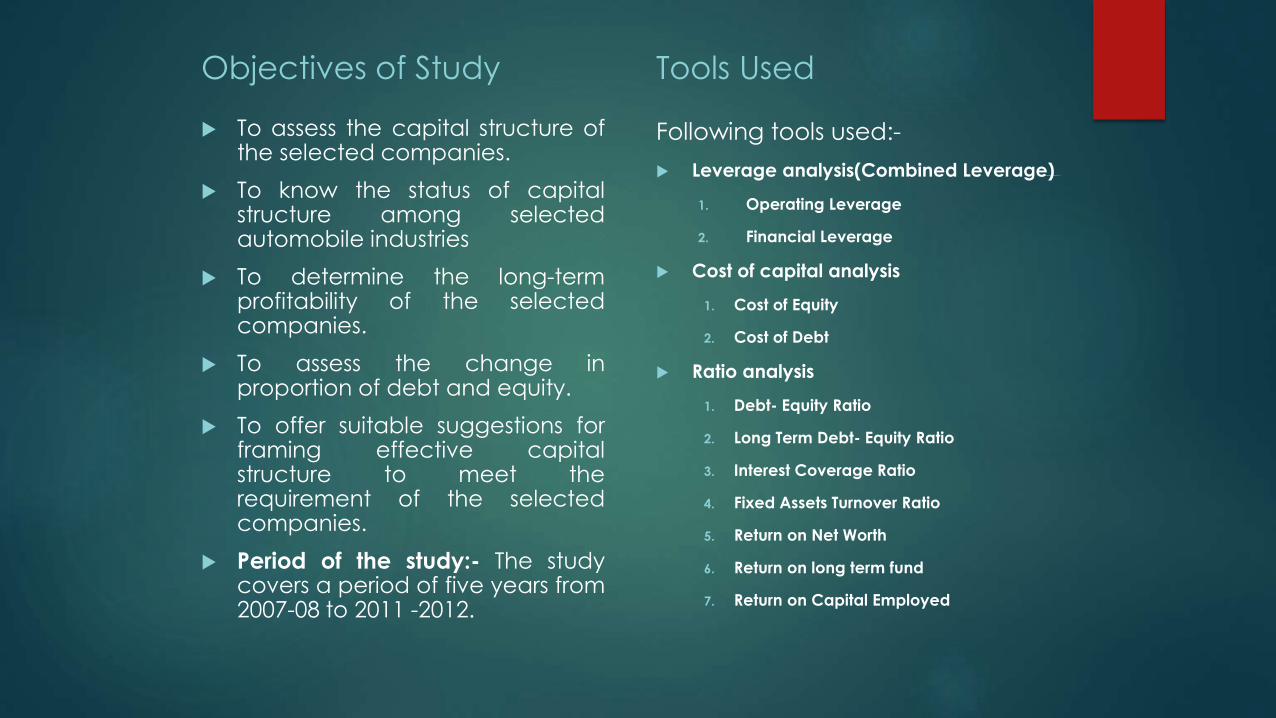
Objectives of Study
To assess the capital structure ofthe selected companies.
To know the status of capitalstructure among selectedautomobile industries
To determine the long-termprofitability of the selectedcompanies.
To assess the change inproportion of debt and equity.
To offer suitable suggestions forframing effective capitalstructure to meet therequirement of the selectedcompanies.
Period of the study:- The studycovers a period of five years from2007-08 to 2011 -2012.
Tools Used
Following tools used:-
Leverage analysis(Combined Leverage)
1. Operating Leverage
2. Financial Leverage
Cost of capital analysis
1. Cost of Equity
2. Cost of Debt
Ratio analysis
1. Debt- Equity Ratio
2. Long Term Debt- Equity Ratio
3. Interest Coverage Ratio
4. Fixed Assets Turnover Ratio
5. Return on Net Worth
6. Return on long term fund
7. Return on Capital Employed
Leverage Analysis
Operating Leverage
Year
Company
Name
2007-
08
2008-
09
2009-
10
2010-
11
2011-
12
Mean
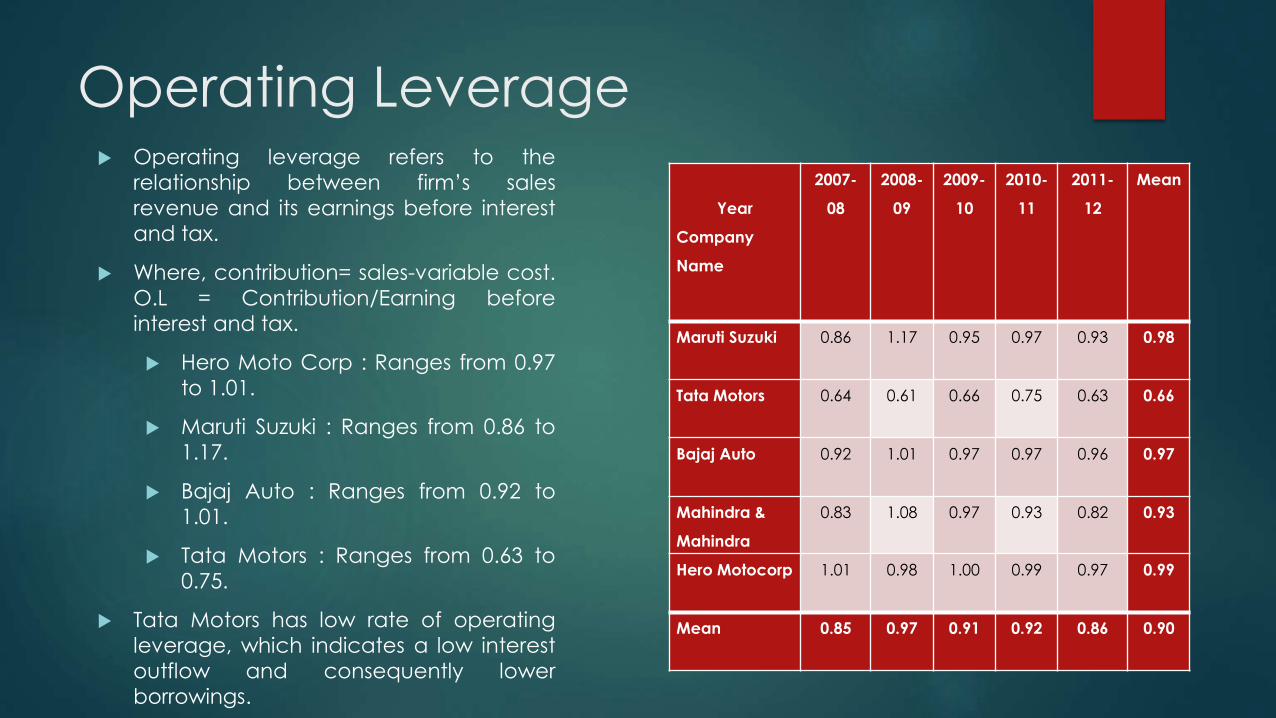
Maruti Suzuki 0.86 1.17 0.95 0.97 0.93 0.98
Tata Motors 0.64 0.61 0.66 0.75 0.63 0.66
Bajaj Auto 0.92 1.01 0.97 0.97 0.96 0.97
Mahindra &
Mahindra
0.83 1.08 0.97 0.93 0.82 0.93
Hero Motocorp 1.01 0.98 1.00 0.99 0.97 0.99
Mean 0.85 0.97 0.91 0.92 0.86 0.90
Operating leverage refers to the
relationship between firm’s sales
revenue and its earnings before interest
and tax.
Where, contribution= sales-variable cost.
O.L = Contribution/Earning before
interest and tax.
Hero Moto Corp : Ranges from 0.97
to 1.01.
Maruti Suzuki : Ranges from 0.86 to
1.17.
Bajaj Auto : Ranges from 0.92 to
1.01.
Tata Motors : Ranges from 0.63 to
0.75.
Tata Motors has low rate of operating
leverage, which indicates a low interest
outflow and consequently lower
borrowings.
Financial Leverage:
Year
Company
Name
2007-08 2008-
09
2009-
10
2010-
11
2011-12 Mean
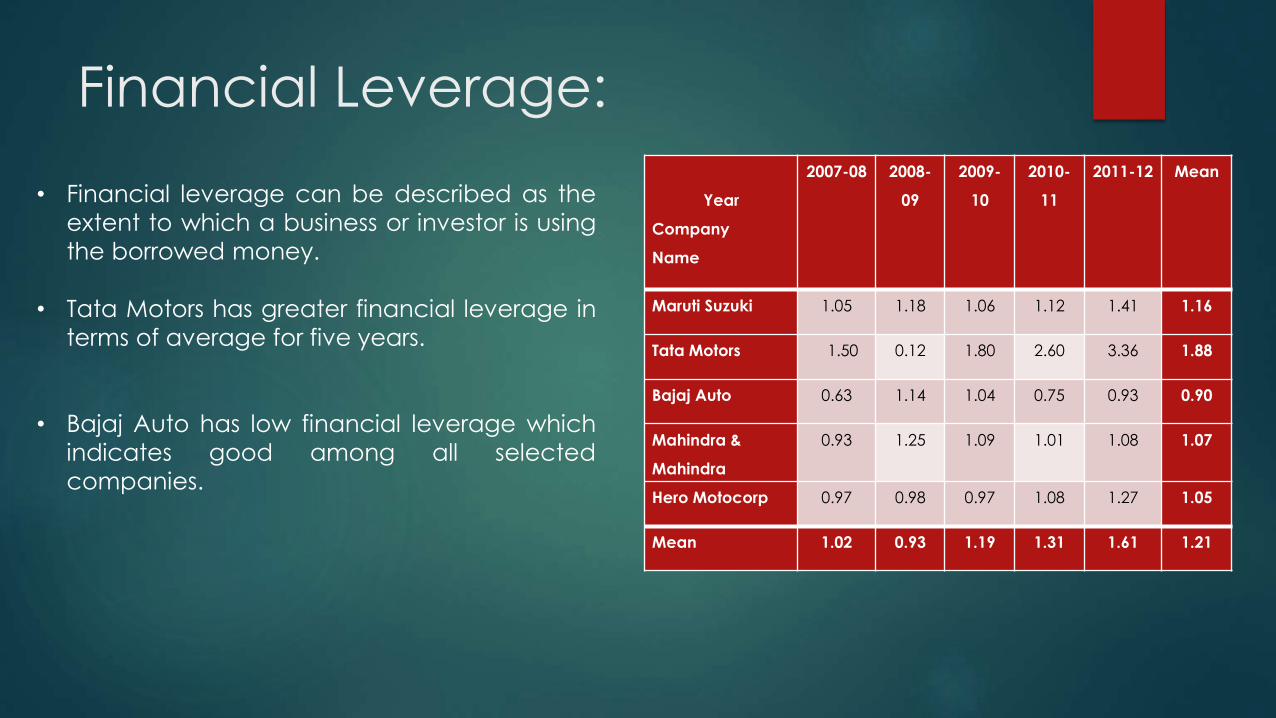
Maruti Suzuki 1.05 1.18 1.06 1.12 1.41 1.16
Tata Motors 1.50 0.12 1.80 2.60 3.36 1.88
Bajaj Auto 0.63 1.14 1.04 0.75 0.93 0.90
Mahindra &
Mahindra
0.93 1.25 1.09 1.01 1.08 1.07
Hero Motocorp 0.97 0.98 0.97 1.08 1.27 1.05
Mean 1.02 0.93 1.19 1.31 1.61 1.21
• Financial leverage can be described as the
extent to which a business or investor is using
the borrowed money.
• Tata Motors has greater financial leverage in
terms of average for five years.
• Bajaj Auto has low financial leverage which
indicates good among all selected
companies.
Cost of capital
analysis
Cost of EquityYear
Company
Name
2007-08 2008-09 2009-10 2010-11 2011-12 Mean
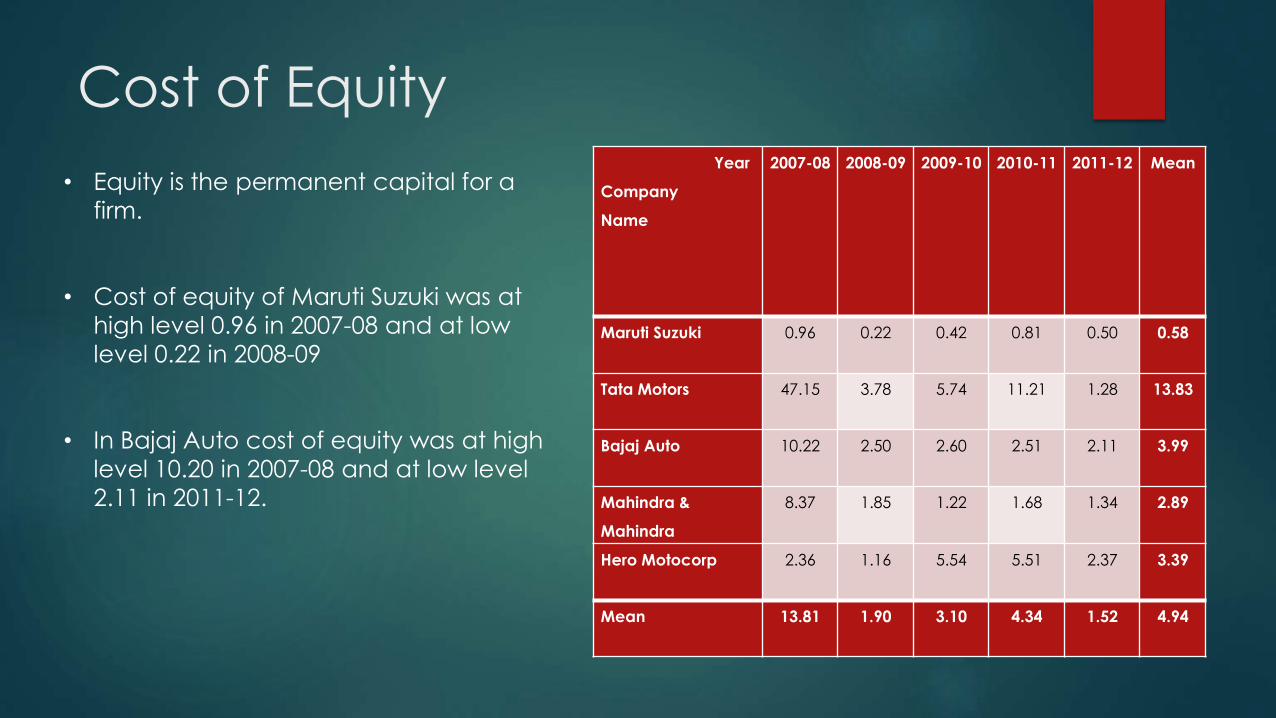
Maruti Suzuki 0.96 0.22 0.42 0.81 0.50 0.58
Tata Motors 47.15 3.78 5.74 11.21 1.28 13.83
Bajaj Auto 10.22 2.50 2.60 2.51 2.11 3.99
Mahindra &
Mahindra
8.37 1.85 1.22 1.68 1.34 2.89
Hero Motocorp 2.36 1.16 5.54 5.51 2.37 3.39
Mean 13.81 1.90 3.10 4.34 1.52 4.94
• Equity is the permanent capital for a
firm.
• Cost of equity of Maruti Suzuki was at
high level 0.96 in 2007-08 and at low
level 0.22 in 2008-09
• In Bajaj Auto cost of equity was at high
level 10.20 in 2007-08 and at low level
2.11 in 2011-12.
Cost of Debt
Year
Company
Name
2007-
08
2008-
09
2009-
10
2010-
11
2011-
12
Mean
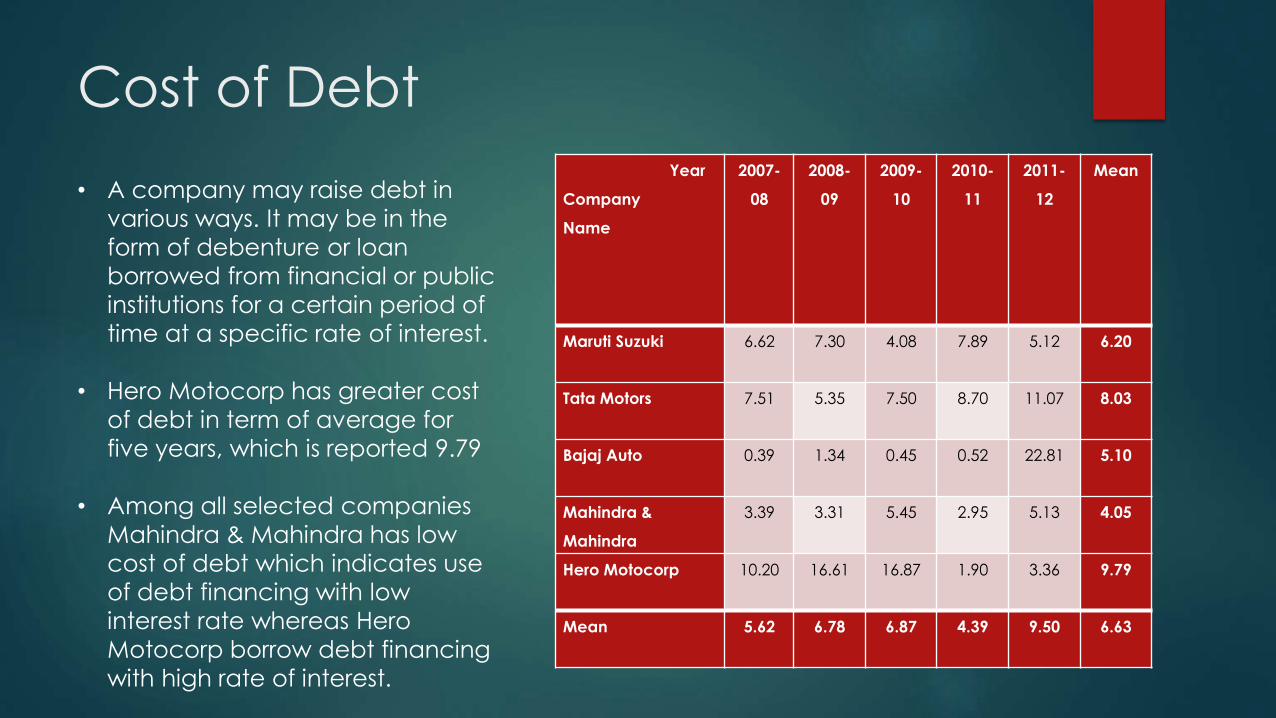
Maruti Suzuki 6.62 7.30 4.08 7.89 5.12 6.20
Tata Motors 7.51 5.35 7.50 8.70 11.07 8.03
Bajaj Auto 0.39 1.34 0.45 0.52 22.81 5.10
Mahindra &
Mahindra
3.39 3.31 5.45 2.95 5.13 4.05
Hero Motocorp 10.20 16.61 16.87 1.90 3.36 9.79
Mean 5.62 6.78 6.87 4.39 9.50 6.63
• A company may raise debt in
various ways. It may be in the
form of debenture or loan
borrowed from financial or public
institutions for a certain period of
time at a specific rate of interest.
• Hero Motocorp has greater cost
of debt in term of average for
five years, which is reported 9.79
• Among all selected companies
Mahindra & Mahindra has low
cost of debt which indicates use
of debt financing with low
interest rate whereas Hero
Motocorp borrow debt financing
with high rate of interest.
Ratio analysis
Debt Equity Ratio
Years
Company
Name
2007-
08
2008-
09
2009-
10
2010-
11
2011-
12
Mean
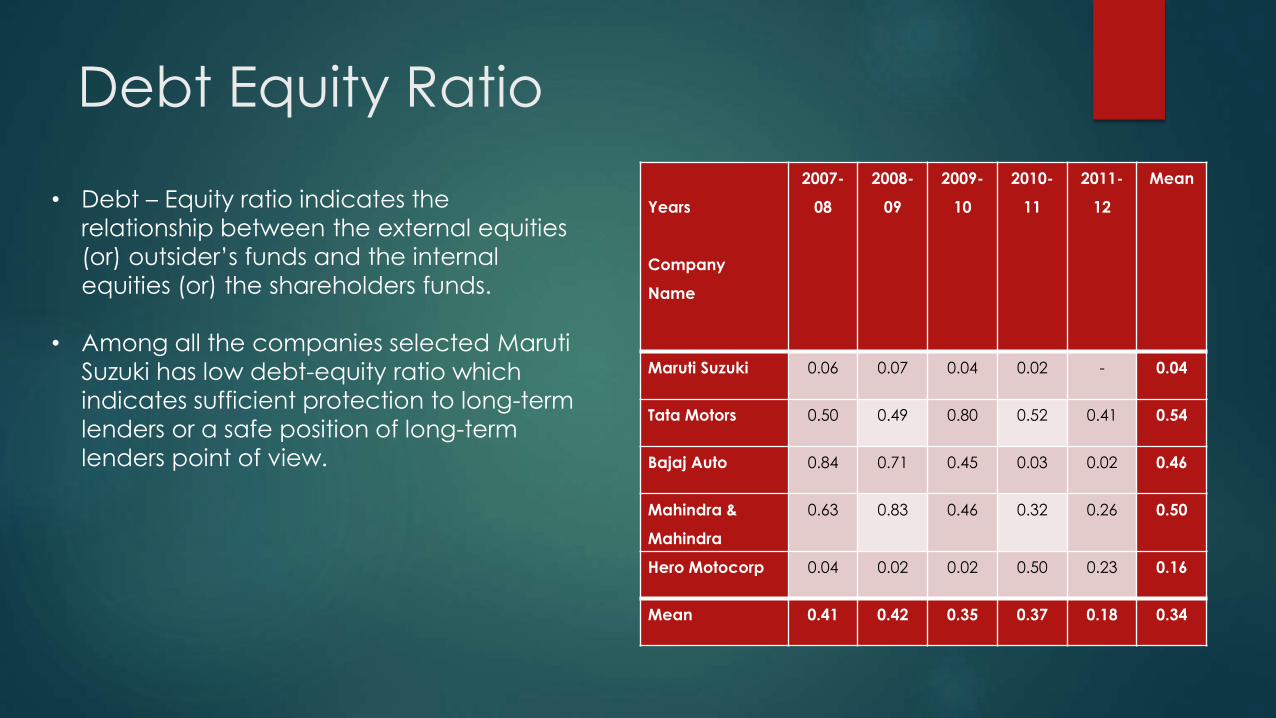
Maruti Suzuki 0.06 0.07 0.04 0.02 - 0.04
Tata Motors 0.50 0.49 0.80 0.52 0.41 0.54
Bajaj Auto 0.84 0.71 0.45 0.03 0.02 0.46
Mahindra &
Mahindra
0.63 0.83 0.46 0.32 0.26 0.50
Hero Motocorp 0.04 0.02 0.02 0.50 0.23 0.16
Mean 0.41 0.42 0.35 0.37 0.18 0.34
• Debt – Equity ratio indicates the
relationship between the external equities
(or) outsider’s funds and the internal
equities (or) the shareholders funds.
• Among all the companies selected Maruti
Suzuki has low debt-equity ratio which
indicates sufficient protection to long-term
lenders or a safe position of long-term
lenders point of view.
Long – Term Debt Equity Ratio
Years
Company
Name
2007-
08
2008-
09
2009-
10
2010-
11
2011-
12
Mean
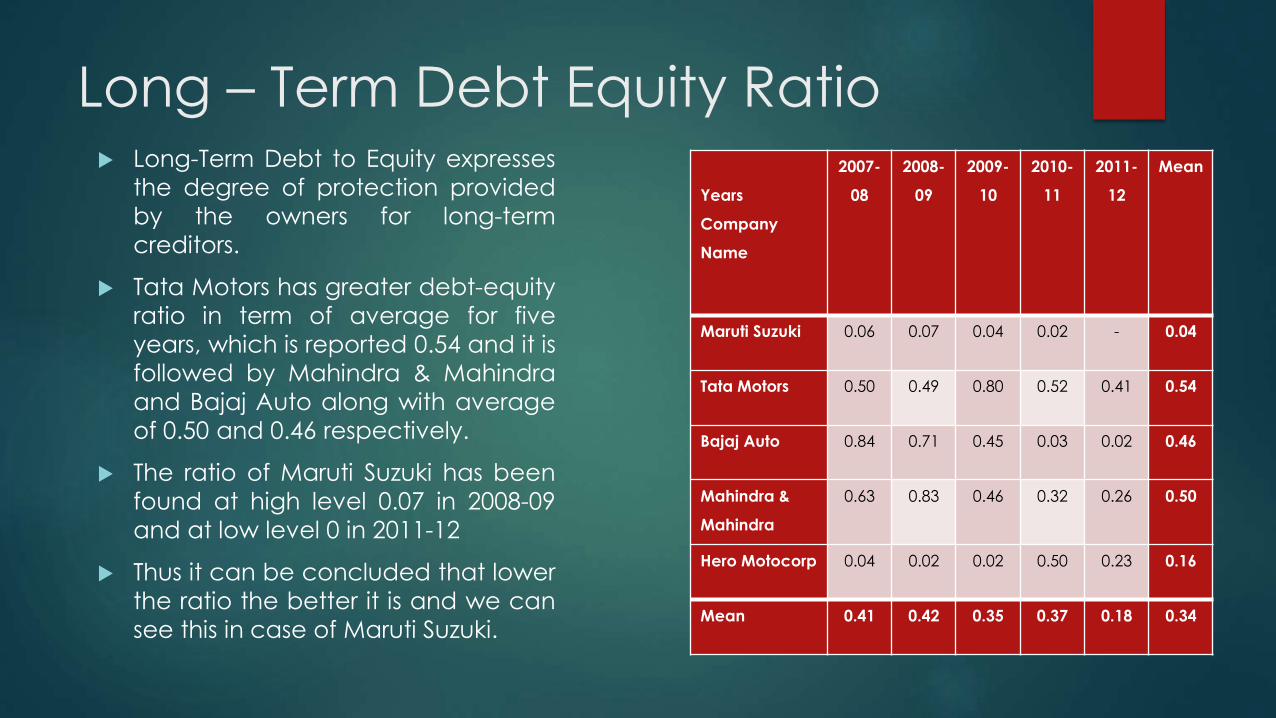
Maruti Suzuki 0.06 0.07 0.04 0.02 - 0.04
Tata Motors 0.50 0.49 0.80 0.52 0.41 0.54
Bajaj Auto 0.84 0.71 0.45 0.03 0.02 0.46
Mahindra &
Mahindra
0.63 0.83 0.46 0.32 0.26 0.50
Hero Motocorp 0.04 0.02 0.02 0.50 0.23 0.16
Mean 0.41 0.42 0.35 0.37 0.18 0.34
Long-Term Debt to Equity expresses
the degree of protection provided
by the owners for long-term
creditors.
Tata Motors has greater debt-equity
ratio in term of average for five
years, which is reported 0.54 and it is
followed by Mahindra & Mahindra
and Bajaj Auto along with average
of 0.50 and 0.46 respectively.
The ratio of Maruti Suzuki has been
found at high level 0.07 in 2008-09
and at low level 0 in 2011-12
Thus it can be concluded that lower
the ratio the better it is and we can
see this in case of Maruti Suzuki.
Interest Coverage Ratio
Years
Company
Name
2007-
08
2008-
09
2009-
10
2010-
11
2011-
12
Mea
n
Maruti Suzuki 40.93 34.21 105.3
9
126.0
4
39.85 69.28
Tata Motors 6.28 2.43 2.61 2.64 3.70 3.53
Bajaj Auto 224.9
1
53.71 421.0
6
2093.
39
177.3
3
594.0
8
Mahindra &
Mahindra
14.64 9.69 18.90 48.36 23.02 23
Hero Motocorp 648.1
5
664.4
0
1262.
36
146.7
3
123.6
5
569.0
6
Mean 187 153 362 483.4
3
73.51 251.8
0
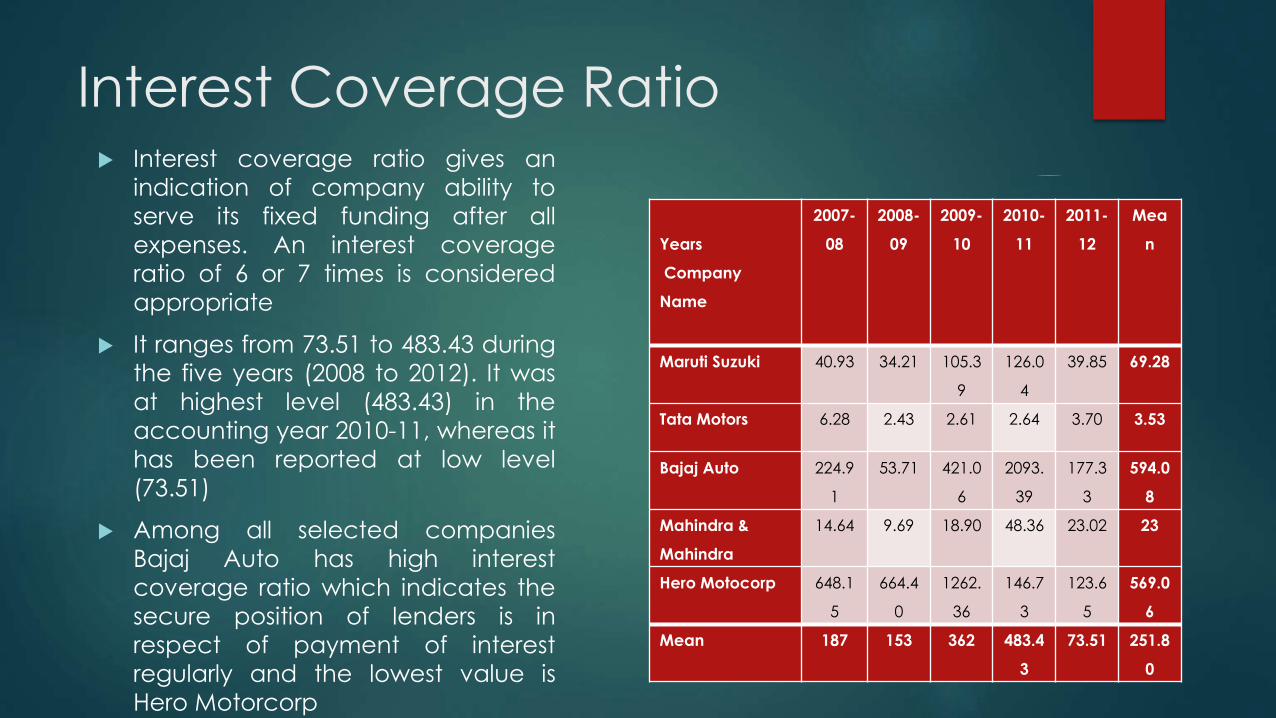
Interest coverage ratio gives an
indication of company ability to
serve its fixed funding after all
expenses. An interest coverage
ratio of 6 or 7 times is considered
appropriate
It ranges from 73.51 to 483.43 during
the five years (2008 to 2012). It was
at highest level (483.43) in the
accounting year 2010-11, whereas it
has been reported at low level
(73.51)
Among all selected companies
Bajaj Auto has high interest
coverage ratio which indicates the
secure position of lenders is in
respect of payment of interest
regularly and the lowest value is
Hero Motorcorp
Fixed Asset Turnover Ratio
Year
Company
Name
2007-
08
2008-
09
2009
-10
2010
-11
2011-
12
Mea
n
Maruti Suzuki 2.48 2.38 2.82 3.13 2.46 2.65
Tata Motors 2.69 1.29 1.24 1.42 1.64 1.66
Bajaj Auto 2.95 2.60 3.50 4.85 5.75 3.93
Mahindra &
Mahindra
3.22 2.84 3.85 4.08 4.32 3.66
Hero Motocorp 5.89 5.34 6.29 3.70 4.05 5.54
Mean 3.45 2.89 3.54 3.44 3.64 3.40
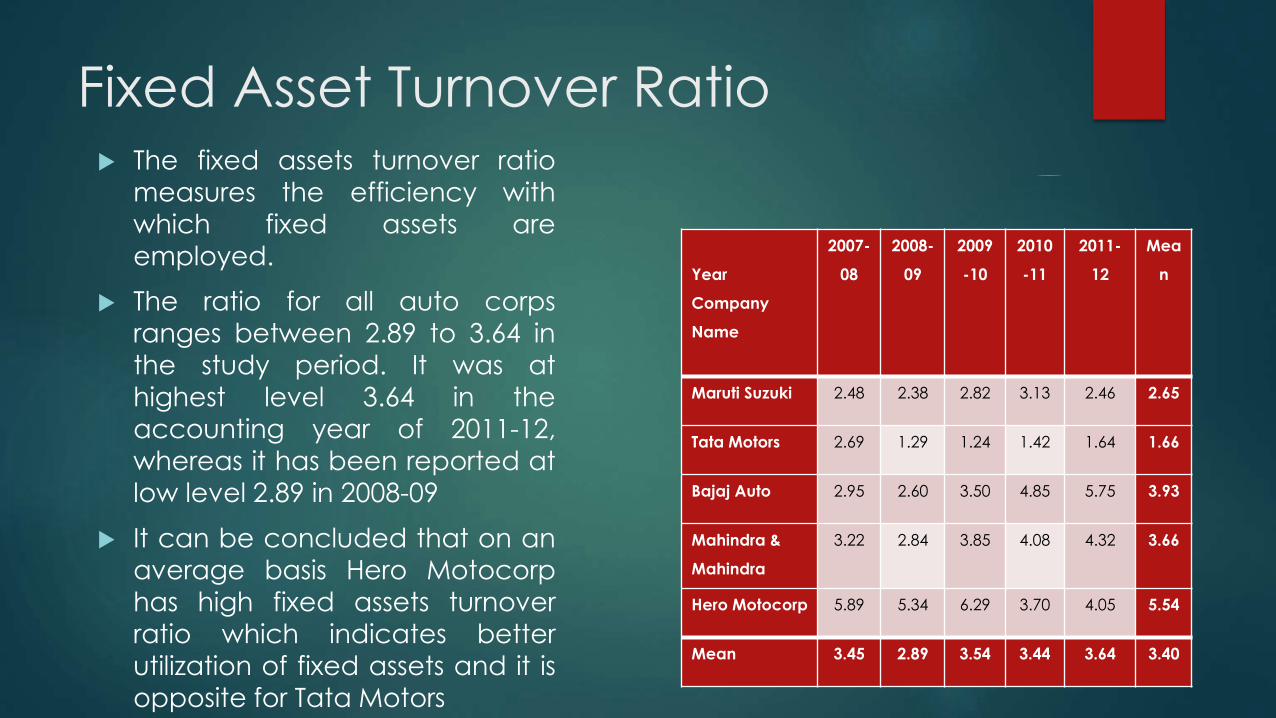
The fixed assets turnover ratio
measures the efficiency with
which fixed assets are
employed.
The ratio for all auto corps
ranges between 2.89 to 3.64 in
the study period. It was at
highest level 3.64 in the
accounting year of 2011-12,whereas it has been reported at
low level 2.89 in 2008-09
It can be concluded that on an
average basis Hero Motocorphas high fixed assets turnover
ratio which indicates better
utilization of fixed assets and it is
opposite for Tata Motors
Return on Net Worth
Year
Company
Name
2007-
08
2008-
09
2009-
10
2010-
11
2011-
12
Me
an
Maruti Suzuki 20.56 13.04 21.10 16.50 10.76 16.3
9
Tata Motors 25.98 8.09 15.15 9.06 6.42 12.9
4
Bajaj Auto 47.61 38.92 58.14 68.01 49.72 52.4
8
Mahindra &
Mahindra
25.51 16.03 26.74 25.92 23.80 23.6
0
Hero Motocorp 32.41 33.72 64.41 65.21 55.43 50.2
4
Mean 30.41 21.96 37.11 36.94 29.23 31.1
3
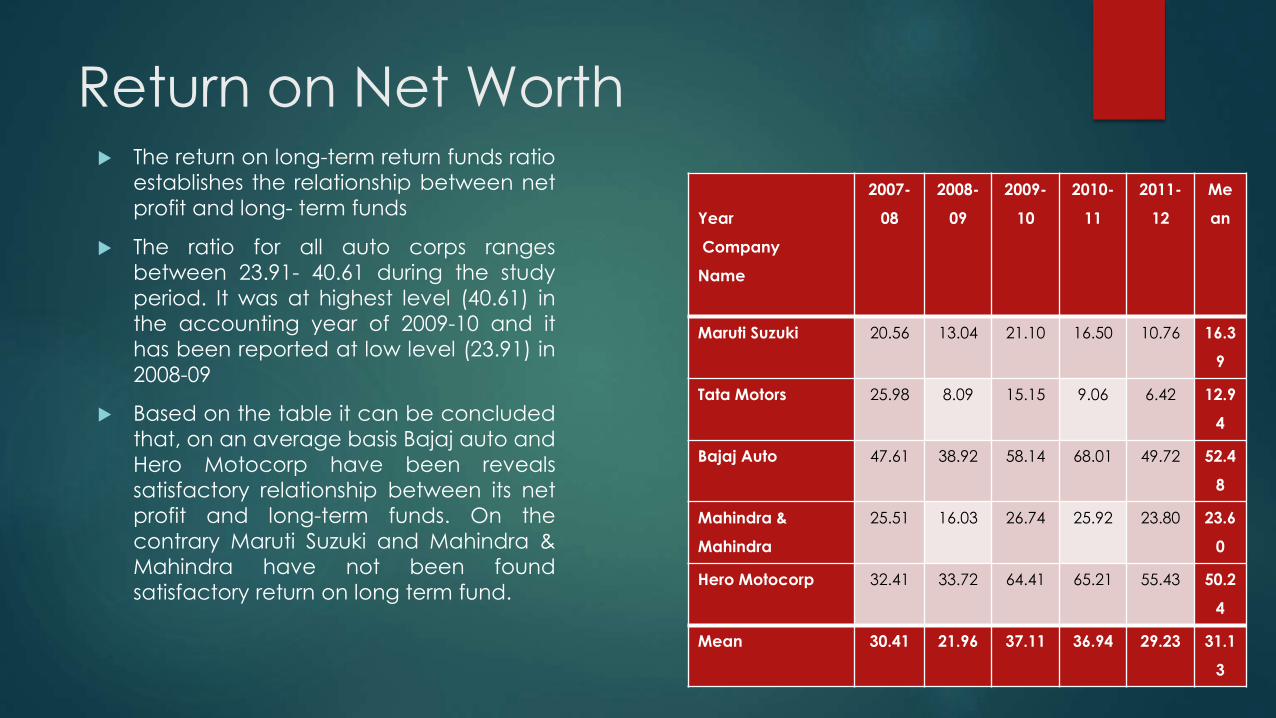
The return on long-term return funds ratio
establishes the relationship between net
profit and long- term funds
The ratio for all auto corps ranges
between 23.91- 40.61 during the study
period. It was at highest level (40.61) in
the accounting year of 2009-10 and it
has been reported at low level (23.91) in
2008-09
Based on the table it can be concluded
that, on an average basis Bajaj auto and
Hero Motocorp have been reveals
satisfactory relationship between its net
profit and long-term funds. On the
contrary Maruti Suzuki and Mahindra &
Mahindra have not been found
satisfactory return on long term fund.
RETURN ON LONG TERM FUND
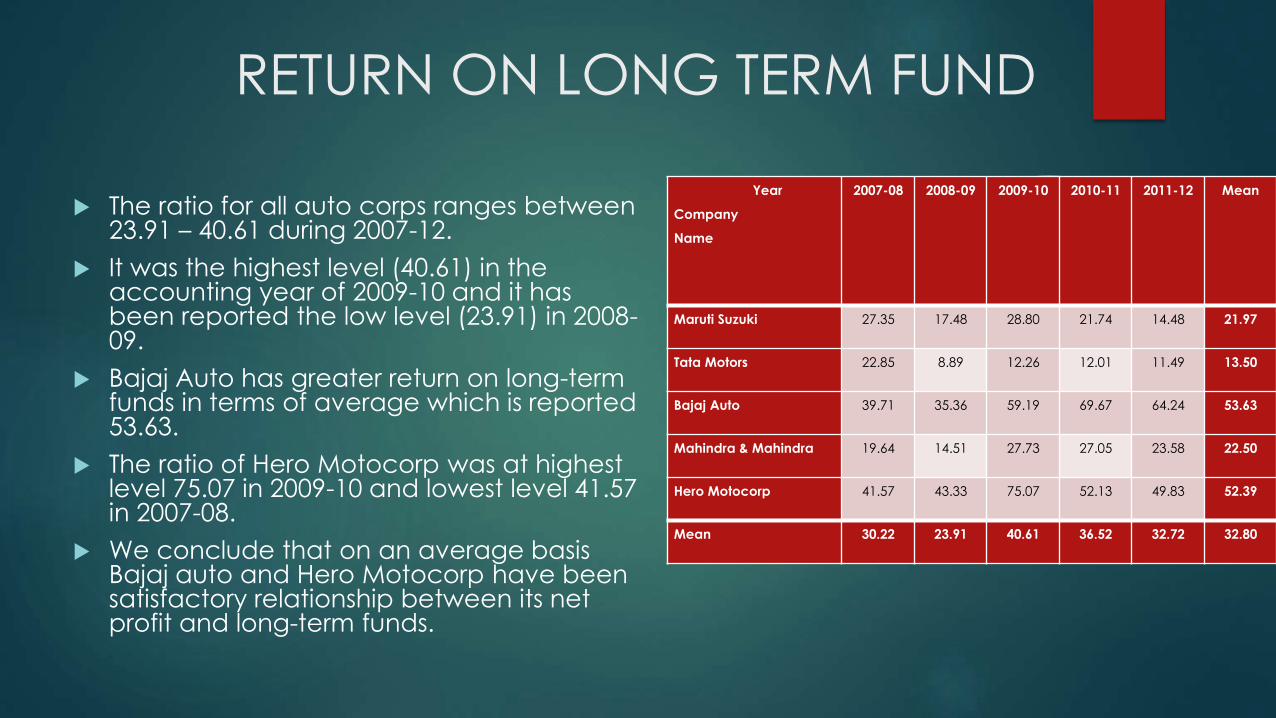
The ratio for all auto corps ranges between 23.91 – 40.61 during 2007-12.
It was the highest level (40.61) in the accounting year of 2009-10 and it has been reported the low level (23.91) in 2008-09.
Bajaj Auto has greater return on long-term funds in terms of average which is reported 53.63.
The ratio of Hero Motocorp was at highest level 75.07 in 2009-10 and lowest level 41.57 in 2007-08.
We conclude that on an average basis Bajaj auto and Hero Motocorp have been satisfactory relationship between its net profit and long-term funds.
Year
Company
Name
2007-08 2008-09 2009-10 2010-11 2011-12 Mean
Maruti Suzuki 27.35 17.48 28.80 21.74 14.48 21.97
Tata Motors 22.85 8.89 12.26 12.01 11.49 13.50
Bajaj Auto 39.71 35.36 59.19 69.67 64.24 53.63
Mahindra & Mahindra 19.64 14.51 27.73 27.05 23.58 22.50
Hero Motocorp 41.57 43.33 75.07 52.13 49.83 52.39
Mean 30.22 23.91 40.61 36.52 32.72 32.80
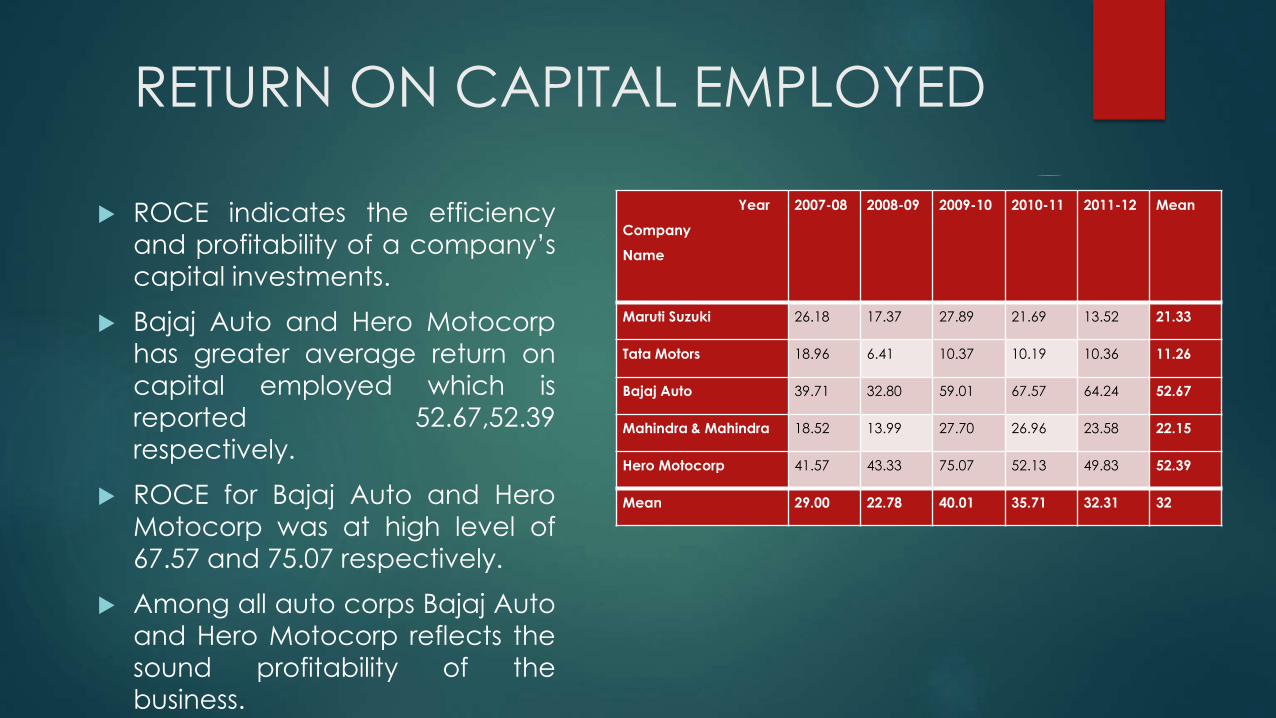
RETURN ON CAPITAL EMPLOYED
ROCE indicates the efficiency
and profitability of a company’s
capital investments.
Bajaj Auto and Hero Motocorp
has greater average return on
capital employed which is
reported 52.67,52.39respectively.
ROCE for Bajaj Auto and Hero
Motocorp was at high level of
67.57 and 75.07 respectively.
Among all auto corps Bajaj Auto
and Hero Motocorp reflects the
sound profitability of the
business.
Year
Company
Name
2007-08 2008-09 2009-10 2010-11 2011-12 Mean
Maruti Suzuki 26.18 17.37 27.89 21.69 13.52 21.33
Tata Motors 18.96 6.41 10.37 10.19 10.36 11.26
Bajaj Auto 39.71 32.80 59.01 67.57 64.24 52.67
Mahindra & Mahindra 18.52 13.99 27.70 26.96 23.58 22.15
Hero Motocorp 41.57 43.33 75.07 52.13 49.83 52.39
Mean 29.00 22.78 40.01 35.71 32.31 32
SUGGESTION
Tata Motors total risk was high , so it should increase its equity to
reduce the risk.
All the selected companies should try to maintain their debt-equityproportion at the same level.
Bajaj Auto must give special attention to increase the earnings per
share to safeguard and improve the welfare of its shareholders.
Tata Motors and Maruti Suzuki should try to reduce their operating
expenses and financial burden to convert revenue into actual profit.
CONCLUSION
Tata Motors has low rate of operating leverage, indicates a low interest outflowand lower borrowings.
Mahindra & Mahindra has low cost of debt which indicates use of debt financingwith low interest whereas it is high in case of Hero Motocorp.
Low debt-equity ratio made out in case of Maruti Suzuki and high debt-equityratio exercised by Tata Motors.
Bajaj Auto has high interest coverage ratio which indicates the secure position inrespect of payment of interest regularly.
Hero Motocorp has high fixed assets turnover ratio which indicates betterutilization of fixed assets.
Comparing overall performance of the five companies selected it is HeroMotocorp which has displayed a steady and constant performance over thepast five years.

THANK YOU