Embed Size (px)
Citation preview

Rev. Integr. Bus. Econ. Res. Vol 2(1) 155
Copyright 2013 Society of Interdisciplinary Business Research (www.sibresearch.org)
Optimal Capital Structure Analysis: A Study from Indonesia Telecommunication Companies Listed in Indonesia Stock ExchangePeriod 2009-2011 Debby Nurhikmah Institut Teknologi Bandung [email protected]
ABSTRACT Telecommunication is an important sector that support the economic growth in Indonesia. Growth from this sector and transportation sector is the highest compared to other sectors in first quartal of 2012. The economic growth in Indonesia gives telecommunication companies great opportunity to expand their business. To support their business activities, those companies need more capital and determining the right proportion of capital is important in order to reach the optimal value of the firm. Researcher uses cost of capital approach to define the optimal capital which for cost of equity uses capital asset pricing model, while cost of debt calculation uses synthetic rating approach. The results show that optimal capital structure for the companies in telecommunication sectors is 9%. The analyze has been made about factors that influence optimal capital structure. Keywords: Telecommunication Companies, Cost of Capital, Optimal Capital Structure
1. INTRODUCTION Most firm attempt to maintain a desired optimal mix of debt and equity financing to maximize its value. The main goal of financial management is to maximize the stockholders’ wealth and the minimizing cost of capital is one of the way to reach this goal. The proportion of the debt and equity are used to finance the assets in the company in order to support business activities. Moreover, because of its interrelationship with other financial decision variable, poor capital structure decision can result in a high cost of capital and then lowering the company’s value. Telecommunications is one sector that supports economic growth in Indonesia. Based on data from Badan Pusat Statistik (BPS), the growth of telecommunication sector in the first quartal of 2012 compared with the same quartal of 2011 reached up to 10, 3% together with the transport sector. This growth is the highest compared with other sectors. Gross domestic product (GDP) of the telecommunications sector also continued to increase throughout the year 2011. Listed telecommunication companies

Rev. Integr. Bus. Econ. Res. Vol 2(1) 156
Copyright 2013 Society of Interdisciplinary Business Research (www.sibresearch.org)
also have good performance in the capital market. According to Fact Book of Indonesia Stock Exchange (IDX) the market capitalization from this sector is 7.8% from the total, which is 253,845 billion rupiah. Similar with other developing country, in Indonesia, the improvement and modernization of telecommunication infrastructure become an important. Besides, the large population and the positive economic growth in this country have led to high demand in telecommunication services. Telecommunication companies posses great opportunities to grow its business. In expanding its business, those companies need more capital in order to do more innovation for their services. Therefore, it is important for the telecommunication companies determine the right proportion of their source of fund in order to reach the optimal capital structure. This paper summarizes the optimal capital structure for telecommunication companies listed in Indonesia Stock Exchange in three years, 2009-2011. There are five telecommunication companies that are listed in Indonesia Stock Exchange; they are Bakrie Telecom, XL Axiata, Indosat, Inovisi Telecom, Telekomunikasi Indonesia, and Smartfren Telecom. 2. THEORITICAL FOUNDATION 2.1 Optimal Capital Structure Capital structure is strategy of company in deciding the proportion of each element of capital sources to maintain its financial performance related to fund of capital expenditure and to support of business activities. To maximize the value of the firm, every company needs to make a right proportion of its sources of capital, which are debt and equity. This right proportion then will be determined as optimal capital structure. According to Damodaran (2001), cost of capital is one of the alternative that can be used as approach in determining the optimal capital structure. Gitman on Managerial Finance also define the optimal capital structure as “the capital structure at which the weighted average cot of capital is minimized, thereby maximizing the firm’s value.” 2.2 Cost of Capital Approach In order to have an optimal capital structure, also because of the difference in cost between debt and equity, the company is required to have an optimal mix of these source of capital. Cost of debt is usually cheaper than cost of equity. However, the more the corporate has the long-term debt, the more default risks it will face and the higher probability of bankcruptcy will be. As the company improve the proportion of

Rev. Integr. Bus. Econ. Res. Vol 2(1) 157
Copyright 2013 Society of Interdisciplinary Business Research (www.sibresearch.org)
its debt, the investor then will give a high required return to avoid the default risk, and this will result in higher cost of debt. Thus, it is important for the company to implement the right proportion of debt and equity to result in the minimum cost of capital. 2.1.1 Cost of Equity According to Ross, cost of equity is “the return that equity investors require on their investment in the firm” (2008: 481). Capital asset pricing model is one approach in determining cost of equity and it is used in this paper. The equation of CAPM is: RE = Rf + (β x (Rm – Rf)) (2.1) Where, RE = cost of equity Rf = risk free rate of return β = beta coefficient Rm = market return To know the beta coefficient is required, as the measurement of a company’s volatility relative to the entire market. According to Damodaran, it can be measured by several approach such as using the company historical data on market prices, estimating the fundamental beta (using the bottom-up beta method) and using accounting data. The writer uses the company historical data on market prices in determining the current beta of each company. Moreover, average of BI (Bank Indonesia) rate for each year is used for the risk free rate and return of Jakarta stock exchange (JKSE) is used for the market return. Current beta is the covariance between the security’s return and market’s return, divided by the variance of the market return. The second step in calculating beta is calculate the unlevered beta based on the current beta. The equation is:
βunlevered = (2.2)
Where, TC = Corporate tax rate Debt = Actual debt capital Equity = Actual equity capital In determing the optimal capital structure, it needs to change the proportion of debt and equity that effect the beta of the company. Thus, it requires the calculation of the levered beta for each of debt equity ratio. The equation of levered beta is:

Rev. Integr. Bus. Econ. Res. Vol 2(1) 158
Copyright 2013 Society of Interdisciplinary Business Research (www.sibresearch.org)
β = βunlevered [1 + (1 – TC) ] (2.3)
Where,
= Debt equity ratio
2.1.2 Cost of Debt Cost of debt is considered as a function of the firm’s default risk and the level of interest rate in the market. It is commonly measured by using yield to maturity on corporate bond. However, in this paper, cost of debt will be measured by using rating systems, because not all companies are issuing bond. The rating system is created base on the financial ratio and each company will be assigned a rating according to its ratio. Damodaran (2001) already defined the relationship between bond rating and interest coverage ratio. This ratio is also used by both Standard and Poor’s and Moody’s to determine bond rating because it changes as the firm changes its financing mix.
Interest Coverage Ratio = (2.4)
Where, EBIT = Earning before interest and tax Table 2.1 is based on the analysis of the interest coverage ratio of small manufacturing firms in different rating classes by Damodaran.
Table 2.1 Bond Rating and Interest Coverage Ratio (Source: Damodaran, 2012) Interest Coverage Ratio Rating Typical Default Spread (%) >12.50 AAA 0.35 9.50 – 12.50 AA 0.50 7.50 – 9.50 A + 0.70 6.00 – 7.50 A 0.85 4.50 – 6.00 A - 1.00 4.00 – 4.50 BBB 1.50 3.50 – 4.00 BB+ 2.00 3.00 – 3.50 BB 2.50 2.50 – 3.00 B + 3.25 2.00 – 2.50 B 4.00 1.50 – 2.00 B - 6.00 1.25 – 1.50 CCC 8.00

Rev. Integr. Bus. Econ. Res. Vol 2(1) 159
Copyright 2013 Society of Interdisciplinary Business Research (www.sibresearch.org)
0.80 – 1.25 CC 10.00 0.50 – 0.80 C 12.00 < 0.50 D 20.00
This rate should be adjusted to Indonesian market interest rate to define the interest rate of the company’s debt base on the rating. This interest rate would be the cost of debt before tax of the company. Table 2.2 shows the Indonesia market interest rate according to Harry (2007).
Table 2.2 Indonesia Market Interest Rate (Harry, 2007) Rating Indonesian Market Interest Rate (%)
AAA 12.20 AA 12.72 A + 13.24 A 13.76 A - 14.28 BBB 14.80 BB + 15.32 BB 15.84 B + 16.36 B 16.88 B - 17.40 CCC 17.92 CC 18.44 C 18.96 D 19.48
2.1.3 Cost of Capital Based on Ross (2008), WACC is one of the method to calculate the firm’s overall cost of capital. Gitman also stated that weighted average cost of Capital (WACC) reflects the expected average future cost of funds over the long run; found by weighting the cost of each specific type of capital by its propotion in the firm’s capital structure. WACC = WE x RE + WD x RD x (1 – TC) (2.5) Where, WACC = Weighted average cost of capital We = Weight of equity capital Wd = Weight of debt capital RD = Cost of debt before tax 2.2 Optimal Capital Structure and Cost of Capital As mentioned before, based on the cost of capital approach, the capital structure of a

Rev. Integr. Bus. Econ. Res. Vol 2(1) 160
Copyright 2013 Society of Interdisciplinary Business Research (www.sibresearch.org)
firm would be optimal when its cost of capital is minimize. Gitman (2009) already modificate the function of value of the firm as:
Value of the firm = (2.6)
The value of the firm is maximized by minimizing the weighted average cost of capital with the assumption that EBIT of the firm is remain constant. The graph below will show the optimal capital structure as the effect of changes in WACC. 0
Figure 2.2 Optimal Capital Structure 3. METHODOLOGY In the calculation, there are some steps to do, such as: a. Cost of equity: - Beta: current beta, unlevered beta, levered beta - Risk free rate: average of BI rate - Market return: JKSE return, using geometric calculation b. Cost of debt: - Interest coverage ratio - Bond rating of Damodaran (2012) and Indonesian market interest rate of Harry
(2007) c. Weighted average cost of capital for some debt ratio
Valu
e of
the
Value of the firm =
RE = cost of common stock equity
Cost
of C
apita
l
WACC = weighted average cost of capital
RD = before tax cost of long-term debt
Long-term Debt/Common Stock Equity
Optimal Capital Structure

Rev. Integr. Bus. Econ. Res. Vol 2(1) 161
Copyright 2013 Society of Interdisciplinary Business Research (www.sibresearch.org)
d. Value of the firm for some debt ratio e. Optimal capital structure for each companies every years (five
telecommunication companies listed in Indonesia Stock Exchange) f. Average of optimal capital structure for telecommunication sector
All the calculation then will be proceed to get the final result which is the optimal capital structure. 4. ANALYSIS AND RESULT 4.1 Research Data Collection
There are 13 data from 5 companies from year 2009 until 2011 that are used as sample in this research. The amount of debt that is collected for the calculation is the longterm debt that has correlation with capital structure according to Damodaran, such as bank loans, bonds payable, and leasing. On the other hand, the amount of equity is from total equity that is stated in the financial report of the company. Table 4.1 below summarizes risk free rate, market return, and tax rate for every year.
Table 4.1 Risk Free Rate and Market Return
No. Year Risk Free Rate (%) Market Return (%) Tax Rate (%) 1 2009 7.15 56.71 28 2 2010 6.50 36.33 25 3 2011 6.58 2.50 25
4.2 Actual Capital Structure
From data collection, table 4.2 presents the actual condition of capital structure from every company from year 2009 until 2011 in telecommunication sector. The fact show that the actual debt ratio is vary among the companies and even in one company but from different time.

Rev. Integr. Bus. Econ. Res. Vol 2(1) 162
Copyright 2013 Society of Interdisciplinary Business Research (www.sibresearch.org)
Table 4.2 Actual Capital Structure
1 BTEL 45 4,052,456 5,036,931 288,418 48.25 430,393 2 EXCL 56 10,988,237 8,803,113 2,463,844 26.49 6,697,615 3 ISAT 54 21,194,460 17,957,690 3,213,015 28.02 8,255,183 4 TLKM 27 14,457,663 38,989,747 22,603,141 35.68 48,296,000 5 BTEL 35 2,856,164 5,194,830 190,803 25.09 570,332 6 EXCL 44 9,201,951 11,715,074 5,164,487 19.64 19,718,247 7 ISAT 53 19,781,009 17,850,646 3,473,944 22.35 11,656,887 8 INVS 0 324 924,091 101,427 48.97 155,345 9 TLKM 27 16,655,754 44,418,742 22,491,120 23.47 71,863,696
10 EXCL 34 6,906,014 13,692,512 4,665,000 7.21 48,532,939 11 ISAT 50 18,564,132 18,815,973 2,830,099 9.63 22,034,174 12 INVS 0 - 1,824,272 131,420 5.18 1,903,828 13 TLKM 36 12,958,000 60,981,000 21,695,000 6.51 250,133,618
WACC (%)
Value of the Firm (million IDR)
No. Year Company Code
Actual Debt Ratio (%)
Debt (million IDR)
2009
2010
2011
EBIT (million IDR)
Equity (million IDR)
4.3 Cost of Equity Calculation
The calculation uses XL Axiata year 2009 as the sample. The first step in calculating cost of equity is determining the current beta. This current beta will be used to calculate the unlevered beta using the equation 2.2. Table 4.3 below consists of unlevered beta for each company every research year.
Table 4.3 Unlevered Beta
No. Year Company
Code
Current
Beta
Debt/Equity
(Actual)
Beta
Unlevered
1
2009
BTEL 1.33 0.80 0.77
2 EXCL 0.73 1.25 0.39
3 ISAT 0.75 1.18 0.41
4 TLKM 0.78 0.37 0.61
5
2010
BTEL 0.76 0.55 0.54
6 EXCL 0.66 0.79 0.41
7 ISAT 0.84 1.11 0.46
8 INVS 1.42 0.00 1.42
9 TLKM 0.74 0.37 0.58
10
2011
EXCL 0.28 0.50 0.20
11 ISAT 0.46 0.99 0.26
12 INVS 0.34 0.00 0.34
13 TLKM 0.16 0.21 0.13

Rev. Integr. Bus. Econ. Res. Vol 2(1) 163
Copyright 2013 Society of Interdisciplinary Business Research (www.sibresearch.org)
Furthermore, to get optimal capital structure, the calculation of levered beta in every debt ratio is required. It can be obtained using the equation 2.3. After that, the levered beta, risk free rate, and market return in every debt ratio generate cost of equity based on equation 2.1. Table 4.4 is summarized the calculation cost of equity for EXCL 2009.
Table 4.4 Cost of Equity EXCL 2009
Debt Ratio
(%)
Debt
(million IDR)
Equity
(million IDR) D/E Levered Beta
Cost of Equity
(%)
0 - 19,791,350 0.00 0.39 26.26
10 1,979,135 17,812,215 0.11 0.42 27.79
20 3,958,270 15,833,080 0.25 0.46 29.70
30 5,937,405 13,853,945 0.43 0.50 32.16
40 7,916,540 11,874,810 0.67 0.57 35.44
50 9,895,675 9,895,675 1.00 0.66 40.03
60 11,874,810 7,916,540 1.50 0.80 46.91
70 13,853,945 5,937,405 2.33 1.03 58.38
80 15,833,080 3,958,270 4.00 1.50 81.31
90 17,812,215 1,979,135 9.00 2.88 150.12
4.4 Cost of Debt Calculation
Interest rate for each debt level have to be defined since this rate would be the before tax cost of debt for the companies. Interpreting the interest rate for this research is by using interest coverage ratio according the equation 2.4 and then translate it into Damodaran bond rating and Indonesia market interest rate. To find out the interest rate for each debt ratio, this bond rating interest rate has to be readjust with the previous interest rate. The first column in table 4.5 is debt ratio as the scenario and the next column is the amount of debt based on its scenario.

Rev. Integr. Bus. Econ. Res. Vol 2(1) 164
Copyright 2013 Society of Interdisciplinary Business Research (www.sibresearch.org)
Table 4.5 Cost of Debt EXCL 2009
0 - 12.20 - 2,463,844 - AAA 28 0.0010 1,979,135 12.72 251,746 2,463,844 9.79 AA 28 9.1620 3,958,270 14.80 585,824 2,463,844 4.21 BBB 28 10.6630 5,937,405 16.36 971,359 2,463,844 2.54 B+ 28 11.7840 7,916,540 17.40 1,377,478 2,463,844 1.79 B- 28 12.5350 9,895,675 17.92 1,773,305 2,463,844 1.39 CCC 28 12.9060 11,874,810 18.44 2,189,715 2,463,844 1.13 CC 28 13.2870 13,853,945 18.44 2,554,667 2,463,844 0.96 CC 28 13.2880 15,833,080 18.44 2,919,620 2,463,844 0.84 CC 28 13.2890 17,812,215 18.96 3,377,196 2,463,844 0.73 C 28 13.65
Interest Coverage
Debt Ratio (%)
Debt (million IDR)
Interest Rate on Debt (%)
Interest Expense (million IDR)
EBIT (million IDR)
Bond Rating
Adjusted Tax Rate (%)
Cost of Debt (%)
Adjusted tax rate for each level of debt is needed for the high debt ratio condition where the interest expense exceeds its EBIT. This new tax rate is considered as the new tax benefits for this condition. For EXCL 2009, there is no need to adjust the tax rate because its EBIT can cover the interest expense up to 90% debt ratio. The calculation of adjusted tax rate is following the step below. 1. Maximum tax benefit = EBIT x Tc 2. Adjusted tax rate = Maximum tax benefit / Interest expense
4.5 Cost of Capital Calculation After obtaining the cost of equity and cost of debt for each level of debt, the next step is calculating weighted average cost of capital by using the equation 2.5. Next, the last calculation in this research is determining the value of the firm based on the equation 2.6. Table 4.6 is the calculation for WACC and value of the firm from XL Axiata (EXCL) 2009.
Table 4.6 Optimal Capital Structure EXCL 2009
Debt
Ratio (%)
Cost of
Debt (%)
Equity
Ratio(%)
Cost of
Equity (%) WACC (%) Value of the Firm (million IDR)
11 9.53 89 27.97 25.94 6,839,357
12 9.53 88 28.14 25.91 6,847,196
13 9.91 87 28.32 25.93 6,842,183
14 9.91 86 28.50 25.90 6,849,038

Rev. Integr. Bus. Econ. Res. Vol 2(1) 165
Copyright 2013 Society of Interdisciplinary Business Research (www.sibresearch.org)
15 9.91 85 28.69 25.88 6,855,906
16 10.28 84 28.89 25.91 6,846,921
17 10.28 83 29.08 25.89 6,852,793
18 10.28 82 29.29 25.86 6,858,676
19 10.28 81 29.49 25.84 6,864,569
20 10.66 80 29.70 25.90 6,850,605
21 10.66 79 29.92 25.88 6,855,492
22 11.03 78 30.15 25.94 6,838,603
23 11.03 77 30.38 25.93 6,842,485
24 11.40 76 30.61 26.00 6,822,711
25 11.40 75 30.85 25.99 6,825,591
26 11.40 74 31.10 25.98 6,828,474
27 11.78 73 31.35 26.07 6,804,869
28 11.78 72 31.62 26.06 6,806,756
29 11.78 71 31.89 26.05 6,808,644
This WACC, 25.84%, is the minimal persentage of cost that XL Axiata need to pay. At this cost, value of the firm is maximal, which is 6,864,569 million rupiah. Furthermore, 19% debt ratio is the optimal debt ratio for EXCL in 2009. Decreasing debt ratio affects firm value to be smaller and so does for additional debt. Thus, to get the maximal value of the firm, this company has to make its capital structure optimal by taking the right proportion of debt. Figure 4.1 and 4.2 describes the optimal debt ratio condition which is consistent with the theory on figure 2.2.

Rev. Integr. Bus. Econ. Res. Vol 2(1) 166
Copyright 2013 Society of Interdisciplinary Business Research (www.sibresearch.org)
Figure 4.1 Value of the Firm EXCL 2009
Figure 4.2 Weighted Average Cost of Capital (WACC) EXCL 2009 4.6 Actual and Optimal Capital Structure
After further calculation, the optimal capital structures of all companies every year have been obtained. Next, this optimal capital structures are compared to the actual companies’ condition. Table 4.8 below presents this comparison.
Table 4.8 Actual and Optimal Capital Structure

Rev. Integr. Bus. Econ. Res. Vol 2(1) 167
Copyright 2013 Society of Interdisciplinary Business Research (www.sibresearch.org)
1 BTEL 45 430,393 17 465,547 35,154 2 EXCL 56 6,697,615 19 6,864,569 166,954 3 ISAT 54 8,255,183 12 8,581,613 326,430 4 TLKM 27 45,614,495 99 48,296,000 2,681,505 5 BTEL 35 570,332 1 636,460 66,128 6 EXCL 44 19,718,247 16 20,676,491 958,243 7 ISAT 53 11,656,887 6 12,940,300 1,283,413 8 INVS 0 155,345 60 161,777 6,432 9 TLKM 27 71,863,696 24 72,021,290 157,594
10 EXCL 34 48,532,939 0 60,792,444 12,259,505 11 ISAT 50 22,034,174 0 38,578,266 16,544,093 12 INVS 0 1,903,828 0 1,903,828 - 13 TLKM 18 250,133,618 0 269,813,652 19,680,034
No. Optimal Debt Ratio (%)
Optimal Value of the Firm (million IDR)
Incremental Value of the Firm (million IDR)
Year Company Code
Actual Debt Ratio (%)
Actual Value of the Firm (million IDR)
2009
2010
2011
There are some facts that can be summarized according to the table above. First, almost all companies have not reached their optimal capital structure. Only Inovisi Telecom in 2011 which has optimal capital structure. The second, similar with the actual debt ratio, the optimal debt ratio for every companies are different, even for one company but from different period. There are factors that influence these differences. To become optimal, some companies at some period need to increase the debt ratio while the other need to decrease it. The third, in 2011, optimal capital structure for all companies are in 0% debt ratio. This optimal debt ratio means that it is better for all companies not to increase its debt ratio. There are more explanation about this condition in sub chapter 4.6.1 The last, companies actual condition which are not optimal give significant impact to their value of the firm. There are quite big incremental value if those companies can make their capital structure optimal. In 2010, Indosat loss its oppotunity to maximize value up to more than one trillion rupiah. It is the incremental value that this company should have if it optimizes its capital structure. The optimal debt ratio for Indosat in 2010 according to the table is 6% while its actual ratio is 53%. It means that Indosat is better not to increase its debt amount. 4.7 Factors that Influence Optimal Capital Structure

Rev. Integr. Bus. Econ. Res. Vol 2(1) 168
Copyright 2013 Society of Interdisciplinary Business Research (www.sibresearch.org)
Capital market condition and earning before interest and tax (EBIT) that can be obtained by the companies are factors that most influence the optimal capital structure. Capital market condition affects cost of equity and EBIT affect cost of debt of the company. 4.7.1 Capital Market Condition Capital market condition can be interpreted by using market return on Jakarta Stock Exchange (JKSE). This market return is different every year and it influence companies’ optimal capital structure. As stated before, market return affect cost of equity of the company that make lower market return result lower cost of equity. In 2011, according to table 4.1, market return which come from JKSE (Jakarta Stock Exchange) is smaller than in 2009 and 2010. The decreasing of JKSE is effect from global crises that occur in this year. This small market return makes the cost of equity become smaller. The decreasing of cost of equity makes WACC become more minimal when the weight of equity is bigger than debt, because in this situation, cost of debt is bigger than cost of equity. Table 4.10, 4.11, and 4.12 below shows the calculation of optimal capital structure for TLKM in for every year.
Table 4.10 Optimal Capital Structure TLKM 2009
Debt
Ratio (%)
Cost of
Debt (%)
Equity
Ratio (%)
Cost of
Equity (%)
WACC
(%) Value of the Firm (million IDR)
0 0.00 100 37.54 37.54 43,354,802
10 8.78 90 39.97 36.85 44,163,599
20 8.78 80 43.01 36.16 45,003,146
30 9.16 76 46.91 35.59 45,730,442
40 9.53 70 52.12 35.09 46,382,433
50 9.91 60 59.42 34.66 46,951,636
60 10.28 50 70.36 34.31 47,431,243
70 10.66 40 88.59 34.04 47,815,322
80 11.40 30 125.05 34.13 47,676,933
90 11.78 20 234.45 34.05 47,800,735
99 11.78 10 2203.55 33.70 48,296,000

Rev. Integr. Bus. Econ. Res. Vol 2(1) 169
Copyright 2013 Society of Interdisciplinary Business Research (www.sibresearch.org)
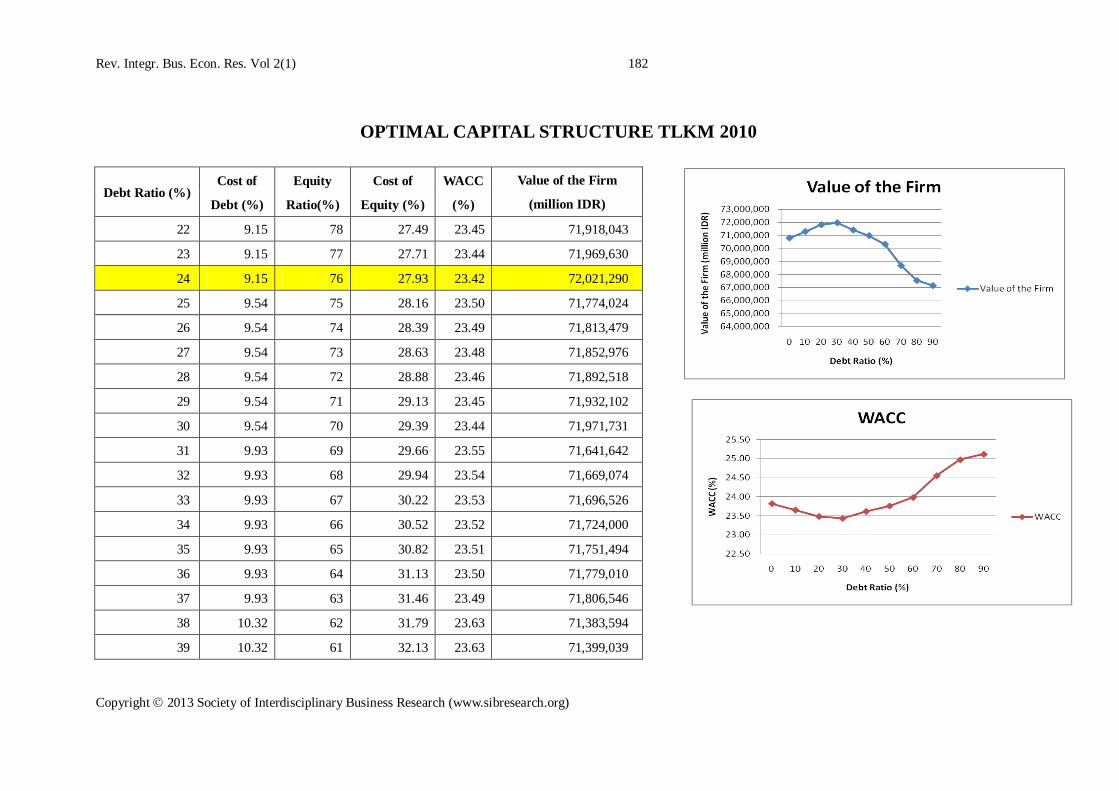
Table 4.11 Optimal Capital Structure TLKM 2010
Debt
Ratio (%)
Cost of
Debt (%)
Equity
Ratio (%)
Cost of
Equity (%)
WACC
(%) Value of the Firm (million IDR)
0 0 100 23.82 23.82 70,801,563
10 9.15 90 25.27 23.66 71,304,726
20 9.15 80 27.07 23.49 71,815,092
24 9.15 76 27.93 23.42 72,021,290
30 9.54 70 29.39 23.44 71,971,731
40 10.32 60 32.49 23.62 71,414,492
50 10.71 50 36.82 23.76 70,982,115
60 11.10 40 43.32 23.99 70,325,506
70 11.88 30 54.14 24.56 68,685,044
80 12.27 20 75.80 24.98 67,538,601
90 12.27 10 140.77 25.12 67,151,756
Table 4.12 Optimal Capital Structure TLKM 2011
Debt
Ratio (%)
Cost of
Debt (%)
Equity
Ratio (%)
Cost of
Equity (%)
WACC
(%) Value of the Firm (million IDR)
0 0 100 6.03 6.03 269,813,652
10 9.15 90 5.98 6.30 258,221,048
20 9.54 80 5.93 6.65 244,679,587
30 10.32 70 5.85 7.19 226,185,620
40 10.71 60 5.76 7.74 210,290,902
50 11.49 50 5.62 8.55 190,212,864
60 11.88 40 5.41 9.29 175,092,062
70 12.27 30 5.07 10.11 160,946,839
80 12.66 20 4.38 11.00 147,860,761
90 13.05 10 2.32 11.98 135,852,129
There is decreasing in persentage cost of equity from 2009 to 2011, while the change in cost of debt is not significant. This condition make the WACC in 2011 lower than in 2010, and make the capital structure in 2011 become optimal at 0% debt ratio. 4.7.2 Earning Before Interestand Tax (EBIT) By using interest coverage ratio in determining the cost of debt, EBIT is an important factor. A good company with large EBIT have more capability to borrow more from the lender because it default risk is relative low. Large EBIT make company’s interest

Rev. Integr. Bus. Econ. Res. Vol 2(1) 170
Copyright 2013 Society of Interdisciplinary Business Research (www.sibresearch.org)
coverage ratio higher and this high interest coverage ratio result in lower interest rate. This capability make capital structure optimal at higher debt ratio when market return is normal. In 2009 for example, when capital market condition relatively normal, Telekomunikasi Indonesia (TLKM) debt ratio is optimal at 99%. It is because it has high EBIT which is 22,5 trillion rupiah. This amount of EBIT is quite large compared to its total debt and equity, and make its interest coverage ratio high up to 99%. This high interest coverage ratio make the cost of debt of TLKM also lower. Looking at table 4.10, cost of debt TLKM with 99% debt ratio is much more lower compared to its cost of equity. Therefore, TLKM in 2009 is optimal in 99% debt ratio. In 2010 where market condition is relatively normal, there are two companies that have low optimal debt ratio, which are Bakrie Telecom (BTEL) at 1% and Indosat (ISAT) at 6%. From the financial report in 2010, EBIT of BTEL and ISAT are 190 billion rupiah and Rp 3,5 trillion rupiah respectively. This amount of EBIT for those companies are relatively small if compared with the total capital they need which are 8 trillion rupiah for BTEL and 37.6 trillion rupiah for ISAT. This small EBIT make those companies better to have low debt ratio to maximize their value, because their capability to meet the interest are low, therefore it make their cost of debt higher for higher debt ratio compared to other companies which have higher EBIT. Table 4.13 shows the calculation of optimal capital structure of BTEL in 2010.
Table 4.13 Optimal Capital Structure BTEL 2010
Debt Ratio (%)
Cost of Debt (%)
Equity Ratio (%)
Cost of Equity (%)
WACC (%)
Value of the Firm (million IDR)
0 0.00 100 22.50 22.50 636,078
10 13.44 90 23.83 22.79 627,872
20 16.00 80 25.50 23.60 606,437
30 17.51 70 27.64 24.60 581,734
40 18.00 60 30.50 25.50 561,244
50 18.30 50 34.50 26.40 542,149
60 18.49 40 40.49 27.29 524,310
70 18.63 30 50.49 28.19 507,608
80 18.74 20 70.49 29.09 491,937
90 18.82 10 130.48 29.99 477,204

Rev. Integr. Bus. Econ. Res. Vol 2(1) 171
Copyright 2013 Society of Interdisciplinary Business Research (www.sibresearch.org)
4.8 Average Optimal Capital Structure for Telecommunication Companies From table 4.8, almost all the optimal capital structures from telecommunication companies are in the range between 0%-25%. However, there are TLKM 2009 and INVS 2010 which are out of the range with optimal debt ratio 99% and 60%. Therefore, in the calculation of average optimal capital structure, these sample are not included. With 11 samples, table 4.15 summarizes the average by 9% debt ratio. It is an overview of optimal capital structure for companies in telecommunication sector.
Table 4.15 Average Optimal Debt Ratio
No. Year Company Code Optimal Debt Ratio (%)
1 2009
BTEL 17 2 EXCL 19 3 ISAT 12 4
2010
BTEL 1 5 EXCL 16 6 ISAT 6 7 TLKM 24 8
2011
EXCL 0 9 ISAT 0
10 INVS 0 11 TLKM 0 AVERAGE OPTIMAL DEBT RATIO 9
To reach the average optimal capital structure become 9%, some samples need to reduce its debt ratio and other need to enhance this ratio. Reducing debt ratio can be done by decreasing debt capital or by increasing equity capital. Decreasing debt capital without increasing equity capital will result in lower amount of capital and it can make the companies difficult to operate their business. Therefore, increasing equity capital is required in order to reduce debt ratio. One of the choice to raise the equity capital is by issuing more stock outstanding. Based on Fact Book from IDX (Indonesia Stock Exchange), stocks trading from telecommunication subsector have good performance. Almost all companies have been in the 50 most active stocks from all categories which are trading frequency, trading volume, and trading value.

Rev. Integr. Bus. Econ. Res. Vol 2(1) 172
Copyright 2013 Society of Interdisciplinary Business Research (www.sibresearch.org)
Inovisi Infracom (INVS) which is the only company that has not been in the 50 list, also has positive growth, such as in trading value. INVS’s total trading value is growing rapidly by 26 billion rupiah from 2010 to 74 billion rupiah in 2011. This growth is more than 100%. From this fact, it can be summarized that these companies can raise the equity capital because investors are interested to trade their stocks. In the other condition, for the companies that need to enhance their debt ratio, they can add their debt capital, or reduce the equity capital. Reducing equity capital without adding debt capital will result the total capital become smaller, and make the companies also difficult to expand their business. In order to increase debt ratio, increasing debt capital is necessary. The additional debt capital can be obtained by two alternatives which are issuing bond and borrowing from bank. Increasing debt capital is not difficult for the companies who have great credibility in fulfilling the obligations. All companies on this research, except INVS, have good credibility according to data in IDX year 2010. Table 4.16 is the summarize of their rating.
Table 4.16 Company Rating No. Company Code Company Rating 1. BTEL A- 2. EXCL AA+ 3. ISAT AA+ 4. TLKM AAA
These rating makes companies in this sector can attract the investor to give loan or to buy their new issued bonds. Afterward, those companies can have additional debt capital and reach the optimal debt ratio, and then their value of the firm can be improved. The other hand, Inovisi Infracom is not rated by IDX because this company does not have bond outstanding. INVS does not have many debt capital and it has opportunity to issue bonds as additional debt capital. Morever, with a well growing EBIT and relative low debt capital, INVS has high interest coverage ratio. It means that this company has ability to pay its coupon and attract investor to buy its bonds. Nevertheless, it is not easy for these companies to change their capital structure. Moreover, based on table 4.17, some companies can have lower value of the firm if they following this average ratio. However for TLKM and INVS which will have lower value if they change their capital structure, and also for other companies which

Rev. Integr. Bus. Econ. Res. Vol 2(1) 173
Copyright 2013 Society of Interdisciplinary Business Research (www.sibresearch.org)
can not change their capital structure easily, they can use this 9% average as the guideline while choosing the capital structure for funding their new projects.
Table 4.17 Actual Debt Ratio and Average Optimal Debt Ratio
(million IDR) % 1 BTEL 45 430,393 9 475,952 45,560 9.572 EXCL 56 6,697,615 9 6,806,091 108,476 1.593 ISAT 54 8,255,183 9 8,525,936 270,753 3.185 BTEL 35 570,332 9 631,337 61,005 9.666 EXCL 44 19,718,247 9 20,605,137 886,889 4.307 ISAT 53 11,656,887 9 12,820,910 1,164,023 9.089 TLKM 27 71,863,696 9 71,254,088 (609,608) -0.86
10 EXCL 34 48,532,939 9 57,924,450 9,391,512 16.2111 ISAT 50 22,034,174 9 35,151,560 13,117,387 37.3212 INVS 0 1,903,828 9 1,722,905 (180,923) -10.5013 TLKM 18 250,133,618 9 261,698,668 11,565,049 4.42
2009
2010
2011
Incremental Value of the FirmAODR (%)
Value of the Firm with AODR (million IDR)
No. Year Company Code
Actual Debt
Actual Value of the Firm (million IDR)
5. CONCLUSION AND RECOMMENDATION
5.1 Conclusion Every company in telecommunication sector has different capital structure for every year. This actual capital structure results weighted average cost of capital (WACC) and define value of the firm. Unfortunately, after the calculation using cost of capital approach to determine the optimal capital structure for those companies, almost all companies have not reached their optimal. The choice of source of capital affects the cost of capital and value of the company. Optimal capital structure is determined at debt ratio that have the lowest cost of capital and create highest value of the firm. The condition while actual capital structure of the companies are not optimal make their firm values become not maximal. Their cost of capital are high because of the proportion of debt that they have. The average optimal debt ratio for companies in telecommunication sector listed in Indonesia Stock Exchange is 9%. Cost of equity is affected by capital market condition which come from return of JKSE. The lower market return make this cost become lower. This factor can not be controlled by the companies. Factor that influence cost of debt is earning before

Rev. Integr. Bus. Econ. Res. Vol 2(1) 174
Copyright 2013 Society of Interdisciplinary Business Research (www.sibresearch.org)
interest and tax (EBIT). The lower EBIT, the higher cost of debt the company spend. It is factor that company can manage. 5.2 Recommendation Company should have the right proportion of source of capital to maximize value of the firm. For telecommunication companies in Indonesia whose capital structure have not been optimal, the average optimal debt ratio from this sector which is 9% can be applied as the new proportion of debt. The companies also can use this debt ratio to choose the source of financing for their new projects. As mentioned before, EBIT is factor that influence company’s cost of debt and can be managed. Therefore, to have lower cost of debt, company have to it EBIT by increasing sales and decreasing operational cost. Also, because cost of equity is affected by market condition, companies should consider about this factor before determine the proportion of capital.

Rev. Integr. Bus. Econ. Res. Vol 2(1) 175
Copyright 2013 Society of Interdisciplinary Business Research (www.sibresearch.org)
APPENDIX
OPTIMAL CAPITAL STRUCTURE BTEL 2009
Debt
Ratio (%)
Cost of
Debt (%)
Equity
Ratio(%)
Cost of
Equity (%)
WACC
(%)
Value of the Firm (million
IDR)
3 9.53 97 46.24 45.13 460,093
4 10.28 96 46.53 45.08 460,637
5 10.66 95 46.83 45.02 461,220
6 11.40 94 47.14 45.00 461,498
7 11.78 93 47.46 44.96 461,891
8 12.15 92 47.78 44.93 462,208
9 12.15 91 48.11 44.87 462,795
10 12.53 90 48.44 44.85 462,997
11 12.53 89 48.79 44.80 463,548
12 12.53 88 49.14 44.74 464,099
13 12.90 87 49.50 44.74 464,147
14 12.90 86 49.87 44.69 464,662
15 13.28 85 50.24 44.70 464,593
16 13.28 84 50.63 44.65 465,069
17 13.28 83 51.02 44.61 465,547
18 13.50 82 51.53 44.69 464,714
19 13.76 81 52.08 44.80 463,543

Rev. Integr. Bus. Econ. Res. Vol 2(1) 176
Copyright 2013 Society of Interdisciplinary Business Research (www.sibresearch.org)
OPTIMAL CAPITAL STRUCTURE ISAT 2009
Debt Ratio (%) Cost of
Debt (%)
Equity
Ratio(%)
Cost of
Equity (%)
WACC
(%)
Value of the Firm (million
IDR)
2 8.78 98 27.55 27.18 8,512,181
3 8.78 97 27.70 27.14 8,524,715
4 8.78 96 27.86 27.10 8,537,286
5 8.78 95 28.02 27.06 8,549,894
6 9.16 94 28.18 27.04 8,555,427
7 9.53 93 28.35 27.03 8,558,594
8 9.53 92 28.52 27.00 8,568,888
9 9.91 91 28.69 27.00 8,568,500
10 10.28 90 28.87 27.01 8,565,736
11 10.28 89 29.05 26.98 8,573,667
12 10.28 88 29.23 26.96 8,581,613
13 10.66 87 29.42 26.98 8,574,079
14 11.03 86 29.61 27.01 8,564,183
15 11.03 85 29.81 26.99 8,569,734
16 11.40 84 30.01 27.04 8,556,292
17 11.40 83 30.22 27.02 8,560,646
18 11.78 82 30.44 27.08 8,543,687
19 11.78 81 30.65 27.07 8,546,846

Rev. Integr. Bus. Econ. Res. Vol 2(1) 177
Copyright 2013 Society of Interdisciplinary Business Research (www.sibresearch.org)
OPTIMAL CAPITAL STRUCTURE TLKM 2009
Debt Ratio (%) Cost of
Debt (%)
Equity
Ratio(%)
Cost of
Equity (%)
WACC
(%)
Value of the Firm
(million IDR)
70 10.66 30 88.59 34.04 47,815,322
75 11.03 25 103.17 34.07 47,772,265
80 11.40 20 125.05 34.13 47,676,933
85 11.40 15 161.52 33.92 47,975,859
86 11.40 14 171.94 33.88 48,036,095
87 11.40 13 183.96 33.84 48,096,482
88 11.40 12 197.98 33.79 48,157,021
89 11.40 11 214.56 33.75 48,217,712
90 11.78 10 234.45 34.05 47,800,735
91 11.78 9 258.76 34.01 47,855,263
92 11.78 8 289.14 33.97 47,909,914
93 11.78 7 328.21 33.93 47,964,691
94 11.78 6 380.31 33.89 48,019,593
95 11.78 5 453.24 33.85 48,074,621
96 11.78 4 562.63 33.81 48,129,775
97 11.78 3 744.96 33.77 48,185,056
98 11.78 2 1109.60 33.74 48,240,464
99 11.78 1 2203.55 33.70 48,296,000

Rev. Integr. Bus. Econ. Res. Vol 2(1) 178
Copyright 2013 Society of Interdisciplinary Business Research (www.sibresearch.org)
OPTIMAL CAPITAL STRUCTURE BTEL 2010
Debt Ratio
(%)
Cost of
Debt (%)
Equity
Ratio(%)
Cost of
Equity (%)
WACC
(%)
Value of the Firm (million IDR)
0% 0.00% 100% 22.50% 22.50% 636,078
1% 9.15% 99% 22.62% 22.48% 636,460
2% 9.93% 98% 22.74% 22.49% 636,401
3% 10.71% 97% 22.87% 22.50% 635,900
4% 11.10% 96% 23.00% 22.52% 635,400
5% 12.27% 95% 23.13% 22.59% 633,585
6% 12.66% 94% 23.26% 22.63% 632,434
7% 12.66% 93% 23.40% 22.65% 631,831
8% 13.05% 92% 23.54% 22.70% 630,361
9% 13.05% 91% 23.68% 22.73% 629,654

Rev. Integr. Bus. Econ. Res. Vol 2(1) 179
Copyright 2013 Society of Interdisciplinary Business Research (www.sibresearch.org)
OPTIMAL CAPITAL STRUCTURE EXCL 2010
Debt Ratio (%) Cost of
Debt (%)
Equity
Ratio(%)
Cost of
Equity (%)
WACC
(%)
Value of the Firm
(million IDR)
2 9.15 98 18.99 18.79 20,610,979
3 9.15 97 19.09 18.79 20,615,644
4 9.15 96 19.19 18.78 20,620,312
5 9.15 95 19.29 18.78 20,624,982
6 9.15 94 19.39 18.78 20,629,654
7 9.15 93 19.50 18.77 20,634,328
8 9.15 92 19.60 18.77 20,639,004
9 9.15 91 19.71 18.76 20,643,683
10 9.15 90 19.83 18.76 20,648,363
11 9.15 89 19.94 18.75 20,653,046
12 9.15 88 20.06 18.75 20,657,731
13 9.15 87 20.18 18.75 20,662,417
14 9.15 86 20.30 18.74 20,667,106
15 9.15 85 20.43 18.74 20,671,797
16 9.15 84 20.56 18.73 20,676,491
17 9.54 83 20.69 18.80 20,608,233
18 9.54 82 20.83 18.79 20,608,620
19 9.54 81 20.97 18.79 20,609,008

Rev. Integr. Bus. Econ. Res. Vol 2(1) 180
Copyright 2013 Society of Interdisciplinary Business Research (www.sibresearch.org)
OPTIMAL CAPITAL STRUCTURE FOR ISAT 2010
Debt
Ratio
(%)
Cost of
Debt
(%)
Equity
Ratio(%)
Cost of
Equity (%)
WACC
(%)
Value of the Firm (million
IDR)
0% 0.00% 100% 20.18% 20.18% 12,910,669
1% 9.15% 99% 20.28% 20.17% 12,915,598
2% 9.15% 98% 20.39% 20.17% 12,920,531
3% 9.15% 97% 20.50% 20.16% 12,925,468
4% 9.15% 96% 20.61% 20.15% 12,930,408
5% 9.15% 95% 20.72% 20.14% 12,935,352
6% 9.15% 94% 20.84% 20.13% 12,940,300
7% 9.54% 93% 20.95% 20.15% 12,927,717
8% 9.93% 92% 21.07% 20.18% 12,910,166
9% 9.93% 91% 21.20% 20.18% 12,910,103

Rev. Integr. Bus. Econ. Res. Vol 2(1) 181
Copyright 2013 Society of Interdisciplinary Business Research (www.sibresearch.org)
OPTIMAL CAPITAL STRUCTURE FOR INVS 2010
Debt Ratio (%) Cost of
Debt (%)
Equity
Ratio(%)
Cost of
Equity (%)
WACC
(%)
Value of the Firm (million
IDR)
52 13.83 48 83.48 47.26 160,956
53 13.83 47 84.89 47.23 161,068
54 13.83 46 86.36 47.20 161,180
55 13.83 45 87.90 47.16 161,292
56 13.83 44 89.51 47.13 161,405
57 13.83 43 91.20 47.10 161,518
58 13.83 42 92.96 47.06 161,630
59 13.83 41 94.81 47.03 161,743
60 13.87 40 96.75 47.02 161,777
61 13.94 39 98.79 47.03 161,732
62 14.02 38 100.94 47.05 161,686
63 14.09 37 103.21 47.06 161,641
64 14.15 36 105.60 47.07 161,596
65 14.22 35 108.13 47.09 161,550
66 14.28 34 110.80 47.10 161,505
67 14.35 33 113.64 47.11 161,460
68 14.41 32 116.66 47.13 161,414
69 14.46 31 119.87 47.14 161,369
Rev. Integr. Bus. Econ. Res. Vol 2(1) 182
Copyright 2013 Society of Interdisciplinary Business Research (www.sibresearch.org)
OPTIMAL CAPITAL STRUCTURE TLKM 2010
Debt Ratio (%) Cost of
Debt (%)
Equity
Ratio(%)
Cost of
Equity (%)
WACC
(%)
Value of the Firm
(million IDR)
22 9.15 78 27.49 23.45 71,918,043
23 9.15 77 27.71 23.44 71,969,630
24 9.15 76 27.93 23.42 72,021,290
25 9.54 75 28.16 23.50 71,774,024
26 9.54 74 28.39 23.49 71,813,479
27 9.54 73 28.63 23.48 71,852,976
28 9.54 72 28.88 23.46 71,892,518
29 9.54 71 29.13 23.45 71,932,102
30 9.54 70 29.39 23.44 71,971,731
31 9.93 69 29.66 23.55 71,641,642
32 9.93 68 29.94 23.54 71,669,074
33 9.93 67 30.22 23.53 71,696,526
34 9.93 66 30.52 23.52 71,724,000
35 9.93 65 30.82 23.51 71,751,494
36 9.93 64 31.13 23.50 71,779,010
37 9.93 63 31.46 23.49 71,806,546
38 10.32 62 31.79 23.63 71,383,594
39 10.32 61 32.13 23.63 71,399,039

Rev. Integr. Bus. Econ. Res. Vol 2(1) 183
Copyright 2013 Society of Interdisciplinary Business Research (www.sibresearch.org)
OPTIMAL CAPITAL STRUCTURE FOR EXCL 2011
Debt
Ratio
(%)
Cost of
Debt
(%)
Equity
Ratio(%)
Cost of
Equity
(%)
WACC
(%)
Value of the Firm
(million IDR)
0% 0.00% 100% 5.76% 5.76% 60,792,444
1% 9.15% 99% 5.75% 5.78% 60,500,603
2% 9.15% 98% 5.74% 5.81% 60,211,551
3% 9.15% 97% 5.74% 5.84% 59,925,248
4% 9.15% 96% 5.73% 5.87% 59,641,655
5% 9.15% 95% 5.72% 5.89% 59,360,733
6% 9.15% 94% 5.72% 5.92% 59,082,446
7% 9.15% 93% 5.71% 5.95% 58,806,755
8% 9.15% 92% 5.70% 5.98% 58,533,625
9% 9.15% 91% 5.69% 6.01% 58,263,021

Rev. Integr. Bus. Econ. Res. Vol 2(1) 184
Copyright 2013 Society of Interdisciplinary Business Research (www.sibresearch.org)
OPTIMAL CAPITAL STRUCTURE ISAT 2011
Debt Ratio
(%)
Cost of
Debt (%)
Equity
Ratio(%)
Cost of
Equity (%)
WACC
(%)
Value of the Firm
(million IDR)
0% 0.00% 100% 5.50% 5.50% 38,578,266
1% 9.15% 99% 5.49% 5.53% 38,380,191
2% 9.15% 98% 5.49% 5.56% 38,184,140
3% 9.15% 97% 5.48% 5.59% 37,990,082
4% 9.15% 96% 5.47% 5.62% 37,797,986
5% 9.54% 95% 5.46% 5.66% 37,478,335
6% 9.54% 94% 5.45% 5.70% 37,265,832
7% 9.93% 93% 5.44% 5.76% 36,879,956
8% 10.32% 92% 5.43% 5.82% 36,453,092
9% 10.32% 91% 5.42% 5.86% 36,203,796

Rev. Integr. Bus. Econ. Res. Vol 2(1) 185
Copyright 2013 Society of Interdisciplinary Business Research (www.sibresearch.org)
OPTIMAL CAPITAL STRUCTURE INVS 2011
Debt Ratio
(%)
Cost of
Debt (%)
Equity
Ratio(%)
Cost of
Equity (%)
WACC
(%)
Value of the Firm
(million IDR)
0% 0.00% 100% 5.18% 5.18% 1,903,828
1% 9.15% 99% 5.17% 5.21% 1,893,148
2% 9.15% 98% 5.16% 5.24% 1,882,587
3% 9.15% 97% 5.14% 5.26% 1,872,143
4% 9.15% 96% 5.13% 5.29% 1,861,815
5% 9.54% 95% 5.12% 5.34% 1,844,841
6% 9.93% 94% 5.11% 5.40% 1,825,534
7% 9.93% 93% 5.10% 5.44% 1,813,107
8% 10.32% 92% 5.09% 5.50% 1,790,640
9% 10.71% 91% 5.07% 5.58% 1,766,251
APPENDIX 9

Rev. Integr. Bus. Econ. Res. Vol 2(1) 186
Copyright 2013 Society of Interdisciplinary Business Research (www.sibresearch.org)
OPTIMAL CAPITAL STRUCTURE TLKM 2011
Debt Ratio
(%)
Cost of
Debt (%)
Equity
Ratio(%)
Cost of
Equity (%)
WACC
(%)
Value of the Firm
(million IDR)
0% 0.00% 100% 6.03% 6.03% 269,813,652
1% 9.15% 99% 6.03% 6.06% 268,607,762
2% 9.15% 98% 6.02% 6.08% 267,412,602
3% 9.15% 97% 6.02% 6.11% 266,228,031
4% 9.15% 96% 6.01% 6.14% 265,053,908
5% 9.15% 95% 6.01% 6.17% 263,890,097
6% 9.15% 94% 6.00% 6.19% 262,736,460
7% 9.15% 93% 6.00% 6.22% 261,592,867
8% 9.15% 92% 5.99% 6.25% 260,459,185
9% 9.15% 91% 5.99% 6.27% 259,335,288

Rev. Integr. Bus. Econ. Res. Vol 2(1) 187
Copyright 2013 Society of Interdisciplinary Business Research (www.sibresearch.org)
ACKNOWLEDGEMENTS Thanks to School of Business and Management Institute Teknologi Bandung and Researcher’s supervisor, Arson Aliludin, DEA, for all knowledge and experiences that help Researcher finish this paper.
REFERENCES [1] Badan Pusat Statistik (bps.go.id) accessed up to July 24th
2012. http://www.bps.go.id/brs_file/pdb_07mei12.pdf [2] Bank Indonesia, accessed up to July 24th 2012. www.bi.go.id [3] Bursa Efek Indonesia, accessed up to July 24th 2012. www.idx.co.id [4] Damodaran, Aswath, 2001, Corporate Finance (2nd ed.), New York: John Wiley
& Sons, Inc. [5] Damodaran online, accessed up to July 24th
2012 http://pages.stern.nyu.edu/~adamodar/New_Home_Page/datafile/rati
ngs.htm [6] Gitman, Lawrence J., 2009, Principles of Managerial Finance (12th ed.), Boston:
Pearson. [7] Harry Nurhadi, 2007, Optimal Capital Structure Analysis Using Adjusted Present
Value (APV) Approach A Study of PLN Year 2004-2006. [8] Ross, Stephen A., 2008, Corporate Finance Fundamentals (8th ed.), New York:
McGraw Hill. [9] Yahoo! Finance, accessed up to July 24th 2012. www.finance.yahoo.com [10] Yasmin T. Pratiwi, 2010, Optimal Capital Structure of PT. S2P for Project
Extension Cilacap CFSPP Unit 3 Extension (1x600MW) 2307kcal/kWh at year of 2012.