Embed Size (px)
Citation preview

„What is a successful campaign? Useful KPIs for Social Media and Blogger
campaigns“
Catharina Fischer, Head of Social Media
German National Tourist Board, Germany [email protected]
http://www.germany.travel

Some definitions
KPI’s are an actionable scorecard that keeps your strategy on track.
They enable you to manage, control and achieve desired business
results. – Rob Petersen
“Should not constitute every company metric for analysis and
evlaution. Rather, KPI’s should reflect the most important objectives of
the business.” – (Avinash)
“The selected measures that provide visibility into the performance
of a business and enable decision makers to take action in
achieving the desired outcomes.” – Aurel Brudan
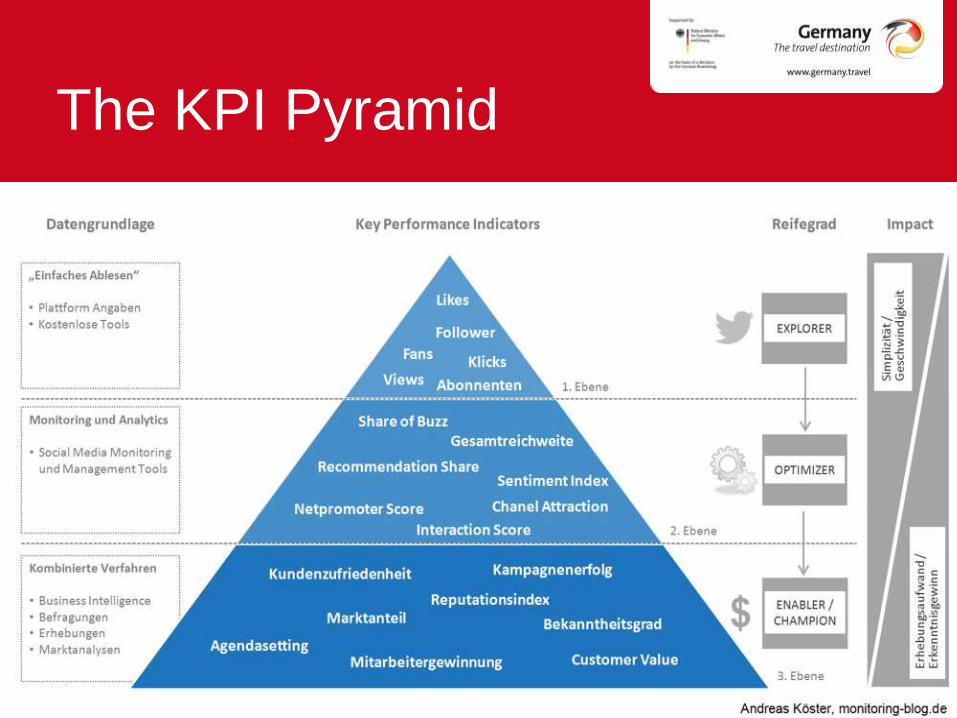
The KPI Pyramid

5 metrics of digital
influence
Conversational exchange = The number of replies or comments per postThe most
key metric in social media. Most powerful method for increasing your digital influence. The
interactions your brand spurs on Facebook is the key determinant for Edge Rank.
Reach = The size of the direct audienceReach expresses the size of the direct network
exposed to your posts. Reach strongly correlates with the other performance measures,
making it an appropriate predictor of influence.
Content amplification = The number of shares per postContent amplification is the
degree to which your content is shared throughout the network, indicating network reach.
On Twitter this is the amount of retweets, on a blog the amount of social shares and on
Facebook and Google+ this is expressed by the amount of shares, Likes or +1s per post.
Sentiment = The expressed sentiment towards your postA sentiment analysis deals
with the computational treatment of opinion, sentiment and subjectivity in text. It will take
some time before sentiment analyses are actually usable.
Conversion rate = Is the act of converting site visitors into paying customers
Conversion is not always considered as direct sale. Also new newsletter registrations or
participants in a contest are “conversions”.

Raw numbers Progress Change
What to measure?
Number of new fans or newsletter registrations
65% complete, e.g. blogger tours
25% increase in UGC or engagement rate
Source Analytics tool Project plan CMS Website Analytics tool
Frequency Monthly/Weekly Quarterly Monthly
Do not forget your overall goal!
Example of a KPI
Dashboard

KPIs of social media and blogger
campaigns

1. Facebook campaigns

Page 6/18
Moving Average of Post Engagement Rate
0,000
0,500
1,000
1,500
2,000
2,500
No
v 0
1, 2
01
3N
ov
11
, 20
13
No
v 2
1, 2
01
3D
ec
01
, 20
13
De
c 1
1, 2
01
3D
ec
21
, 20
13
De
c 3
1, 2
01
3Ja
n 1
0, 2
01
4Ja
n 2
0, 2
01
4Ja
n 3
0, 2
01
4Fe
b 0
9, 2
01
4Fe
b 1
9, 2
01
4M
ar 0
1, 2
01
4M
ar 1
1, 2
01
4M
ar 2
1, 2
01
4M
ar 3
1, 2
01
4A
pr
10
, 20
14
Ap
r 2
0, 2
01
4A
pr
30
, 20
14
May
10
, 20
14
May
20
, 20
14
May
30
, 20
14
Jun
09
, 20
14
Jun
19
, 20
14
Jun
29
, 20
14
Jul 0
9, 2
01
4Ju
l 19
, 20
14
Jul 2
9, 2
01
4A
ug
08
, 20
14
Au
g 1
8, 2
01
4A
ug
28
, 20
14
Sep
07
, 20
14
Sep
17
, 20
14
Sep
27
, 20
14
Oct
07
, 20
14
Oct
17
, 20
14
Oct
27
, 20
14
%
7 day Avg 30 day Avg
Moving Average of Page Engagement Rate
0,0000,5001,0001,5002,0002,5003,0003,500
No
v 0
1, 2
01
3N
ov
11
, 20
13
No
v 2
1, 2
01
3D
ec
01
, 20
13
De
c 1
1, 2
01
3D
ec
21
, 20
13
De
c 3
1, 2
01
3Ja
n 1
0, 2
01
4Ja
n 2
0, 2
01
4Ja
n 3
0, 2
01
4Fe
b 0
9, 2
01
4Fe
b 1
9, 2
01
4M
ar 0
1, 2
01
4M
ar 1
1, 2
01
4M
ar 2
1, 2
01
4M
ar 3
1, 2
01
4A
pr
10
, 20
14
Ap
r 2
0, 2
01
4A
pr
30
, 20
14
May
10
, 20
14
May
20
, 20
14
May
30
, 20
14
Jun
09
, 20
14
Jun
19
, 20
14
Jun
29
, 20
14
Jul 0
9, 2
01
4Ju
l 19
, 20
14
Jul 2
9, 2
01
4A
ug
08
, 20
14
Au
g 1
8, 2
01
4A
ug
28
, 20
14
Sep
07
, 20
14
Sep
17
, 20
14
Sep
27
, 20
14
Oct
07
, 20
14
Oct
17
, 20
14
Oct
27
, 20
14
%
7 day Avg 30 day Avg
Activity Overview
Avg Post ER (30-Day)
1,1085 % Max Post ER (30-Day)
1,4525 % Friday Jul 18, 2014
Avg Page ER (30-Day)
1,1085 % Max Page ER (30-Day)
1,8681 % Saturday Jul 19, 2014

2. Hashtag tracking

Hashtag
#joingermantradition

3. Blogger campaigns

Blog trip for
#joingermantradition
Content for our campaign website
www.germany,travel/joingermantradition
Over 200 Instagrams with 64,110 Likes
Tweets and interactions with their followers on Twitter generated
26 million impressions (or ‘opportunities-to-see), reaching 2.6
million Twitter accounts
503 original tweets from the bloggers resulted in 934 retweets
and 88 replies
Overall the hashtag generated 46.4 million opportunities to see
(OTS) across Twitter, Facebook, Instagram and Google+
Social media coverage generated an AVE of EUR 717,484.-. In
other words, the #JoinGermanTradition socialmedia coverage
during this period was equivalent to an advertising spend of EUR
717,484.-.

4. Where it all comes together:
Cross-media campaigns

Website with
interactive map to
post your own
POIs
Free Wi-Fi app to find
free-access Wi-Fi
hotspots in Germany
Blogs to inform
and inspire
Youth HotSpots Germany

Youth HotSpots
Germany

Visits website:
260.000
Page Impressions:
483.044
User-HotSpots on website:
1.800
Blog posts on website:
300
Downloads App:
75.000
Youth HotSpots
Germany (March – December)

2013 volume of younger holiday
travelers from Europe to Germany
increased above average
+8.1%
+10.0%
-2.3%
+6.2%
age 15 - 34 years
age 35 - 54 years
age 55 years and older
all age groups
-3% -1% 1% 3% 5% 7% 9%
Change holiday trips 2013/2012
Average age of holiday
travelers from Europe
to Germany:
2013 42.2 years
(2012 42.7 years) Source: GNTB/WTM, IPK 2014, figures are rounded
“The price of light is less than the
cost of darkness.” Arthur C. Nielsen, Market Researcher & Founder of
ACNielsen