Embed Size (px)
Citation preview

High-Velocity Big Data AnalyticsApril 2015
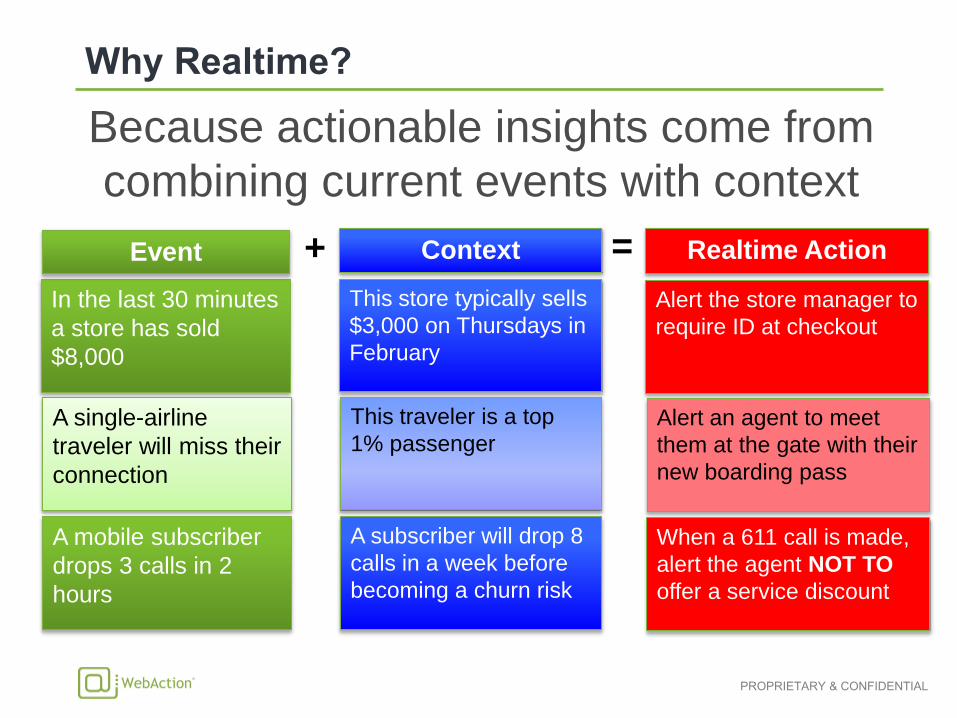
Because actionable insights come from
combining current events with context
In the last 30 minutes
a store has sold
$8,000
This store typically sells
$3,000 on Thursdays in
February
Alert the store manager to
require ID at checkout
A single-airline
traveler will miss their
connection
This traveler is a top
1% passengerAlert an agent to meet
them at the gate with their
new boarding pass
A mobile subscriber
drops 3 calls in 2
hours
A subscriber will drop 8
calls in a week before
becoming a churn risk
When a 611 call is made,
alert the agent NOT TO
offer a service discount
Context Realtime Action+ =Event

• Reduce the latency to Capture, Analyze, and
ultimately take Action
Business event
Decision
latency
Busin
ess V
alu
e
Time to Action
Action taken
Data analyzed
Data captured
Based on concept developed by Richard Hackathorn, Bolder Technology

Client
Server OLTP
Data Warehouse
ApplicationServer
Transaction Data

Data Warehouse
Device Data
Industry Data
Social Feeds
Transaction Data
System/ IT Data
Hadoop
ETL

ETL (existing)
Data
Warehouse
Realtime
Applications
Legacy
Applications
Hive
MapReduce
Applications
Users
Hadoop
Device Data
Industry Data
Social Feeds
Transaction Data
System / IT Data
Pig
BatchStreaming
WebAction

Structured and
unstructured data
Distributed,
in-memory, as data
is created
Correlated, enriched,
and filtered real-time
big data records
Deliver
Process
Assimilate

Data from transactional sources is acquired via redo or transaction logs
Structured and non-Structured data
No Production Impact
No Application changes
Device Data
Industry Data
Social Feeds
Real-Time
Transaction Data
System/ IT Data
Common File
Format
TYPE EXAMPLE COMPLEXITY
CSV, JSON, XML
Facebook, Twitter
Syslogs, weblogs, event logs
SmartMeter, Medical Device, RFID, Netflow,
iBeacon, CDR
SWIFT, HL7, FIX, ASN
Oracle, DB2, SQLServer, MySQL, HP NonStop
SIMPLE
VERY HIGH
SIMPLE TO MEDIUM
MEDIUM
MEDIUM
HIGH
Structured and
unstructured data
Assimilate

Distributed,
in-memory, as data
is created
Process
Enrich live Big Data with historical data sources
Process Big Data faster using partitioned streams, caches, and additional nodes
Execute SQL-like queries of in-memory Big Data
Alert in real-time based on predictive analytic model results
Structured and
unstructured data
Assimilate

Structured and
unstructured data
Distributed,
in-memory, as data
is created
Correlated, enriched,
and filtered real-time
big data records
Deliver
Process
Assimilate
Continuous Big Data Records
Realtime Drag & Drop Dashboards
Predictive Alerts
Business Trends
Data Patterns
Outliers

Device DataBig Data
Infrastructure
Industry Data
Social Feeds
Transaction Data
Enterprise Apps
& Workflows
Enterprise Data
Warehouse
RDBMS
Stream Analytics Applications
System/ IT Data
Hig
h S
pe
ed
Data
Ac
qu
isitio
n
Command Line Visual Designer
CREATE APPLICATION MultiLogApp;
CREATE FLOW MonitorLogs;
CREATE SOURCE AccessLogSource
USING…
CREATE TYPE AccessLogEntry …
CREATE STREAM AccessStream OF…
CREATE CQ ParseAccessLog …
W >
Results
Persistence
Context
Cache
Distributed
Results
Cache
Distributed Query
Processor
External
Targets &
Alerts
Event
Windows
Node: n2
1
Drag & Drop
Stream
Dashboards
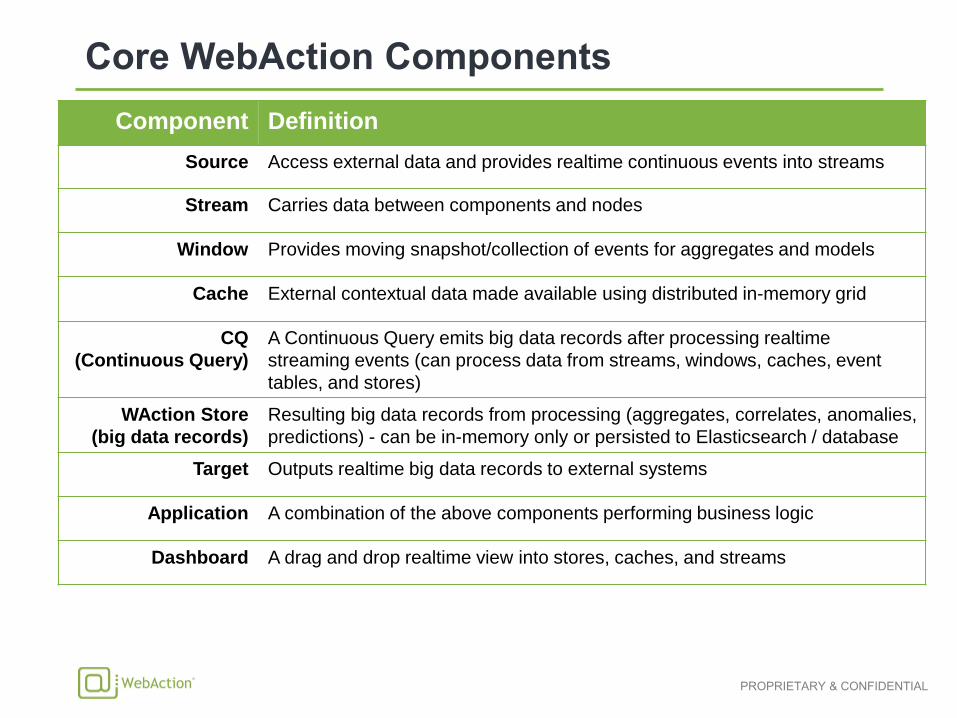
Component Definition
Source Access external data and provides realtime continuous events into streams
Stream Carries data between components and nodes
Window Provides moving snapshot/collection of events for aggregates and models
Cache External contextual data made available using distributed in-memory grid
CQ
(Continuous Query)
A Continuous Query emits big data records after processing realtime
streaming events (can process data from streams, windows, caches, event
tables, and stores)
WAction Store
(big data records)
Resulting big data records from processing (aggregates, correlates, anomalies,
predictions) - can be in-memory only or persisted to Elasticsearch / database
Target Outputs realtime big data records to external systems
Application A combination of the above components performing business logic
Dashboard A drag and drop realtime view into stores, caches, and streams


• Create Applications
• Add & Navigate through Flows
• Design Data Model
• Drag & Drop Components
• Configure Components
• Deploy Applications
• Start / Stop Applications
• View Alerts
• View Event Flow Rate

• Add a new application
• Add a source (CDC, structured, semi-structured, etc.)
• Configure Source

• Add a typed stream
• Add a CQ to transform data types
• Add a Cache and CQ for context enrichment


• Design dashboard• Create multiple pages / drilldowns• Define data through queries• Drag and drop visualizations: Values / Icons / Gauges – Maps – Line Charts –
Scatter / Bubble Plots – Pie / Donut Charts – Bar Charts – Tables – Heat Maps

• Add a new Dashboard
• Add a Visualization
• Configure Query and Visualization

• View Data Visualized
• Filter data in a page
• Drilldown to related and detail pages

• Very high speed data distribution at millions of events/s
• Realtime log / database CDC reading in addition to push sources like
TCP/JMS
• Highly optimized data serialization
• Distribution based on consistent hashing mechanism for streams and
caches
• Bytecode generation for data types and query processing
• Democratic clustering and service management paradigm
• Scaling across multiple nodes with flexible deployment
• Auto failover of application components from one node to another
• Nodes can be added and removed while applications are running
• Recovery ensures no events are missed or processed twice
• Recovery takes window contents into account
• Role based security at the application through component level
• Integrated realtime dashboard visualizations using server push