Embed Size (px)
Citation preview
USA Tourism Trends & Statistics
April 2013
Did You Know?
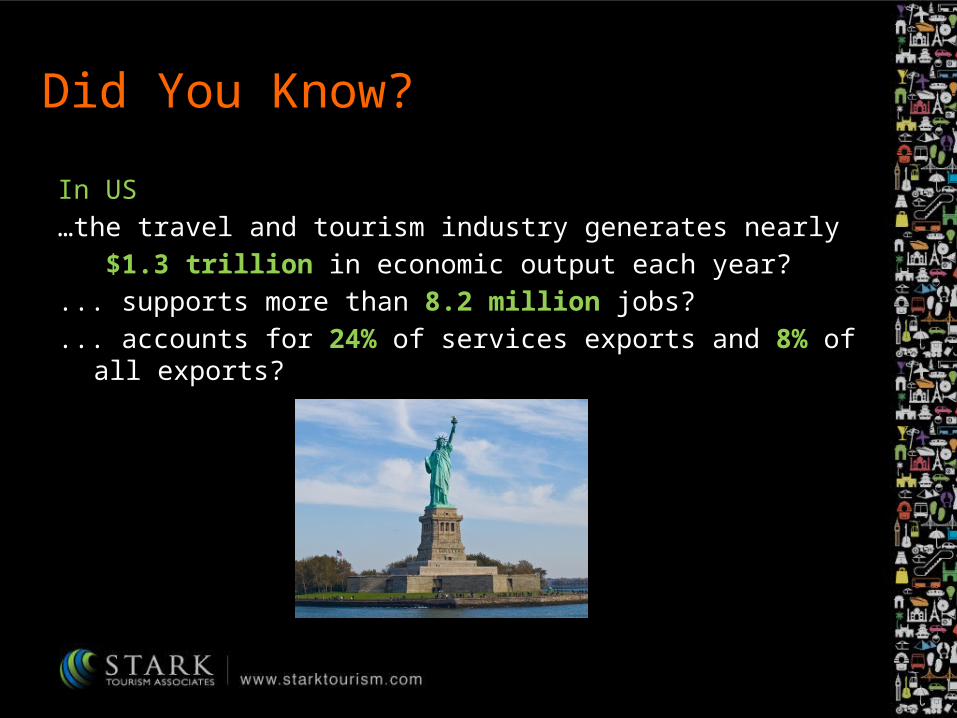
In US…the travel and tourism industry generates nearly $1.3 trillion in economic output each year?... supports more than 8.2 million jobs?... accounts for 24% of services exports and 8% of all exports?
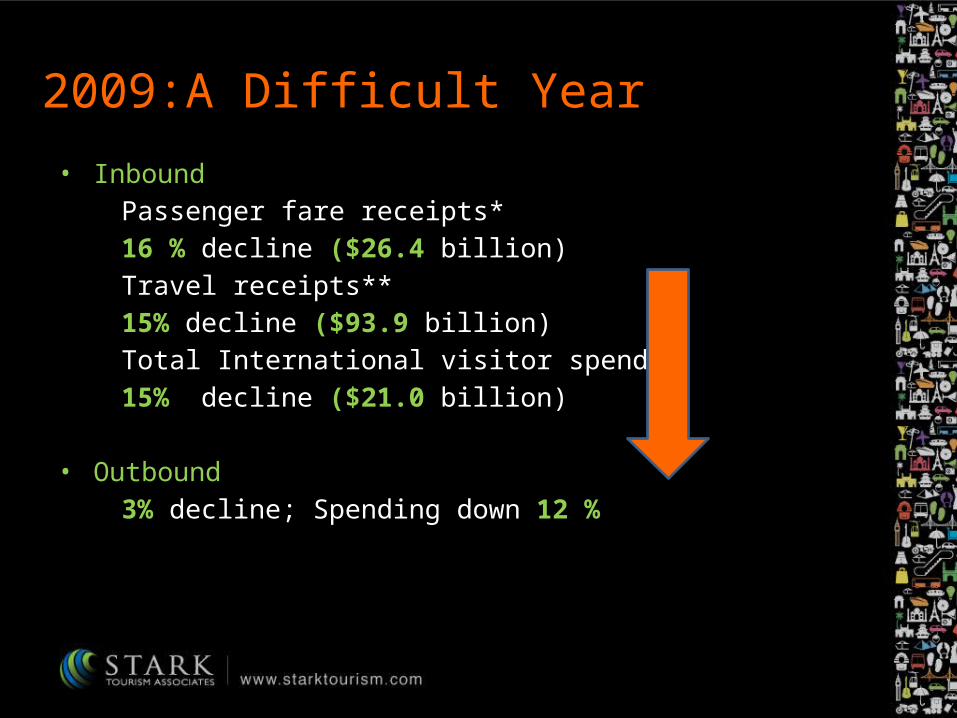
2009:A Difficult Year
• Inbound Passenger fare receipts* 16 % decline ($26.4 billion) Travel receipts** 15% decline ($93.9 billion) Total International visitor spend 15% decline ($21.0 billion)
• Outbound 3% decline; Spending down 12 %
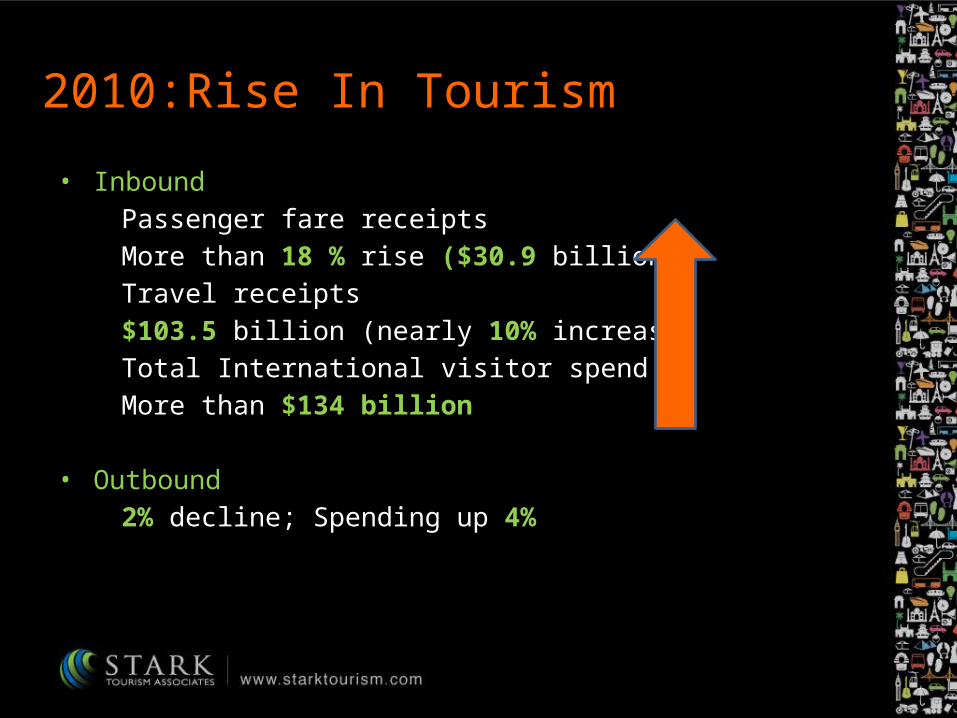
2010:Rise In Tourism
• Inbound Passenger fare receipts More than 18 % rise ($30.9 billion) Travel receipts $103.5 billion (nearly 10% increase) Total International visitor spend More than $134 billion
• Outbound 2% decline; Spending up 4%
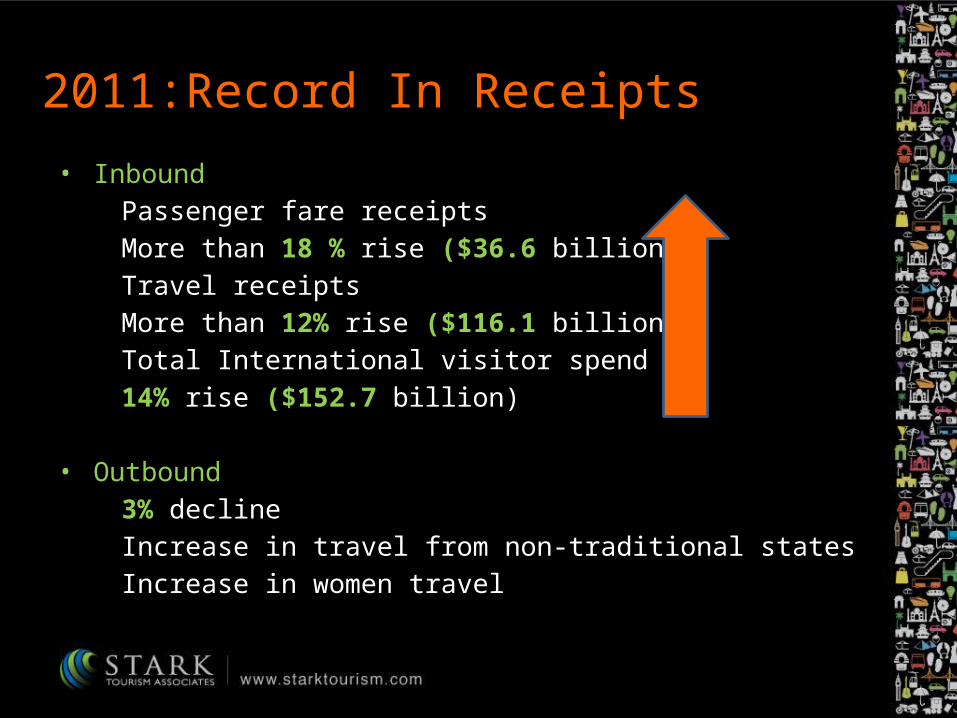
2011:Record In Receipts
• Inbound Passenger fare receipts More than 18 % rise ($36.6 billion) Travel receipts More than 12% rise ($116.1 billion) Total International visitor spend 14% rise ($152.7 billion)
• Outbound 3% decline Increase in travel from non-traditional states Increase in women travel
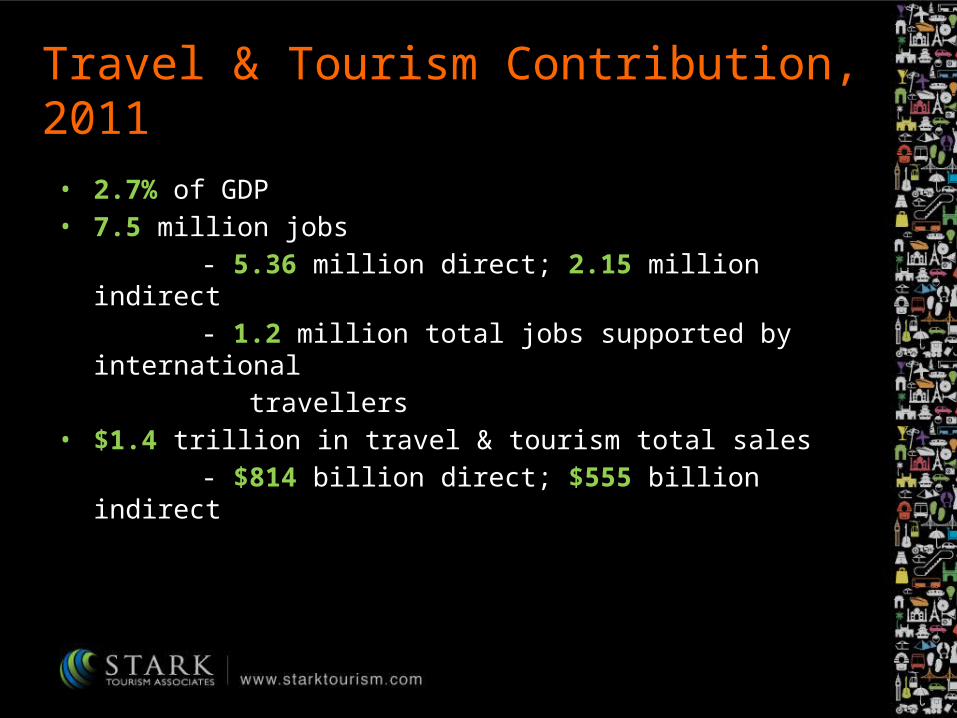
Travel & Tourism Contribution, 2011
• 2.7% of GDP• 7.5 million jobs - 5.36 million direct; 2.15 million indirect - 1.2 million total jobs supported by international travellers• $1.4 trillion in travel & tourism total sales - $814 billion direct; $555 billion indirect
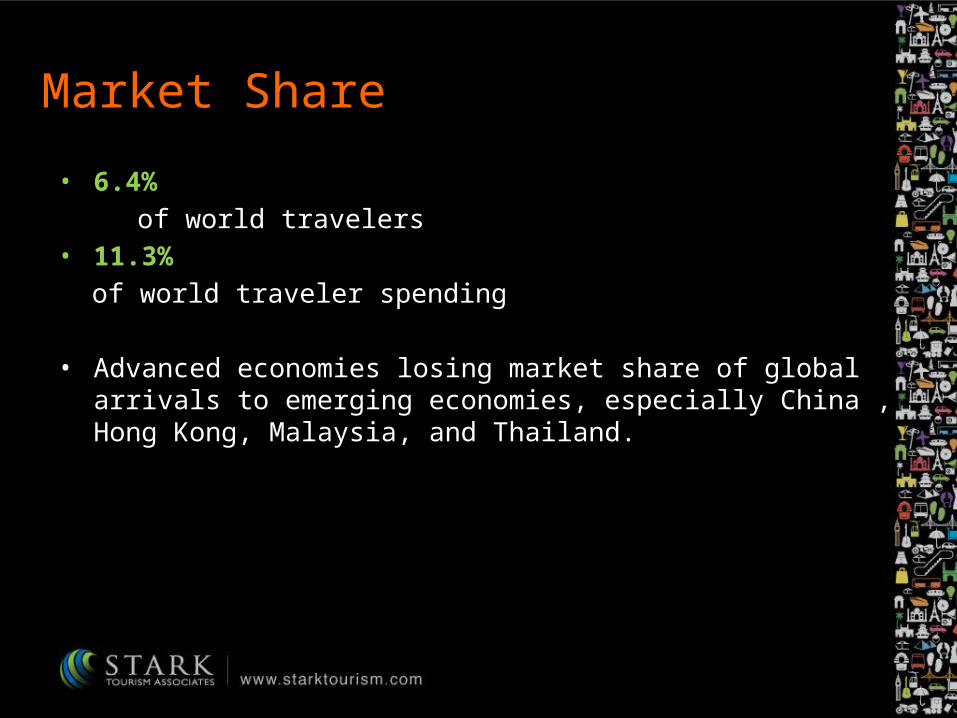
Market Share
• 6.4% of world travelers • 11.3% of world traveler spending
• Advanced economies losing market share of global arrivals to emerging economies, especially China , Hong Kong, Malaysia, and Thailand.
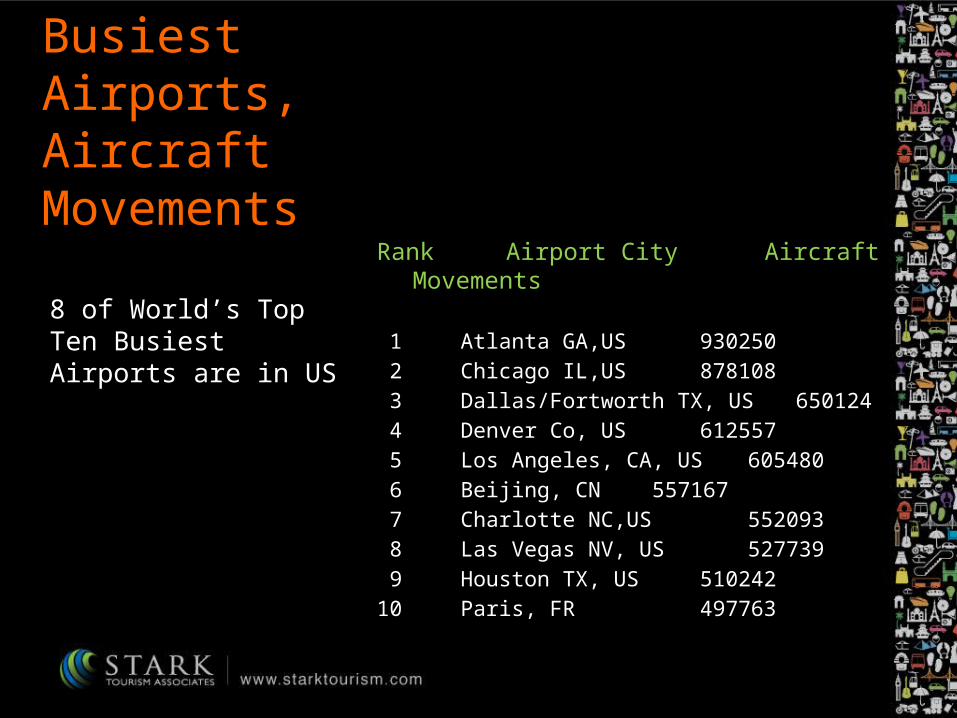
Busiest Airports, Aircraft Movements
Rank Airport City Aircraft Movements 1 Atlanta GA,US 930250 2 Chicago IL,US 878108 3 Dallas/Fortworth TX, US 650124 4 Denver Co, US 612557 5 Los Angeles, CA, US 605480 6 Beijing, CN 557167 7 Charlotte NC,US 552093 8 Las Vegas NV, US 527739 9 Houston TX, US 51024210 Paris, FR 497763
8 of World’s Top Ten Busiest Airports are in US
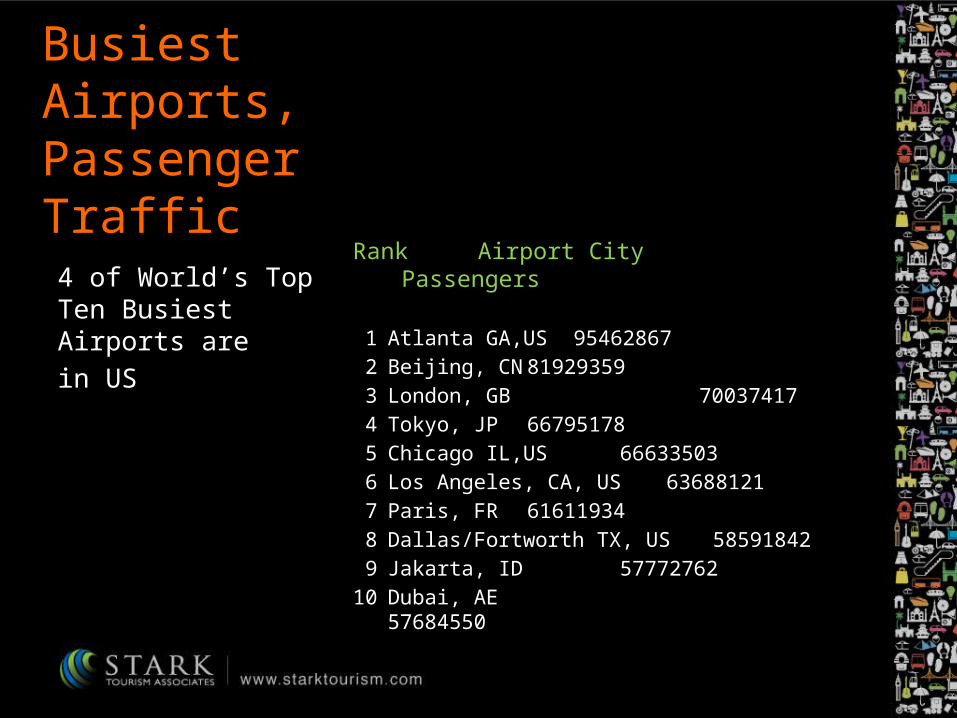
Busiest Airports, Passenger Traffic
Rank Airport City Passengers
1 Atlanta GA,US 95462867 2 Beijing, CN 81929359 3 London, GB 70037417 4 Tokyo, JP 66795178 5 Chicago IL,US 66633503 6 Los Angeles, CA, US 63688121 7 Paris, FR 61611934 8 Dallas/Fortworth TX, US 58591842 9 Jakarta, ID 5777276210 Dubai, AE 57684550
4 of World’s Top Ten Busiest Airports are in US
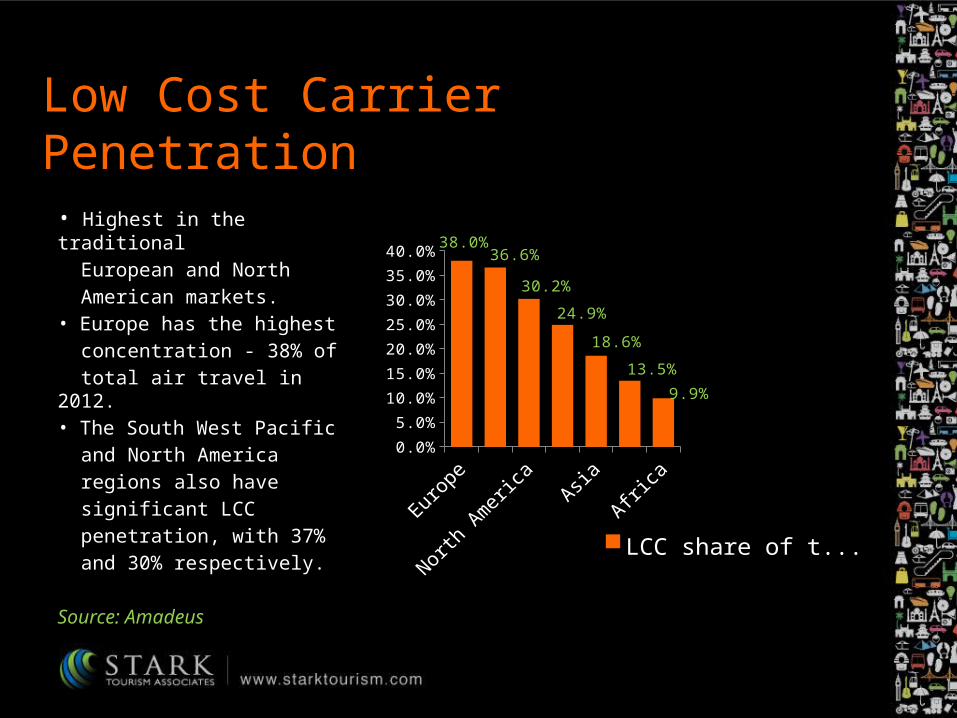
Low Cost Carrier Penetration• Highest in the traditional European and North American markets. • Europe has the highest concentration - 38% of total air travel in 2012. • The South West Pacific and North America regions also have significant LCC penetration, with 37% and 30% respectively.
Source: Amadeus
0.0%
5.0%
10.0%
15.0%
20.0%
25.0%
30.0%
35.0%
40.0%38.0%
36.6%
30.2%
24.9%
18.6%
13.5%
9.9%
LCC share of traffic 2012
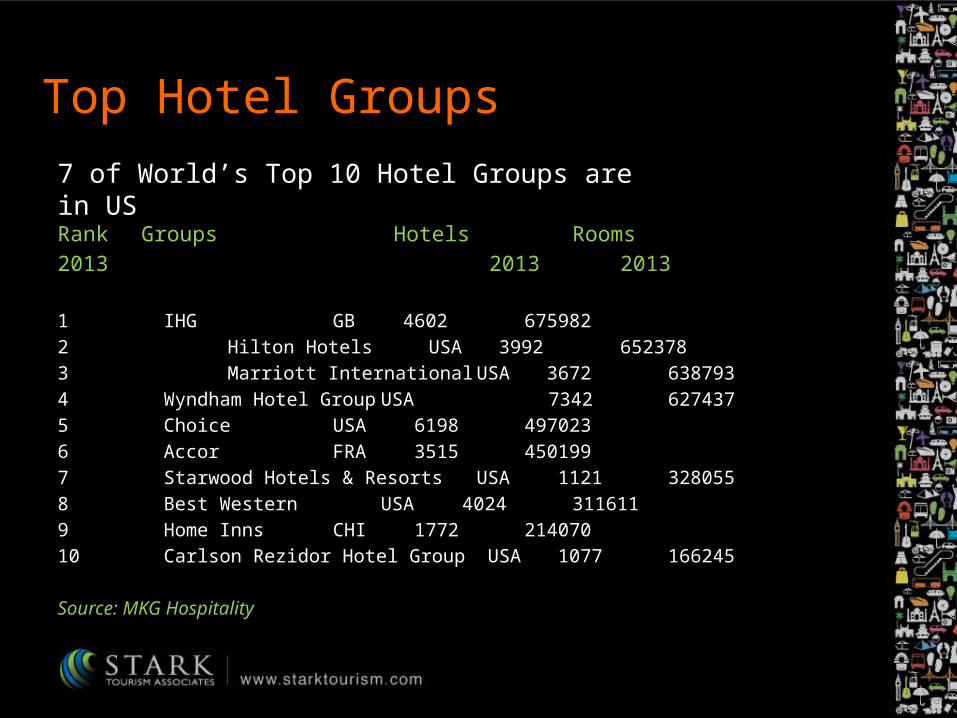
Top Hotel Groups
Rank Groups Hotels Rooms2013 2013 2013
1 IHG GB 4602 6759822 Hilton Hotels USA 3992 6523783 Marriott International USA 3672 6387934 Wyndham Hotel Group USA 7342 6274375 Choice USA 6198 4970236 Accor FRA 3515 4501997 Starwood Hotels & Resorts USA 1121 3280558 Best Western USA 4024 3116119 Home Inns CHI 1772 21407010 Carlson Rezidor Hotel Group USA 1077 166245
Source: MKG Hospitality
7 of World’s Top 10 Hotel Groups are in US
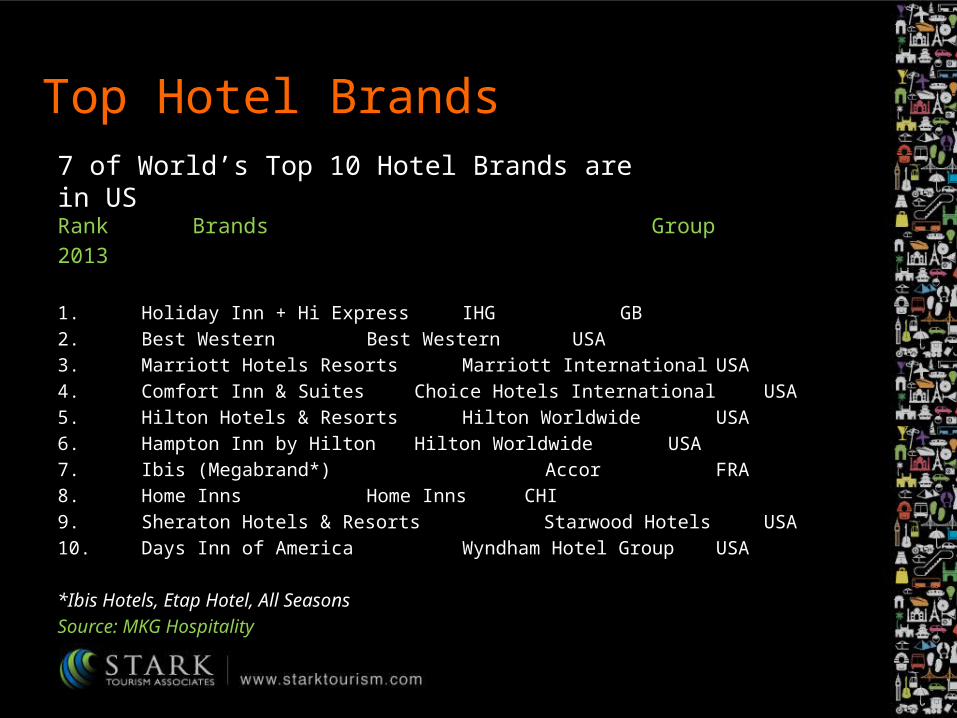
Top Hotel Brands
Rank Brands Group 2013
1. Holiday Inn + Hi Express IHG GB2. Best Western Best Western USA3. Marriott Hotels Resorts Marriott International USA4. Comfort Inn & Suites Choice Hotels International USA5. Hilton Hotels & Resorts Hilton Worldwide USA 6. Hampton Inn by Hilton Hilton Worldwide USA 7. Ibis (Megabrand*) Accor FRA8. Home Inns Home Inns CHI9. Sheraton Hotels & Resorts Starwood Hotels USA 10. Days Inn of America Wyndham Hotel Group USA
*Ibis Hotels, Etap Hotel, All SeasonsSource: MKG Hospitality
7 of World’s Top 10 Hotel Brands are in US
US Outbound
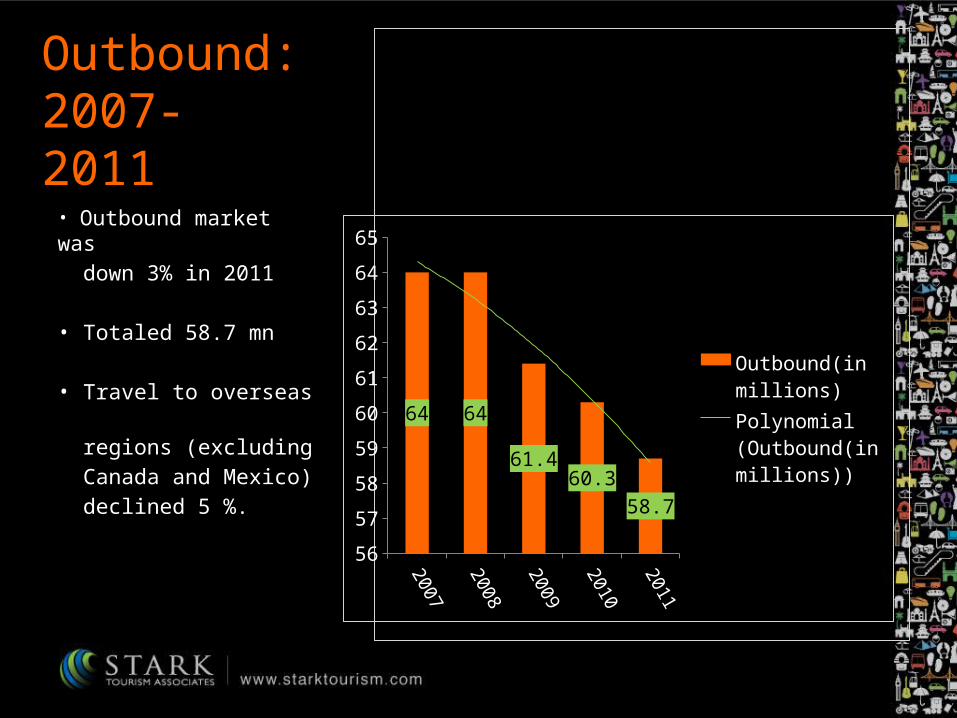
Outbound: 2007- 2011
Chart Title
• Outbound market was down 3% in 2011
• Totaled 58.7 mn
• Travel to overseas regions (excluding Canada and Mexico) declined 5 %.
2007
2008
2009
2010
2011
56
57
58
59
60
61
62
63
64
65
64 64
61.460.3
58.7
Outbound(in millions)Polynomial (Outbound(in millions))
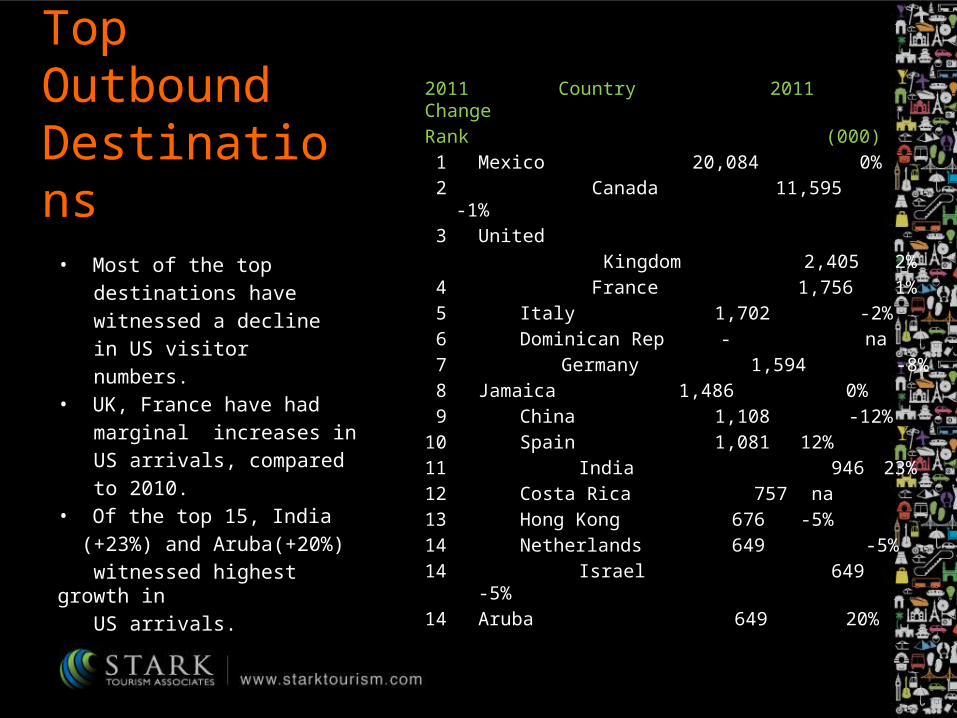
Top Outbound Destinations• Most of the top destinations have witnessed a decline in US visitor numbers.• UK, France have had marginal increases in US arrivals, compared to 2010.• Of the top 15, India (+23%) and Aruba(+20%) witnessed highest growth in US arrivals.
2011 Country 2011 ChangeRank (000) 1 Mexico 20,084 0% 2 Canada 11,595 -1% 3 United Kingdom 2,405 2% 4 France 1,756 1% 5 Italy 1,702 -2% 6 Dominican Rep - na 7 Germany 1,594 -8% 8 Jamaica 1,486 0% 9 China 1,108 -12%10 Spain 1,081 12%11 India 946 23%12 Costa Rica 757 na13 Hong Kong 676 -5%14 Netherlands 649 -5%14 Israel 649 -5%14 Aruba 649 20%
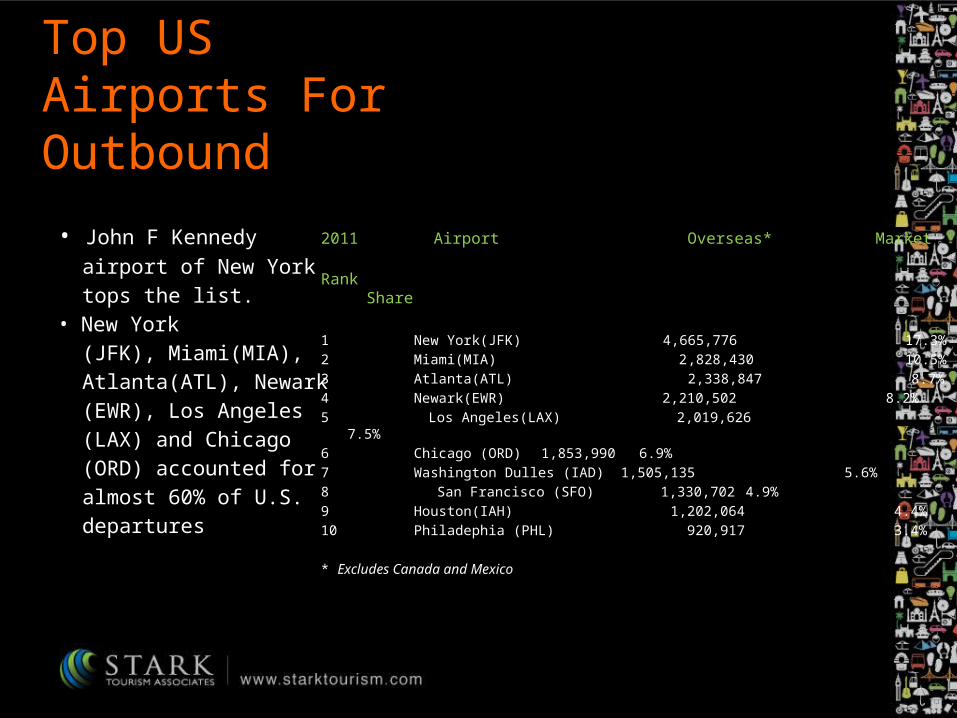
Top US Airports For Outbound
• John F Kennedy airport of New York tops the list.• New York (JFK), Miami(MIA), Atlanta(ATL), Newark (EWR), Los Angeles (LAX) and Chicago (ORD) accounted for almost 60% of U.S. departures
2011 Airport Overseas* Market Rank Share
1 New York(JFK) 4,665,776 17.3%2 Miami(MIA) 2,828,430 10.5%3 Atlanta(ATL) 2,338,847 8.7%4 Newark(EWR) 2,210,502 8.2%5 Los Angeles(LAX) 2,019,626 7.5%6 Chicago (ORD) 1,853,990 6.9%7 Washington Dulles (IAD) 1,505,135 5.6%8 San Francisco (SFO) 1,330,702 4.9%9 Houston(IAH) 1,202,064 4.4%10 Philadephia (PHL) 920,917 3.4%
* Excludes Canada and Mexico
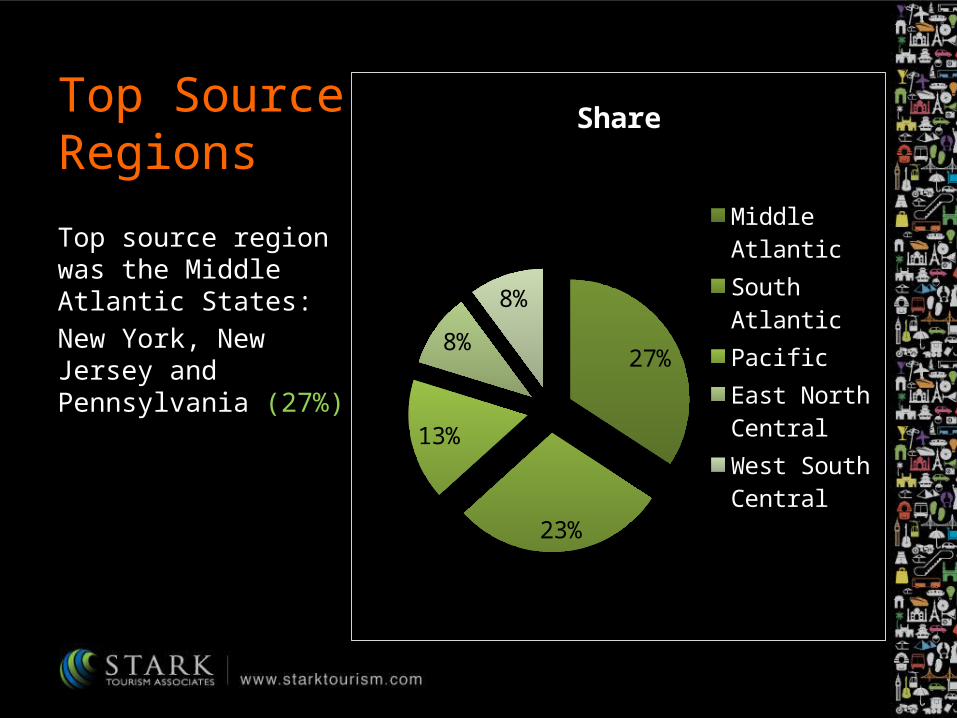
Top Source Regions
27%
23%
13%
8%
8%
Share
Middle AtlanticSouth AtlanticPacific East North CentralWest South Central
Top source region was the Middle Atlantic States:New York, New Jersey and Pennsylvania (27%)
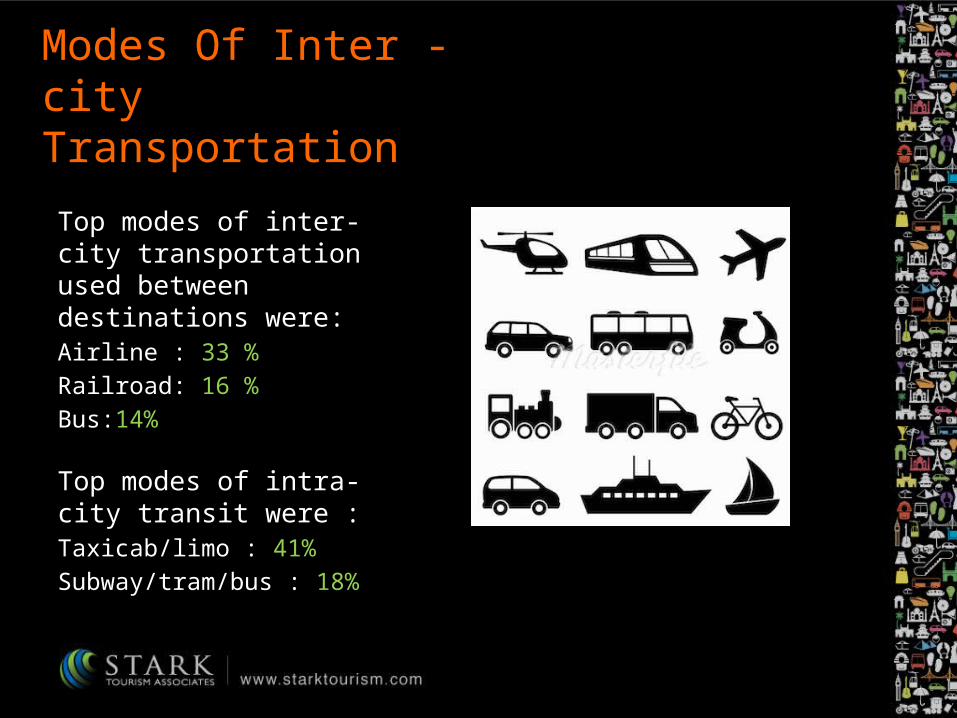
Modes Of Inter - city Transportation
Top modes of inter-city transportation used between destinations were:Airline : 33 % Railroad: 16 %Bus:14%
Top modes of intra-city transit were :Taxicab/limo : 41%Subway/tram/bus : 18%
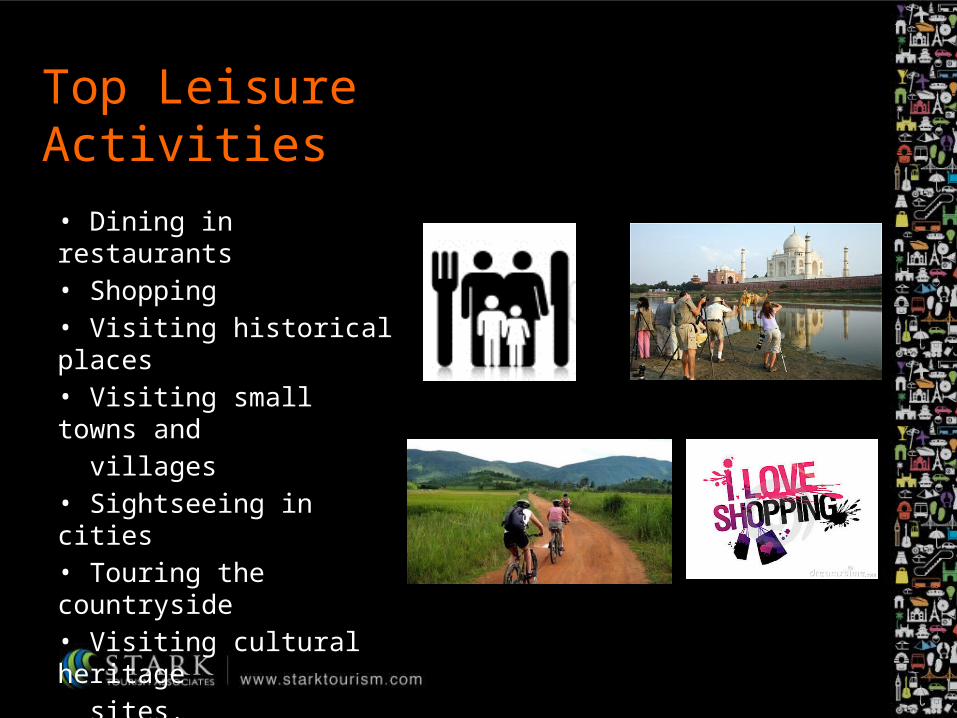
Top Leisure Activities• Dining in restaurants • Shopping• Visiting historical places • Visiting small towns and villages • Sightseeing in cities• Touring the countryside • Visiting cultural heritage sites.
Spending Abroad
• Spending by US residents travelling abroad: $109.8 billion; up 7%
• Spending within foreign countries: $78.7 billion, up 3 %.
• Spending on transportation, via foreign carriers: $31.1 billion, up 5%.
• Top countries for U.S. spending:
Mexico ($9.3 bn) The United Kingdom ($8.7 bn) Canada ($7.7 bn) Germany ($5.6 bn) Japan ($5.0 bn)
Profile Of Overseas Travellers
• Advance trip decision time: 95 days, in 2011
• Airline reservation time: 63 days, in 2011
• Pre paid package usage: grew to 13% of US travellers in 2011.
• Percentage visiting one destination: 65% in 2011.
• Percentage visiting three or more destinations:16% in 2011.
• Percentage on their first international trip: 7%, up one point from 2010.
• The average length of trip (number of nights) outside US: increased to 19.6 nights in 2010, up one night.
• Average number of international trips taken: 2.4, same as in 2010.
US Inbound
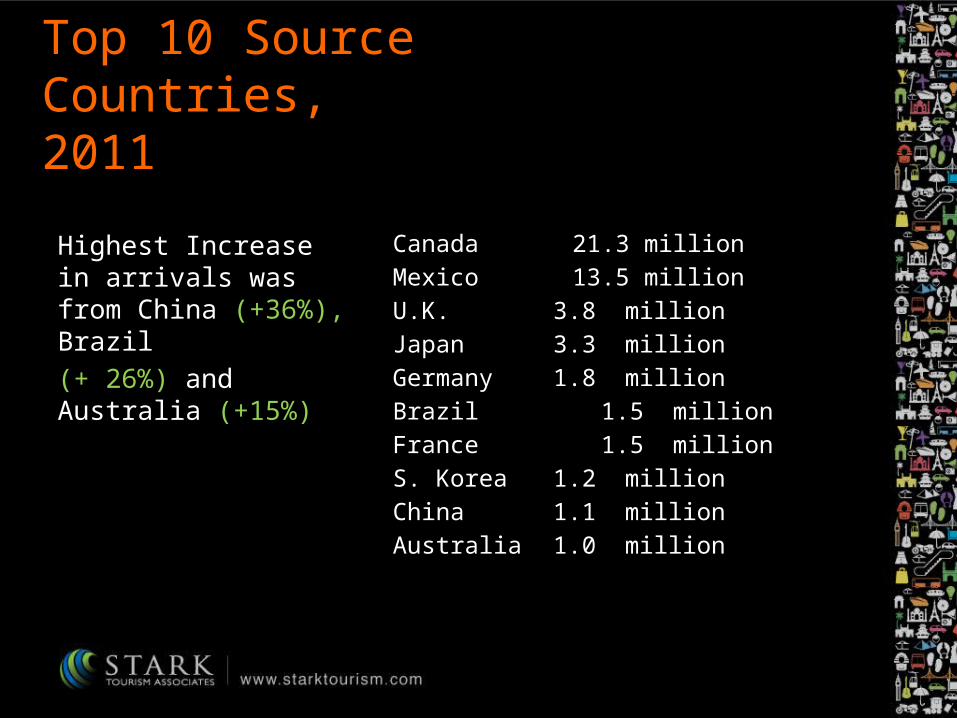
Top 10 Source Countries, 2011
Canada 21.3 million Mexico 13.5 million U.K. 3.8 million Japan 3.3 million Germany 1.8 million Brazil 1.5 million France 1.5 million S. Korea 1.2 million China 1.1 million Australia 1.0 million
Highest Increase in arrivals was from China (+36%), Brazil (+ 26%) and Australia (+15%)
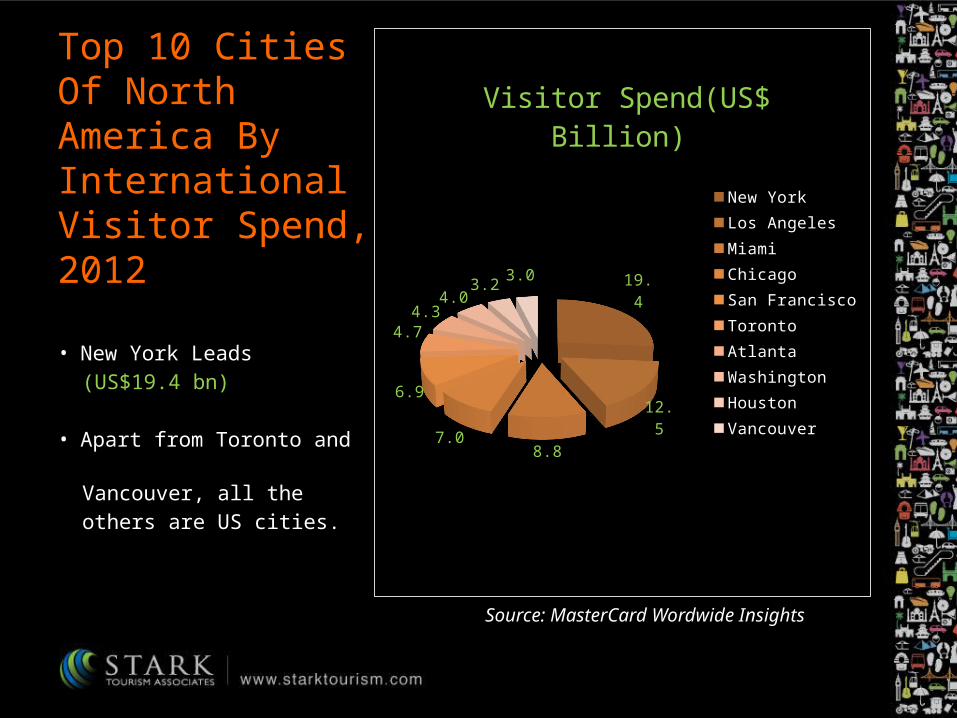
Top 10 Cities Of North America By International Visitor Spend, 2012
19.4
12.5
8.87.0
6.9
4.74.3
4.03.2
3.0
Visitor Spend(US$ Billion)
New YorkLos AngelesMiamiChicagoSan FranciscoTorontoAtlantaWashingtonHoustonVancouver
• New York Leads (US$19.4 bn)
• Apart from Toronto and Vancouver, all the others are US cities.
Source: MasterCard Wordwide Insights
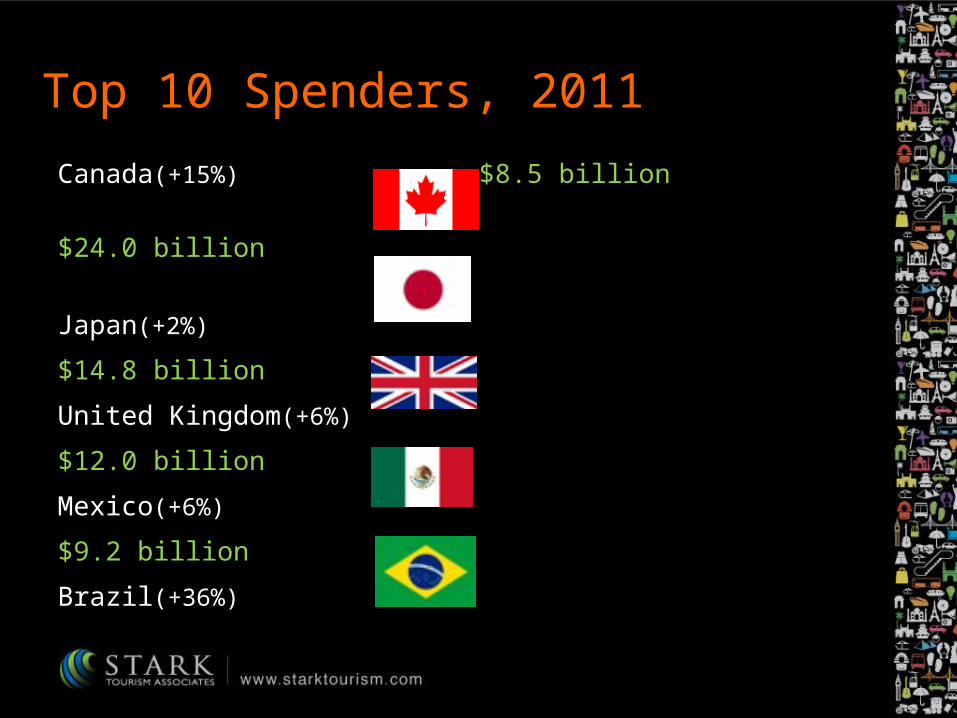
Top 10 Spenders, 2011
Canada(+15%)
$24.0 billion
Japan(+2%)
$14.8 billion
United Kingdom(+6%)
$12.0 billion
Mexico(+6%)
$9.2 billion
Brazil(+36%)
$8.5 billion
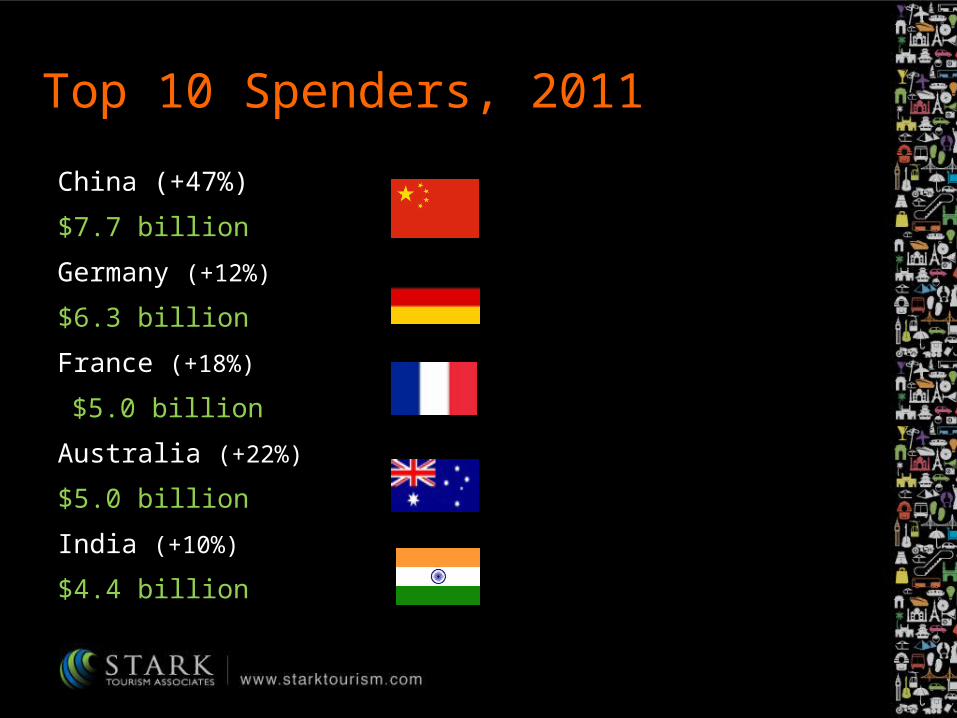
Top 10 Spenders, 2011
China (+47%)
$7.7 billion
Germany (+12%)
$6.3 billion
France (+18%)
$5.0 billion
Australia (+22%)
$5.0 billion
India (+10%)
$4.4 billion

Travel Trends
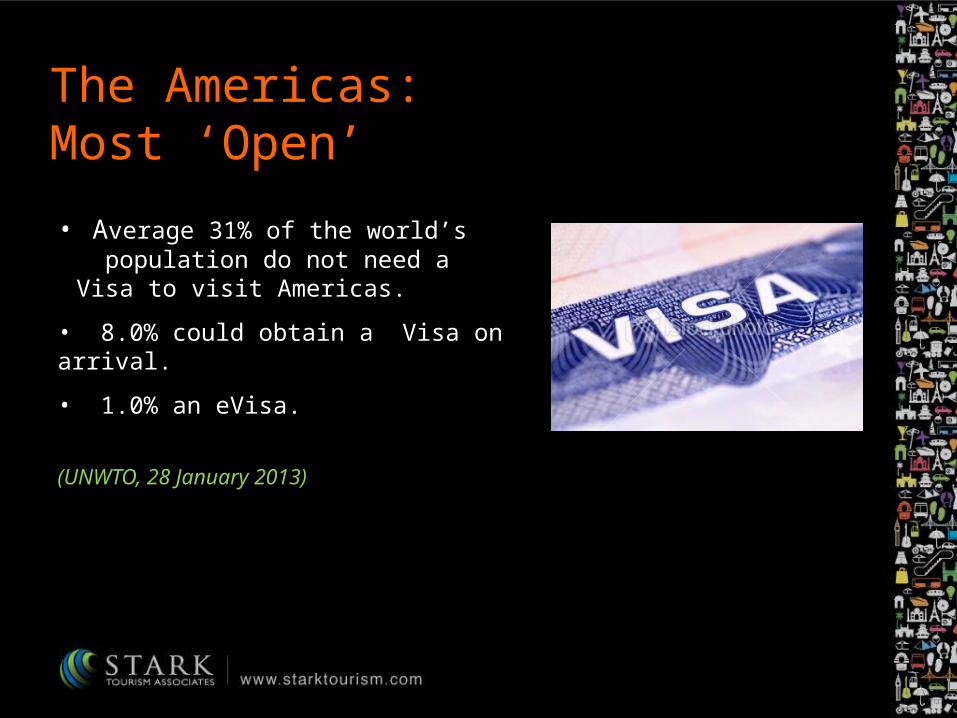
The Americas: Most ‘Open’
• Average 31% of the world’s population do not need a Visa to visit Americas.
• 8.0% could obtain a Visa on arrival.
• 1.0% an eVisa.
(UNWTO, 28 January 2013)
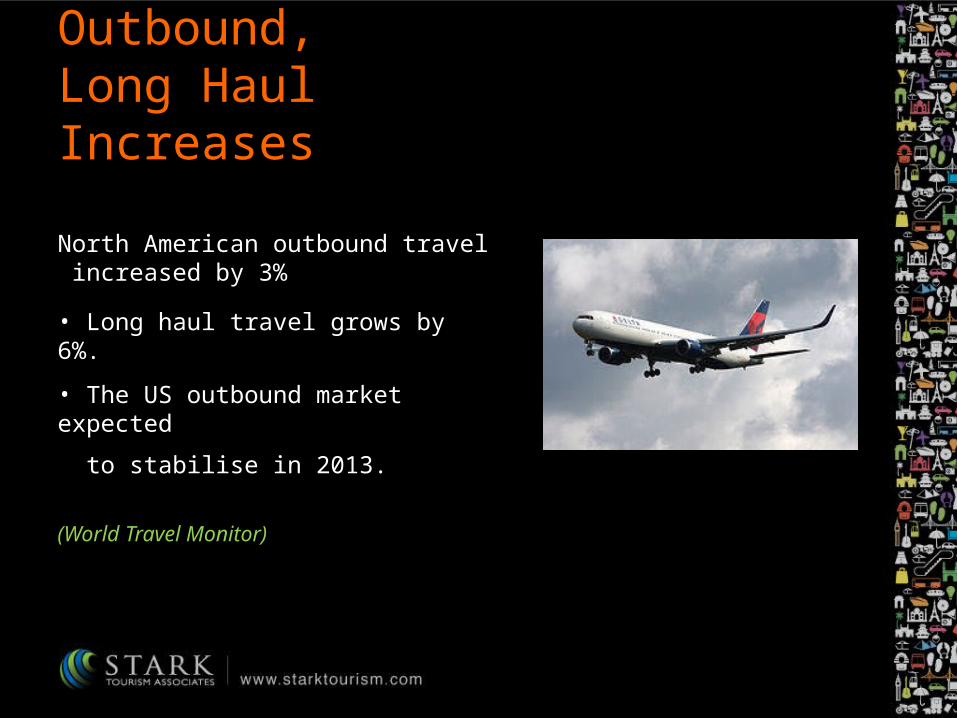
Outbound, Long Haul Increases
North American outbound travel increased by 3%
• Long haul travel grows by 6%.
• The US outbound market expected
to stabilise in 2013.
(World Travel Monitor)
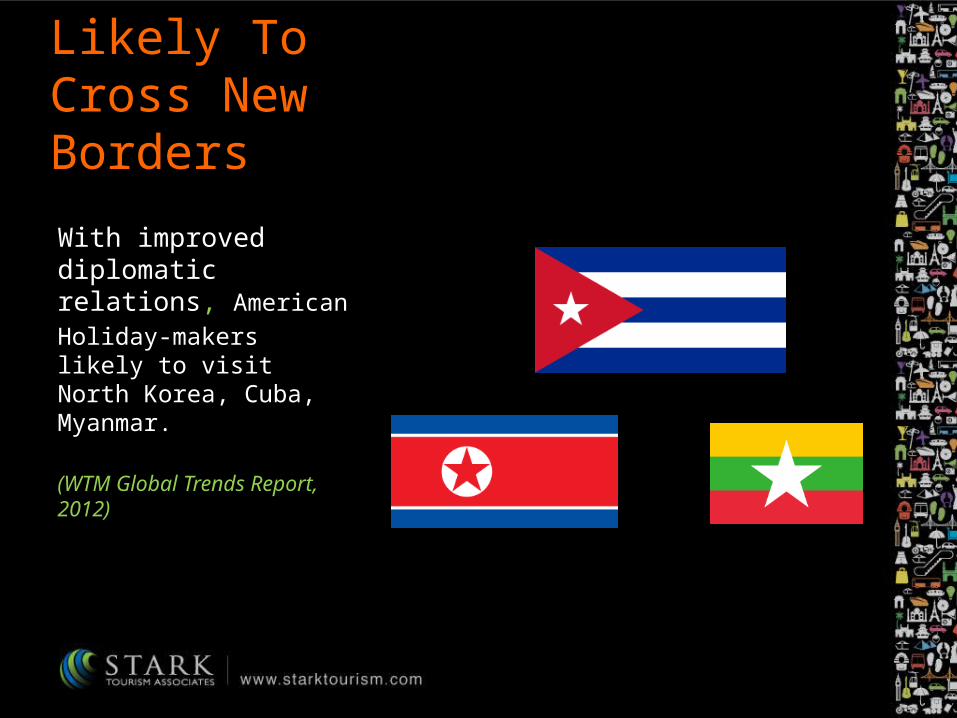
Likely To Cross New Borders
With improved diplomatic relations, American Holiday-makers likely to visit North Korea, Cuba, Myanmar.
(WTM Global Trends Report, 2012)
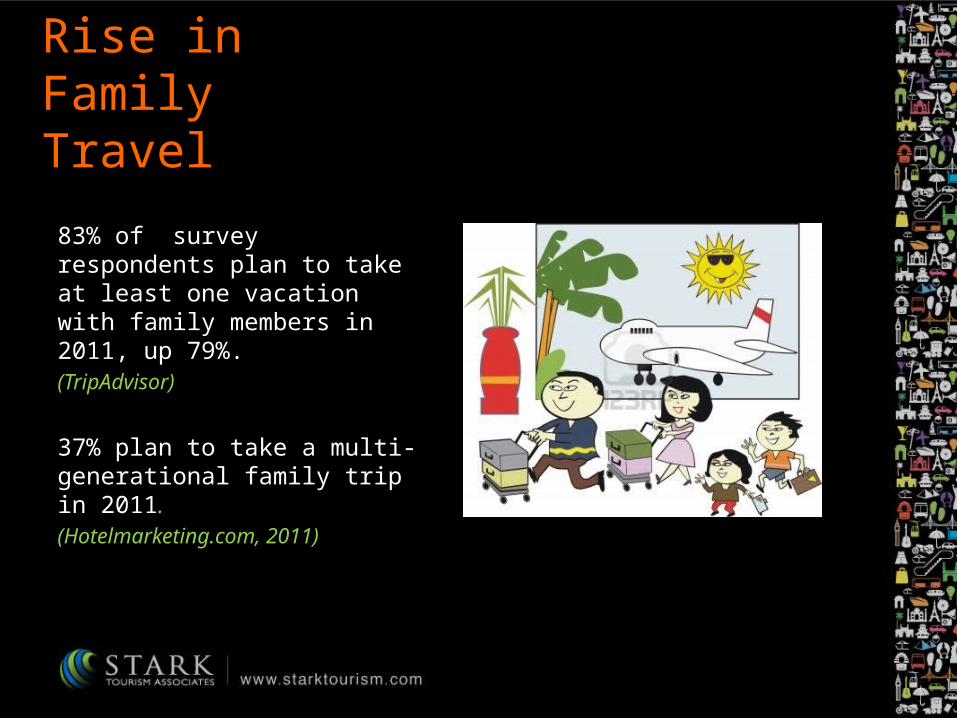
Rise in Family Travel
83% of survey respondents plan to take at least one vacation with family members in 2011, up 79%. (TripAdvisor)
37% plan to take a multi-generational family trip in 2011. (Hotelmarketing.com, 2011)
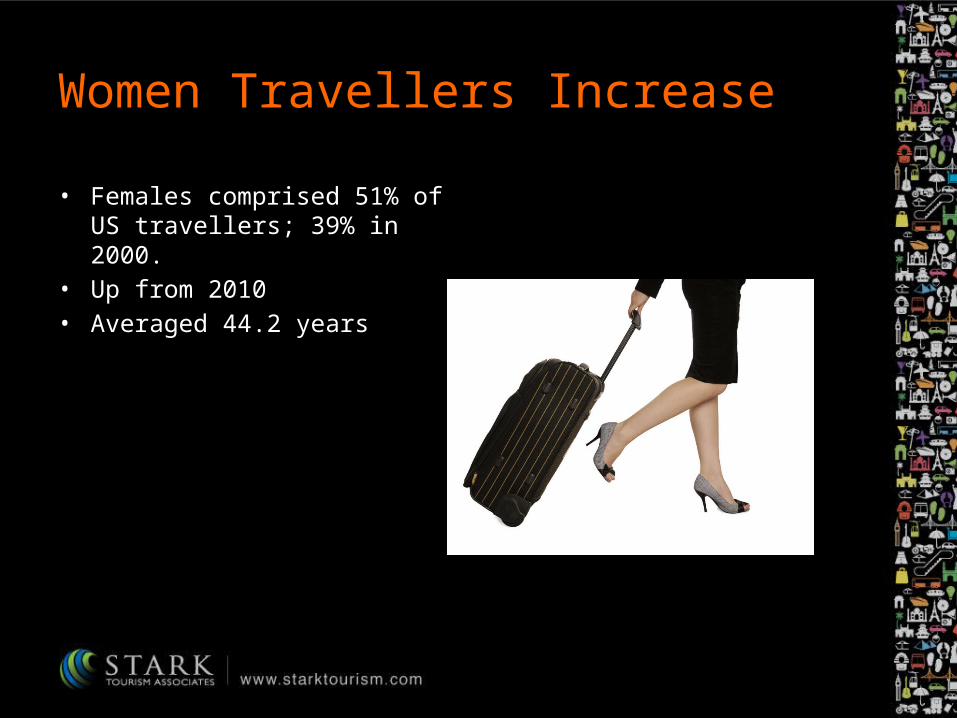
Women Travellers Increase
• Females comprised 51% of US travellers; 39% in 2000.
• Up from 2010• Averaged 44.2 years
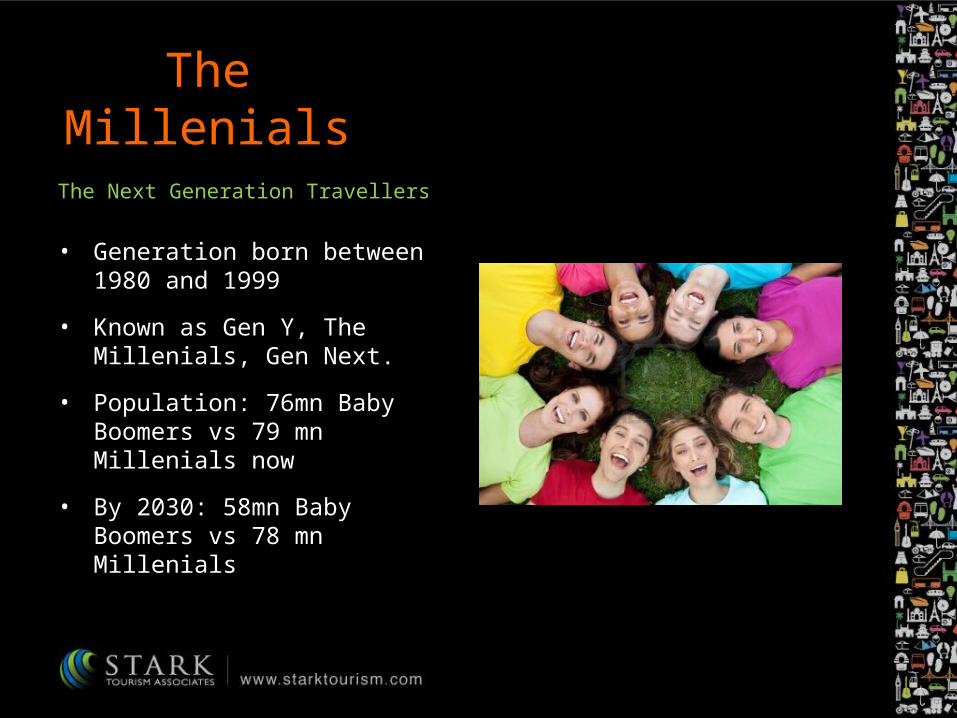
The Next Generation Travellers
• Generation born between 1980 and 1999
• Known as Gen Y, The Millenials, Gen Next.
• Population: 76mn Baby Boomers vs 79 mn Millenials now
• By 2030: 58mn Baby Boomers vs 78 mn Millenials
The Millenials
The Millenials - Profile
• Instant Service & Flexibility • Need real time information• Shorter booking window of 75
days to 93 days• Could prefer hostels with a
clean bed, hot shower and Wifi
• Looks for that “something extra” in a hotel
• Demand to be integrated with authentic local experience
• Wish to promote social responsibility
• Lovers of pod hotel concept – limited room size, unique luxury design and high-tech gadget features.
• Peer Review – a powerful tool, social creatures online and offline

Online Trends
Online Population
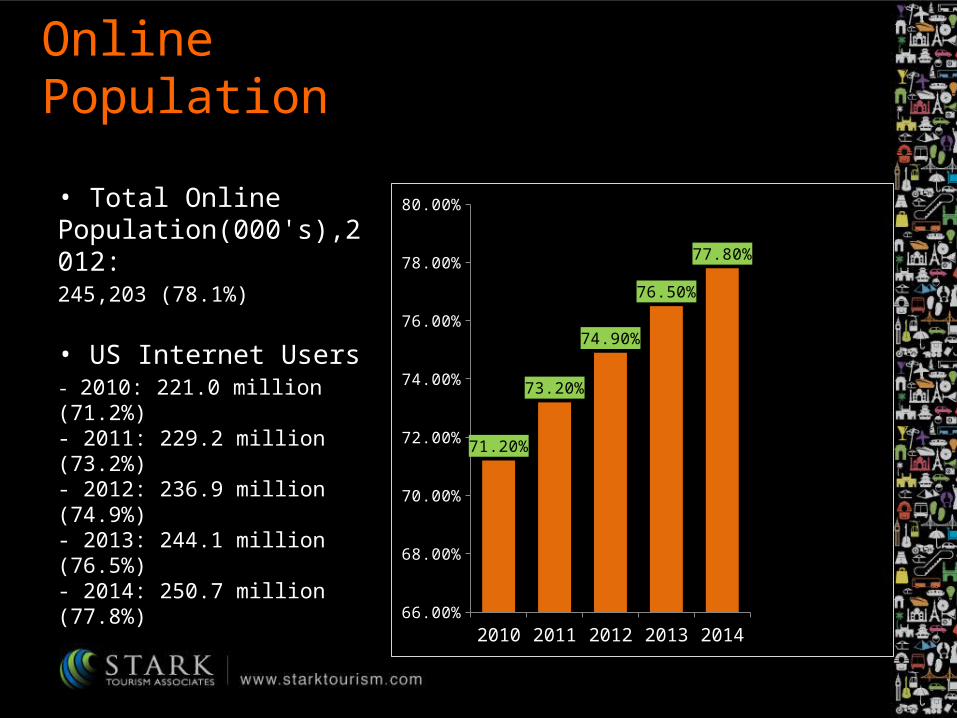
• Total Online Population(000's),2012: 245,203 (78.1%)
• US Internet Users - 2010: 221.0 million (71.2%)- 2011: 229.2 million (73.2%)- 2012: 236.9 million (74.9%)- 2013: 244.1 million (76.5%)- 2014: 250.7 million (77.8%)
2010
2011
2012
2013
2014
66.00%
68.00%
70.00%
72.00%
74.00%
76.00%
78.00%
80.00%
71.20%
73.20%
74.90%
76.50%
77.80%
Internet Users
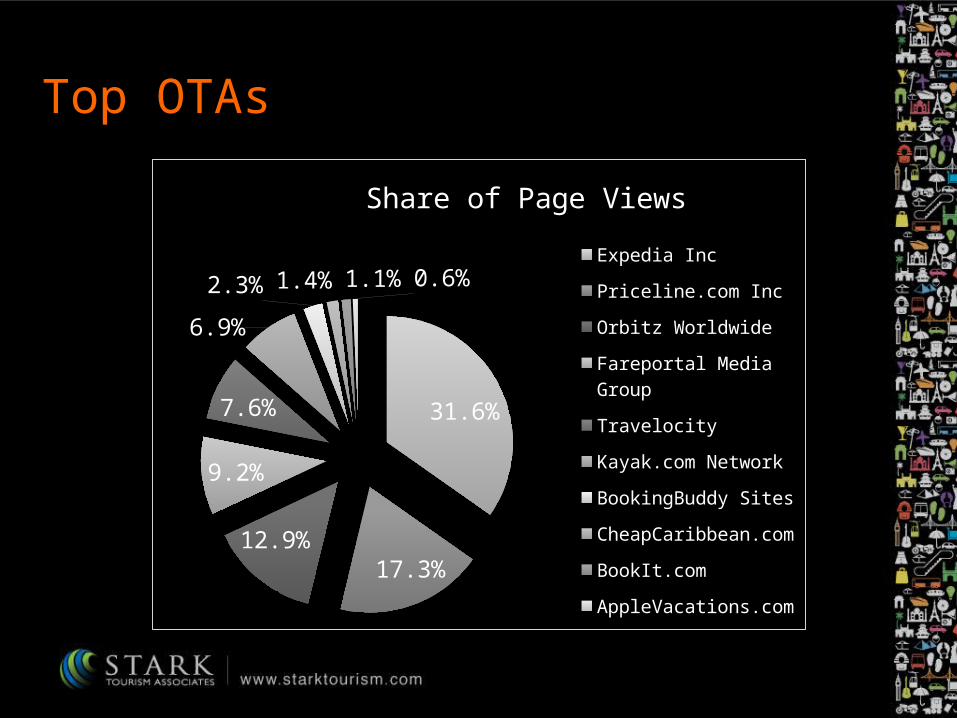
Top OTAs
31.6%
17.3%12.9%
9.2%
7.6%
6.9%2.3% 1.4% 1.1%0.6%
Share of Page Views
Expedia Inc
Priceline.com Inc
Orbitz Worldwide
Fareportal Media Group
Travelocity
Kayak.com Network
BookingBuddy Sites
CheapCaribbean.com
BookIt.com
AppleVacations.com
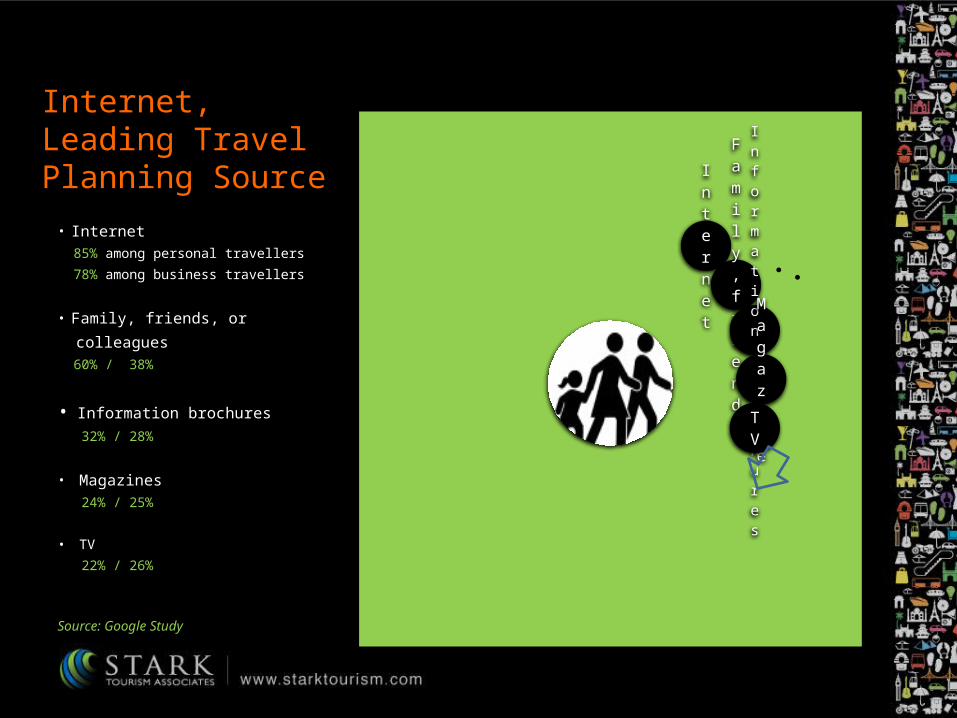
Internet, Leading Travel Planning Source
Internet
Family, friends
•
Information brochures
•
Magazine
TV
• Internet 85% among personal travellers 78% among business travellers
• Family, friends, or colleagues 60% / 38%
• Information brochures 32% / 28%
• Magazines 24% / 25%
• TV 22% / 26%
Source: Google Study

Smart Phone Penetration
• Gen Z (18-23): 95% have mobile phone
64% have smartphone
• Gen Y Millennials (24-32): 97% ; 72%
• Gen X (33-46): 95% ; 61%
• Younger boomers (47-56) 92% ; 39%
• Older boomers (57-67): 89% ; 28%
• Golden generation (68-88): 85% ; 16%
Increase In Travel Bookings By Smartphones• Travel bookings made through mobiles to reach $25
Billion by 2014 • Mobile revenue will be 18% of the online market and 8%
of the total travel market.• In 2012, 22% of the total travel bookings/purchases are
from mobile websites, 12% from native apps and the rest from non-mobile sources.
Forecast, Outbound• Outbound market expected to stabilise in 2013 after
declining in 2012• IPK forecasts zero growth for US outbound travel next year. • The key trend in the North American outbound market is
more travel within the region
Source: IPK International
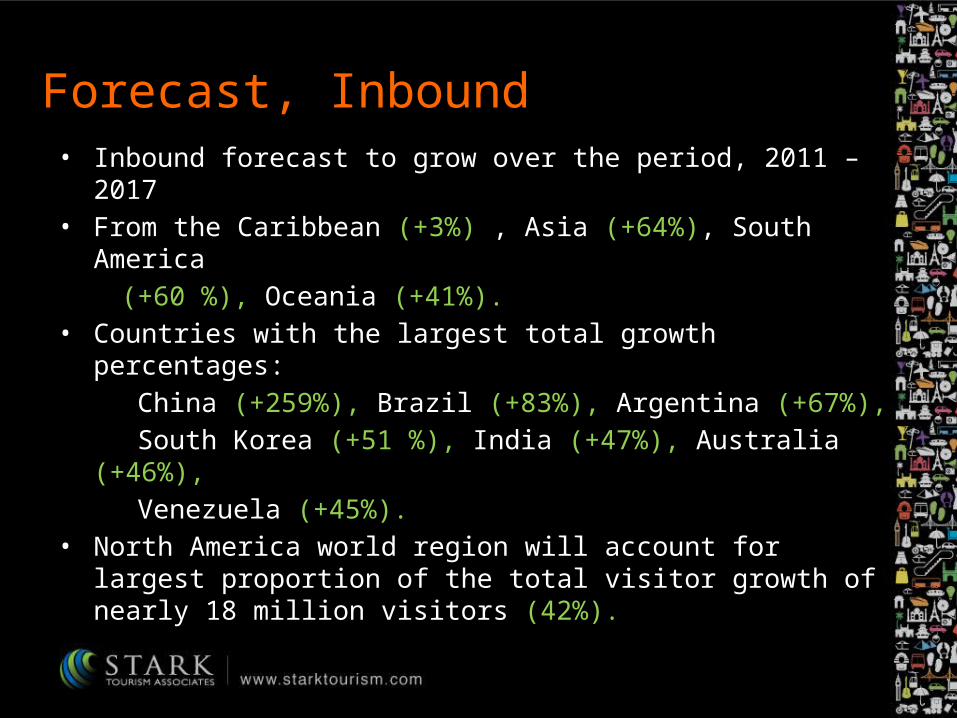
Forecast, Inbound• Inbound forecast to grow over the period, 2011 – 2017• From the Caribbean (+3%) , Asia (+64%), South America (+60 %), Oceania (+41%). • Countries with the largest total growth percentages: China (+259%), Brazil (+83%), Argentina (+67%), South Korea (+51 %), India (+47%), Australia (+46%), Venezuela (+45%). • North America world region will account for largest
proportion of the total visitor growth of nearly 18 million visitors (42%).
References• U.S. Department of Commerce, International Trade
Administration, Manufacturing and Services • Office of Travel and Tourism Industries • U.S. Department of Commerce, Bureau of Economic
Analysis• Statistics Canada• Banco de Mexico• U.N. World Tourism Organization• MKG Hospitality• Courtesy for images www.123rf.com;, Wikipedia, www.sxc.hu,
www.telegraph.co.uk, www.womenbizlife.com
DisclaimerThe report is based on the information from the published sources and References mentioned and inferences drawn are from them. Stark Tourism Associates and its parent organization, The Stark Group and the Group Companies - Stark Communications, Stark Expo, Stark World Publications are not responsible for errors/omissions that could have crept in knowingly or unwittingly.