Embed Size (px)
Citation preview

Hotel Investment Forum India
Elizabeth Winkle
Managing Director, STR Global
13th January 2015
Global Hotel Industry Performance

Let the Good Times Roll November 2014 YTD RevPAR % Change, Constant Currency USD, Europe in EUR
+8.1% +4.9%€ +3.5%
+0.8%
+5.1% +17.2%
+14.1%
+2.7%
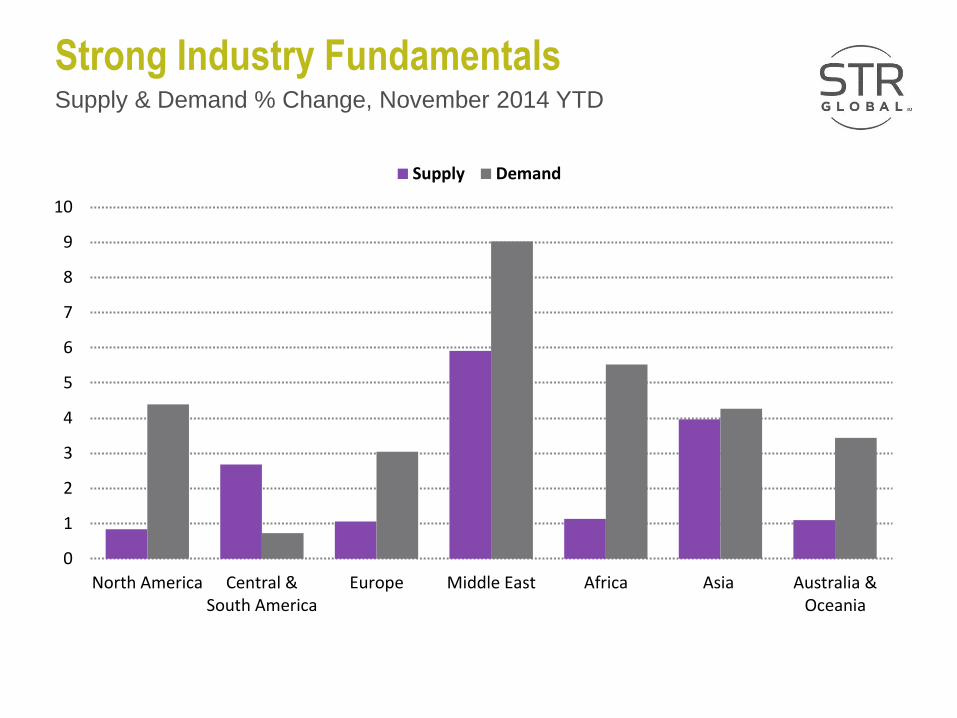
Strong Industry Fundamentals
0
1
2
3
4
5
6
7
8
9
10
North America Central &South America
Europe Middle East Africa Asia Australia &Oceania
Supply Demand
Supply & Demand % Change, November 2014 YTD

Countdown: 14 from 2014

#14 Demand: +10% from Previous Peak
12MMA Demand; Nov 2007 – Nov 2014 (indexed at Nov 2007)
0.90
1.00
1.10
1.20
Nov 14Nov 13Nov 12Nov 11Nov 10Nov 09Nov 08Nov 07
EU + UK US
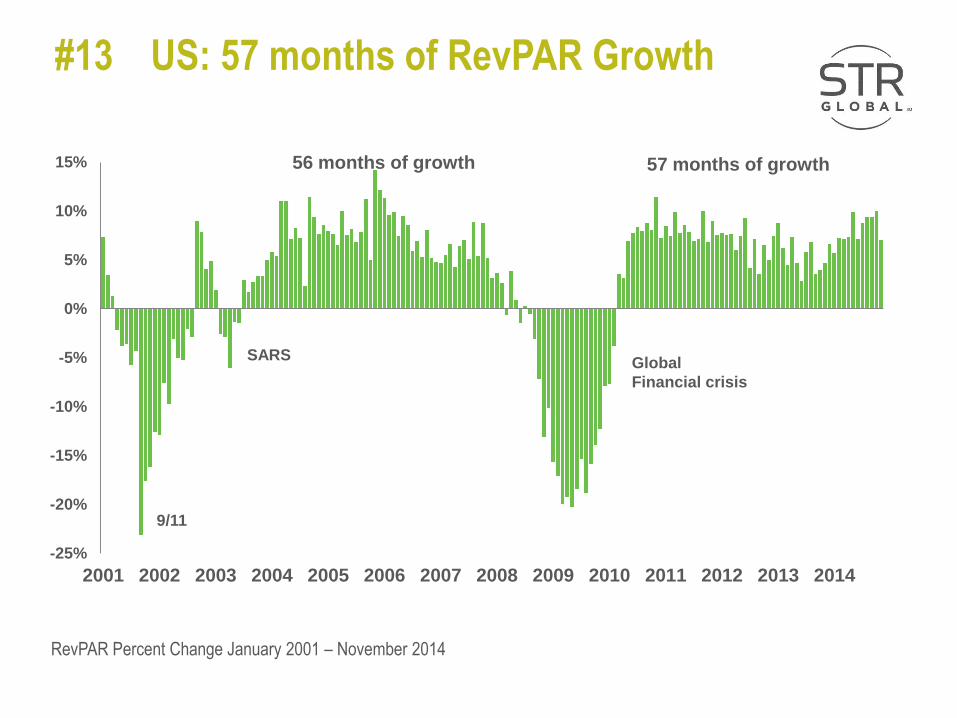
#13 US: 57 months of RevPAR Growth
RevPAR Percent Change January 2001 – November 2014
-25%
-20%
-15%
-10%
-5%
0%
5%
10%
15%
2001 2002 2003 2004 2005 2006 2007 2008 2009 2010 2011 2012 2013 2014
Hu
nd
red
s 57 months of growth
9/11
SARS Global
Financial crisis
56 months of growth
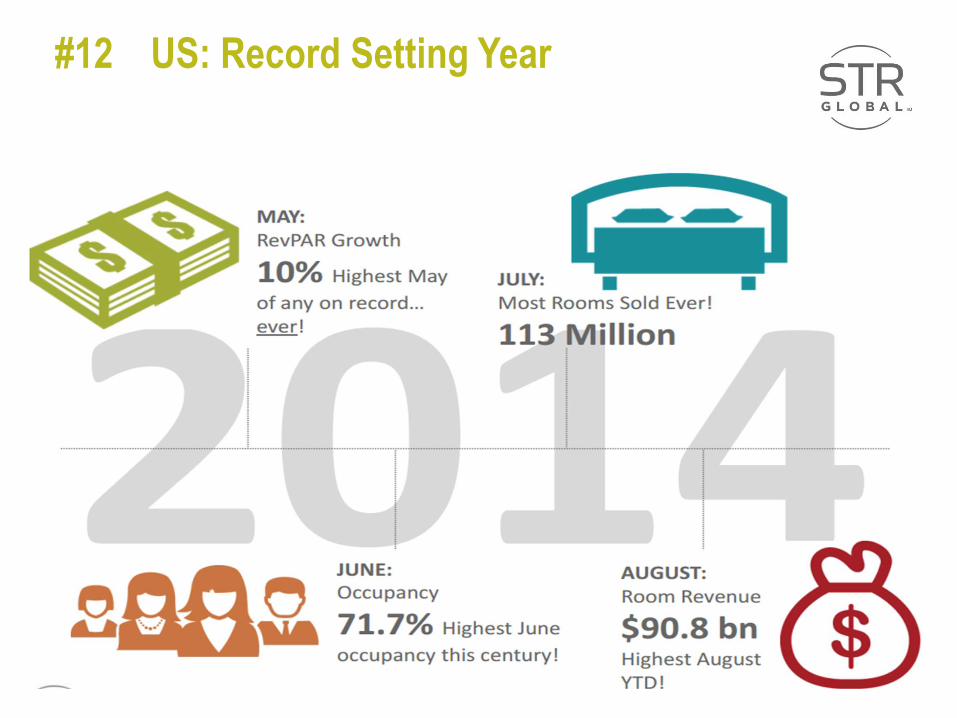
#12 US: Record Setting Year
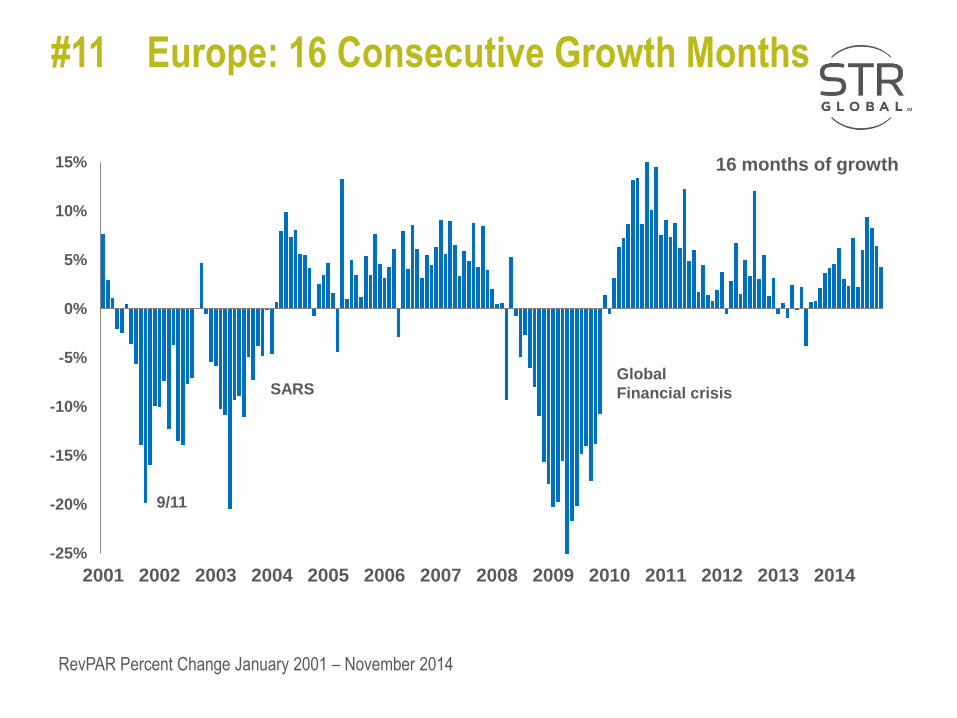
#11 Europe: 16 Consecutive Growth Months
RevPAR Percent Change January 2001 – November 2014
-25%
-20%
-15%
-10%
-5%
0%
5%
10%
15%
2001 2002 2003 2004 2005 2006 2007 2008 2009 2010 2011 2012 2013 2014
Hu
nd
red
s 16 months of growth
9/11
SARS Global
Financial crisis
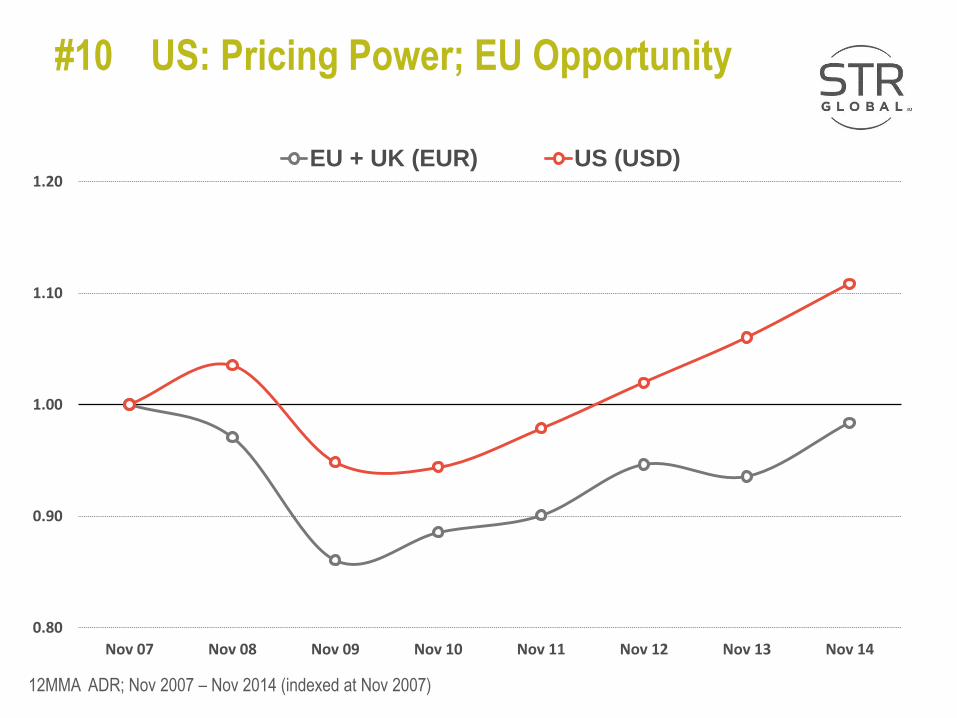
#10 US: Pricing Power; EU Opportunity
12MMA ADR; Nov 2007 – Nov 2014 (indexed at Nov 2007)
0.80
0.90
1.00
1.10
1.20
Nov 14Nov 13Nov 12Nov 11Nov 10Nov 09Nov 08Nov 07
EU + UK (EUR) US (USD)
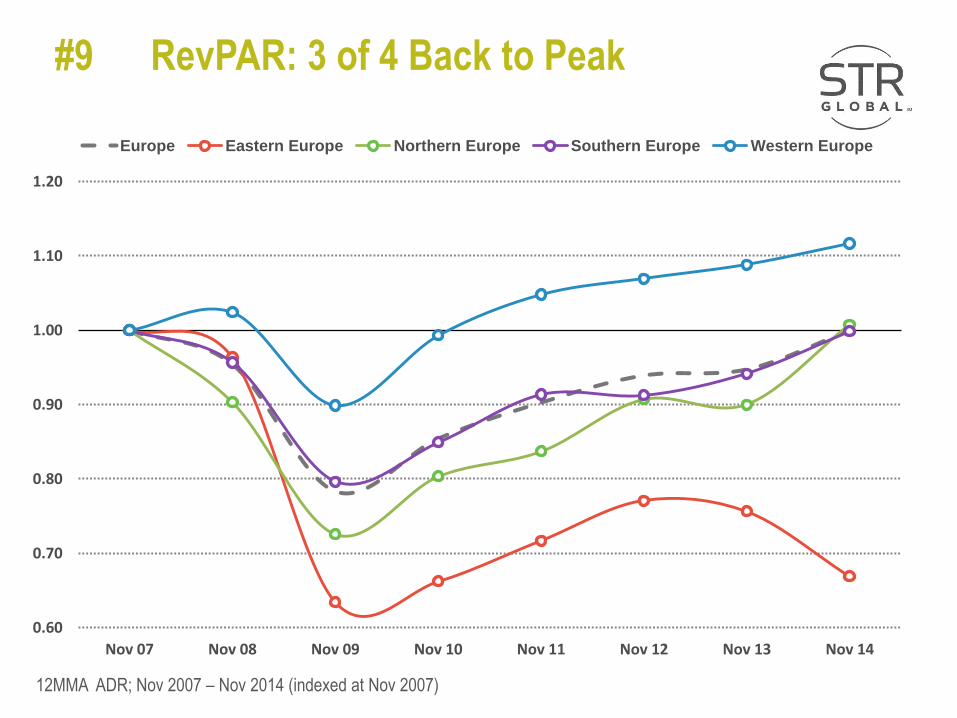
#9 RevPAR: 3 of 4 Back to Peak
12MMA ADR; Nov 2007 – Nov 2014 (indexed at Nov 2007)
0.60
0.70
0.80
0.90
1.00
1.10
1.20
Nov 14Nov 13Nov 12Nov 11Nov 10Nov 09Nov 08Nov 07
Europe Eastern Europe Northern Europe Southern Europe Western Europe
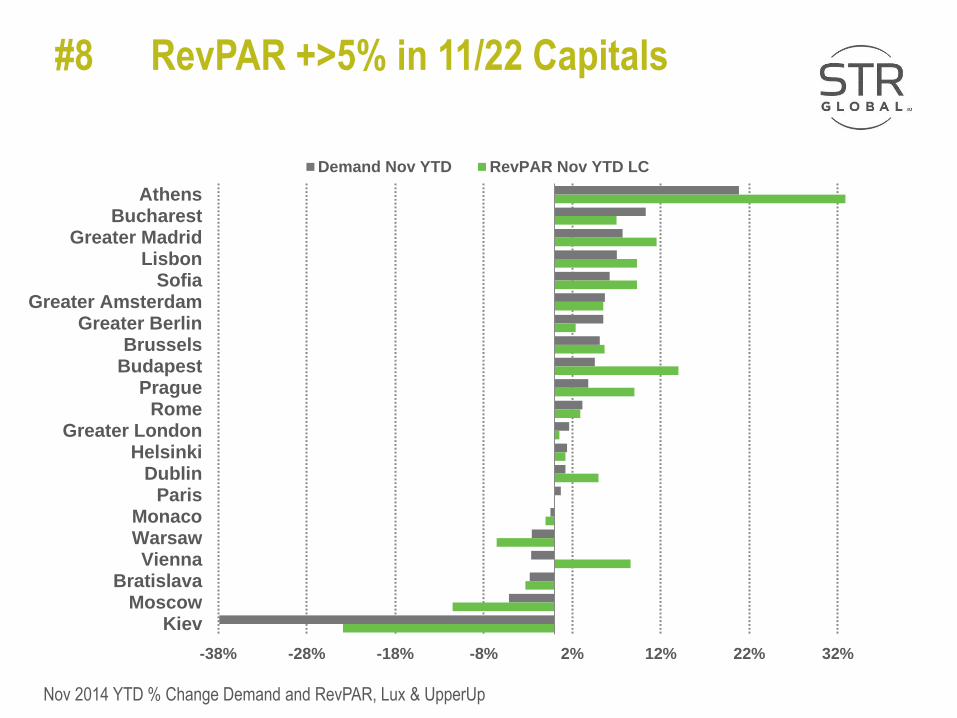
#8 RevPAR +>5% in 11/22 Capitals
Nov 2014 YTD % Change Demand and RevPAR, Lux & UpperUp
-38% -28% -18% -8% 2% 12% 22% 32%
AthensBucharest
Greater MadridLisbon
SofiaGreater Amsterdam
Greater BerlinBrussels
BudapestPrague
RomeGreater London
HelsinkiDublin
ParisMonacoWarsawVienna
BratislavaMoscow
Kiev
Hundreds
Demand Nov YTD RevPAR Nov YTD LC
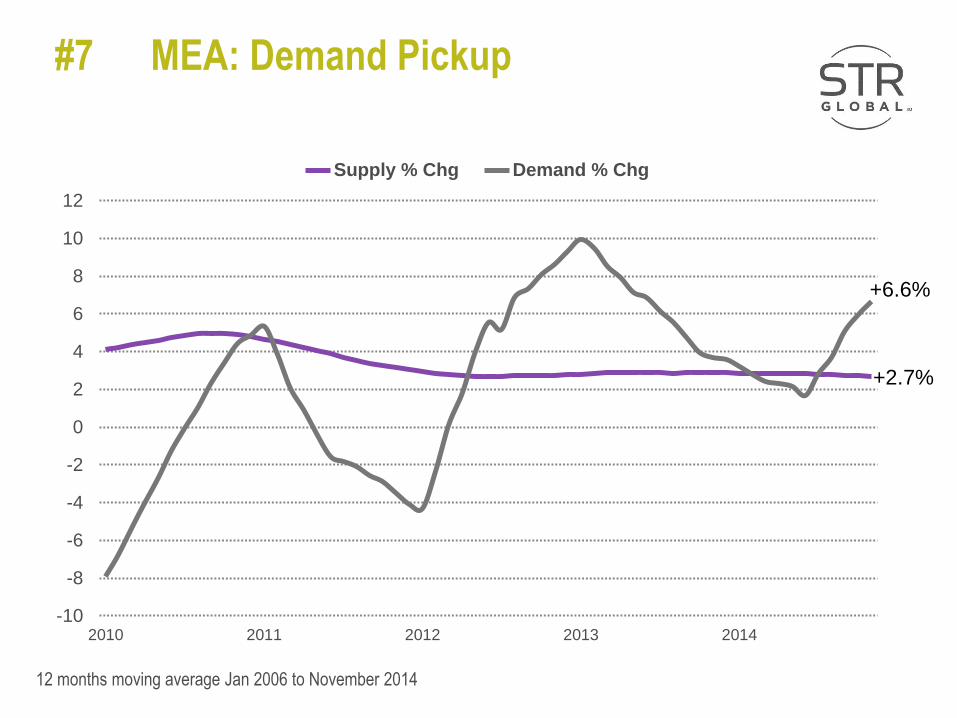
12 months moving average Jan 2006 to November 2014
-10
-8
-6
-4
-2
0
2
4
6
8
10
12
2010 2011 2012 2013 2014
Supply % Chg Demand % Chg
#7 MEA: Demand Pickup
+6.6%
+2.7%
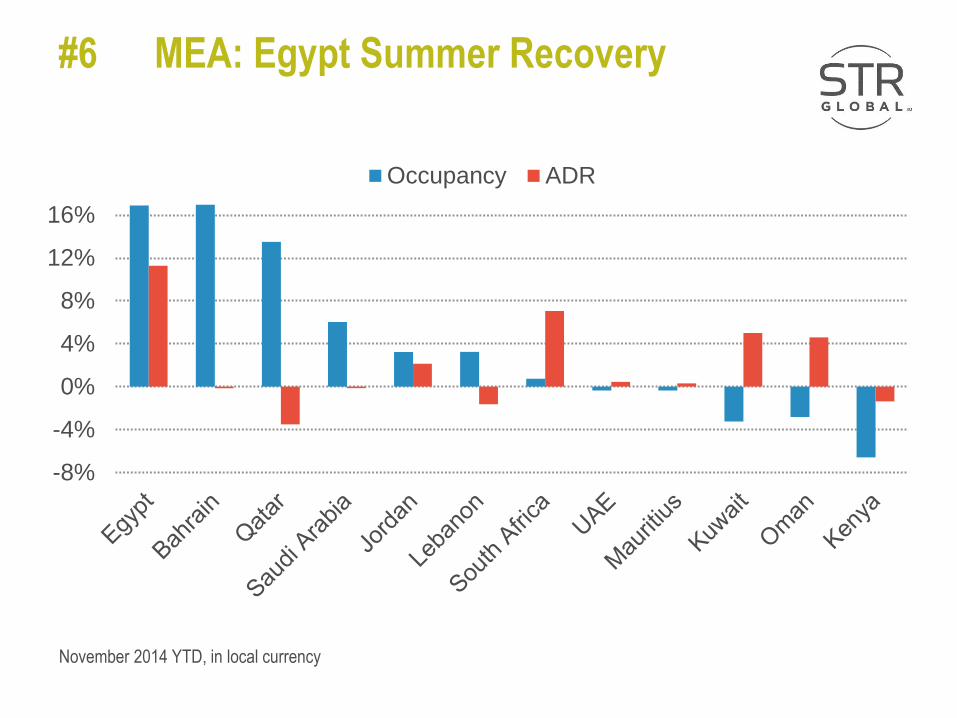
November 2014 YTD, in local currency
-8%
-4%
0%
4%
8%
12%
16%
Occupancy ADR
#6 MEA: Egypt Summer Recovery
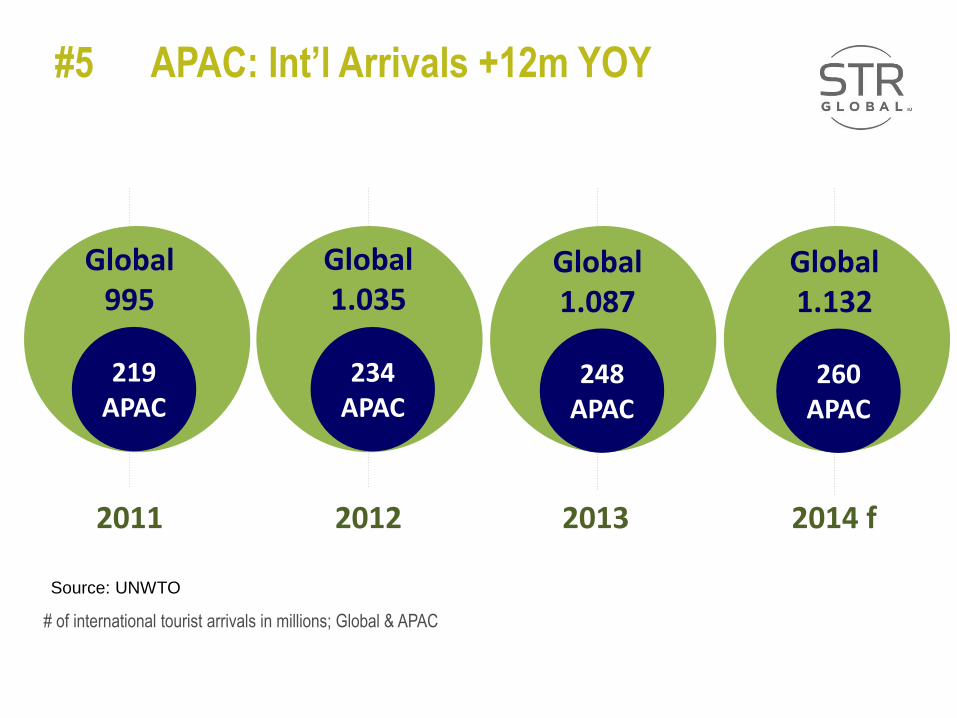
# of international tourist arrivals in millions; Global & APAC
234 APAC
2012
Global 1.035
260 APAC
2014 f
Global 1.132
219
APAC
2011
Global
995
248 APAC
2013
Global 1.087
Source: UNWTO
#5 APAC: Int’l Arrivals +12m YOY

Market performance – RevPAR % Growth, Nov 2014 YTD, USD (CC)
North-
Eastern
Central
& South
South- Eastern
Australia
Oceania
+1.0%
-0.6%
-0.8%
+4.9%
%
%
$
$ and %
#4 APAC: Performance Improvement
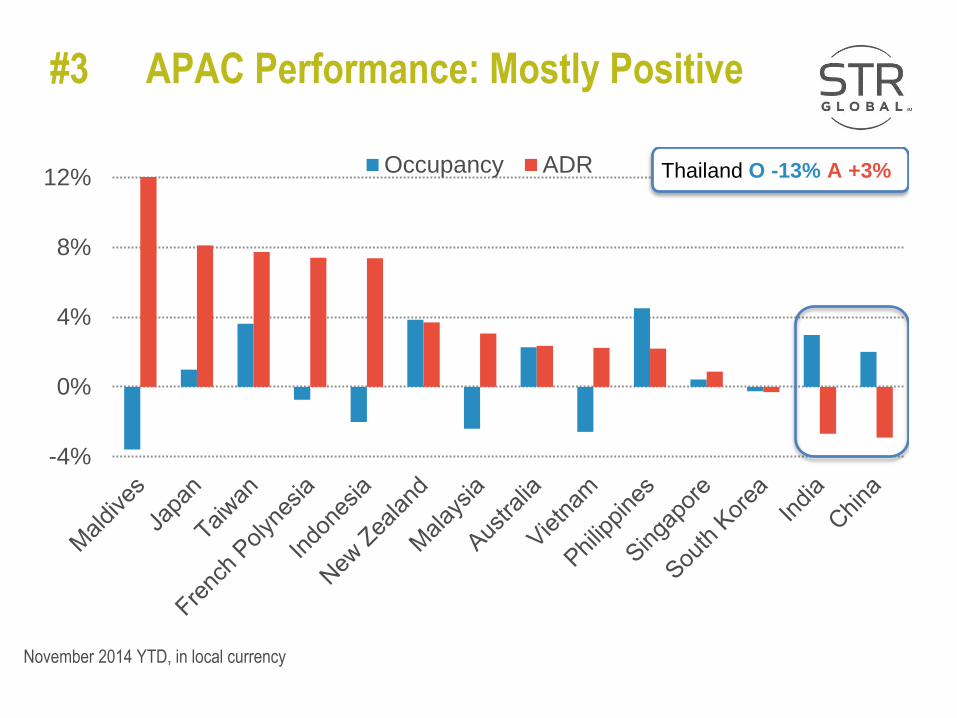
November 2014 YTD, in local currency
-4%
0%
4%
8%
12%Occupancy ADR Thailand O -13% A +3%
#3 APAC Performance: Mostly Positive
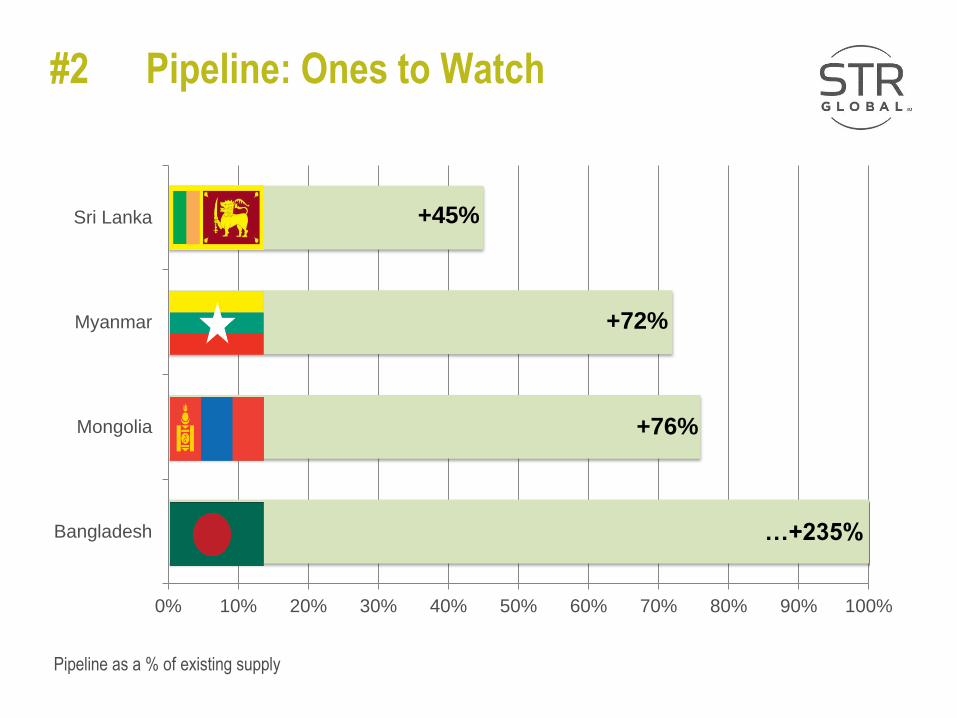
0% 10% 20% 30% 40% 50% 60% 70% 80% 90% 100%
Bangladesh
Mongolia
Myanmar
Sri Lanka
…+235%
+76%
+72%
+45%
Pipeline as a % of existing supply
#2 Pipeline: Ones to Watch
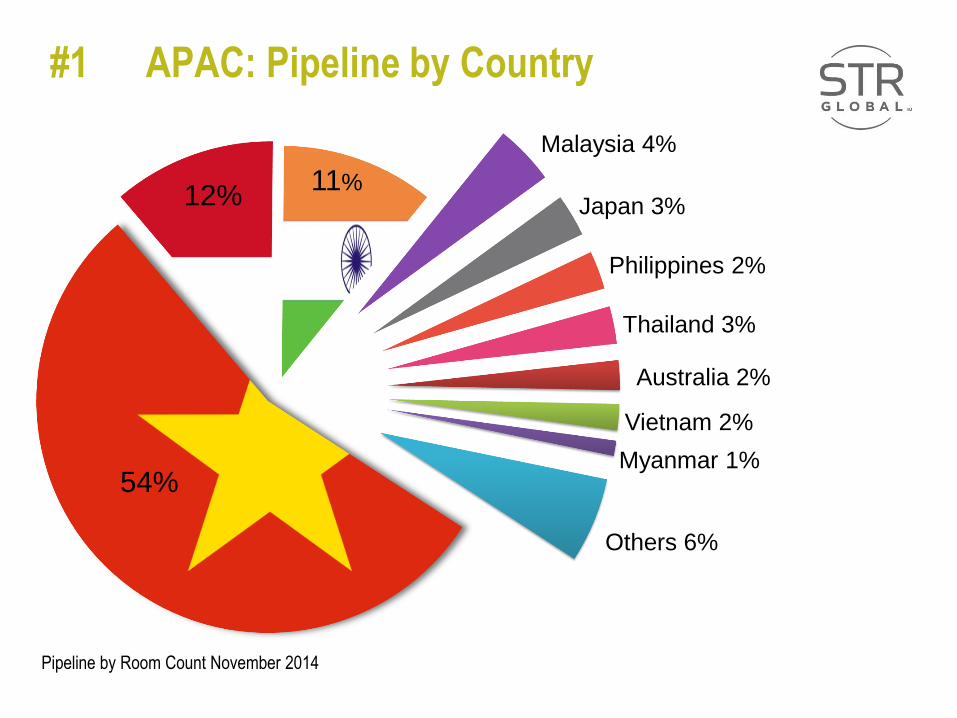
Pipeline by Room Count November 2014
54%
12% 11%
Malaysia 4%
Japan 3%
Philippines 2%
Thailand 3%
Australia 2%
Vietnam 2%
Myanmar 1%
Others 6%
#1 APAC: Pipeline by Country

2015 Resolutions
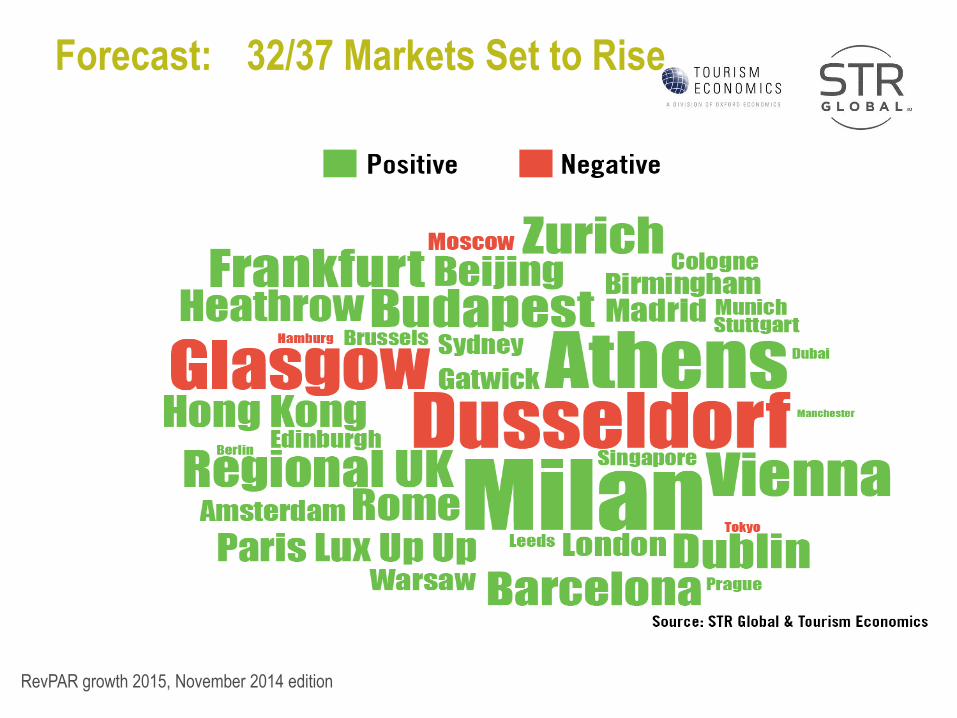
RevPAR growth 2015, November 2014 edition
Forecast: 32/37 Markets Set to Rise
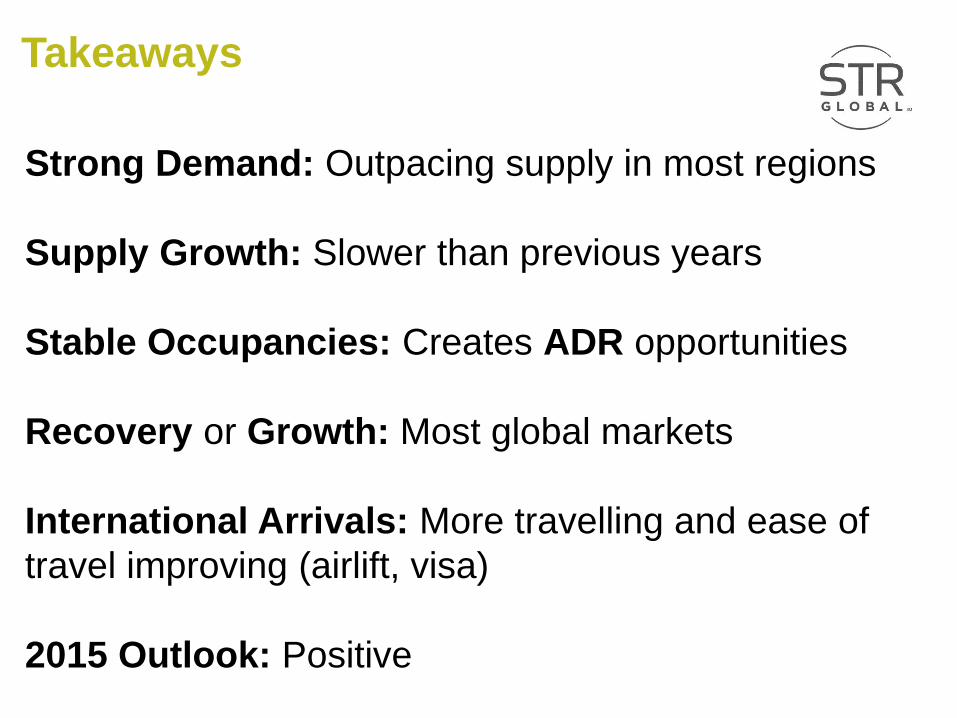
Takeaways
Strong Demand: Outpacing supply in most regions
Supply Growth: Slower than previous years
Stable Occupancies: Creates ADR opportunities
Recovery or Growth: Most global markets
International Arrivals: More travelling and ease of
travel improving (airlift, visa)
2015 Outlook: Positive
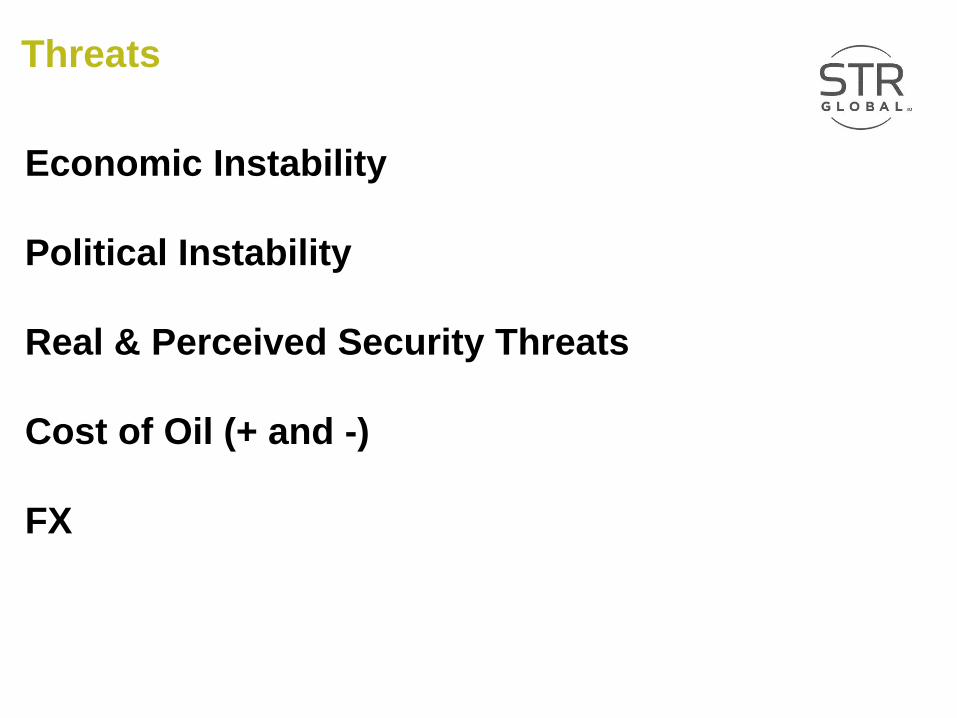
Threats
Economic Instability
Political Instability
Real & Perceived Security Threats
Cost of Oil (+ and -)
FX
STR Global
www.strglobal.com You can follow us on LinkedIn, Twitter, Facebook
STR Global, Ltd is the exclusive owner of all rights in this presentation and its content. Reproduction of all or a portion of this presentation for any purpose without prior approval of STR Global is strictly prohibited. This presentation is based on information compiled by STR Global Ltd. No strategic or marketing recommendations or advice are intended or implied.
Global Hotel Industry Performance
Elizabeth Winkle
![[XLS] · Web viewSTR 20015 STR 30105 STR 30115 STR 30123 STR 30125 STR 30130 STR 40090 ORİ STR 40115 STR 41090 ORİ STR 44115 STR 45111 STR 50020 STR 50103A STR 50112 STR 50113A](https://img.pdfslide.us/doc/110x75/5ad04b0c7f8b9a1d328e1e93/xls-viewstr-20015-str-30105-str-30115-str-30123-str-30125-str-30130-str-40090.jpg)