Embed Size (px)
Citation preview
Submitted by Group 12
Nitin Bighane(224)Subhashini Iyer(197)
Seema Devi(235)
Strategic Procurement and Materials Management Assignment
Industry : Cables and wires
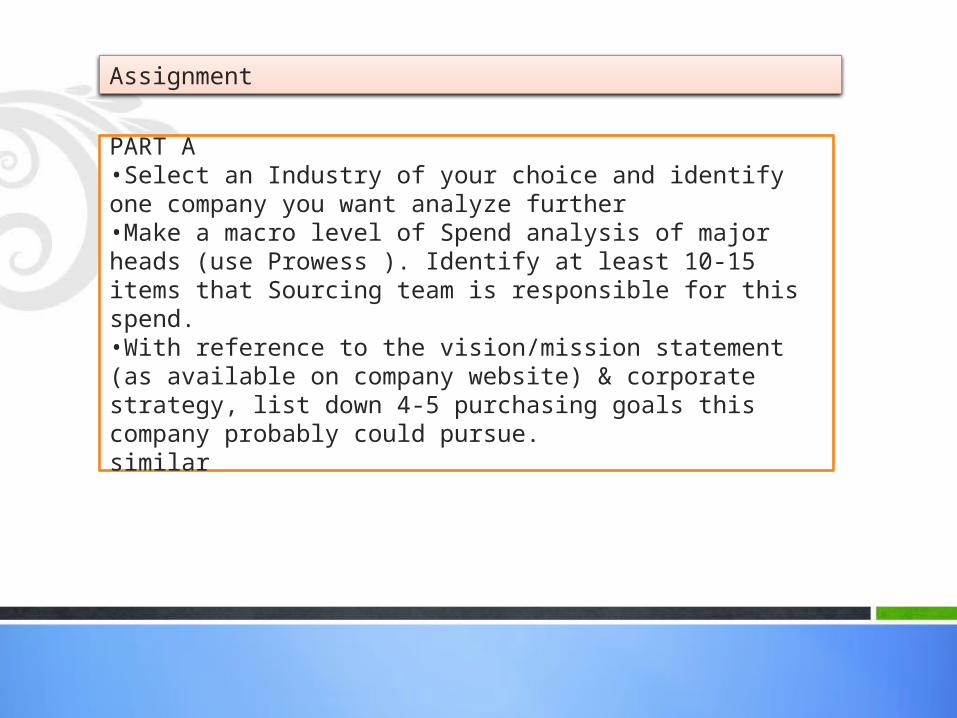
PART A•Select an Industry of your choice and identify one company you want analyze further•Make a macro level of Spend analysis of major heads (use Prowess ). Identify at least 10-15 items that Sourcing team is responsible for this spend.•With reference to the vision/mission statement (as available on company website) & corporate strategy, list down 4-5 purchasing goals this company probably could pursue.similar
Assignment
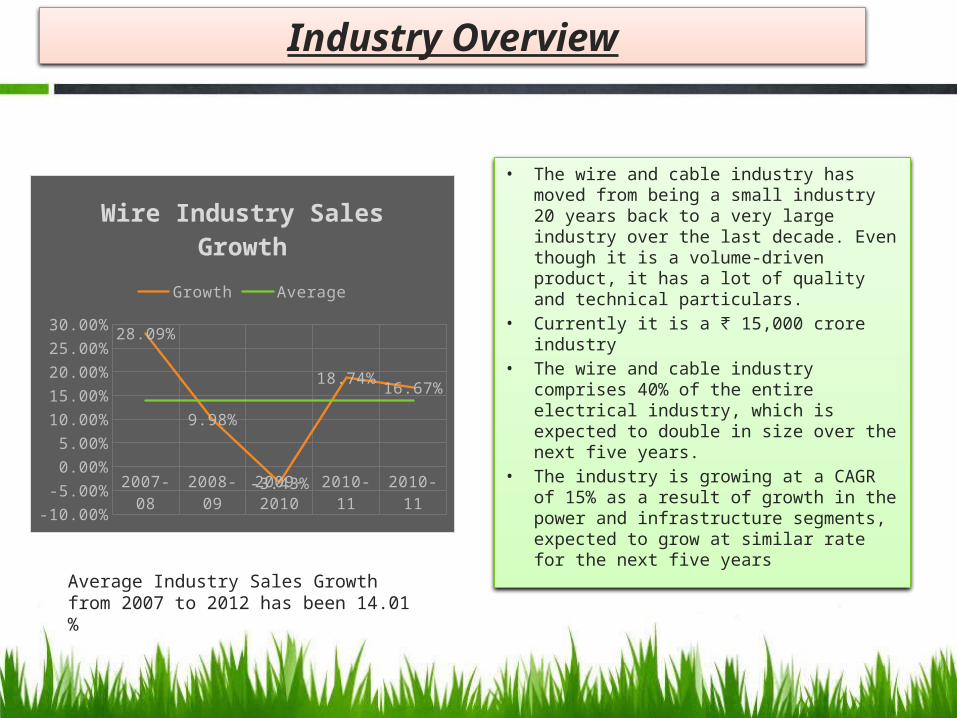
Industry Overview
Average Industry Sales Growth from 2007 to 2012 has been 14.01 %
• The wire and cable industry has moved from being a small industry 20 years back to a very large industry over the last decade. Even though it is a volume-driven product, it has a lot of quality and technical particulars.
• Currently it is a ₹ 15,000 crore industry• The wire and cable industry comprises
40% of the entire electrical industry, which is expected to double in size over the next five years.
• The industry is growing at a CAGR of 15% as a result of growth in the power and infrastructure segments, expected to grow at similar rate for the next five years
2007-08 2008-09 2009-2010
2010-11 2010-11
-10.00%
-5.00%
0.00%
5.00%
10.00%
15.00%
20.00%
25.00%
30.00%28.09%
9.98%
-3.43%
18.74%16.67%
Wire Industry Sales GrowthGrowth Average
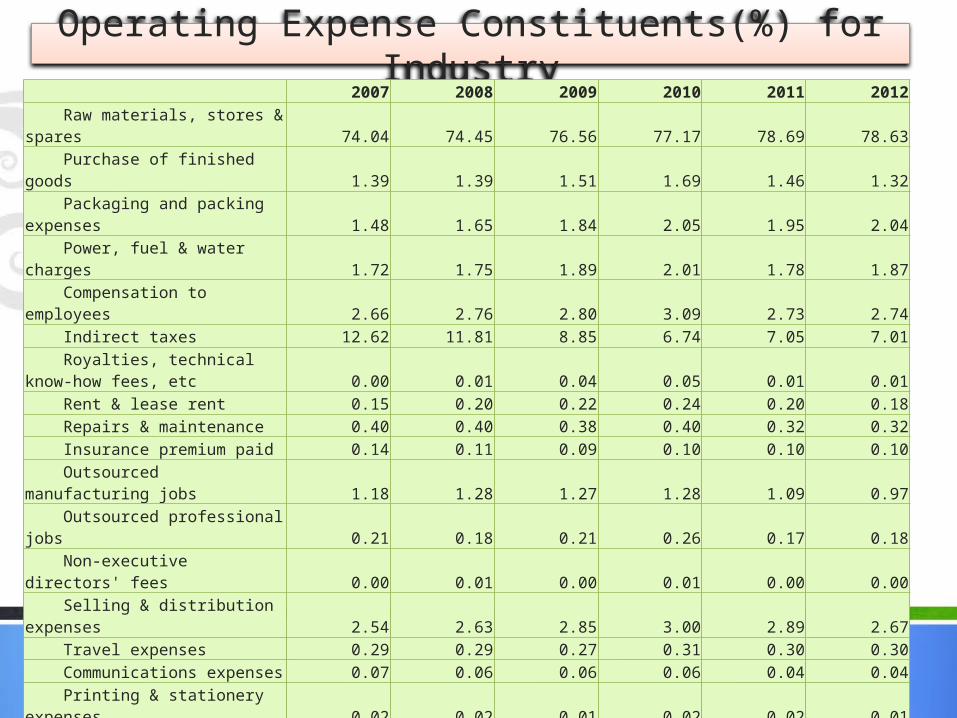
Operating Expense Constituents(%) for Industry2007 2008 2009 2010 2011 2012
Raw materials, stores & spares 74.04 74.45 76.56 77.17 78.69 78.63 Purchase of finished goods 1.39 1.39 1.51 1.69 1.46 1.32
Packaging and packing expenses 1.48 1.65 1.84 2.05 1.95 2.04 Power, fuel & water charges 1.72 1.75 1.89 2.01 1.78 1.87 Compensation to employees 2.66 2.76 2.80 3.09 2.73 2.74 Indirect taxes 12.62 11.81 8.85 6.74 7.05 7.01 Royalties, technical know-how fees, etc 0.00 0.01 0.04 0.05 0.01 0.01 Rent & lease rent 0.15 0.20 0.22 0.24 0.20 0.18 Repairs & maintenance 0.40 0.40 0.38 0.40 0.32 0.32 Insurance premium paid 0.14 0.11 0.09 0.10 0.10 0.10 Outsourced manufacturing jobs 1.18 1.28 1.27 1.28 1.09 0.97 Outsourced professional jobs 0.21 0.18 0.21 0.26 0.17 0.18 Non-executive directors' fees 0.00 0.01 0.00 0.01 0.00 0.00 Selling & distribution expenses 2.54 2.63 2.85 3.00 2.89 2.67 Travel expenses 0.29 0.29 0.27 0.31 0.30 0.30 Communications expenses 0.07 0.06 0.06 0.06 0.04 0.04 Printing & stationery expenses 0.02 0.02 0.01 0.02 0.02 0.01 Miscellaneous expenditure 0.91 0.85 0.96 1.12 0.89 1.10 Other operational exp of industrial ent 0.15 0.16 0.17 0.35 0.27 0.50 Other operational exp of non-fin services ent 0.01 0.02 0.01 0.05 0.02 0.01
Share of loss in other enterprises 0.00 0.00 0.00 0.00 0.00 0.00
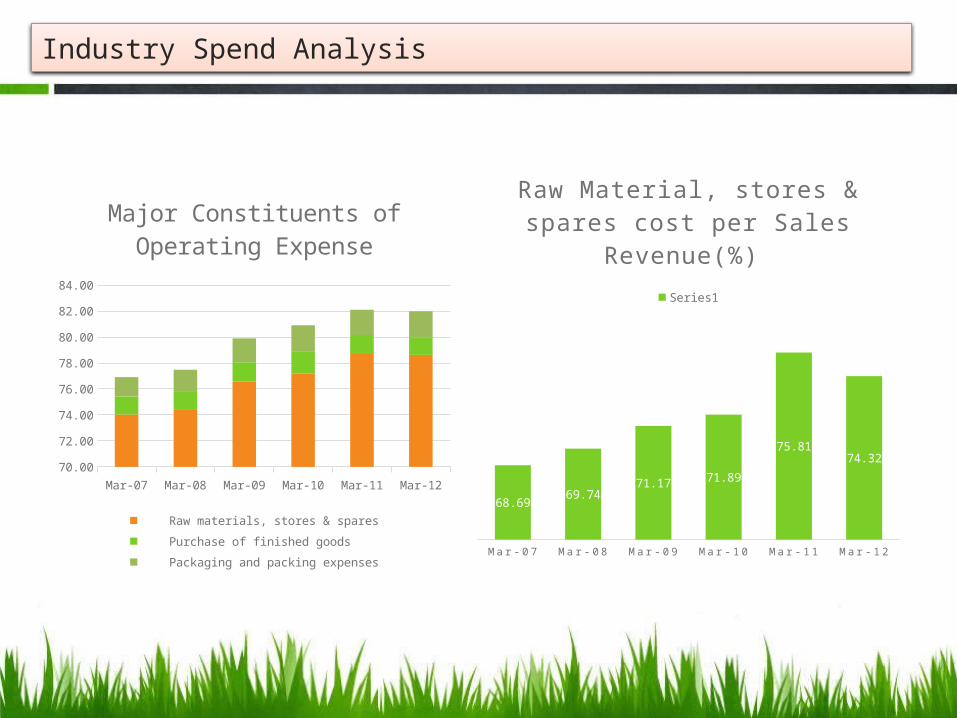
Industry Spend Analysis
J a n - 0 7 J a n - 0 8 J a n - 0 9 J a n - 1 0 J a n - 1 1 J a n - 1 2
68.6969.74
71.17 71.89
75.8174.32
Raw Material , stores & spares cost per Sales Revenue(%)
Series1
Jan-07 Jan-08 Jan-09 Jan-10 Jan-11 Jan-120.00
10.00
20.00
30.00
40.00
50.00
60.00
70.00
80.00
90.00
Major Constituents of Operating Expense
Raw materials, stores & spares Purchase of finished goods Packaging and packing expenses
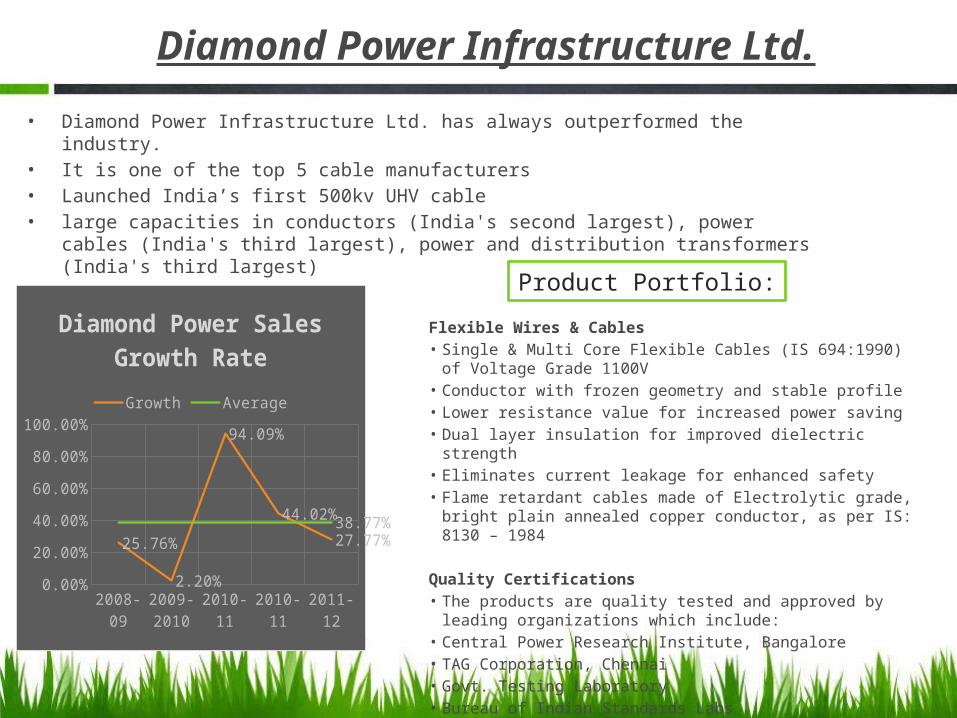
Diamond Power Infrastructure Ltd.
• Diamond Power Infrastructure Ltd. has always outperformed the industry.• It is one of the top 5 cable manufacturers• Launched India’s first 500kv UHV cable• large capacities in conductors (India's second largest), power cables (India's third largest), power
and distribution transformers (India's third largest)
2008-09 2009-2010
2010-11 2010-11 2011-120.00%
10.00%20.00%30.00%40.00%50.00%60.00%70.00%80.00%90.00%
100.00%
25.76%
2.20%
94.09%
44.02%
27.77%38.77%
Diamond Power Sales Growth Rate
Growth Average
Flexible Wires & Cables • Single & Multi Core Flexible Cables (IS 694:1990) of Voltage
Grade 1100V • Conductor with frozen geometry and stable profile• Lower resistance value for increased power saving• Dual layer insulation for improved dielectric strength• Eliminates current leakage for enhanced safety• Flame retardant cables made of Electrolytic grade, bright plain
annealed copper conductor, as per IS: 8130 – 1984
Quality Certifications • The products are quality tested and approved by leading
organizations which include: • Central Power Research Institute, Bangalore• TAG Corporation, Chennai• Govt. Testing Laboratory• Bureau of Indian Standards Labs
Product Portfolio:
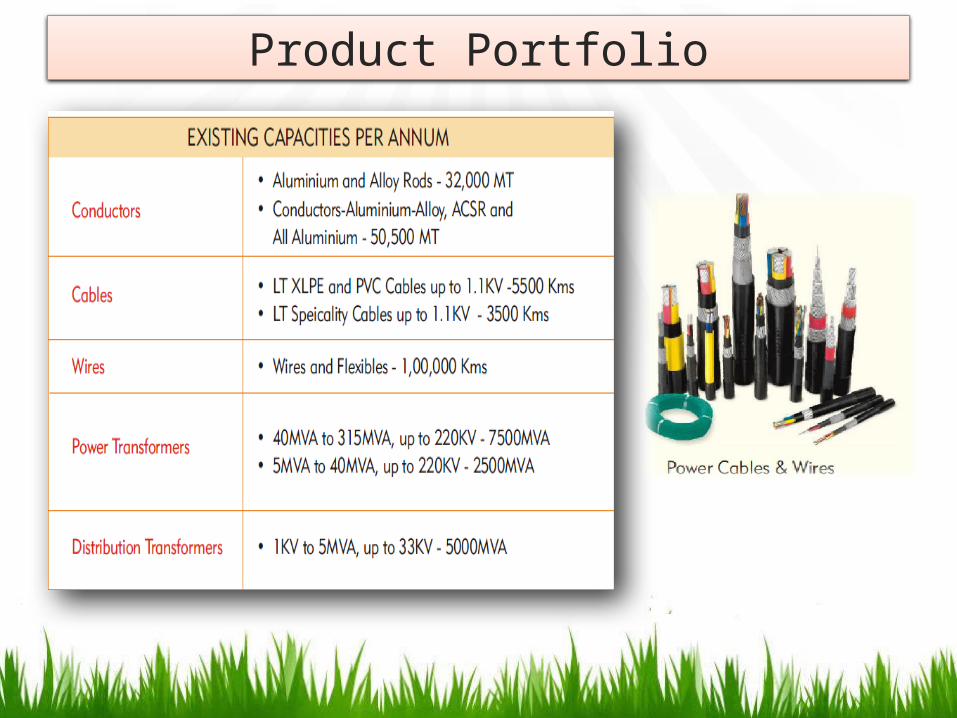
Product Portfolio
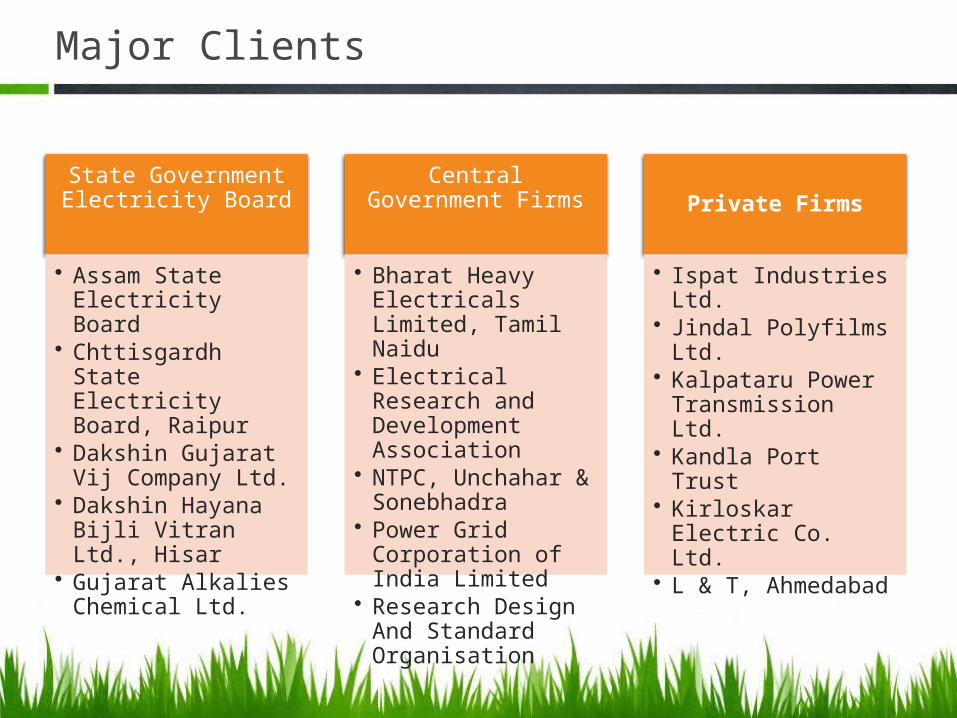
Major Clients
State Government Electricity Board
• Assam State Electricity Board
• Chttisgardh State Electricity Board, Raipur
• Dakshin Gujarat Vij Company Ltd.
• Dakshin Hayana Bijli Vitran Ltd., Hisar
• Gujarat Alkalies Chemical Ltd.
Central Government Firms
• Bharat Heavy Electricals Limited, Tamil Naidu
• Electrical Research and Development Association
• NTPC, Unchahar & Sonebhadra
• Power Grid Corporation of India Limited
• Research Design And Standard Organisation
Private Firms
• Ispat Industries Ltd.• Jindal Polyfilms Ltd.• Kalpataru Power
Transmission Ltd.• Kandla Port Trust• Kirloskar Electric Co.
Ltd.• L & T, Ahmedabad
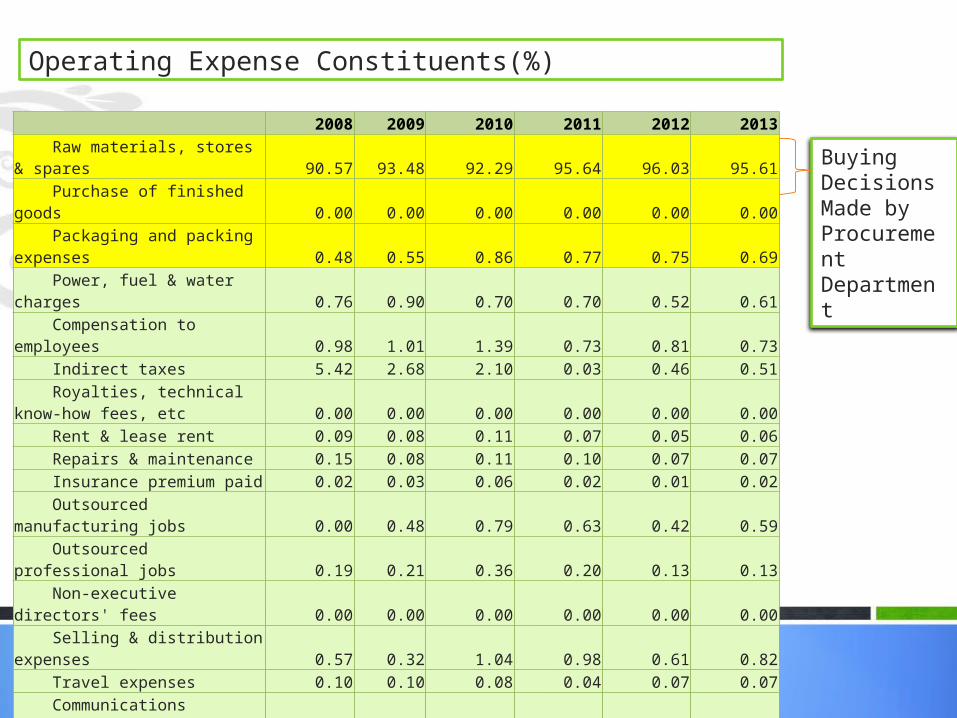
Operating Expense Constituents(%)
2008 2009 2010 2011 2012 2013 Raw materials, stores & spares 90.57 93.48 92.29 95.64 96.03 95.61 Purchase of finished goods 0.00 0.00 0.00 0.00 0.00 0.00 Packaging and packing expenses 0.48 0.55 0.86 0.77 0.75 0.69 Power, fuel & water charges 0.76 0.90 0.70 0.70 0.52 0.61 Compensation to employees 0.98 1.01 1.39 0.73 0.81 0.73 Indirect taxes 5.42 2.68 2.10 0.03 0.46 0.51
Royalties, technical know-how fees, etc 0.00 0.00 0.00 0.00 0.00 0.00 Rent & lease rent 0.09 0.08 0.11 0.07 0.05 0.06 Repairs & maintenance 0.15 0.08 0.11 0.10 0.07 0.07 Insurance premium paid 0.02 0.03 0.06 0.02 0.01 0.02 Outsourced manufacturing jobs 0.00 0.48 0.79 0.63 0.42 0.59 Outsourced professional jobs 0.19 0.21 0.36 0.20 0.13 0.13 Non-executive directors' fees 0.00 0.00 0.00 0.00 0.00 0.00 Selling & distribution expenses 0.57 0.32 1.04 0.98 0.61 0.82 Travel expenses 0.10 0.10 0.08 0.04 0.07 0.07 Communications expenses 0.04 0.01 0.01 0.01 0.00 0.00 Printing & stationery expenses 0.03 0.02 0.01 0.01 0.01 0.01 Miscellaneous expenditure 0.03 0.02 0.05 0.05 0.04 0.04
Other operational exp of industrial ent 0.58 0.03 0.03 0.03 0.01 0.02
Other operational exp of non-fin services ent 0.00 0.00 0.00 0.00 0.00 0.00 Share of loss in other enterprises 0.00 0.00 0.00 0.00 0.00 0.00
Buying Decisions Made by ProcurementDepartment
8-Mar 9-Mar 10-Mar 11-Mar 12-Mar 13-Mar0.00%
20.00%
40.00%
60.00%
80.00%
100.00%
120.00%
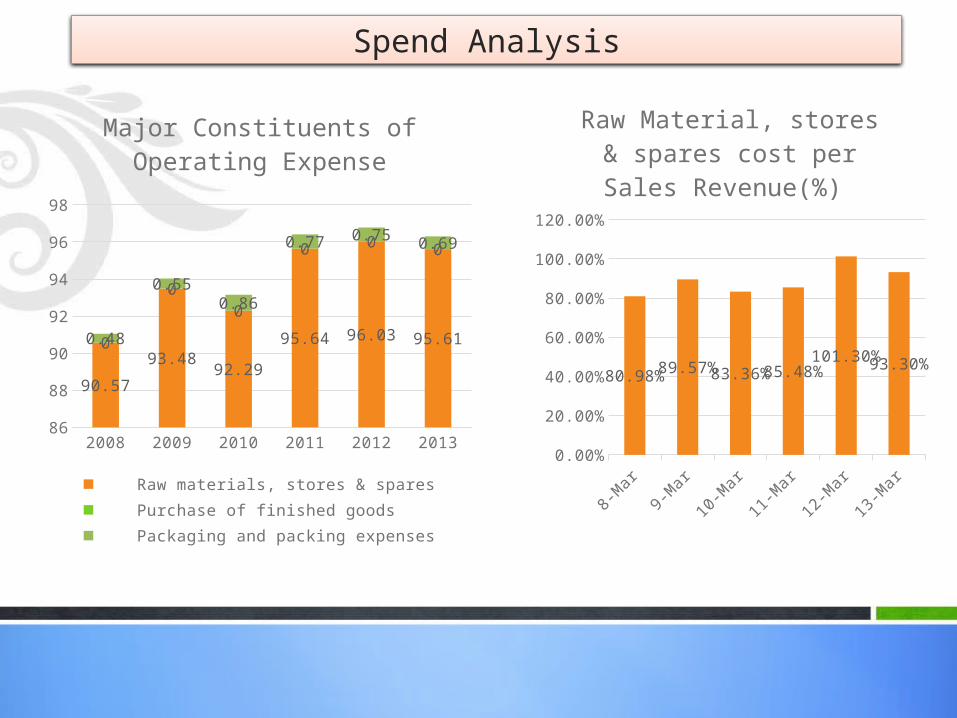
80.98%89.57% 83.36% 85.48%
101.30%93.30%
Raw Material, stores & spares cost per Sales Revenue(%)
2008 2009 2010 2011 2012 201386
88
90
92
94
96
98
90.57
93.4892.29
95.64 96.03 95.610
0
0
0 0 0
0.48
0.550.86
0.77 0.750.69
Major Constituents of Operating Expense
Raw materials, stores & spares Purchase of finished goods Packaging and packing expenses
Spend Analysis
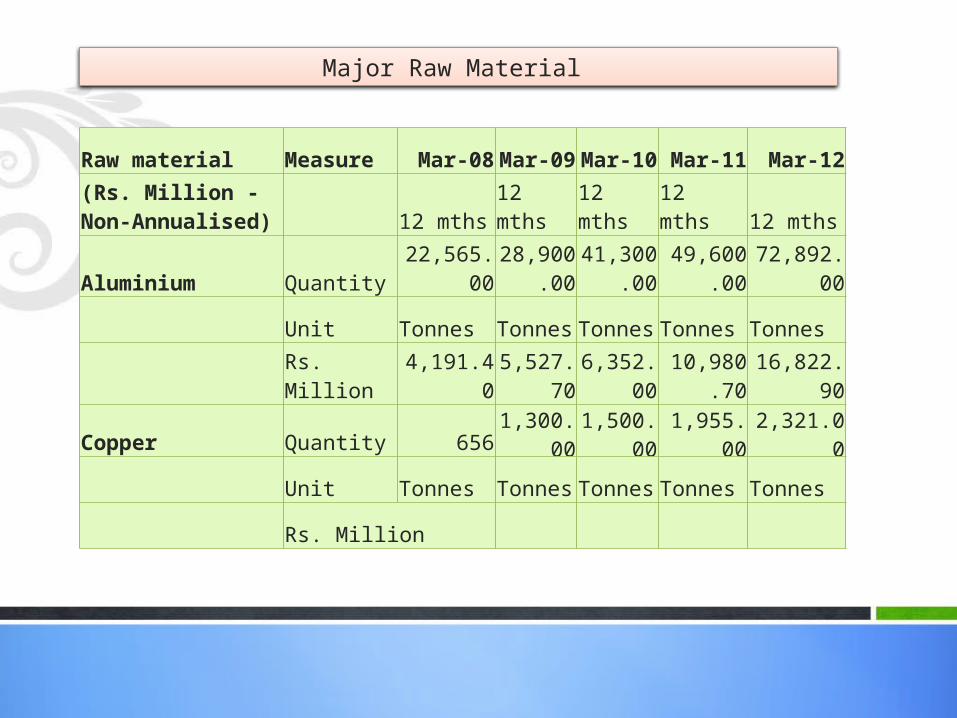
Major Raw Material
Raw material Measure Mar-08 Mar-09 Mar-10 Mar-11 Mar-12
(Rs. Million - Non-Annualised) 12 mths 12 mths 12 mths 12 mths 12 mths
Aluminium Quantity 22,565.0028,900.0
041,300.0
0 49,600.00 72,892.00
Unit Tonnes Tonnes Tonnes Tonnes Tonnes
Rs. Million 4,191.40 5,527.70 6,352.00 10,980.70 16,822.90
Copper Quantity 656 1,300.00 1,500.00 1,955.00 2,321.00
Unit Tonnes Tonnes Tonnes Tonnes Tonnes
Rs. Million
COMPANY’S PHILOSOPHY
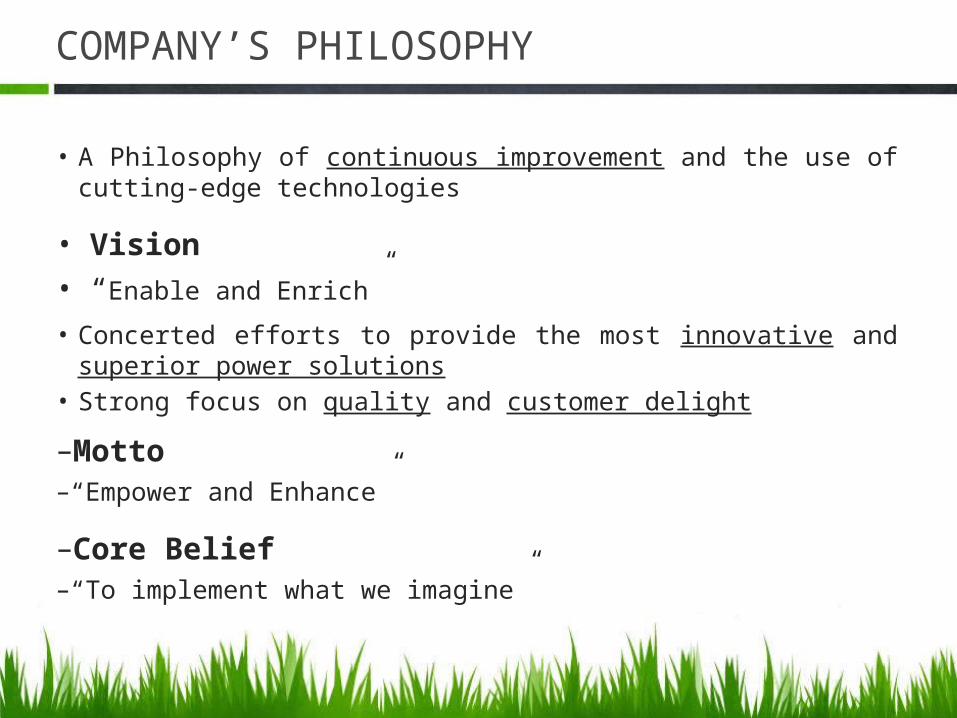
• A Philosophy of continuous improvement and the use of cutting-edge technologies
• Vision• “Enable and Enrich”
• Concerted efforts to provide the most innovative and superior power solutions
• Strong focus on quality and customer delight
–Motto–“Empower and Enhance”
–Core Belief–“To implement what we imagine”
OBSERVATION ON THE COMPANY
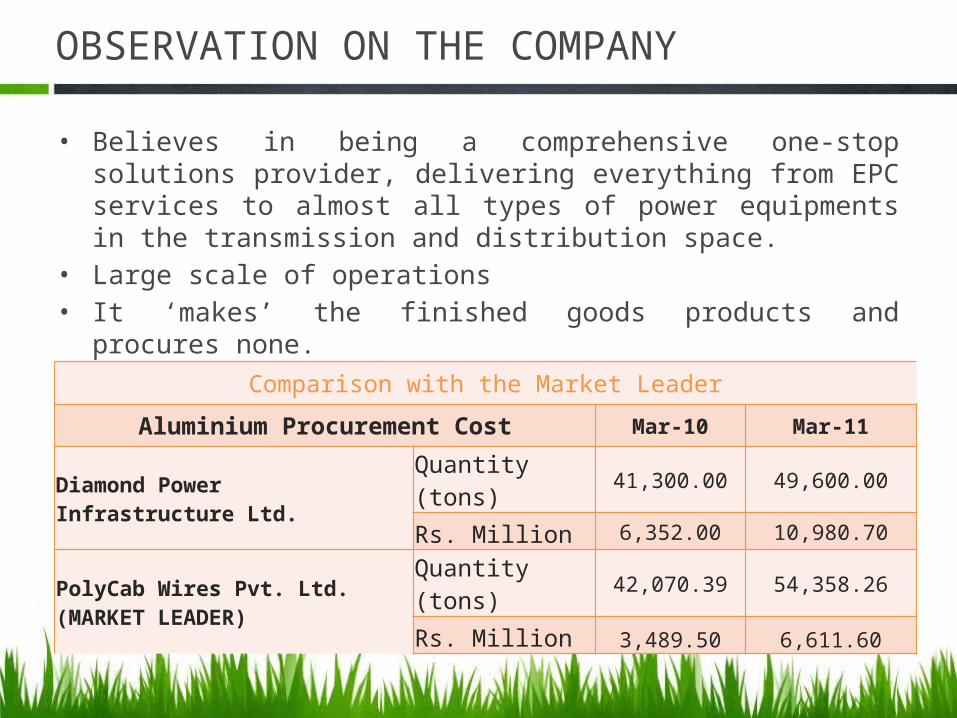
• Believes in being a comprehensive one-stop solutions provider, delivering everything from EPC services to almost all types of power equipments in the transmission and distribution space.
• Large scale of operations• It ‘makes’ the finished goods products and procures none.• The raw materials expense / sales revenue is as high as ~ 90%.
Comparison with the Market Leader
Aluminium Procurement Cost Mar-10 Mar-11
Diamond Power Infrastructure Ltd.Quantity(tons) 41,300.00 49,600.00
Rs. Million 6,352.00 10,980.70
PolyCab Wires Pvt. Ltd.(MARKET LEADER)
Quantity(tons) 42,070.39 54,358.26
Rs. Million 3,489.50 6,611.60
PROCUREMENT GOALS
• Focus on procuring raw materials at better prices• Leverage on the economies of scale of production for major turn-key
projects• Divide the procurement strategy into a minimum consistent demand
and variable demand• For minimum consistent demand build trust and strong relationship
with vendors in order to provide world-class single-window solutions to customers at a good price
• For variable demand go for transactional and bidding based purchase
• Develop a portfolio analysis (for items identified in step 2)
• List /identify problems that this company would have experienced with these items in the past, identify future problems and opportunities
PART B
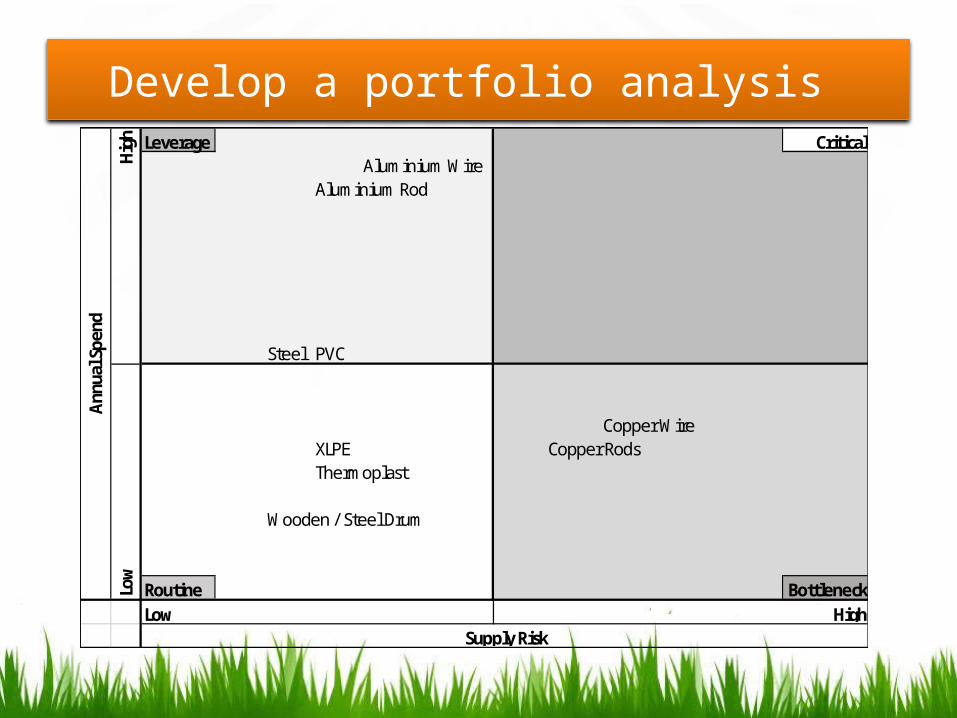
Develop a portfolio analysis Leverage Critical
Aluminium WireAluminium Rod
Steel PVC
Copper WireXLPE Copper RodsThermoplast
Wooden / Steel Drum
Routine Bottleneck
Annu
al S
pend
Low HighSupply Risk
High
Low
List /identify problems that this company would have experienced with these items in the past, identify future problems and opportunities
Issue with fluctuating prices of copper in India
• The recent order of the Tamil Nadu Pollution Control Board (TNPCB) asking Sterlite Industries(India's biggest copper smelter) to immediately shut down its copper smelter in Tuticorin for 1 week that pushed copper prices higher in India in the short term
• The copper demand in India is currently not very strong and companies do have inventory build ups so If the shutdown is prolonged then there might be an upward move in copper prices
• Sterlite Industries' STRL.NS plant, which meets half of India's copper demand, was closed on March 30 after residents complained of emissions that led to breathing problems
• The plant produces 30,000 tonnes of refined copper a month - or more than half of India's total production
• Cashing in on regional oversupply after the Sterlite closure, smelters across Asia started charging the highest fees in five months to process concentrates.
Future problems and opportunities
Future Problems
• Operational Risk – resulting from production stoppages, risk of present technology being outdated and business process failure
• Market Related Risk – arising out of competition, fluctuation in copper metal prices, quality assurances, customer satisfaction
• Financial Risk – pertaining to fluctuation in currencies, liquidity problems, capital availability
Opportunities
• High level of service from supplier of Steel and PVC as these are Leverage item for the company which include supplier capabilities such as management of onsite inventory, e-purchasing capability and ability to respond quickly to our requirement
• Higher level of quality from supplier of these raw material
• Reduction in the total cost of raw material to business
PART C• Develop a comprehensive Supply Market
Research for 2 items identified in each quadrant.• Propose appropriate Sourcing strategy with an
action plan –Insourcing vs Outsourcing (Make or Buy) –Identify one item/process that can be globally sourced and list down the likely barriers in sourcing from global sources along with a listing of the risks associated.
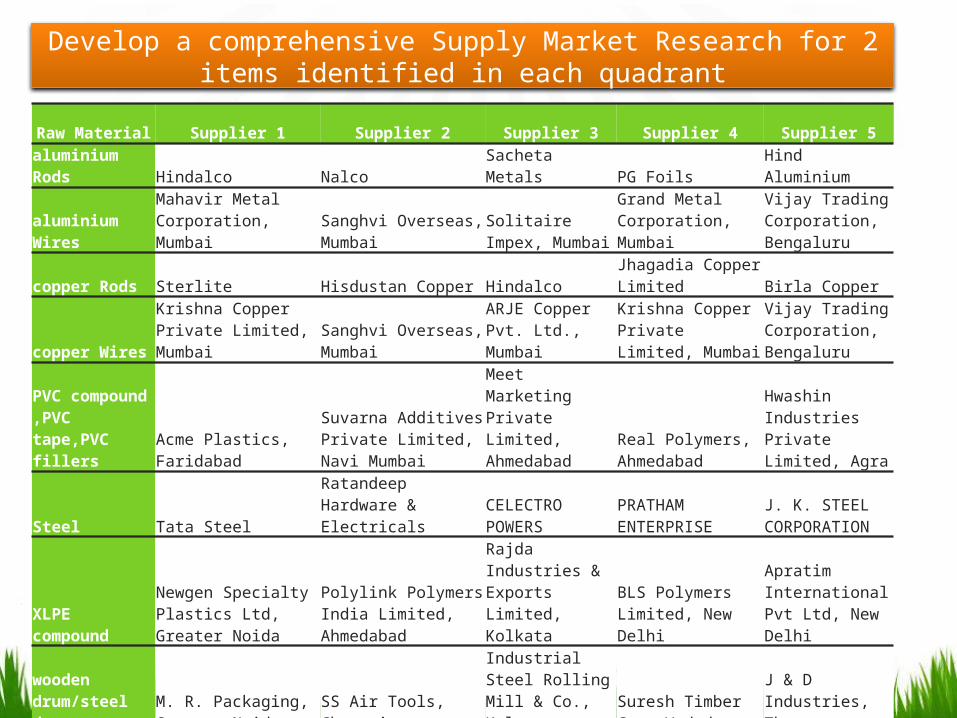
Develop a comprehensive Supply Market Research for 2 items identified in each quadrant
Raw Material Supplier 1 Supplier 2 Supplier 3 Supplier 4 Supplier 5
aluminium Rods Hindalco Nalco Sacheta Metals PG Foils Hind Aluminium
aluminium WiresMahavir Metal Corporation, Mumbai
Sanghvi Overseas, Mumbai
Solitaire Impex, Mumbai
Grand Metal Corporation, Mumbai
Vijay Trading Corporation, Bengaluru
copper Rods Sterlite Hisdustan Copper HindalcoJhagadia Copper Limited Birla Copper
copper WiresKrishna Copper Private Limited, Mumbai
Sanghvi Overseas, Mumbai
ARJE Copper Pvt. Ltd., Mumbai
Krishna Copper Private Limited, Mumbai
Vijay Trading Corporation, Bengaluru
PVC compound ,PVC tape,PVC fillers Acme Plastics, Faridabad
Suvarna Additives Private Limited, Navi Mumbai
Meet Marketing Private Limited, Ahmedabad
Real Polymers, Ahmedabad
Hwashin Industries Private Limited, Agra
Steel Tata SteelRatandeep Hardware & Electricals CELECTRO POWERS
PRATHAM ENTERPRISE
J. K. STEEL CORPORATION
XLPE compound
Newgen Specialty Plastics Ltd, Greater Noida
Polylink Polymers India Limited, Ahmedabad
Rajda Industries & Exports Limited, Kolkata
BLS Polymers Limited, New Delhi
Apratim International Pvt Ltd, New Delhi
wooden drum/steel drum
M. R. Packaging, Greater Noida SS Air Tools, Chennai
Industrial Steel Rolling Mill & Co., Kalyan
Suresh Timber Co., Vadodara
J & D Industries, Thane
thermoplastic sheaths
Osaka Rubber Private Limited, Mumbai
Maharashtra Polymer Products, Thane
Newgen Specialty Plastics Ltd., Noida
Technovinyl Polymers India Ltd., Mumbai
Sperry Plast Limited., New Delhi
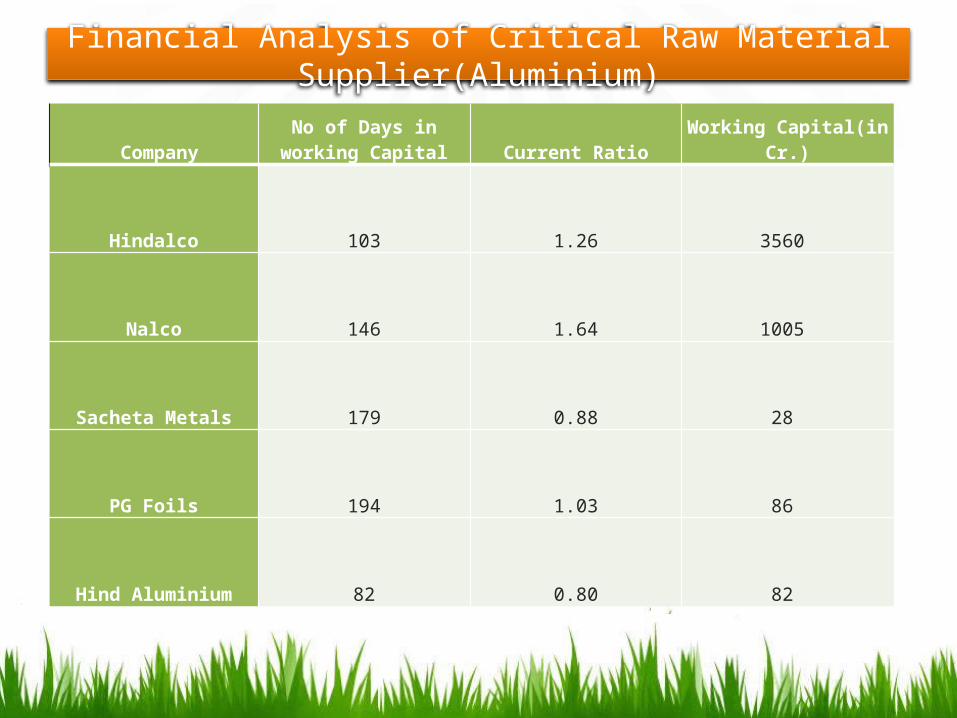
Financial Analysis of Critical Raw Material Supplier(Aluminium)
CompanyNo of Days in working
Capital Current Ratio Working Capital(in Cr.)
Hindalco 103 1.26 3560
Nalco 146 1.64 1005
Sacheta Metals 179 0.88 28
PG Foils 194 1.03 86
Hind Aluminium 82 0.80 82
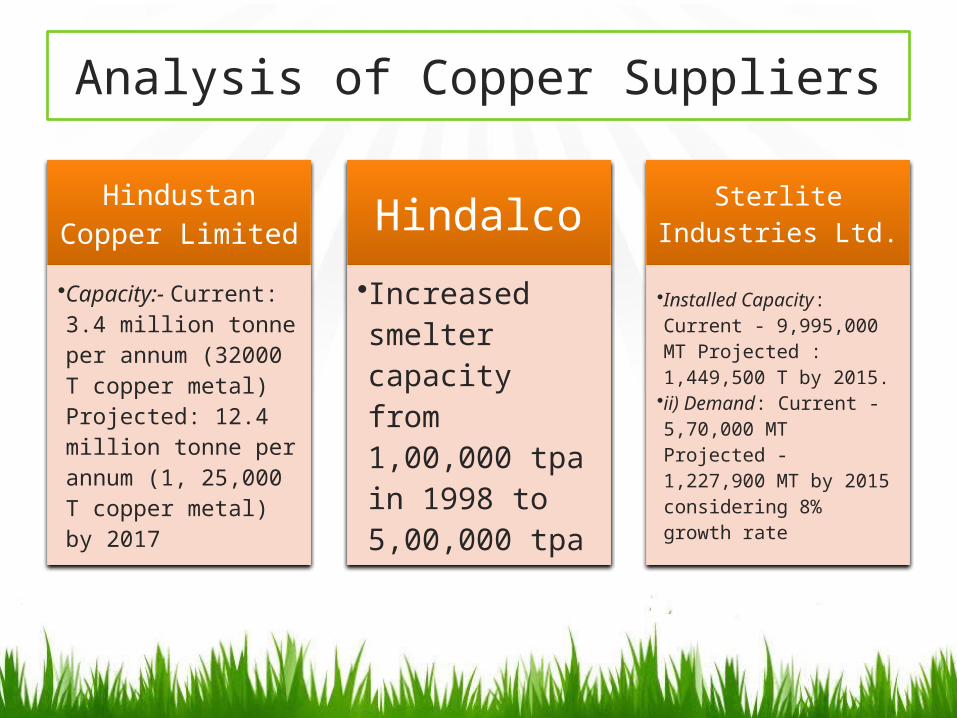
Analysis of Copper Suppliers
Hindustan Copper Limited •Capacity:- Current: 3.4 million tonne per annum (32000 T copper metal) Projected: 12.4 million tonne per annum (1, 25,000 T copper metal) by 2017
Hindalco•Increased smelter capacity from 1,00,000 tpa in 1998 to 5,00,000 tpa
Sterlite Industries Ltd. •Installed Capacity: Current - 9,995,000 MT Projected : 1,449,500 T by 2015. •ii) Demand: Current - 5,70,000 MT Projected - 1,227,900 MT by 2015 considering 8% growth rate
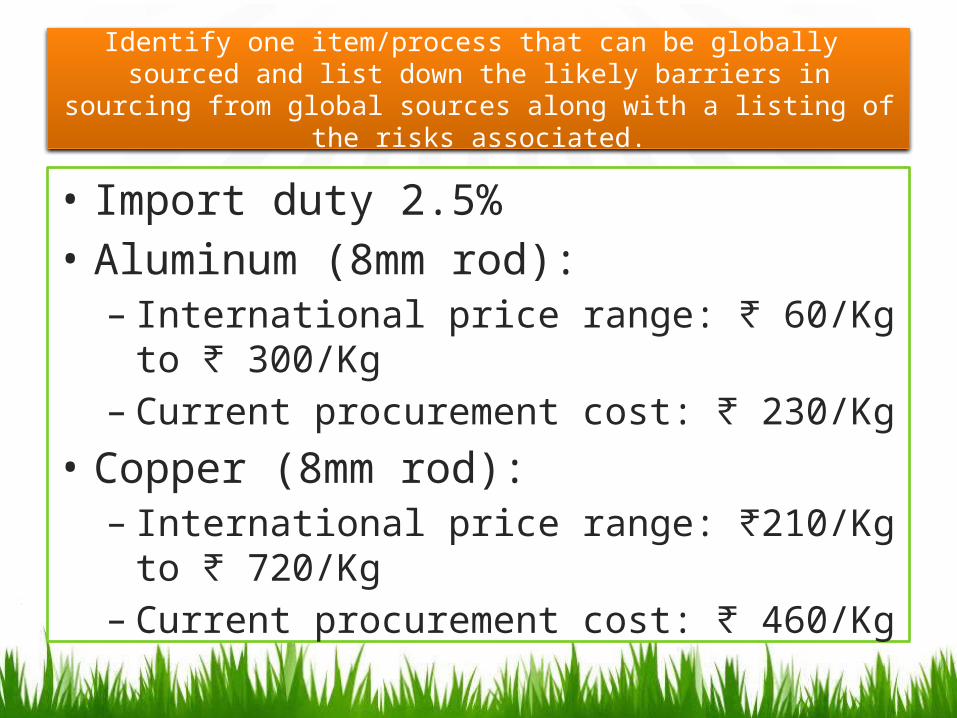
Identify one item/process that can be globally sourced and list down the likely barriers in sourcing from global sources along with a listing of the risks
associated.
• Import duty 2.5%• Aluminum (8mm rod):– International price range: ₹ 60/Kg to ₹ 300/Kg– Current procurement cost: ₹ 230/Kg
• Copper (8mm rod):– International price range: ₹210/Kg to ₹ 720/Kg– Current procurement cost: ₹ 460/Kg