Embed Size (px)
DESCRIPTION
Presentation by Tuomas Jokela, VTT Technical Research Centre Of Finland at Winterwind 2012, session 5a. "Windcube measurement data correction by CFD method for fjeld region"
Citation preview
Windcube Measurement Data Correction by CFD Method for Fjeld Region Tuomas Jokela1, Petteri Antikainen1, Andrea Vignaroli2, Fredrik Öhrvall3, Thomas Mannelqvist3 & Daniel Eriksson3 1VTT Technical Research Centre Of Finland 2WindSim AS & 3Skellefteå Kraft AB

2012-02-12 2
Partners
2012-02-12 3
Content of Presentation
§ Description of Measurement Site
§ Forecast of Study
§ Lidar Operating Performance in Arctic Conditions
§ Analysing Methods
§ Results of Measurement Campaign
§ CFD Based Remote Sensing Correction
§ Conclusion and Future
2012-02-12 4
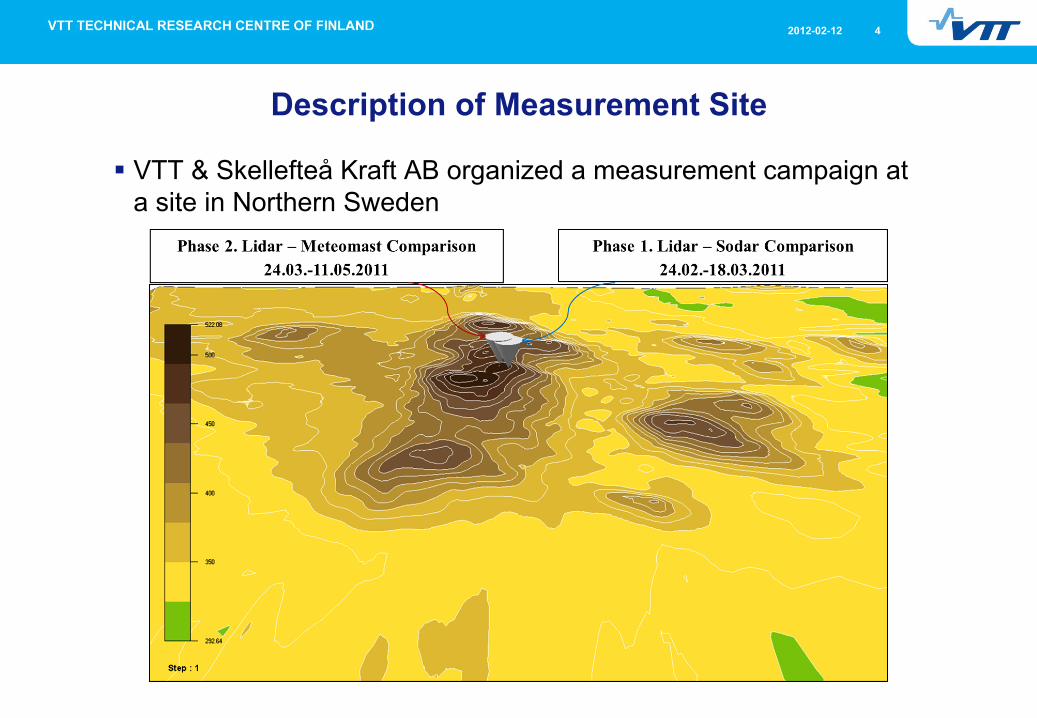
Description of Measurement Site
§ VTT & Skellefteå Kraft AB organized a measurement campaign at a site in Northern Sweden
2012-02-12 5
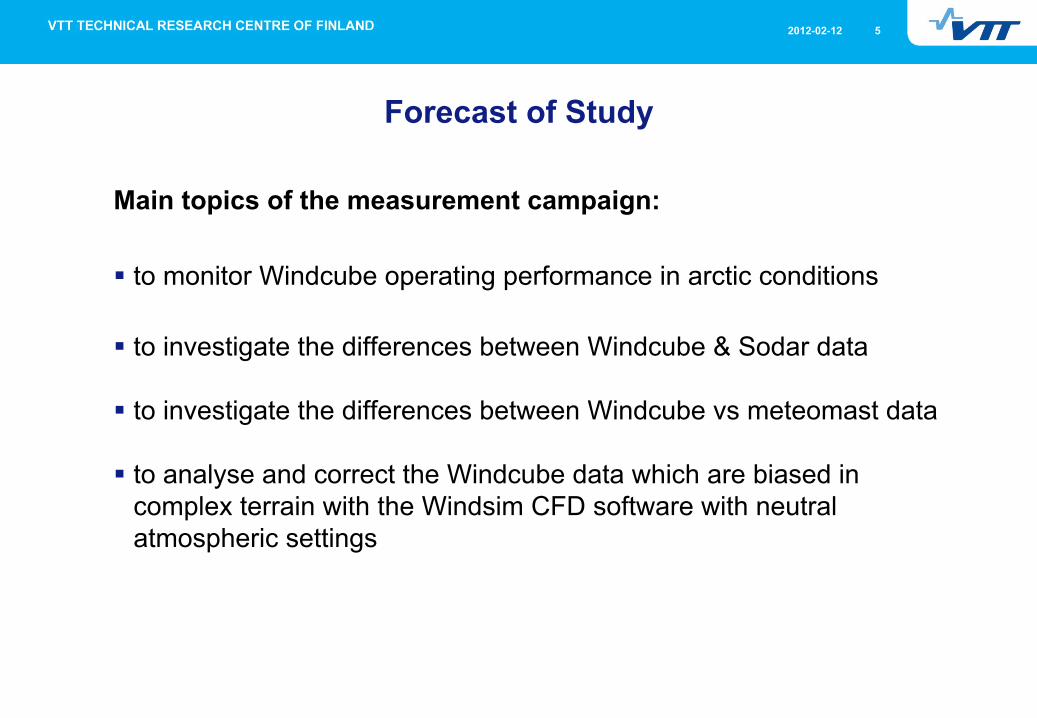
Forecast of Study
Main topics of the measurement campaign:
§ to monitor Windcube operating performance in arctic conditions
§ to investigate the differences between Windcube & Sodar data
§ to investigate the differences between Windcube vs meteomast data
§ to analyse and correct the Windcube data which are biased in complex terrain with the Windsim CFD software with neutral atmospheric settings
2012-02-12 6
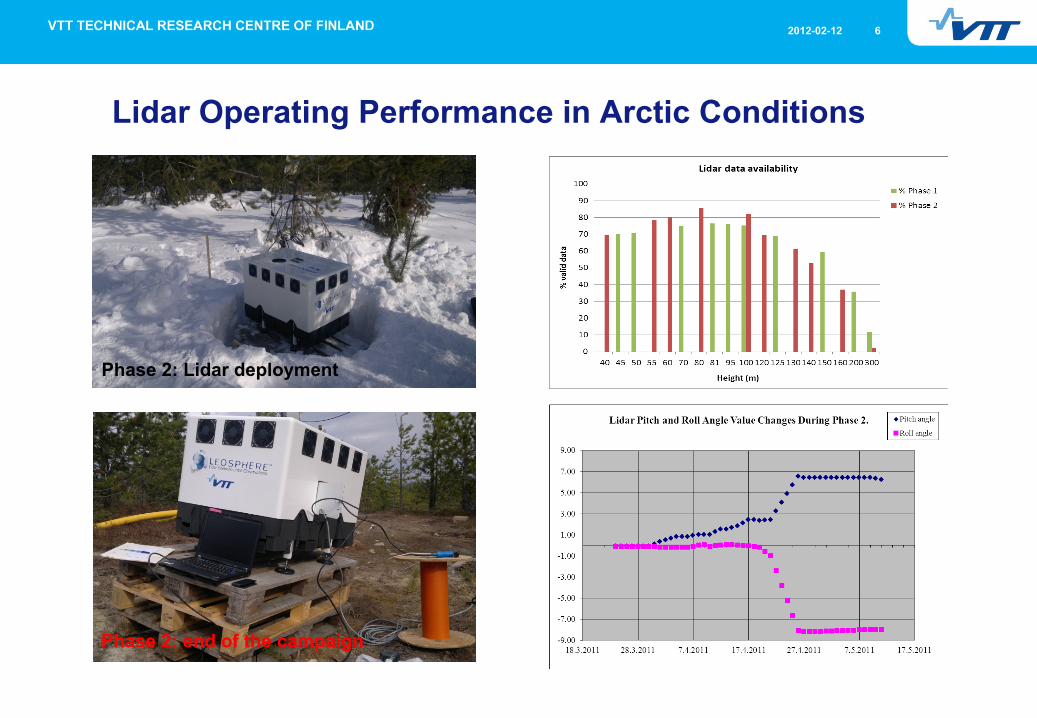
Lidar Operating Performance in Arctic Conditions
Phase 2: Lidar deployment
Phase 2: end of the campaign
2012-02-12 7
Analysing Methods
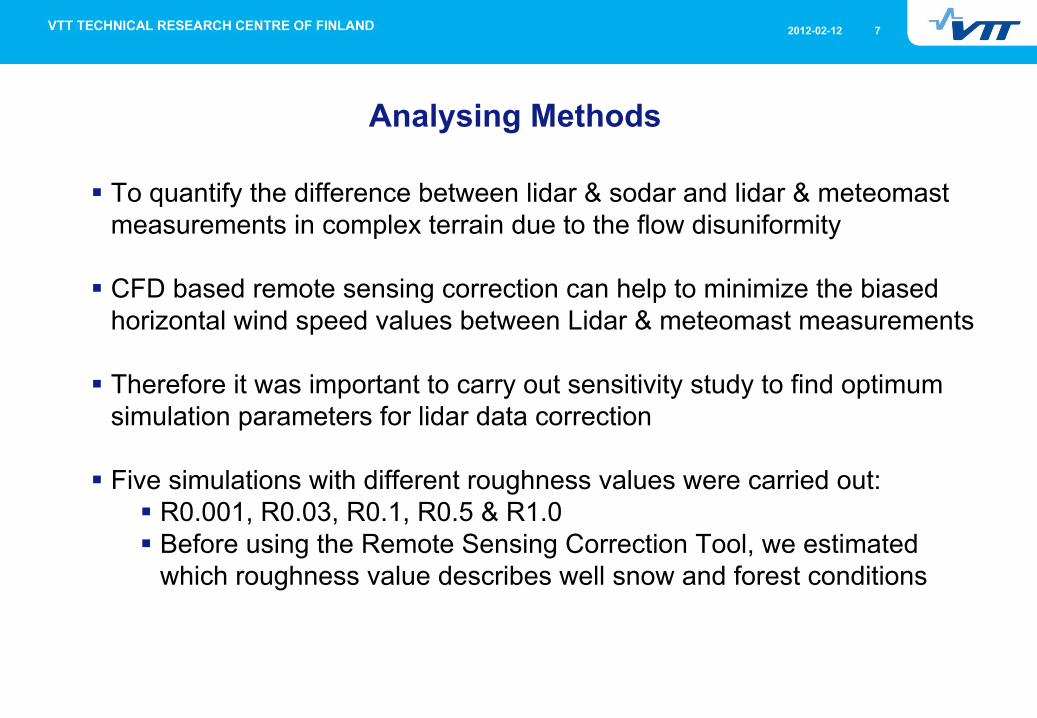
§ To quantify the difference between lidar & sodar and lidar & meteomast measurements in complex terrain due to the flow disuniformity
§ CFD based remote sensing correction can help to minimize the biased
horizontal wind speed values between Lidar & meteomast measurements § Therefore it was important to carry out sensitivity study to find optimum
simulation parameters for lidar data correction
§ Five simulations with different roughness values were carried out: § R0.001, R0.03, R0.1, R0.5 & R1.0 § Before using the Remote Sensing Correction Tool, we estimated
which roughness value describes well snow and forest conditions
2012-02-12 8
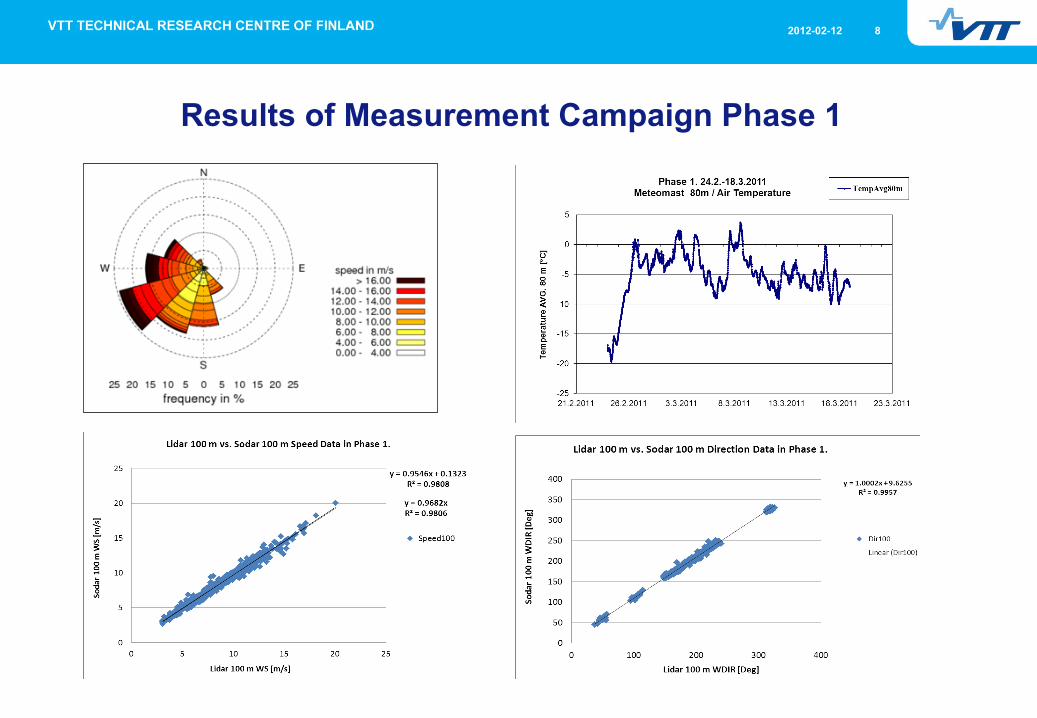
Results of Measurement Campaign Phase 1
2012-02-12 9
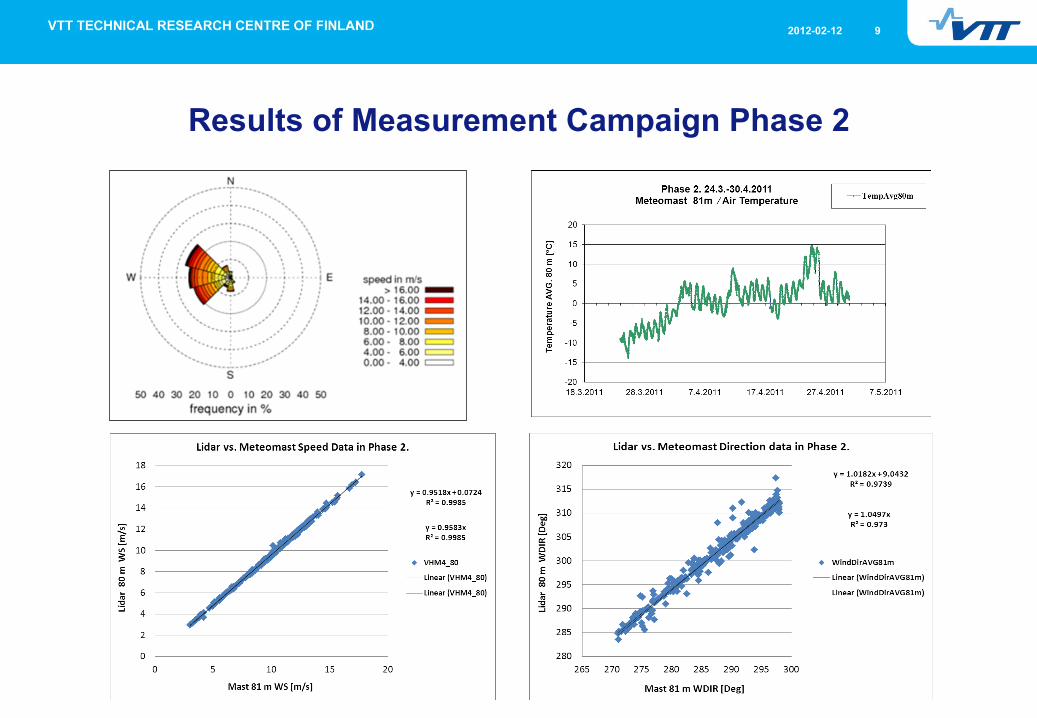
Results of Measurement Campaign Phase 2

2012-02-12 10
CFD Based Remote Sensing Correction
° Phase 2: volume measurement (vectors) vs point measurement (scalars)
° Phase 1: volume measurement (laser) vs volume measurement (sound)
Sensitivity Study Data Correction
Corrected (Lidar)Z0 (m) type Correlation0.001 Snow 91.4 %0.03 99.2 %0.1 99.1 %0.5 98.7 %1.0 Forest 98.7 %
Phas
e2
WS [m/s] Lidar 80 m vs Meteomast 81 mMeasured Roughness
Correlation
95.2 % ↓
Phas
e1
WS [m/s] Sodar 100 m vs Lidar 100 mMeasured Lidar Corrected vs Sodar No Corr.
Correlation Correlation
95.5 % 93.5 %
2012-02-12 11
Conclusion and Future Based on this case study our first conclusion is:
§ The Lidar campaign completed in Northern Sweden with some challenges
§ Tough deploying conditions: Lidar started tilting,due to melting snow § Low data availability during the winter storms § Lidar indicated 5 % lower values compared to the mast measurements § With CFD simulations it is possible to reduce the 5 % error into 1 %
§ CFD software predicts a smaller correction value in Lidar vs Sodar comparison: → The wind flow is more uniform on the side of the hill compared to the hilltop → It is important to plan where to deploy the Windcube to optimise the data
quality
Future: § It would be important to continue this case study with simulation parameters
which take into account the atmospheric stability and forest modelling
§ It would be also interesting to study the Lidar correction also with Wasp engineering software and see the difference between these two simulation softwares

2012-02-12 12
VTT creates business from technology