Embed Size (px)
Citation preview
BNEF WIND ENERGY BRIEFING
Yiyi Zhou
28 April 2016
1
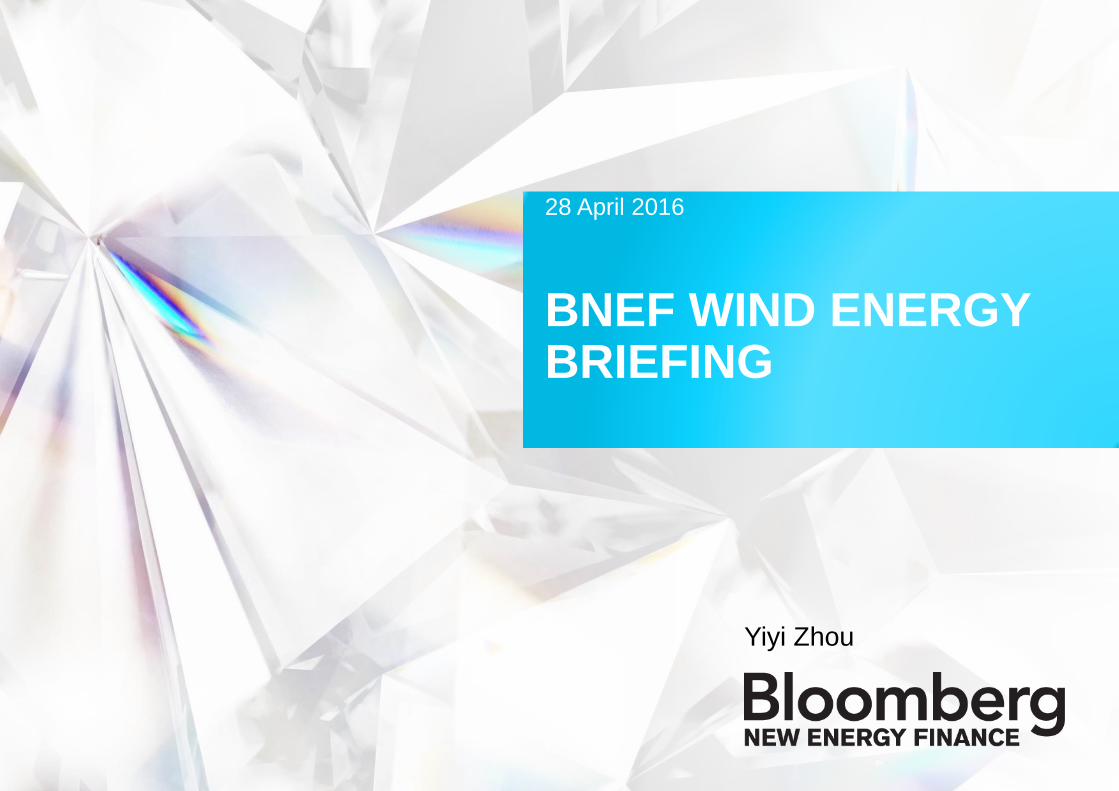
LEVERAGING THE POWER OF BLOOMBERG
Since 1981
Over 15,000 employees
in 192 locations
Generating 5,000 news stories
per day from 150 bureaus
320,000 global clients
Since 2004
200 employees
in 15 locations on six continents
Generating over 700 Insight
reports annually
2,500 global clients
2
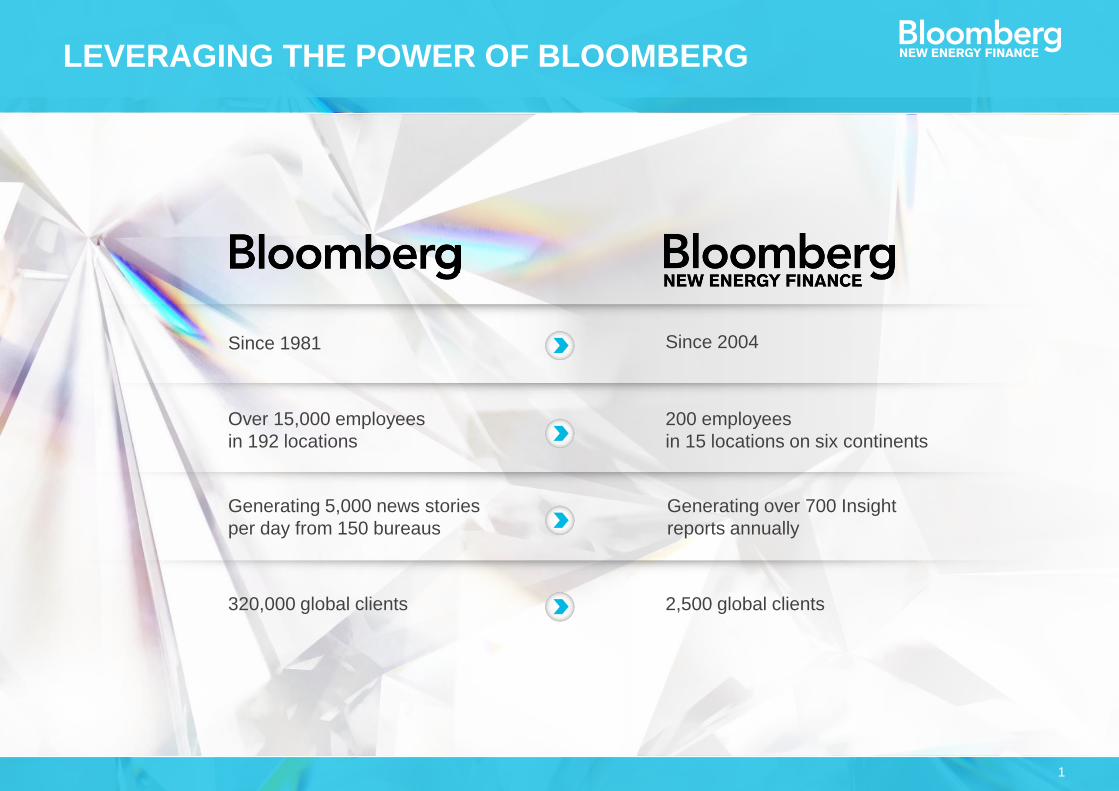
200 ENERGY EXPERTS WITH STRONG KNOWLEDGE AND NETWORK ACROSS SIX CONTINENTS
San
Francisco
Washington DC
Sao Paulo
Cape Town Sydney
Singapore
Zurich
Munich
London
New DelhiHong
Kong
Tokyo
Beijing
Seoul
New York
North America
40
SouthAmerica
5
Europe90
Africa30
AsiaPacific
40
3
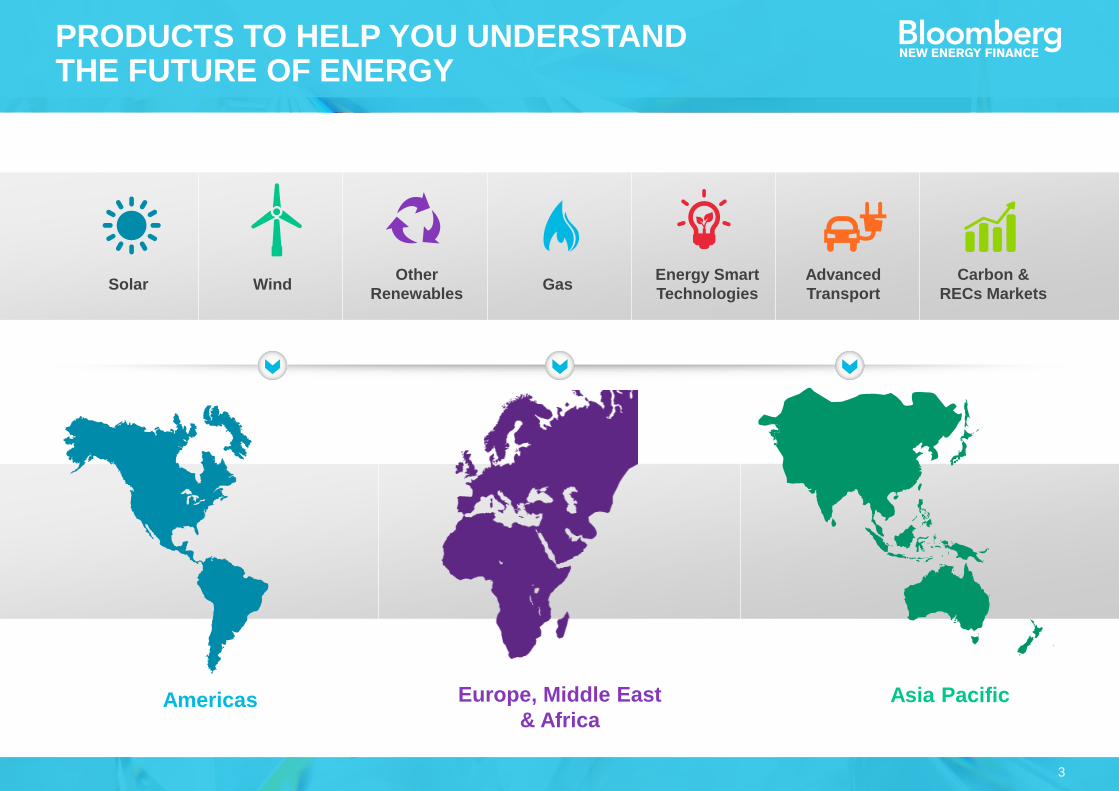
Europe, Middle East
& Africa
Asia PacificAmericas
PRODUCTS TO HELP YOU UNDERSTAND THE FUTURE OF ENERGY
Solar WindOther
Renewables
Advanced
Transport
Energy Smart
TechnologiesGas
Carbon &
RECs Markets
4
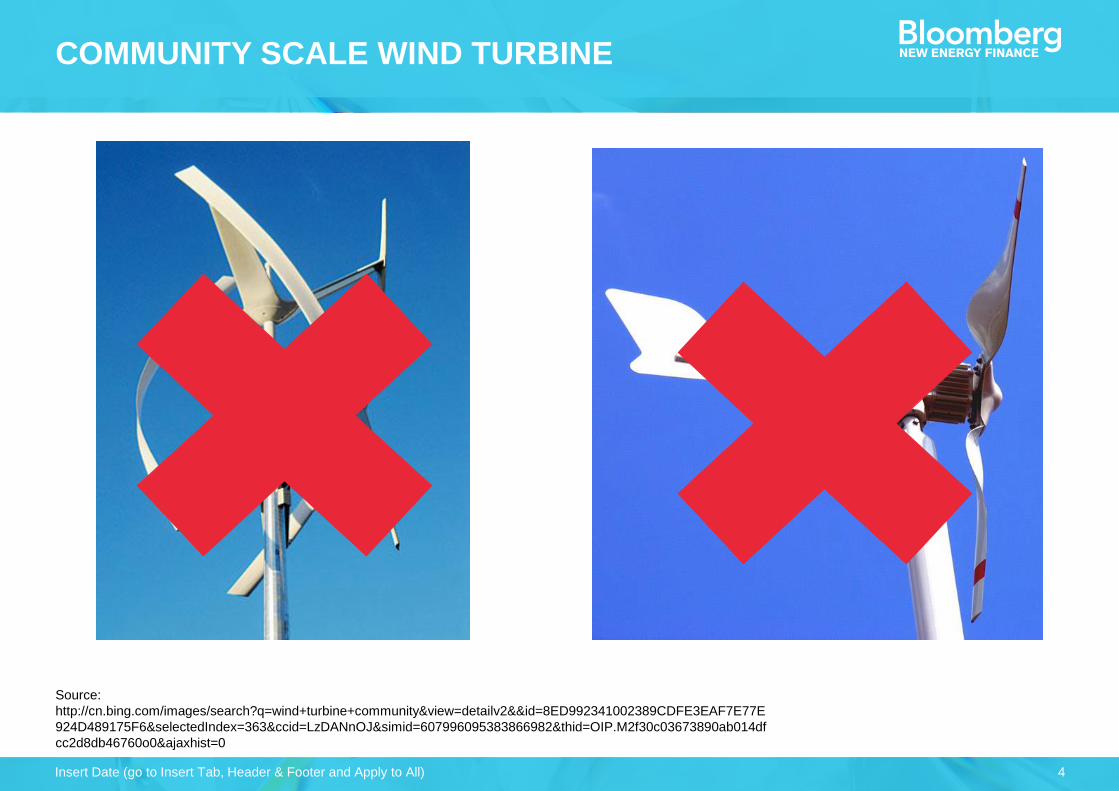
Source:
http://cn.bing.com/images/search?q=wind+turbine+community&view=detailv2&&id=8ED992341002389CDFE3EAF7E77E
924D489175F6&selectedIndex=363&ccid=LzDANnOJ&simid=607996095383866982&thid=OIP.M2f30c03673890ab014df
cc2d8db46760o0&ajaxhist=0
Insert Date (go to Insert Tab, Header & Footer and Apply to All)
COMMUNITY SCALE WIND TURBINE
5
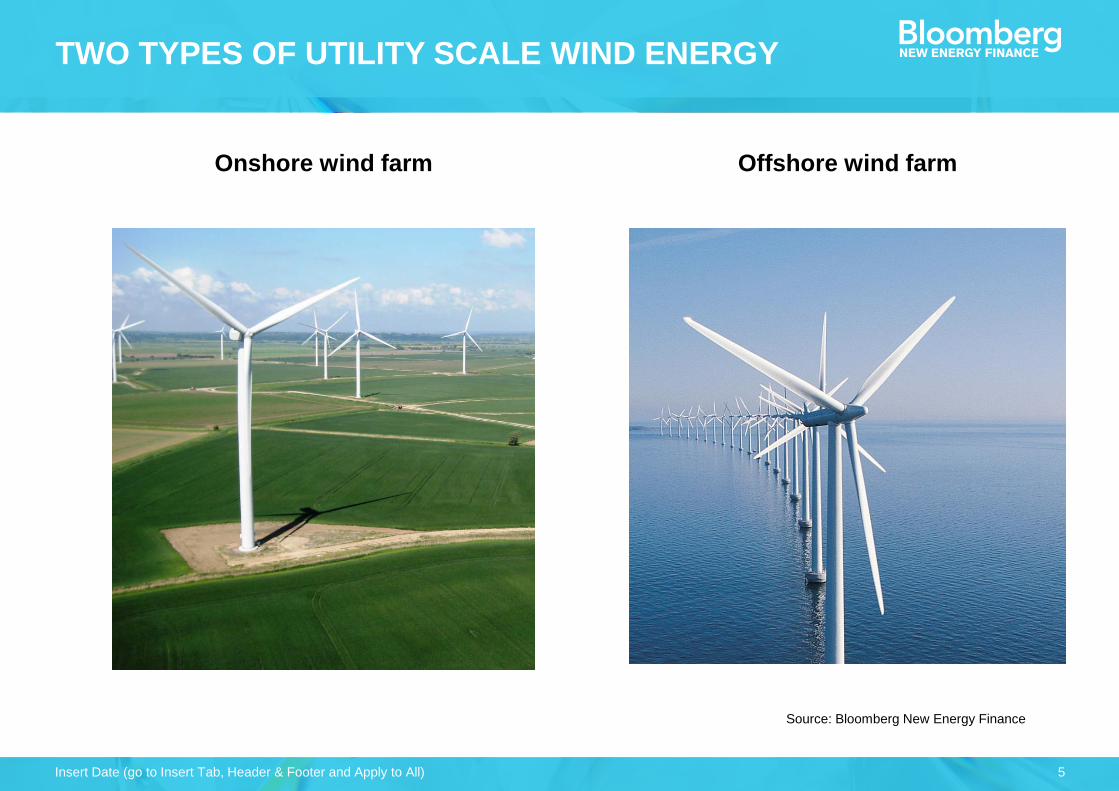
Source: Bloomberg New Energy Finance
Insert Date (go to Insert Tab, Header & Footer and Apply to All)
TWO TYPES OF UTILITY SCALE WIND ENERGY
Offshore wind farmOnshore wind farm
6
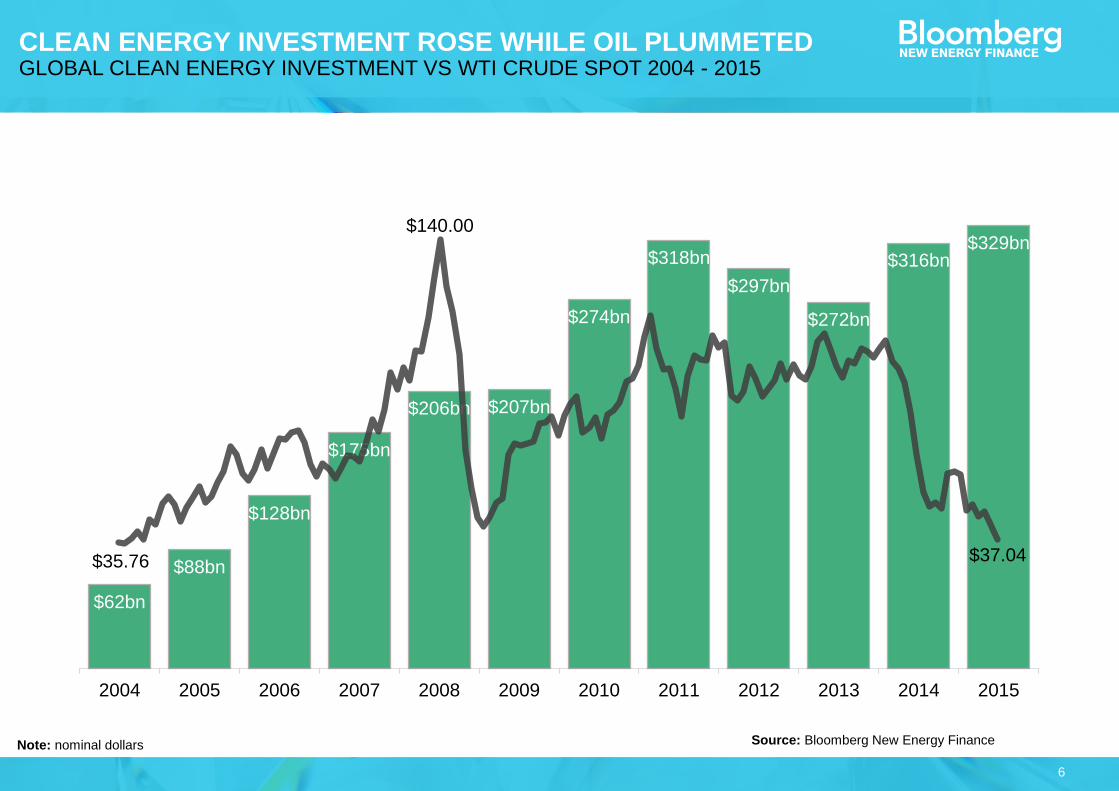
CLEAN ENERGY INVESTMENT ROSE WHILE OIL PLUMMETEDGLOBAL CLEAN ENERGY INVESTMENT VS WTI CRUDE SPOT 2004 - 2015
$62bn
$88bn
$128bn
$175bn
$206bn $207bn
$274bn
$318bn
$297bn
$272bn
$316bn$329bn
2004 2005 2006 2007 2008 2009 2010 2011 2012 2013 2014 2015
$37.04
$140.00
$35.76
Source: Bloomberg New Energy FinanceNote: nominal dollars
7
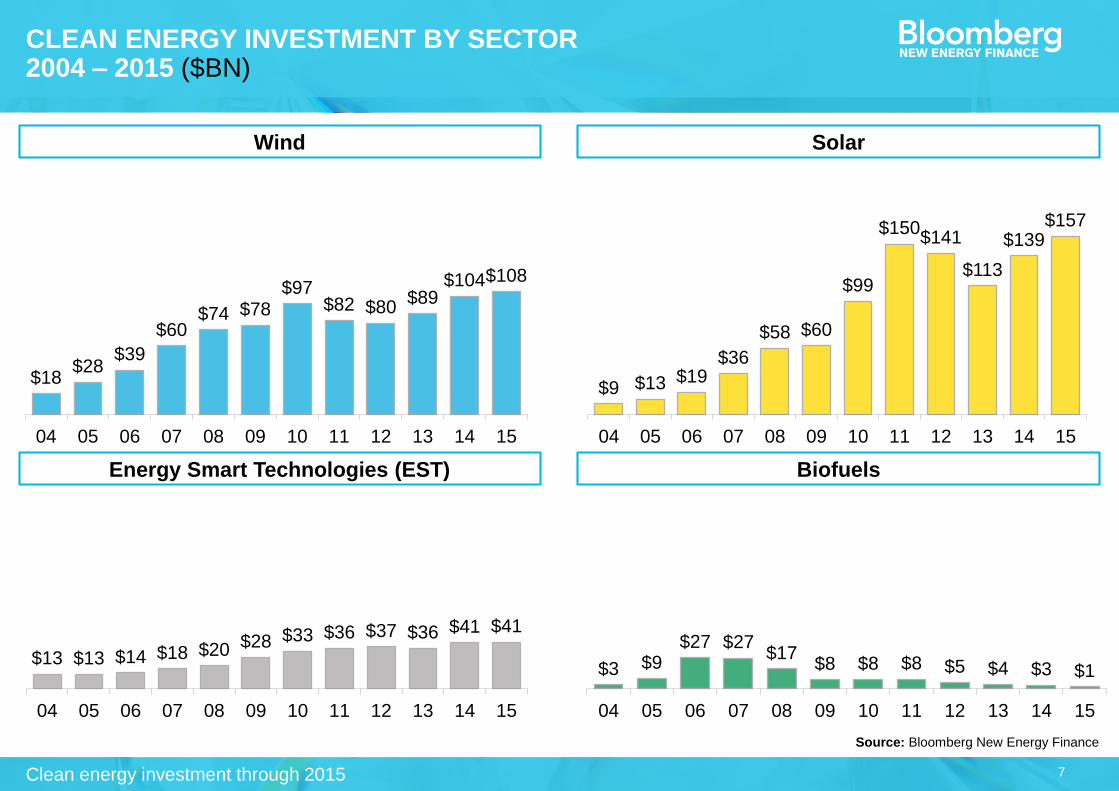
CLEAN ENERGY INVESTMENT BY SECTOR2004 – 2015 ($BN)
Wind Solar
Energy Smart Technologies (EST) Biofuels
Source: Bloomberg New Energy Finance
Clean energy investment through 2015
$18$28
$39
$60$74 $78
$97$82 $80
$89$104$108
04 05 06 07 08 09 10 11 12 13 14 15
$9 $13 $19$36
$58 $60
$99
$150$141
$113
$139$157
04 05 06 07 08 09 10 11 12 13 14 15
$13 $13 $14 $18 $20 $28 $33 $36 $37 $36 $41 $41
04 05 06 07 08 09 10 11 12 13 14 15
$3 $9$27 $27
$17$8 $8 $8 $5 $4 $3 $1
04 05 06 07 08 09 10 11 12 13 14 15
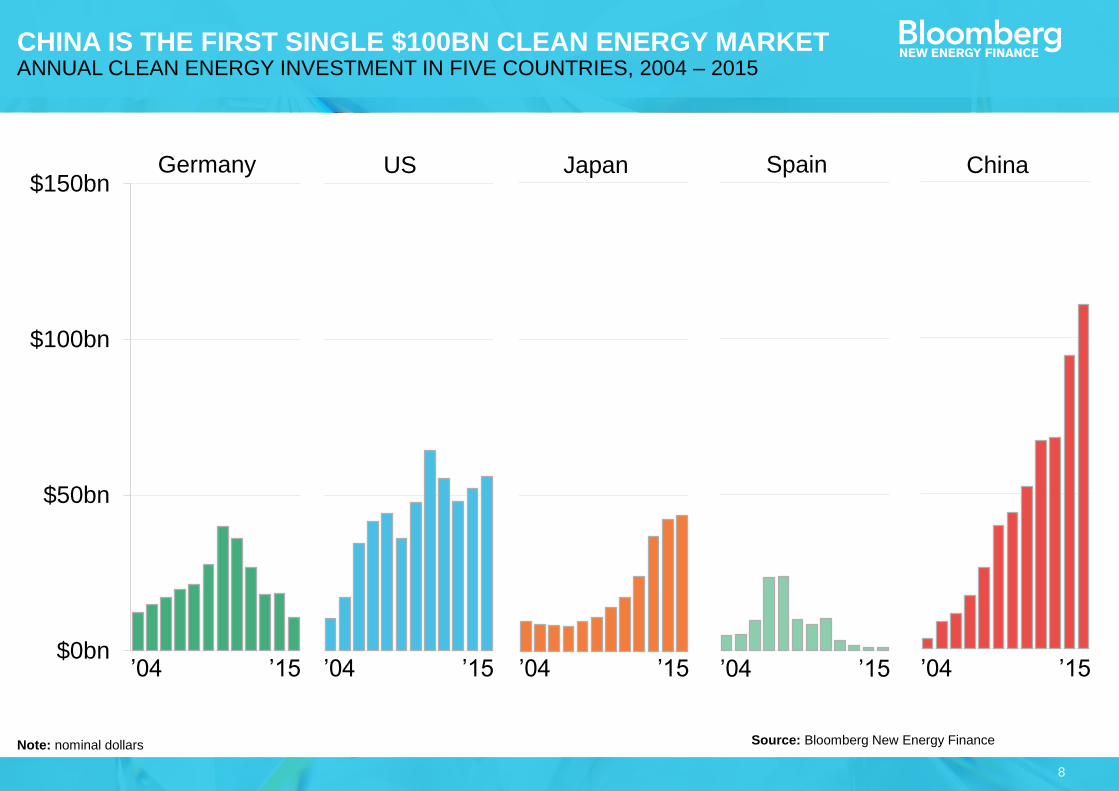
8
CHINA IS THE FIRST SINGLE $100BN CLEAN ENERGY MARKETANNUAL CLEAN ENERGY INVESTMENT IN FIVE COUNTRIES, 2004 – 2015
$0bn
$50bn
$100bn
$150bn
$0bn
$50bn
$100bn
$150bn
$0bn
$50bn
$100bn
$150bn
$0bn
$50bn
$100bn
$150bn
$0bn
$50bn
$100bn
$150bnGermany US Japan Spain China
’04 ’15 ’04 ’15 ’04 ’15 ’04 ’15 ’04 ’15
Source: Bloomberg New Energy FinanceNote: nominal dollars
9
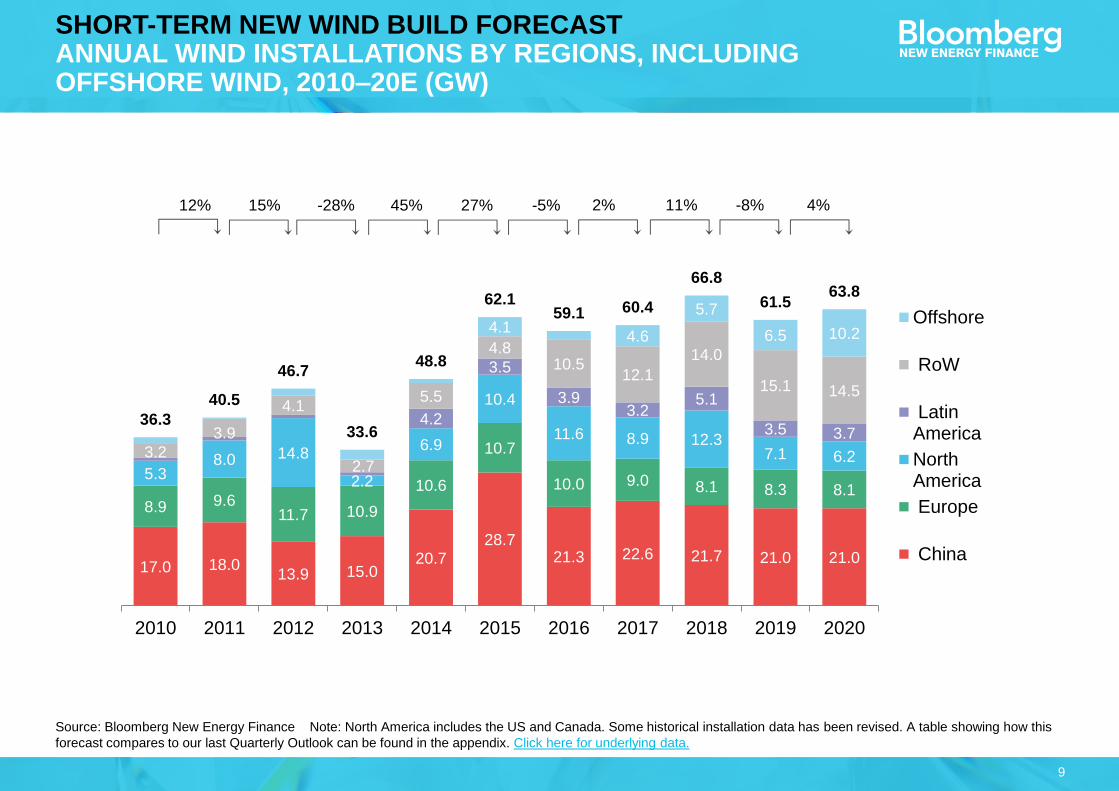
Source: Bloomberg New Energy Finance Note: North America includes the US and Canada. Some historical installation data has been revised. A table showing how this
forecast compares to our last Quarterly Outlook can be found in the appendix. Click here for underlying data.
SHORT-TERM NEW WIND BUILD FORECASTANNUAL WIND INSTALLATIONS BY REGIONS, INCLUDING OFFSHORE WIND, 2010–20E (GW)
17.0 18.013.9 15.0
20.728.7
21.3 22.6 21.7 21.0 21.0
8.9 9.611.7 10.9
10.6
10.7
10.0 9.0 8.1 8.3 8.15.3
8.0 14.8
2.2
6.9
10.4
11.6 8.9 12.37.1 6.2
4.2
3.5
3.93.2
5.1
3.5 3.7
3.2
3.9
4.1
2.7
5.5
4.810.5
12.1
14.0
15.1 14.5
4.14.6
5.7
6.5 10.2
36.3
40.5
46.7
33.6
48.8
62.159.1 60.4
66.8
61.563.8
2010 2011 2012 2013 2014 2015 2016 2017 2018 2019 2020
Offshore
RoW
LatinAmerica
NorthAmerica
Europe
China
12% 15% -28% 45% 27% -5% 2% 11% -8% 4%
10
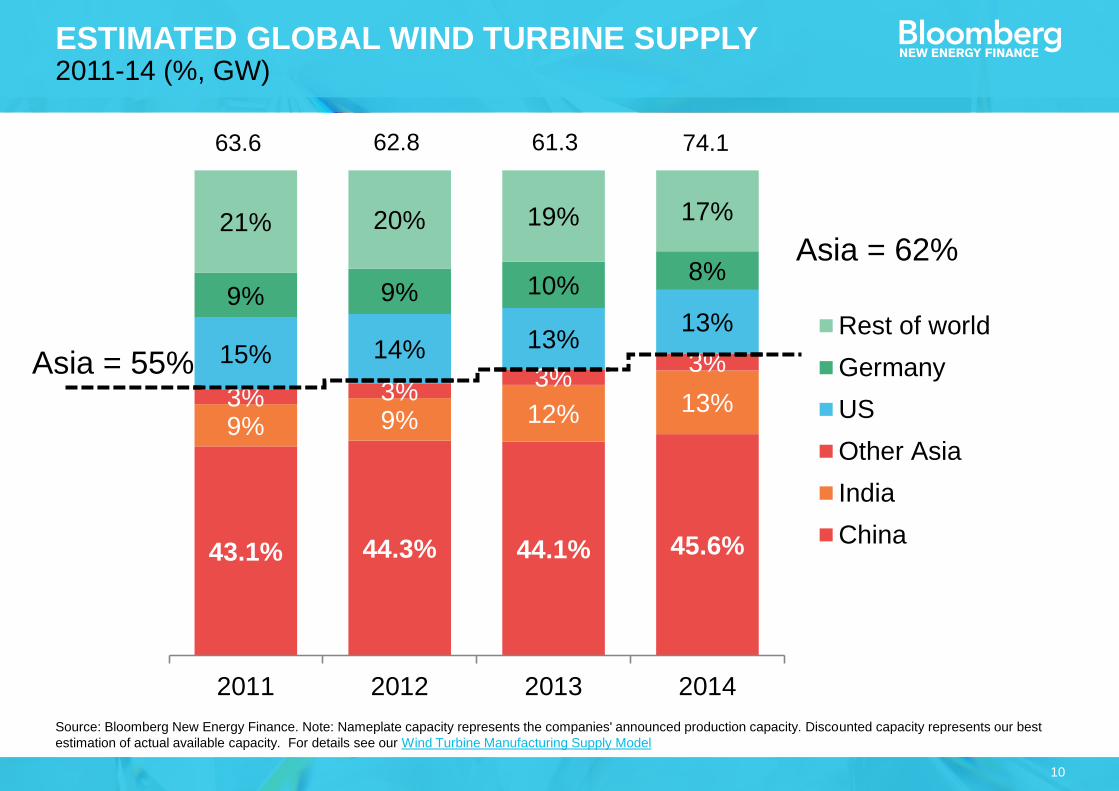
Source: Bloomberg New Energy Finance. Note: Nameplate capacity represents the companies' announced production capacity. Discounted capacity represents our best
estimation of actual available capacity. For details see our Wind Turbine Manufacturing Supply Model
ESTIMATED GLOBAL WIND TURBINE SUPPLY2011-14 (%, GW)
43.1% 44.3% 44.1% 45.6%
9% 9% 12% 13%3% 3%3%
3%15% 14% 13%13%
9% 9% 10%8%
21% 20% 19% 17%
2011 2012 2013 2014
Rest of world
Germany
US
Other Asia
India
China
63.6 62.8 61.3 74.1
Asia = 62%
Asia = 55%
11
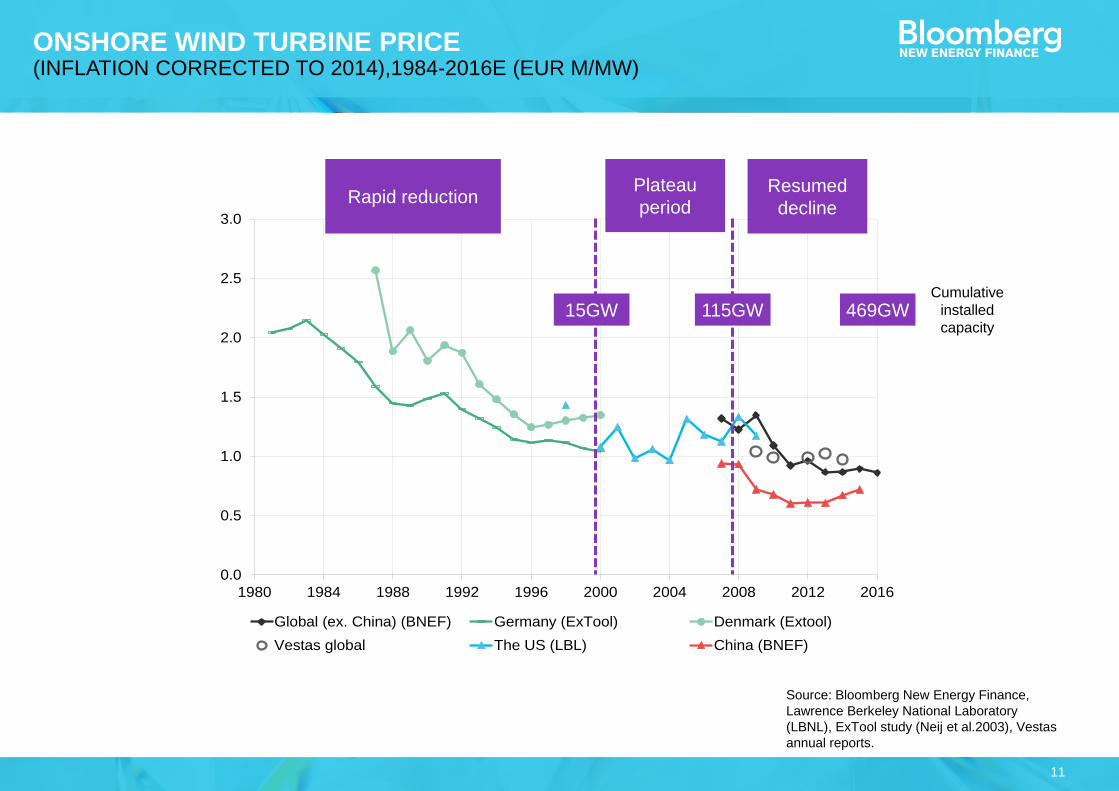
Source: Bloomberg New Energy Finance,
Lawrence Berkeley National Laboratory
(LBNL), ExTool study (Neij et al.2003), Vestas
annual reports.
ONSHORE WIND TURBINE PRICE(INFLATION CORRECTED TO 2014),1984-2016E (EUR M/MW)
0.0
0.5
1.0
1.5
2.0
2.5
3.0
1980 1984 1988 1992 1996 2000 2004 2008 2012 2016
Global (ex. China) (BNEF) Germany (ExTool) Denmark (Extool)
Vestas global The US (LBL) China (BNEF)
Rapid reductionPlateau
periodResumed
decline
15GW 115GW 469GWCumulative
installed
capacity
12
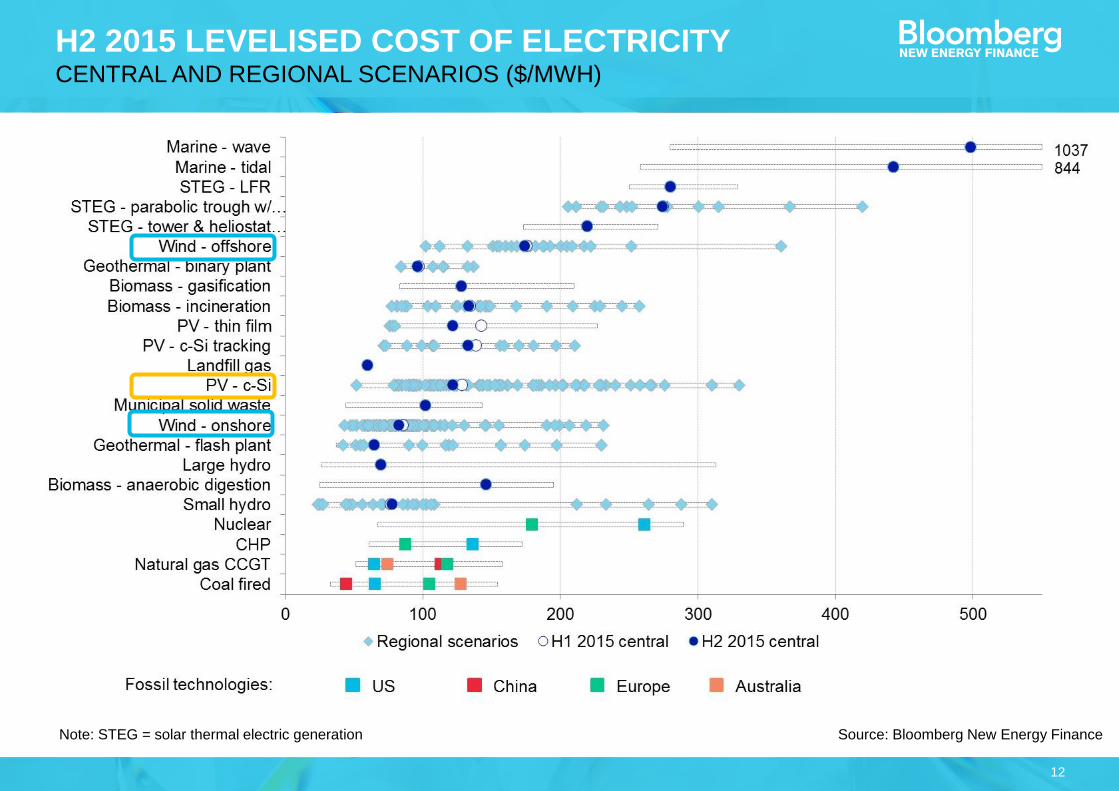
H2 2015 LEVELISED COST OF ELECTRICITYCENTRAL AND REGIONAL SCENARIOS ($/MWH)
Source: Bloomberg New Energy FinanceNote: STEG = solar thermal electric generation
13
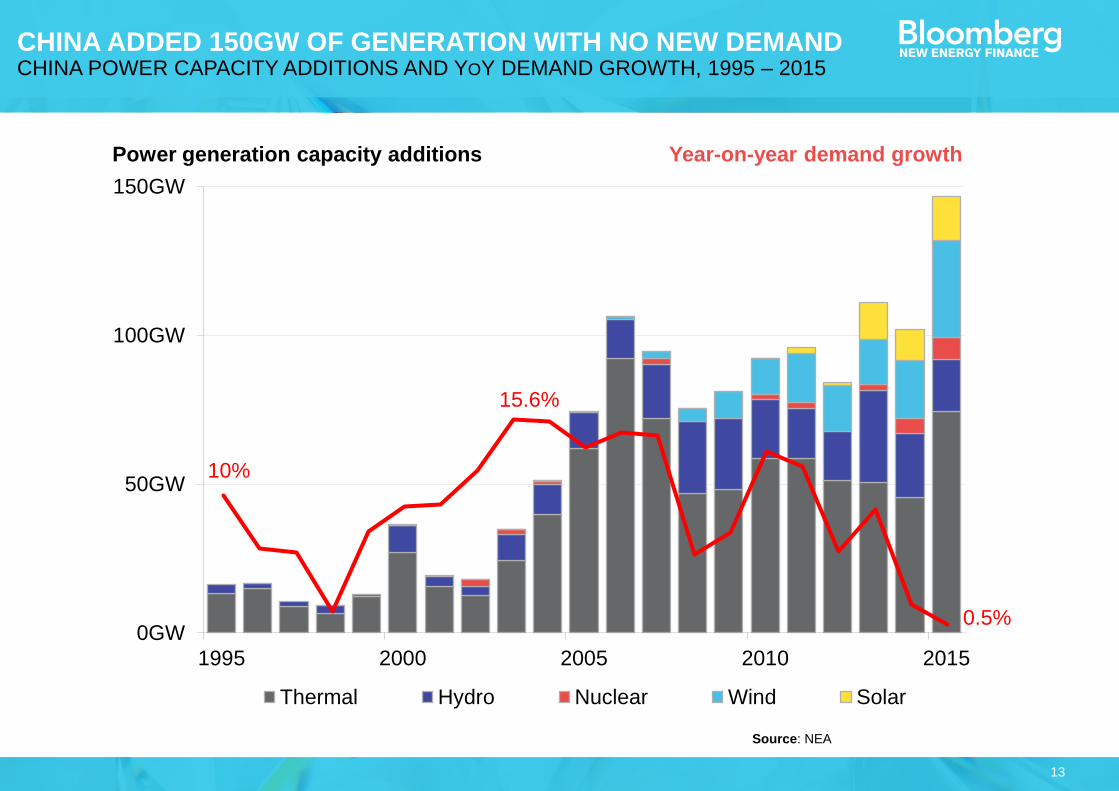
CHINA ADDED 150GW OF GENERATION WITH NO NEW DEMANDCHINA POWER CAPACITY ADDITIONS AND YOY DEMAND GROWTH, 1995 – 2015
Source: NEA
0GW
50GW
100GW
150GW
1995 2000 2005 2010 2015
Thermal Hydro Nuclear Wind Solar
10%
15.6%
0.5%
Power generation capacity additions Year-on-year demand growth
14
0%
20%
40%
60%
80%
100%
0
1,752
3,504
5,256
7,008
8,760
2008 2009 2010 2011 2012 2013 2014 2015
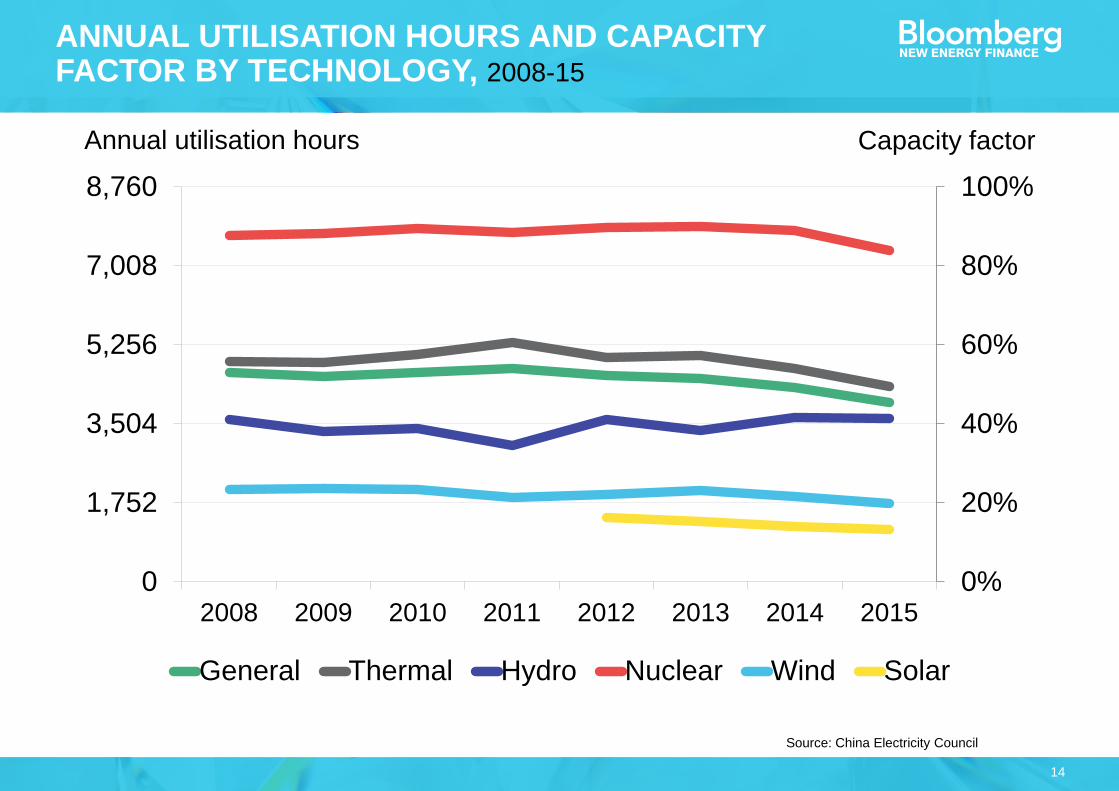
General Thermal Hydro Nuclear Wind Solar
Source: China Electricity Council
ANNUAL UTILISATION HOURS AND CAPACITY FACTOR BY TECHNOLOGY, 2008-15
Annual utilisation hours Capacity factor
15
CHALLENGES FACING RENEWABLES IN CHINA
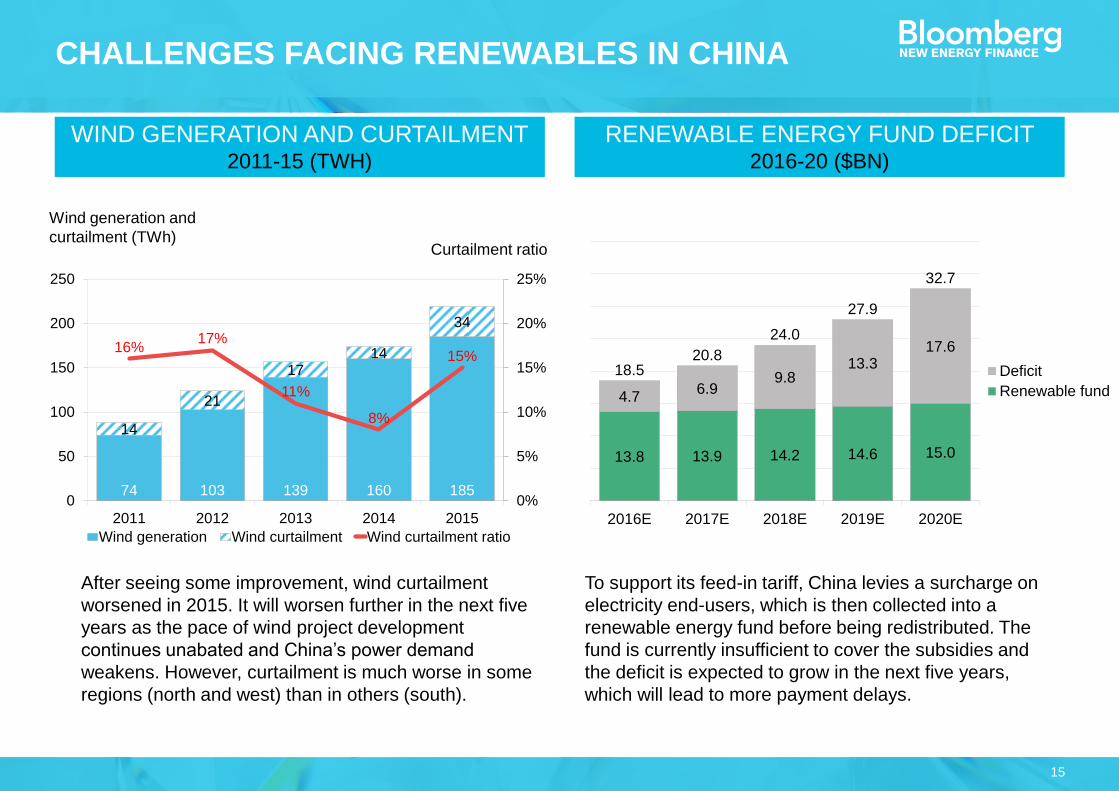
WIND GENERATION AND CURTAILMENT 2011-15 (TWH)
RENEWABLE ENERGY FUND DEFICIT 2016-20 ($BN)
74 103 139 160 185
14
21
1714
34
16%17%
11%
8%
15%
0%
5%
10%
15%
20%
25%
0
50
100
150
200
250
2011 2012 2013 2014 2015
Wind generation Wind curtailment Wind curtailment ratio
Wind generation and
curtailment (TWh)Curtailment ratio
13.8 13.9 14.2 14.6 15.0
4.76.9
9.813.3
17.6
18.520.8
24.0
27.9
32.7
2016E 2017E 2018E 2019E 2020E
Deficit
Renewable fund
To support its feed-in tariff, China levies a surcharge on
electricity end-users, which is then collected into a
renewable energy fund before being redistributed. The
fund is currently insufficient to cover the subsidies and
the deficit is expected to grow in the next five years,
which will lead to more payment delays.
After seeing some improvement, wind curtailment
worsened in 2015. It will worsen further in the next five
years as the pace of wind project development
continues unabated and China’s power demand
weakens. However, curtailment is much worse in some
regions (north and west) than in others (south).
16
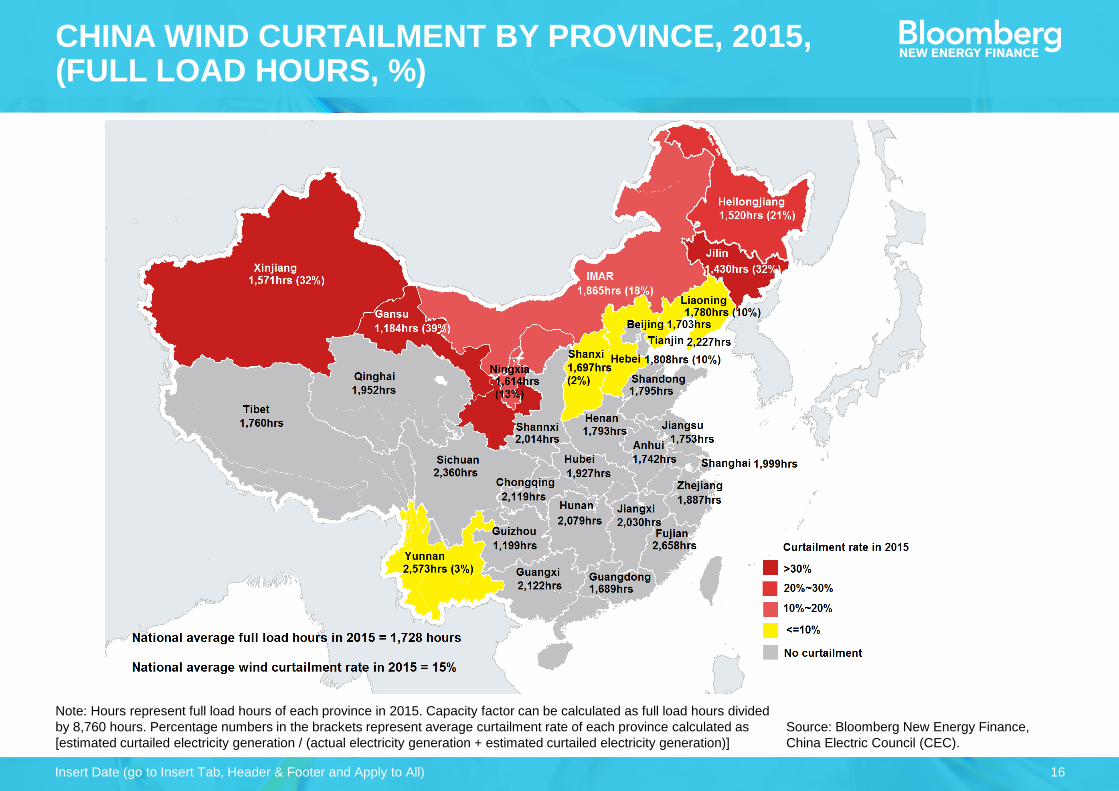
Note: Hours represent full load hours of each province in 2015. Capacity factor can be calculated as full load hours divided
by 8,760 hours. Percentage numbers in the brackets represent average curtailment rate of each province calculated as
[estimated curtailed electricity generation / (actual electricity generation + estimated curtailed electricity generation)]
Source: Bloomberg New Energy Finance,
China Electric Council (CEC).
Insert Date (go to Insert Tab, Header & Footer and Apply to All)
CHINA WIND CURTAILMENT BY PROVINCE, 2015, (FULL LOAD HOURS, %)
17
● High capital investment
● Complicated development and construction
process
● Limited types of wind farm developers and
financing model
Source: Bloomberg New Energy Finance
Insert Date (go to Insert Tab, Header & Footer and Apply to All)
KEY BARRIERS FOR COMMUNITY LEVEL INVESTOR TO ENTER WIND MARKET
18
Source: Bloomberg New Energy Finance
Insert Date (go to Insert Tab, Header & Footer and Apply to All)
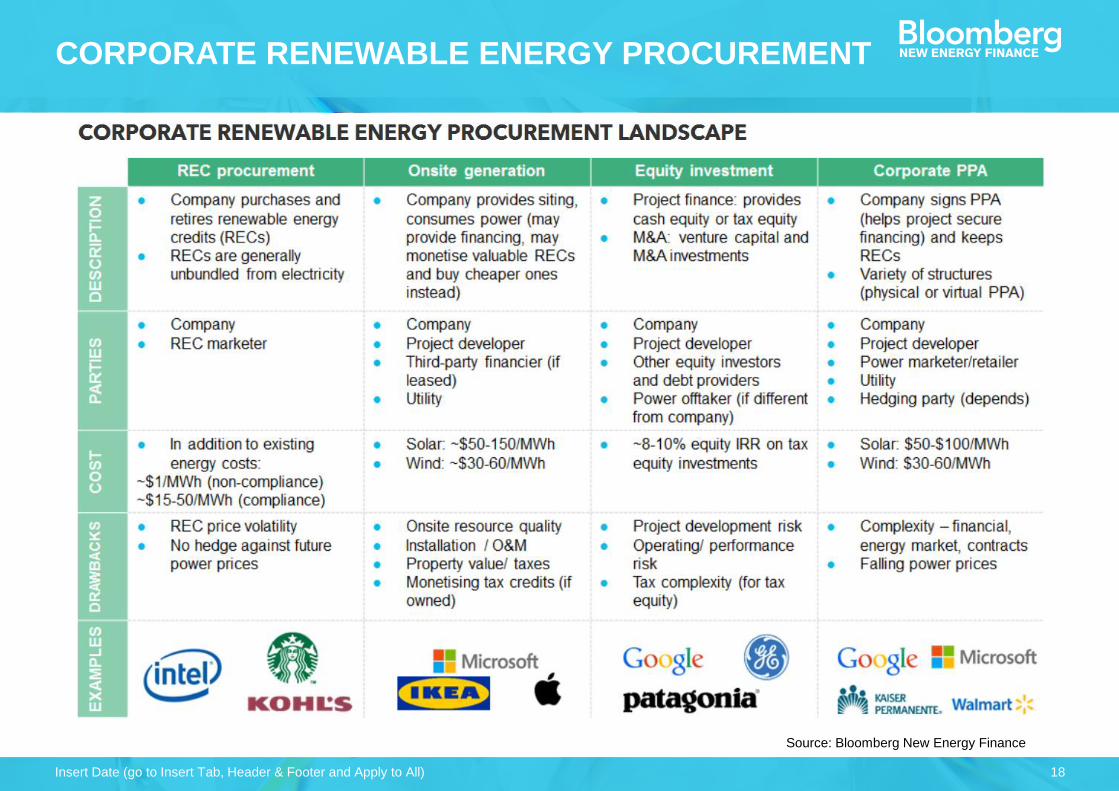
CORPORATE RENEWABLE ENERGY PROCUREMENT
19
This publication is the copyright of Bloomberg New Energy Finance. No portion of this document may be photocopied,
reproduced, scanned into an electronic system or transmitted, forwarded or distributed in any way without prior consent of
Bloomberg New Energy Finance.
The information contained in this publication is derived from carefully selected sources we believe are reasonable. We do
not guarantee its accuracy or completeness and nothing in this document shall be construed to be a representation of such
a guarantee. Any opinions expressed reflect the current judgment of the author of the relevant article or features, and does
not necessarily reflect the opinion of Bloomberg New Energy Finance, Bloomberg Finance L.P., Bloomberg L.P. or any of
their affiliates ("Bloomberg"). The opinions presented are subject to change without notice. Bloomberg accepts no
responsibility for any liability arising from use of this document or its contents. Nothing herein shall constitute or be
construed as an offering of financial instruments, or as investment advice or recommendations by Bloomberg of an
investment strategy or whether or not to "buy," "sell" or "hold" an investment.
COPYRIGHT AND DISCLAIMER
Insert Date (go to Insert Tab, Header & Footer and Apply to All)
Unique analysis, tools and data for decision-makers
driving change in the energy system
MARKETS Renewable Energy
Energy Smart Technologies
Advanced Transport
Gas
Carbon and RECs
SERVICESAmericas Service
Asia Pacific Service
EMEA Service
Applied Research
Events and Workshops
Yiyi Zhou